

Sample Category Title
Risk Sentiment Turns Sour ahead of US CPI
Euro's post ECB rally was very short-lived, while market turned into risk-off mode later in US session. Negative sentiment continues in Asia today as US consumer inflation data is awaited. So far, Sterling is the strongest one for the week followed by Dollar, and then Canadian. Yen is the overwhelming loser, extending recent down trend of extended rally in global benchmark yields. Swiss Franc is second weakest even though it rebounds against Euro.
Technically, EUR/USD's breach of 1.0626 minor support is a bearish sign. Sustained trading below this level will likely bring retest of 1.0348 low. USD/CAD's breach of 1.2685 minor resistance also suggest that Dollar is on the way up for the near term. To confirm this development, attention will be on 1.2429 minor support in GBP/USD, and 0.7034 minor support in AUD/USD.
In Asia, Nikkei closed down -1.43%. Hong Kong HSI is up 0.01%. China Shanghai SSE is up 1.11% Singapore Strait Times is down -0.84%. Japan 10-year JGB yield is up 0.0026 at 0.253. Overnight, DOW dropped -1.94%. S&P 500 dropped -2.38%. NASDAQ dropped -2.75%. 10-year yield rose 0.015 to 3.044
China PPI slowed to 14-mth low, CPI unchanged
China PPI slowed notably from 8.0% yoy to 6.4% yoy in May, below expectation of 6.5% yoy. That's also the lowest level in 14 months since March 2021. CPI was unchanged at 2.1% yoy, below expectation of 2.5% yoy. Core CPI, excluding food and energy, was unchanged at 0.9% yoy.
"In May, the pandemic control continued to improve, with overall sufficient supplies in the consumer market, CPI has decreased compared to last month, and the year-on-year increase remained stable," said senior NBS statistician Dong Lijuan. "As a great amount of fresh vegetables entered the market and logistics gradually smooth, prices of fresh vegetables fell by 15 per cent".
DOW lost -638pts as markets await US CPI
US stocks tumbled sharp in late trading overnight, as traders turned into defense mode ahead of today's consumer inflation report. Headline CPI is expected to tick down from 8.3% yoy to 8.2% yoy in May. Core CPI is also expected to slow from 6.2% to 5.9% yoy.
Headline CPI appeared to have peaked at 8.5% yoy and core CPI at 6.5% yoy in March. Markets will look for validation that these levels were the peak. But the more important question is whether inflation is plateauing, or reversing. That is important for Fed officials to decide whether a pause in tightening is needed in September.
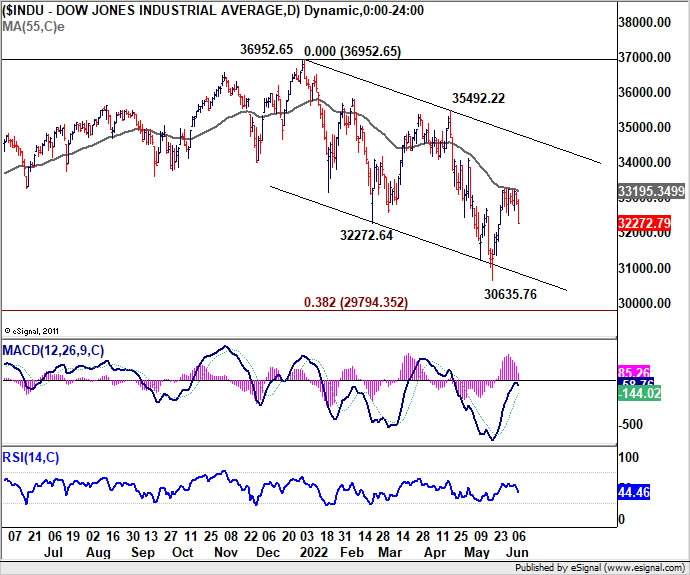
Technically, DOW's picture is not looking good with the sharp -638pts decline, which suggests rejection by the falling 55 day EMA. If there is no come back to push for a strong rebound in DOW in the next few days, it will likely extend the correction from 36952.65 through 30635.76 low before finally finding a bottom.
Elsewhere
New Zealand manufacturing sales rose 1.2% in Q1. Japan PPI slowed from 9.8% yoy to 9.1% yoy in May, below expectation of 9.8% yoy. Looking ahead, Italy industrial production is a feature in European session. Canada will release job data later in the day, together with US CPI and U of Michigan consumer sentiment.
EUR/USD Daily Outlook
Daily Pivots: (S1) 1.0561; (P) 1.0668 (R1) 1.0724; More...
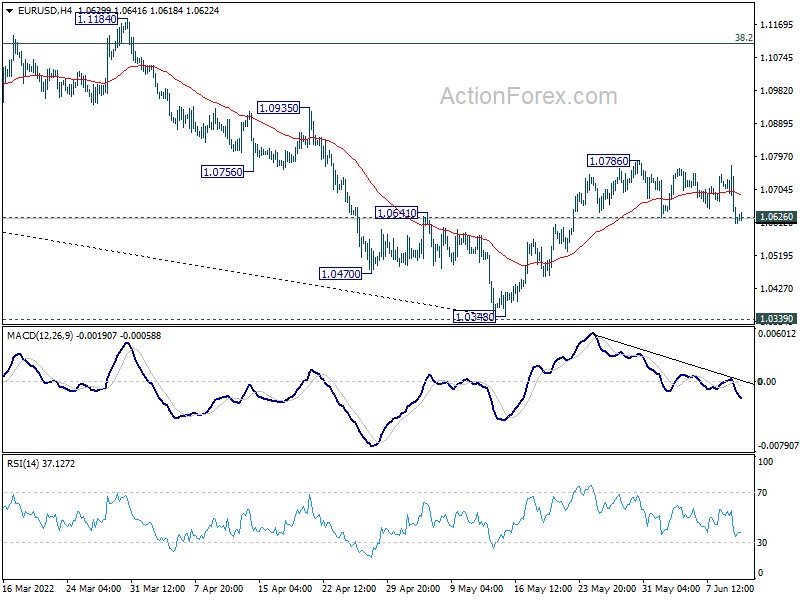
EUR/USD's breach of 1.0626 minor support argues that rebound from 1.0348 has completed at 1.0786 already, after multiple rejection by 55 day EMA. Intraday bias is back on the downside for retesting 1.0348 low, and more importantly 1.0339 long term support. On the upside, though, break of 1.0786 will resume the rebound from 1.0348 to 1.1112 fibonacci resistance.
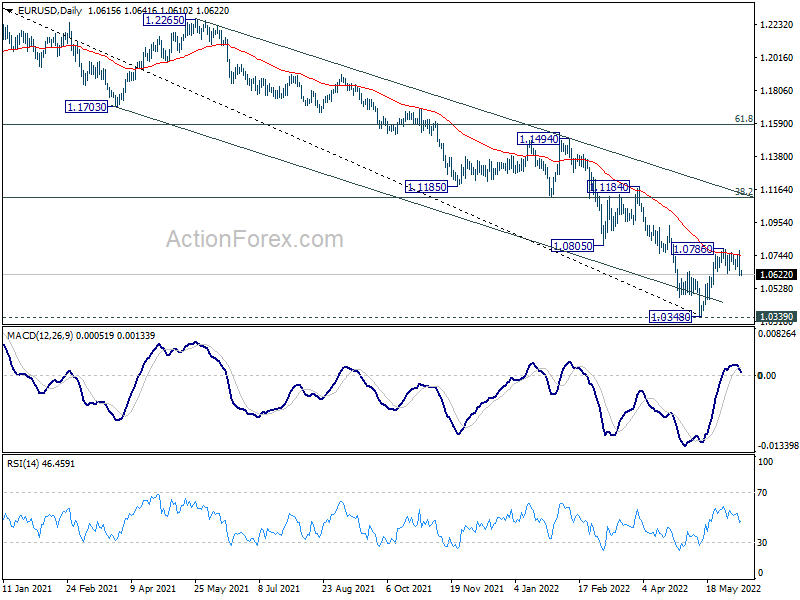
In the bigger picture, focus stays on 1.0339 long term support (2017 low). Decisive break there will resume whole down trend from 1.6039 (2008 high). Next target is 61.8% projection of 1.3993 to 1.0339 from 1.2348 at 1.0090. However, firm break of 1.0805 support turned resistance will delay this bearish case. Rise from 1.0348 is at least a correction to the down trend from 1.2348. Stronger rebound would be seen to 38.2% retracement of 1.2348 to 1.0348 at 1.1112.
Economic Indicators Update
| GMT | Ccy | Events | Actual | Forecast | Previous | Revised |
|---|---|---|---|---|---|---|
| 22:45 | NZD | Manufacturing Sales Q1 | 1.20% | 8.20% | 11.90% | |
| 23:50 | JPY | PPI Y/Y May | 9.10% | 9.80% | 10.00% | 9.80% |
| 01:30 | CNY | CPI Y/Y May | 2.10% | 2.50% | 2.10% | |
| 01:30 | CNY | PPI Y/Y May | 6.40% | 6.50% | 8.00% | |
| 08:00 | EUR | Italy Industrial Output M/M Apr | -1.60% | 0.00% | ||
| 12:30 | CAD | Net Change in Employment May | 28.5K | 15.3K | ||
| 12:30 | CAD | Unemployment Rate May | 5.20% | 5.20% | ||
| 12:30 | USD | CPI M/M May | 0.70% | 0.30% | ||
| 12:30 | USD | CPI Y/Y May | 8.20% | 8.30% | ||
| 12:30 | USD | CPI Core M/M May | 0.50% | 0.60% | ||
| 12:30 | USD | CPI Core Y/Y May | 5.90% | 6.20% | ||
| 14:00 | USD | Michigan Consumer Sentiment Index Jun P | 56.9 | 58.4 |
DOW lost -638pts as markets await US CPI
US stocks tumbled sharp in late trading overnight, as traders turned into defense mode ahead of today's consumer inflation report. Headline CPI is expected to tick down from 8.3% yoy to 8.2% yoy in May. Core CPI is also expected to slow from 6.2% to 5.9% yoy.
Headline CPI appeared to have peaked at 8.5% yoy and core CPI at 6.5% yoy in March. Markets will look for validation that these levels were the peak. But the more important question is whether inflation is plateauing, or reversing. That is important for Fed officials to decide whether a pause in tightening is needed in September.
Technically, DOW's picture is not looking good with the sharp -638pts decline, which suggests rejection by the falling 55 day EMA. If there is no come back to push for a strong rebound in DOW in the next few days, it will likely extend the correction from 36952.65 through 30635.76 low before finally finding a bottom.
China PPI slowed to 14-mth low, CPI unchanged
China PPI slowed notably from 8.0% yoy to 6.4% yoy in May, below expectation of 6.5% yoy. That's also the lowest level in 14 months since March 2021. CPI was unchanged at 2.1% yoy, below expectation of 2.5% yoy. Core CPI, excluding food and energy, was unchanged at 0.9% yoy.
"In May, the pandemic control continued to improve, with overall sufficient supplies in the consumer market, CPI has decreased compared to last month, and the year-on-year increase remained stable," said senior NBS statistician Dong Lijuan. "As a great amount of fresh vegetables entered the market and logistics gradually smooth, prices of fresh vegetables fell by 15 per cent".
Technical Outlook and Review
DXY:
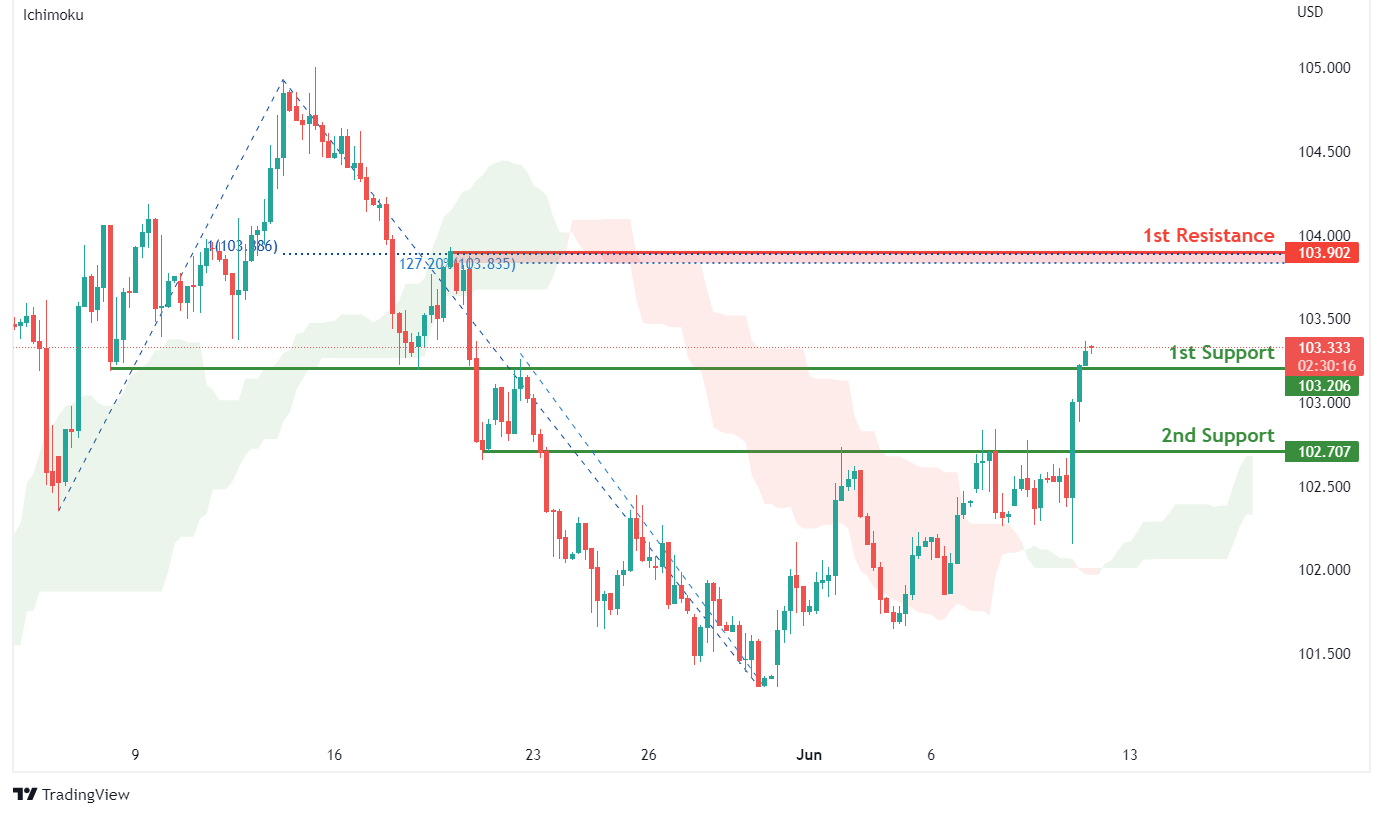
On the H4, with prices moving above the ichimoku indicator, we have a bullish bias that price will rise to our 1st resistance at 103.902 where the horizontal swing high resistance, 127.2% fibonacci extension and 100% fibonacci projection are from our 1st support at 103.206 in line with the horizontal overlap support. Alternatively, price may break 1st support structure and head for 2nd support at 102.707 where the horizontal overlap support.
Areas of consideration:
- H4 time frame, 1st resistance at 103.902
- H4 time frame, 1st support at 103.206
XAU/USD (GOLD):
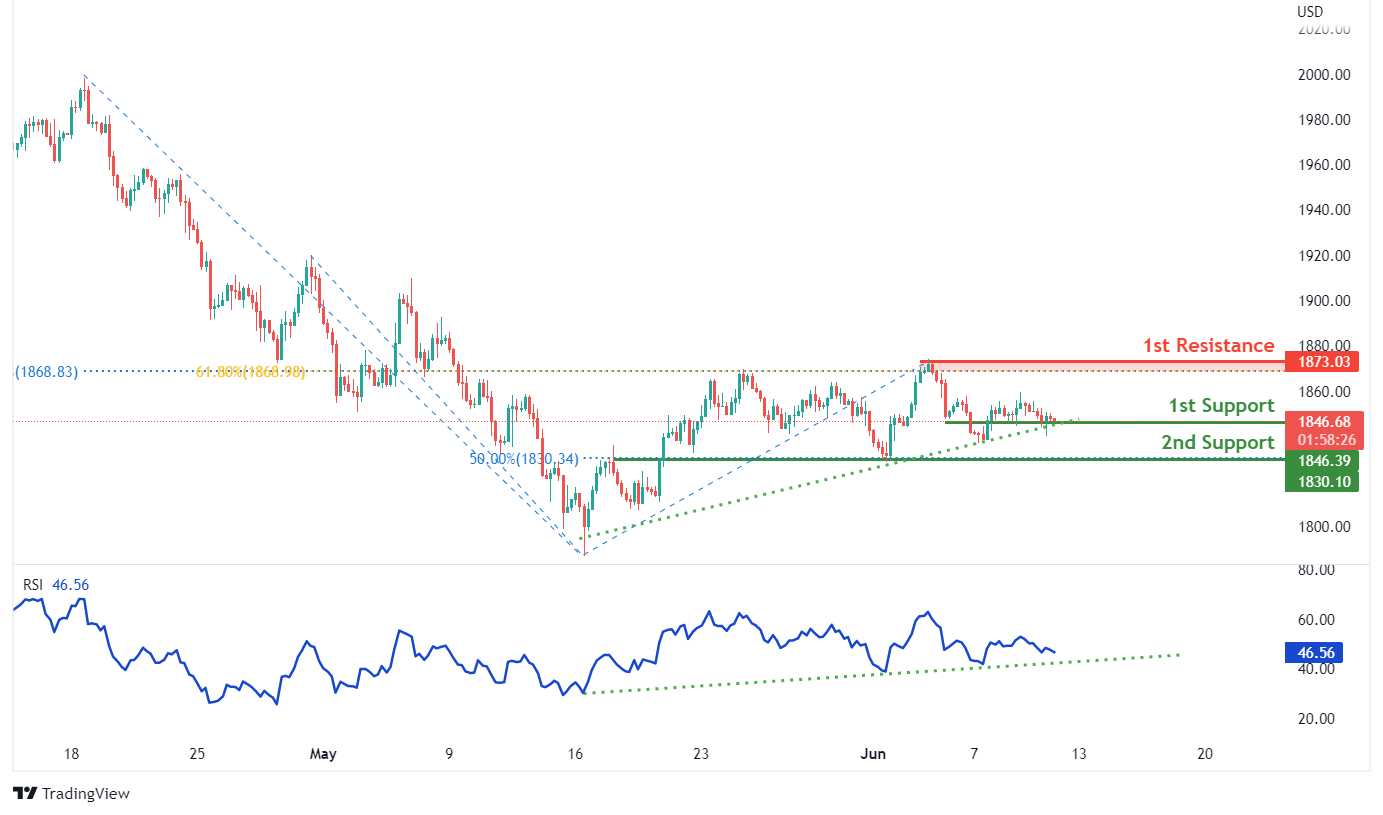
On the H4, with RSI moving along an ascending trendline, we have a bullish bias that price will rise from our 1st support at 1846.39 where the horizontal swing low support is to our 1st resistance at 1873.03 in line with swing high resistance, 61.8% fibonacci retracement and 38.2% fibonacci retracement. Alternatively, price may break 1st support structure and head for 2nd support at 1830.10 in line with overlap support and 50% fibonacci retracement.
Areas of consideration:
- H4 time frame, 1st Resistance at 1873.03
- H4 time frame, 1st Support at 1846.39
GBP/USD:
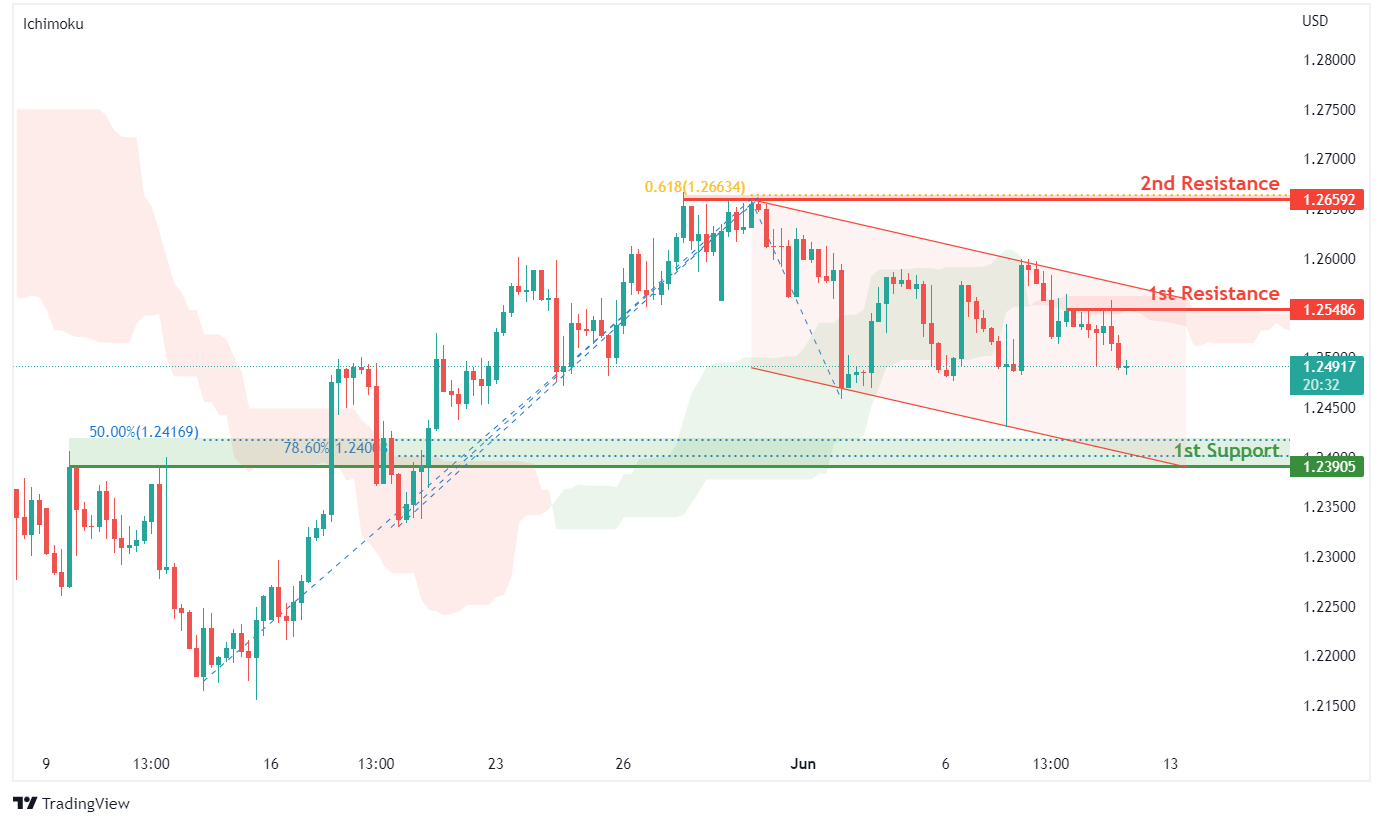
On the H4, with prices moving below the ichimoku indicator and within our descending channel, we have a bearish bias that price will drop from our 1st resistance at 1.25486 where the horizontal swing high resistance is to our 1st support at 1.23905 in line with the 50% Fibonacci retracement, 78.6% fibonacci retracement and overlap support. Alternatively, price may break 1st resistance structure and head for 2nd resistance at 1.26592 where the horizontal swing high resistance and 61.8% fibonacci projection are.
Areas of consideration:
- H4 1st resistance at 1.25486
- H4 1st support at 1.23905
USD/CHF:
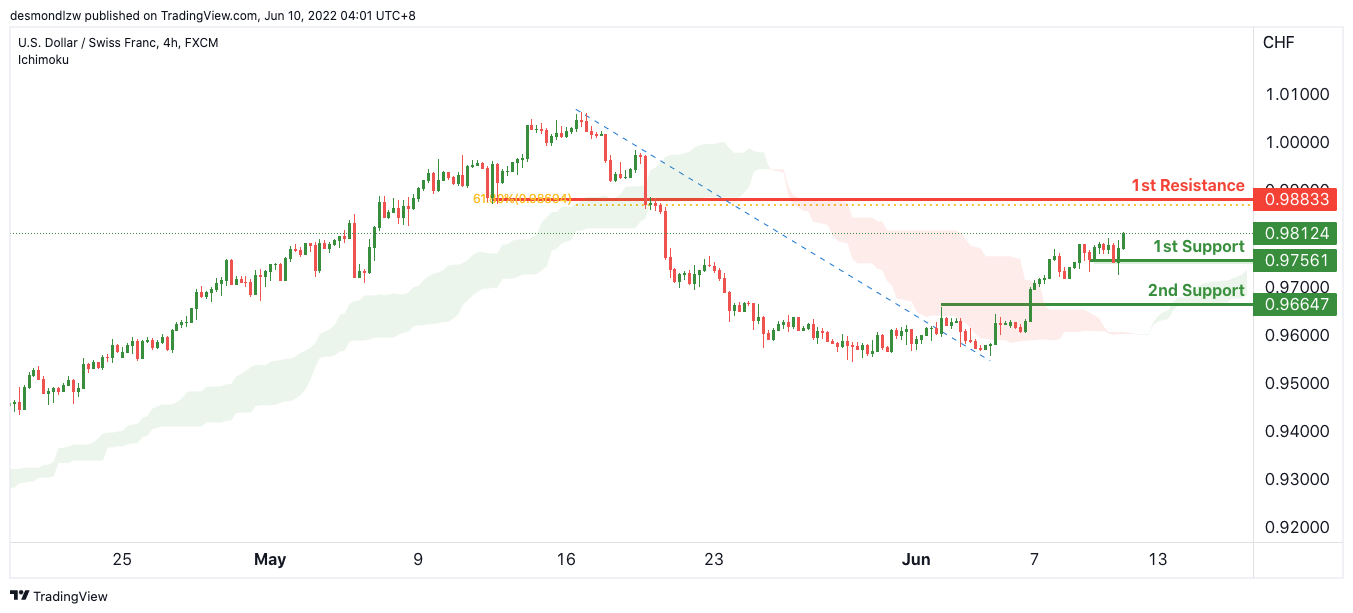
On the H4, with price moving above the ichimoku cloud, we have a bullish bias that price will rise to our 1st resistance at 0.98833 where the pullback resistance is from our 1st support at 0.97561 in line with the swing low support and 38.2% Fibonacci retracement. Alternatively, price may break 1st support structure and head for 2nd support at 0.95548 where the swing low support and 61.8% fibonacci retracement are..
Areas of consideration
- 1st support level at 0.97561
- 1st resistance level at 0.98833
EUR/USD :
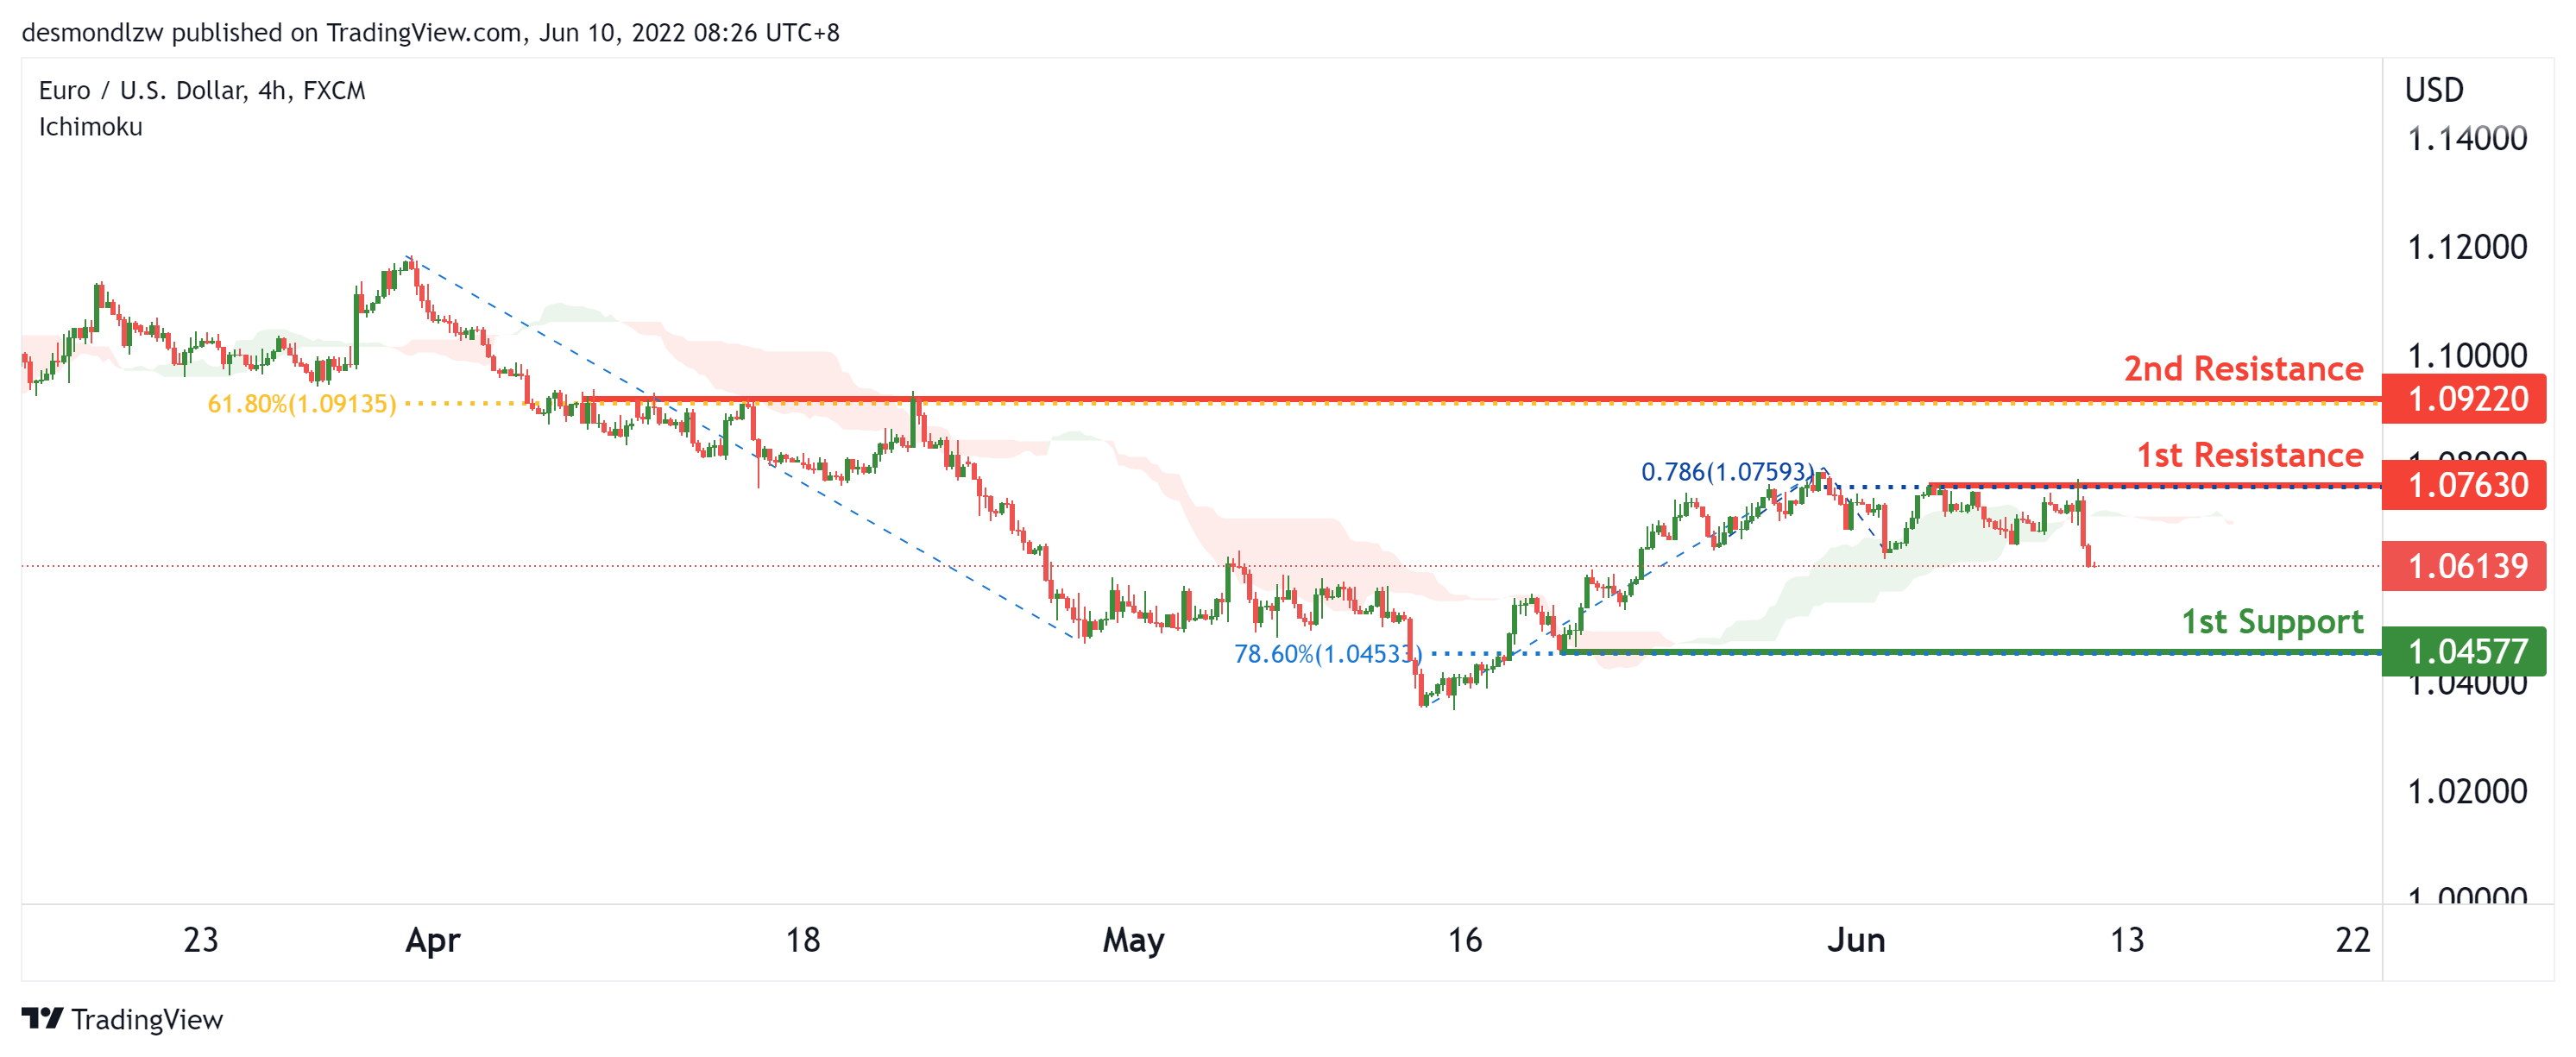
On the H4, with price moving below the ichimoku cloud, we have a bearish bias that price will drop from the 1st resistance at 1.07630 at the multiple swing highs in line with the 78.6% fibonacci projection to the 1st support at 1.04577 in line with the 78.6% fibonacci retracement and swing low. Alternatively, price may reverse off the 1st resistance and rise to the 2nd resistance at 1.09220 at the multiple swing highs in line with the 61.8% fibonacci retracement.
Areas of consideration :
- H4 1st resistance at 1.07630
- H4 1st support at 1.04577
USD/JPY:
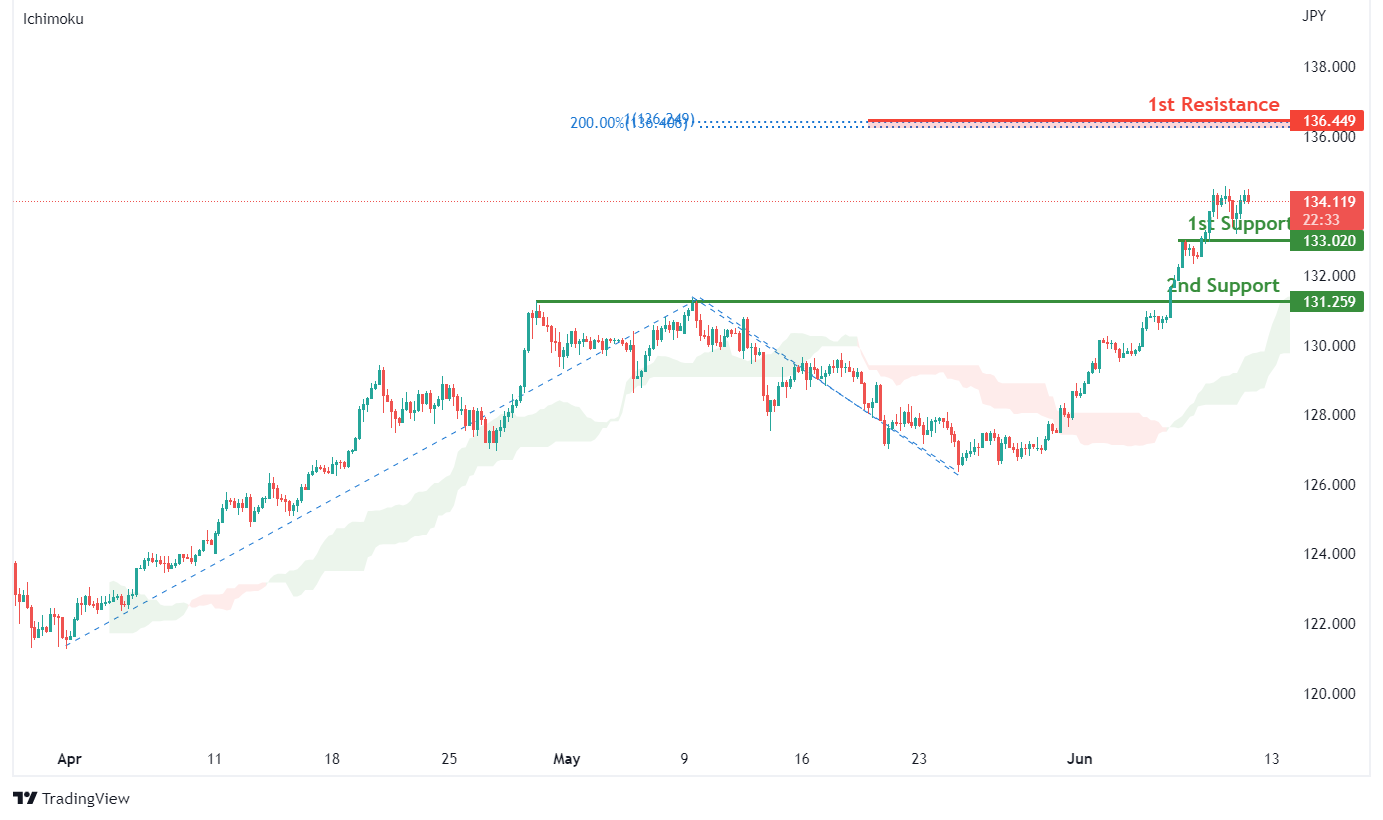
On the H4, with prices moving above the ichimoku indicator, we have a bullish bias that price will rise from our 1st support at 133.020 where the horizontal pullback support is to our 1st resistance at 136.449 in line with the 200% fibonacci extension and 100% fibonacci projection. Alternatively, price may break 1st support structure and head for 2nd support at 131.259 where the horizontal overlap support is.
Areas of consideration:
- H4 time frame, 1st resistance at 136.449
- H4 time frame, 1st support at 133.020
AUD/USD:
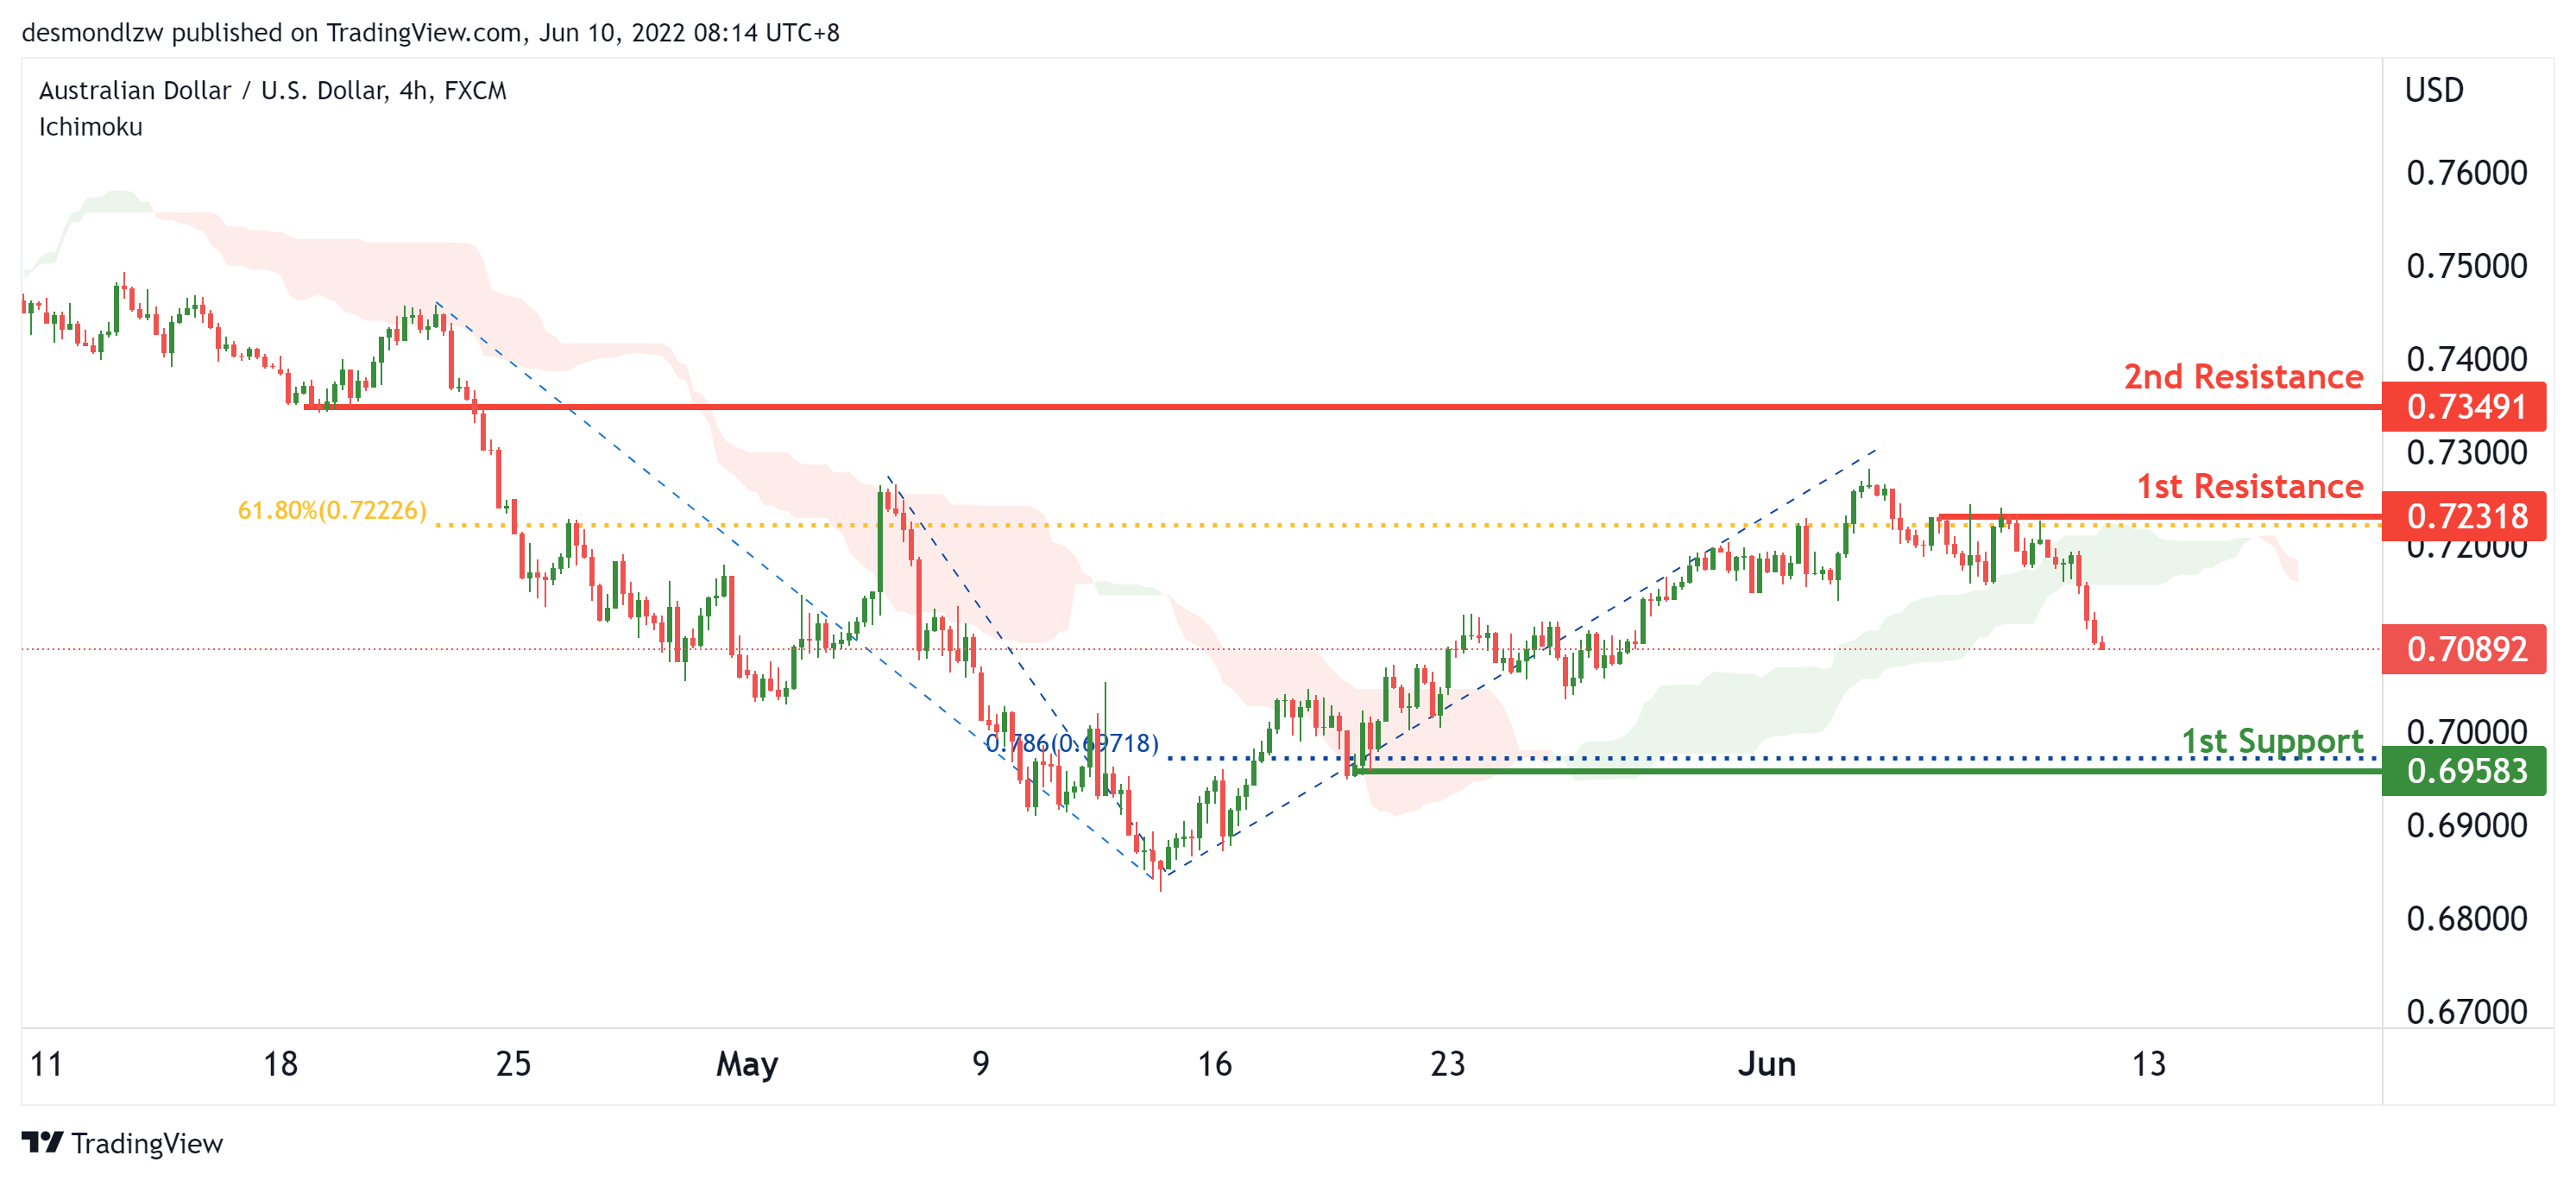
On the H4, with price moving below the ichimoku cloud, we have a bearish bias that price will drop from the 1st resistance at 0.72318 at the multiple swing highs in line with the 61.8% fibonacci retracement to the 1st support at 0.69583 at the swing low in line with the 78.6% fibonacci projection. Alternatively, price may reverse off 1st resistance and rise to the 2nd resistance at 0.74601 in line with the pullback resistance.
Areas of consideration
- H4 1st resistance at 0.72318
- H4 1st support at 0.69583
NZD/USD:
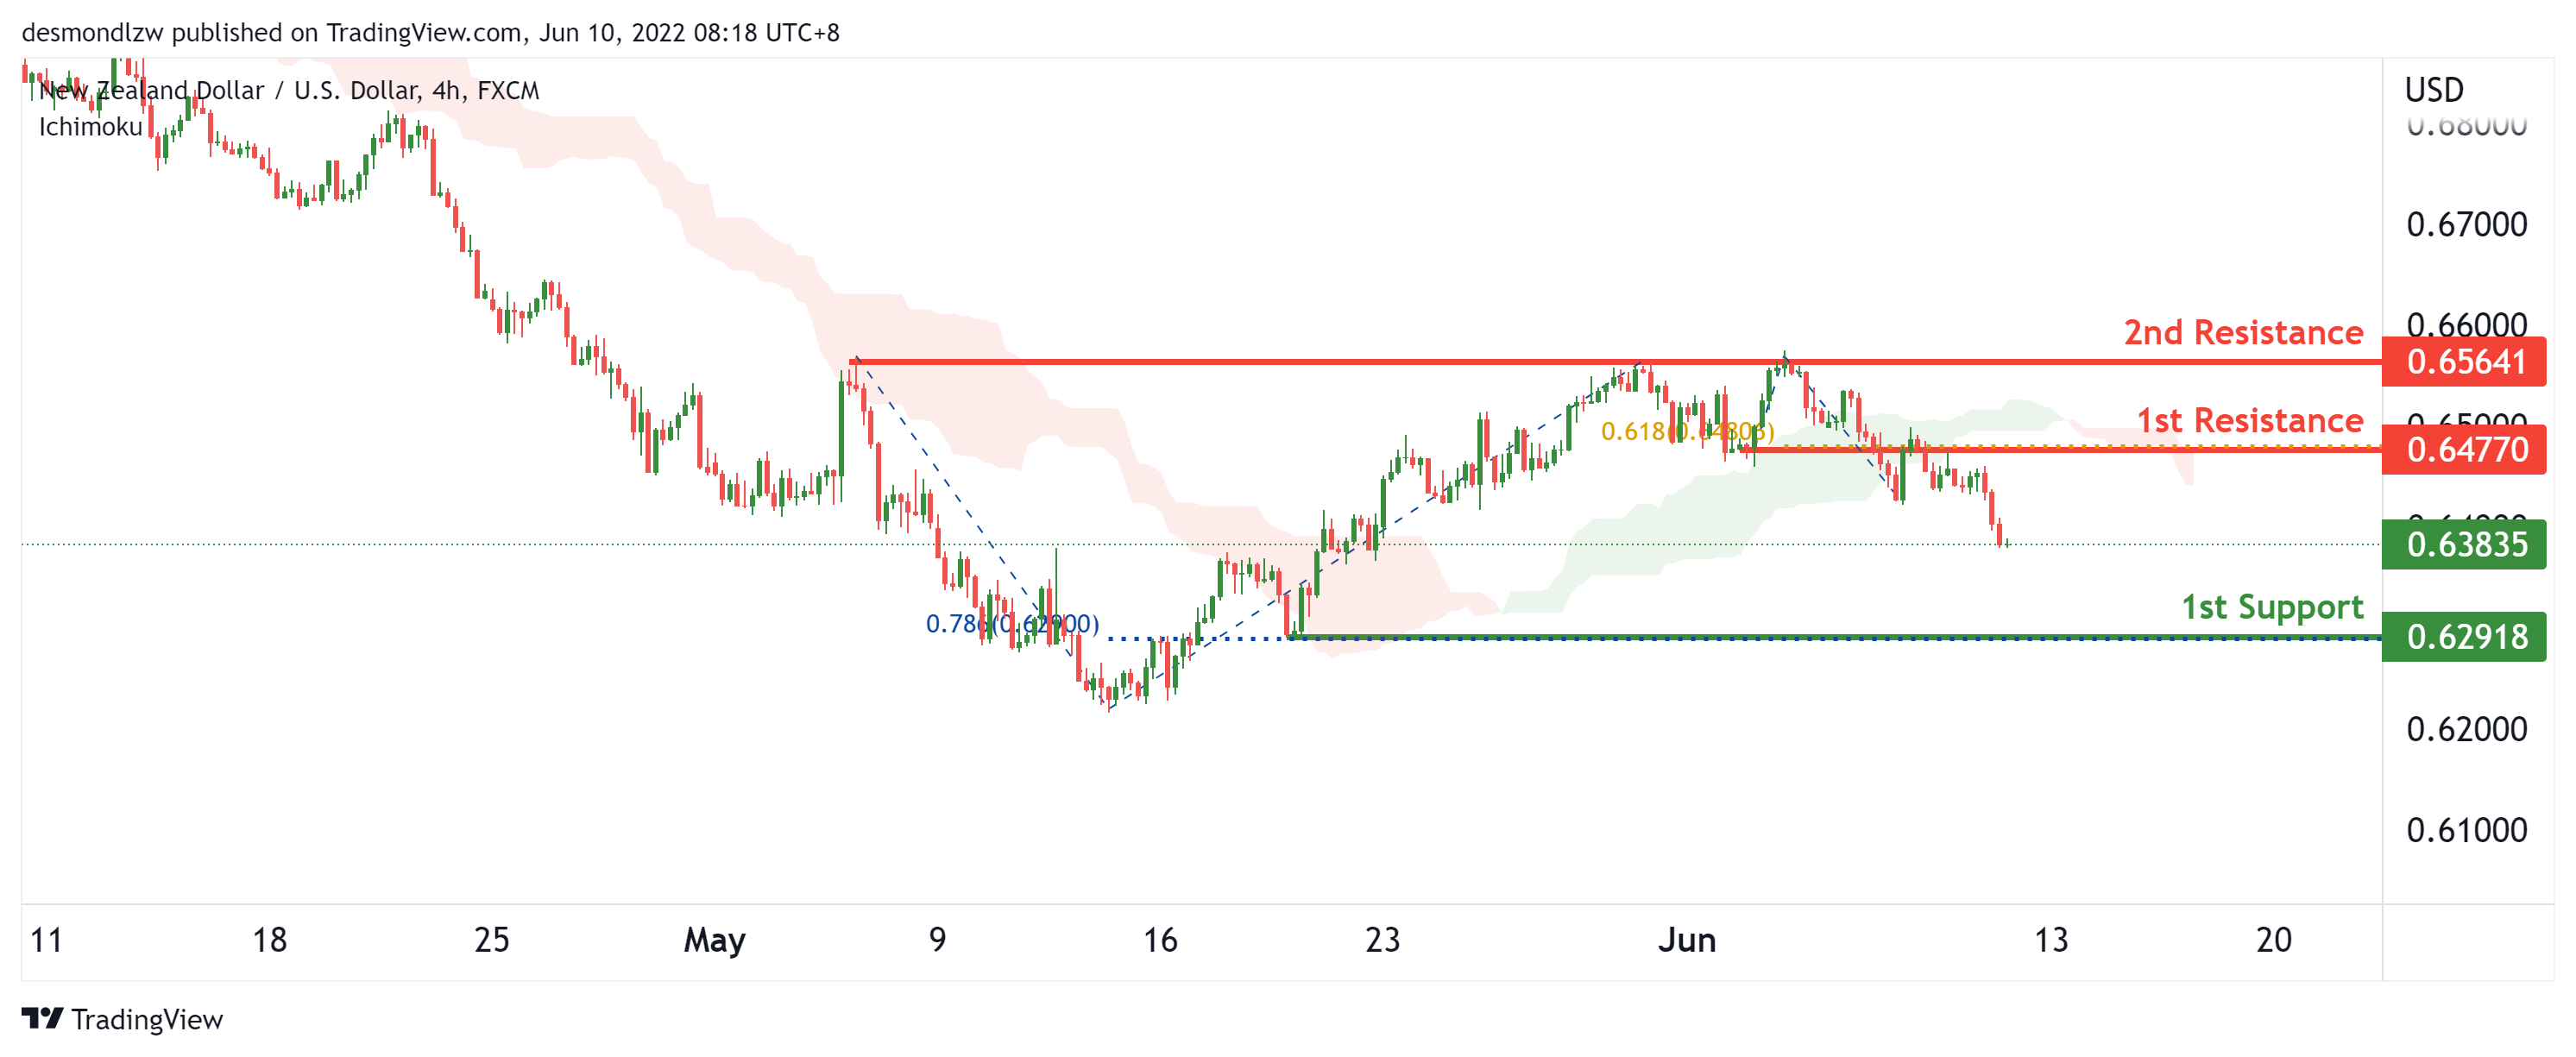
On the H4, with price moving below the ichimoku cloud, we have a bearish bias that price will drop from the 1st resistance at 0.64770 in line with the 61.8% fibonacci projection to the 1st support at 0.62918 in line with the 78.6% fibonacci retracement. Alternatively, price may bounce off the 1st resistance and rise to the 2nd resistance at 0.65641 in line with the multiple swing highs.
Areas of consideration:
- H4 time frame, 1st support at 0.62918
- H4 time frame, 1st resistance at 0.64770
USD/CAD:
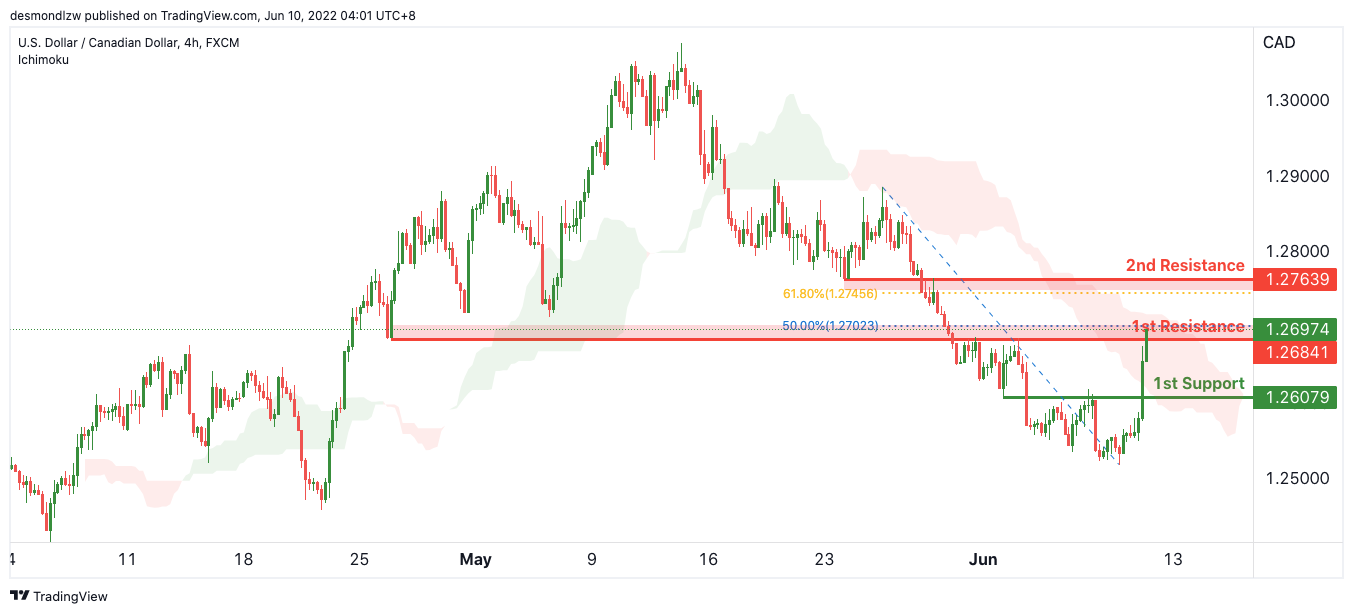
On the H4, with price expected to reverse off the ichimoku cloud resistance, we have a bearish bias that price will drop to our 1st support at 1.26079 in line with the horizontal pullback support from our 1st resistance at 1.26841 where the pullback resistance, 50% fibonacci retracement are. Alternatively, price may break structure and head for our 2nd resistance at 1.27639 in line with overlap resistance and 61.8% fibonacci retracement.
Areas of consideration:
- H4 time frame, 1st resistance at 1.26841
- H4 time frame, 1st support at 1.2607
OIL:
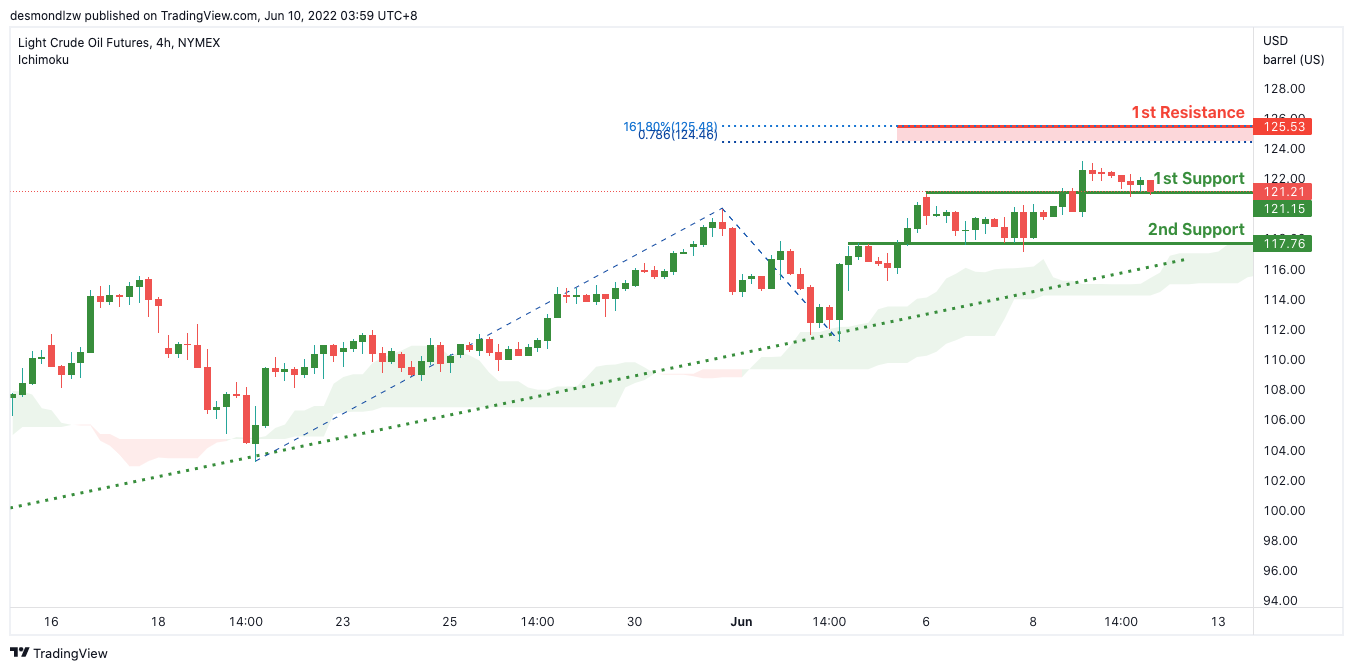
On the H4, with price moving above the ichimoku cloud, we have a bullish bias that price will rise from our 1st support at 121.15 where the horizontal pullback support is to our 1st resistance at 125.53 in line with the 78.6% fibonacci projection and 161.8% Fibonacci extension. Alternatively, price may break structure and head for 2nd support at 117.76.
Areas of consideration:
- H4 time frame, 1st resistance of 125.53
- H4 time frame, 1st support of 121.15
Dow Jones Industrial Average:
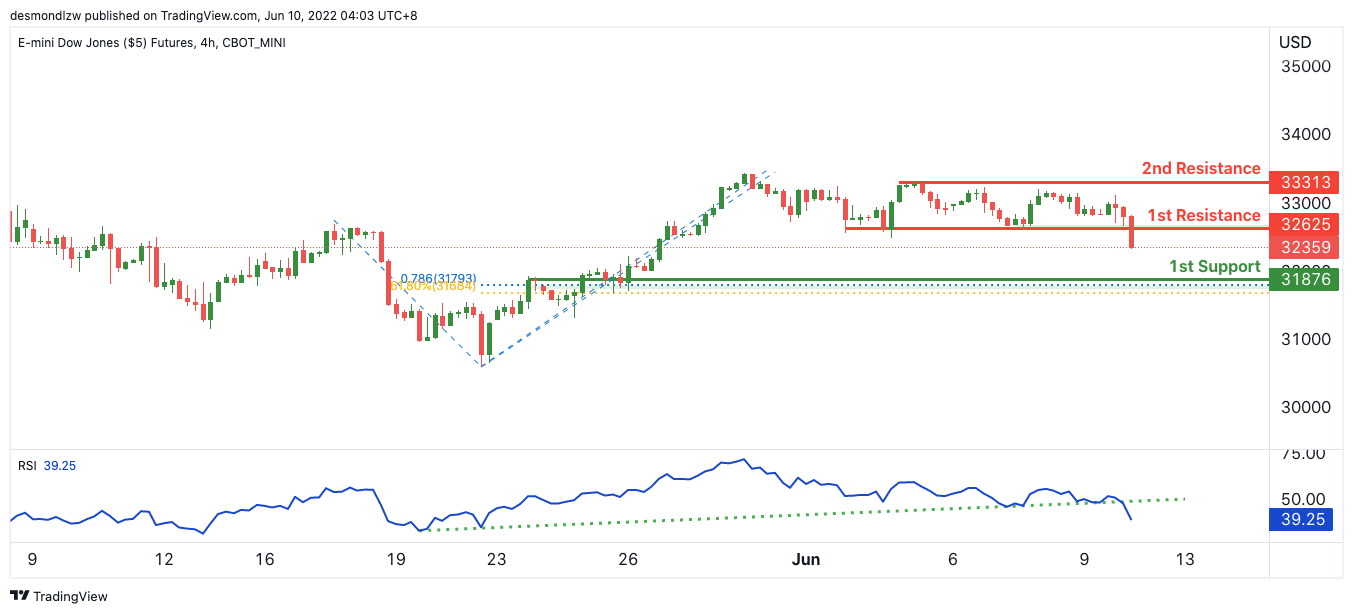
On the H4, with price breaking the ascending trend line on the RSI, we have a bearish bias that price will drop to our 1st support at 31876 in line with the horizontal pullback support and the 76.8% Fibonacci retracement and 61.8% Fibonacci projection from our 1st resistance at 32625 where the pullback resistance is. Alternatively, price may break structure and head for our 2nd resistance at 33313 in line with the horizontal swing high resistance.
Areas of consideration :
- H4 time frame, 1st resistance at 32625
- H4 time frame, 1st support at 31876
Cliff Notes: 50bp Hikes Signal Global Central Bank Determination to Contain Inflation
Key insights from the week that was.
The RBA and ECB were the focus for market participants this week. Both made a stand against inflation and associated risks consistent with their individual circumstances.
The 50bp hike delivered by the RBA in June was twice the market’s expectation of 25bps. It signals greater concern over the inflation outlook which the statement suggests is based on both external (global supply concerns and energy prices) and domestic pressures (the historically-tight labour market and other supply restrictions). The breadth and scale of these pressures warrants further decisive action by the RBA in coming months to highlight their determination to remove inflation risks.
As a result, we now look for an additional 50bp hike in July followed by a 25bp increase in August after the next CPI report and another 50bps split over the November and December meetings, taking the cash rate to 2.10% at year end. One final 25bp hike is anticipated to be delivered at the February 2023 meeting to leave the cash rate at 2.35% at peak, a level we believe to be materially above neutral given households’ high debt levels.
A full view of the outlook for the RBA and the risks was provided by Chief Economist Bill Evans in this week’s video update. Detail on our revised inflation view was also released. On the latter, the startling surge in domestic energy prices being seen currently in Australia leads us to believe that headline CPI inflation will now peak at 6.6%yr at end-2022 and only slowly decline to the top of the target range through 2023. Annual trimmed mean inflation is expected to peak at 4.8%yr in the second half of 2022, but also come back to around 3.0%yr through 2023.
The circumstances being experienced by the Euro Area and the ECB are very different to those Australia faces. Of particular note for Europe: growth is at risk of stalling for an extended period; considerable slack remains outside their labour market; and, of course, Russia’s invasion of Ukraine is creating immense uncertainty for the region. Nonetheless, the ECB finds itself needing to fight against historic inflation pressures and risks.
The ECB’s revised profile for inflation makes clear the scale of the threat, headline inflation now forecast to end 2022 at 6.8%yr (prev 5.1%yr), 2023 circa 3.5%yr (prev 2.1%yr) and 2024 2.1%yr (prev 1.9%yr). President Lagarde was clear in the press conference that the above view of inflation requires decisive action, starting with a 25bp increase in July. However, the underlying interest rate assumption for their June forecasts, average short-term interest rates of “0.0% in 2022” and “1.3% in 2023”, makes clear that the July decision is just the start of Europe’s policy normalisation.
Beginning with the September decision, in her prepared remarks President Lagarde stated that if “the medium-term inflation outlook persists or deteriorates, a larger increment [than 25bps] will be appropriate at our September meeting”. In the Q&A, she clarified this position, outlining that if inflation is seen “at 2.1% in 2024 or beyond” then “yes”, “the increment adjustment will be higher”.
What is also important to recognise is that these early rate hikes do not only apply to the deposit rate, “the key ECB interest rates – the three of them” will all be raised. Later in the press conference, President Lagarde mentioned that “keep[ing] those spreads or return[ing] to a better symmetry between those three [rates]” was still to be debated for hikes beyond September.
Given the Council’s concern over inflation to end-2024 and belief in the underlying strength of the economy, it seems most probable that July’s 25bp hike will be followed by a 50bp move in September, taking the refi rate to 0.75%. Assuming that risks to growth subside between now and November, another 50bp hike at that meeting seems consistent with their focus of making sure medium-term inflation is at or below 2.0%yr. Another 25bps in December would bring the refi rate to 1.50%, the mid-point of the neutral range of 1.0-2.0% previously cited (but still being debated), and be a clean end to the tightening cycle.
Our more bearish view on growth in 2022 and 2023 2023 (2.1% and 1.5% respectively versus the ECB’s 2.8% and 2.1%) makes clear the risks to this course of action. Further, history suggests that, when rates rise in Europe, often there are consequences for credit availability and spreads. If our view of growth and/or the concerns we have over credit prove more accurate than the ECB’s over the coming half year, some of the above rate hikes could be delayed and/ or jettisoned.
One final point on China before concluding for the week. We remain more optimistic on the rebound from the recent COVID-zero lockdowns. This week’s May trade balance gave us more reason to be so. From 1.9%yr in April, annual export growth rebounded to 15.3%yr in May against market expectations of a 9.2%yr result. Further, the snap back in import growth was not as strong as anticipated, from -2.0%yr in April to 2.8%yr in May. As a result, the trade balance widened from $51.1bn last month to $78.8bn, some $20bn above the consensus estimate. Clearly authorities are prioritising removing impediments to trade, particularly for exports; GDP in Q2 should therefore receive strong support from net exports, as we have long held. The real test for China’s economy will come as investment then consumption is ramped up through the remainder of the year.
Some More Thoughts on the RBA
The RBA Board decided to raise the cash rate by 50 basis points at its meeting on June 7.
The bold decision came as quite a surprise to many analysts. Even the decidedly hawkish market was priced for a more modest move.
In our latest preview on June 3, we noted that "The arguments set out above would also be consistent with a 50 basis point move. However, given that the Board actively considered 40 basis points at the May meeting we think it more likely that the 40 basis point option will be taken."
Readers will be aware that since the Board raised the cash rate by 0.25% on May 2 and the Governor indicated that 25 basis point moves would be business as usual Westpac took a different view. We argued at the time that while the guidance seemed to be consistent with a 25 basis point move in June such a decision would be the wrong policy. We argued that the right policy would be a "large" move and opted for 40 basis points.
Over the 5 weeks leading to the June 7 decision we consistently made the case for a large move in June. That was supported by the May minutes; aspects of the WPI report; the surge in hours worked in the April employment report; a sharp increase in domestic inflation and average wage inflation in the national accounts. We also pointed out that inflationary expectations, particularly amongst trade unions, had been significantly boosted in recent surveys.
Consistent with our analysis was the key observation in the Governor's statement, "Inflation… is higher than earlier expected. Global factors account for much of the increase. But domestic factors are playing a role too, with capacity constraints in some sectors and the tight labour market contributing to upward pressure on prices."
That statement clearly signals that the Bank now recognises that it has a significant challenge to contain inflation and Tuesday's decision points to it now being prepared to act decisively. That decisive action will, in particular, assist with the important objective of containing those inflationary expectations we referred to above.
For those reasons, we predicted on June 7, following the RBA announcement, that the next move in July will also be a 50 basis point increase.
That would push the cash rate to 135 basis points. Having eliminated the emergency policy settings of 2020, the next move would be to take back the 75 basis points of cuts from 1.5% to 0.75% seen in 2019 when the Bank was frustrated at the consistently low inflation prints.
A slowdown in the pace of hikes in August can be expected but a response will still be necessary to the likely strong inflation print for the June quarter with a further 25 basis point move required. With the cash rate having reached 160 basis points by August it will be prudent for the Bank to pause. Our analysis of the leverage in household balance sheets points to a cash rate of around 160 basis points being "in the neighbourhood" of neutral – better to pause at that point to assess the impact on household consumption; house prices; the labour market; consumer and business confidence; and the response of wages growth to these inflation pressures.
In the Governor's statement he highlighted the uncertainties around these issues indicating to us that they such thinking would at least justify a pause.
The Board has pointed to other central banks wanting to quickly return to neutral. A total of 150 basis points in only three months (May to August) by the RBA is a very solid pace even compared to the FOMC; the BOC; and the RBNZ.
This is partly because the RBA meets more frequently than those central banks. The RBA meets eleven times per year compared to FOMC and BOC at eight times and RBNZ at seven times.
RBNZ has taken nine months to raise the OCR by 175 basis points; we expect that the FOMC will take four months to increase the federal funds rate by 175 basis points; and the BOC has taken three months to move by 125 basis points.
After that pause we expect further increases of 25 basis points will be required in November and December in response to another disturbing inflation print for the September quarter. That would see 200 basis points of rate increases in seven months for the RBA.
Even with the expected pause in September/October the RBA would have taken seven months to tighten by 200 basis points; we expect the FOMC will take nine months to tighten by 250 basis points.
2022 would end with a cash rate of 2.1% – a policy stance that we would assess to be in the contractionary zone.
Readers will be aware that we expect that the FOMC will have paused following its December rate move (total of 250 basis points) and the RBA is likely to take some guidance from that decision. We expect that the 25 basis point increase from the RBA in February, following another high inflation report, will be the last in this tightening cycle with the terminal rate settling at 2.35%.
That terminal rate is only slightly higher than the 2.25% terminal rate we forecast following the May Board meeting, mainly because we anticipated an outsize move in June.
Even though the RBA's forecasts and our own forecasts point to a larger inflation task than expected in May the decision to front end load the hikes (we expected one hike of 40 basis points in June to be followed by 25's) will prove to be much more effective in meeting the inflation challenge by signalling clearly to economic agents that the RBA is very serious about its role in returning inflation to within the band by 2024.
Containing inflationary expectations must be the most urgent task of a central bank and front loaded moves assist in that regard.
Critical to our "on hold" view for the RBA and FOMC for the bulk of 2023 is our forecast for inflation in 2023 which relies upon a flattening of some key prices, admittedly at high absolute levels.
Our forecast slowing in inflation in Australia from 6.6% in 2022 to 3.0% in 2023 will be largely achieved by a reduction in the contribution to inflation from house building costs from 1.11 ppt's to 0.23 ppt's (a global slump in building activities); a reduction in the contribution from fuel from 1.16 ppt's to – 0.76 ppt's (supply increases and demand slowdown to see oil prices fall through 2023); a reduction in the contribution from electricity from 1.45 ppt's to 0.63 ppt's (prices still rising but at a slower pace); and a reduction in the contribution from food from 0.70 ppt's to 0.43 ppt's (improved conditions in Ukraine/domestic weather).
Readers will notice that these numbers are reliant on the fuel price forecast in particular. We are forecasting the oil price (Brent) to fall from USD110/bbl. to USD85/bbl. over the course of 2023 with a modest improvement in refinery costs. On those numbers fuel subtracts 0.76 ppt's from inflation in 2023. Without that fall, headline inflation would only fall from 6.6% to 3.8% and pose some challenges for policy.
The combined turnaround in those supply related factors is forecast to lower inflation by 4.00 ppt's. That allows some room for a boost in the pressures from the labour intensive sectors such services as wages growth (WPI) lifts to 4% to reflect the tight labour market.
Critically, an easing in inflation from the supply side and the slowdown in demand, will be sufficient for a boost in real wages in 2023 taking pressure off a damaging wage/ price spiral. Our rate profile is consistent with the revised growth forecasts we released on June 3 (which were predicated on the outsize move in June).
Growth in the June and September quarters of 2022 is expected to be resilient reflecting the ongoing opening of the economy; the release of additional funds from a continuing fall in the savings rate, and the confidence associated with a 48 year low in the unemployment rate.
But as we move into the December quarter; the cash rate moves above 1.6% and policy pivots into the contractionary zone; the near term boost to spending in the June and September quarters fades with growth momentum slowing appreciably. The December quarter will be much weaker than the earlier quarters in 2022.
We are forecasting growth in 2023 to slow from 4% in 2022 to a below trend 2% in 2023. A contraction in dwelling investment in the second half; a slump in consumer spending; a step up in the pace of falls in dwelling prices; softer business investment; prospects of a rise in the unemployment rate during the year and a marked easing in inflation will all be sufficient to signal to the RBA that, having paused after February, policy can go on hold for the remainder of the year.
The lagged effect of a lift in the cash rate from 0.1% to 2.35% in the space of only nine months will take its toll.
Oil Outlook: Bulls Continue to Dominate Oil Prices
In the past two weeks WTI’s price was on the rise and the commodity seems to be enjoying some support from its fundamentals as the price action is currently just above $120 per barrel. The supply side for the commodity, seems to remain tight and currently production levels are raised at a very slow pace. It’s characteristic that last week, in its 29th OPEC and non-OPEC ministerial meeting, members of the oil production block decided to raise production levels only by 432k barrels per day (bpd) for July, practically reaffirming their production adjustment plan. Yet we must note that supply chains for oil seem strained, while reports tend to mention that full production capacity levels are nearing for countries such as Saudi Arabia, which tends to intensify market worries for the supply side of the commodity.
On the demand side the reopening of China, given that lockdown measures are lifted, provided grounds for higher demand expectations to surface. It should be noted that China’s trade data for May tended to reinforce for the awakening of China’s manufacturing sector, given that the import growth rate accelerated beyond the market’s expectations and the trade surplus still widened substantially. A note of warning though for China, should also be mentioned as parts of the key port of Shanghai have started reimposing lockdown measures, creating worries for another strict zero COVID cases policy from China, which could have an adverse effect on the demand side of the oil market.
The situation on the ground for the US oil market on the other hand seems to allow for some doubt as there seems to be a slack. It’s characteristic that the number of active oil rigs in the US seems to have paused at the number of 574, according to a report by Baker Hughes. Also the American Petroleum Institute reported that oil reserves unexpectedly risen by 1.8 million barrels in contrast to the respective drawdown which was expected by the market. For the same period the Energy Information Administration office showed also a rise of oil inventories for the same period, this time even higher, specifically 2.025 million barrels, once again in contrast to market expectations for a 1.9 million barrels drawdown.
Technical Analysis
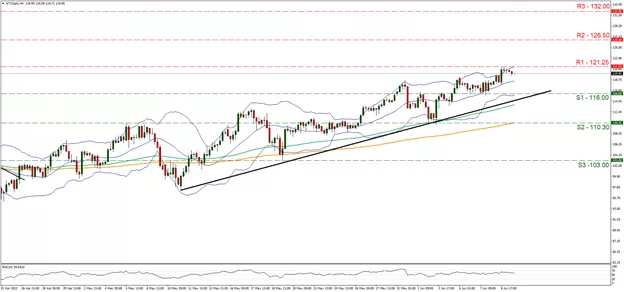
On a technical level, we note that WTI’s price was on the rise yesterday testing the 121.25 (R1) resistance line. We tend to maintain a bullish outlook for the commodity as long as it remains above the upward trendline incepted since the 11th of May. Please note though that he RSI indicator is above the reading of 50 which may also imply some bullish tendencies for the commodity yet seems to have a slight downward slope, reflecting the correction lower of the price action after hitting the 121.25 (R1) level. Also note that the price action corrected lower after breaking for a brief period the upper Bollinger band. Should the bulls maintain control over the commodity’s price, we may see it breaking the 121.25 (R1) resistance line and aim for the 126.50 (R2) resistance level, which is also a record high for WTI prices. Higher than that we have also noted the 132.00 (R3) resistance level as a possible target for the bulls should their appetite be substantial. On the flip side and should the bears take over, we may see WTI’s price reversing course, breaking the prementioned upward trendline as a sign of a changing trend, break also the 116.00 (S1) support line and aim if not breach the 110.30 (S2) support level. Even lower and as an ultimate target for the bears we note the 103.00 (S3) support barrier.
- Support: 116.00 (S1), 110.30 (S2), 103.00 (S3)
- Resistance: 121.25 (R1), 126.50 (R2), 132.00 (R3)
ECB Leaves EUR/USD Traders Disappointed
Thursday’s ECB meeting ultimately left EUR/USD trading lower as traders questioned the near-term path for euro area rates. Granted, policymakers were crystal clear of a 25-bps interest rate hike in July, but they failed to specify the size of the hike indicated for September. Based on current assessment, the ECB anticipates a gradual but sustained path of further increases post the September meeting. In addition to today’s guidance on interest rates, the ECB announced an end to asset purchases from 1 July.
What’s clear from the decision and accompanying press conference is the ECB did not feel comfortable starting its tightening cycle with a 50 bps hike. When asked why, ECB President Lagarde stated that it was good practice to start with an incremental increase that is sizeable, not excessive, and that indicates a path. That felt like central bank speak for we’d rather not raise by 50 bps unless necessary.
President Lagarde, in her press conference comments, conditioned a larger than 25 bps hike in September on 2024 inflation projects being at or higher than 2.1%. She, however, also indicated that the Governing Council did not discuss the neutral rate at this meeting but conceded that it had likely gone down. Whether that is a hint that rates won’t rise by 50bps is not clear, nor did it indicate an unwillingness for the ECB to go above the neutral rate to tame inflation if necessary.
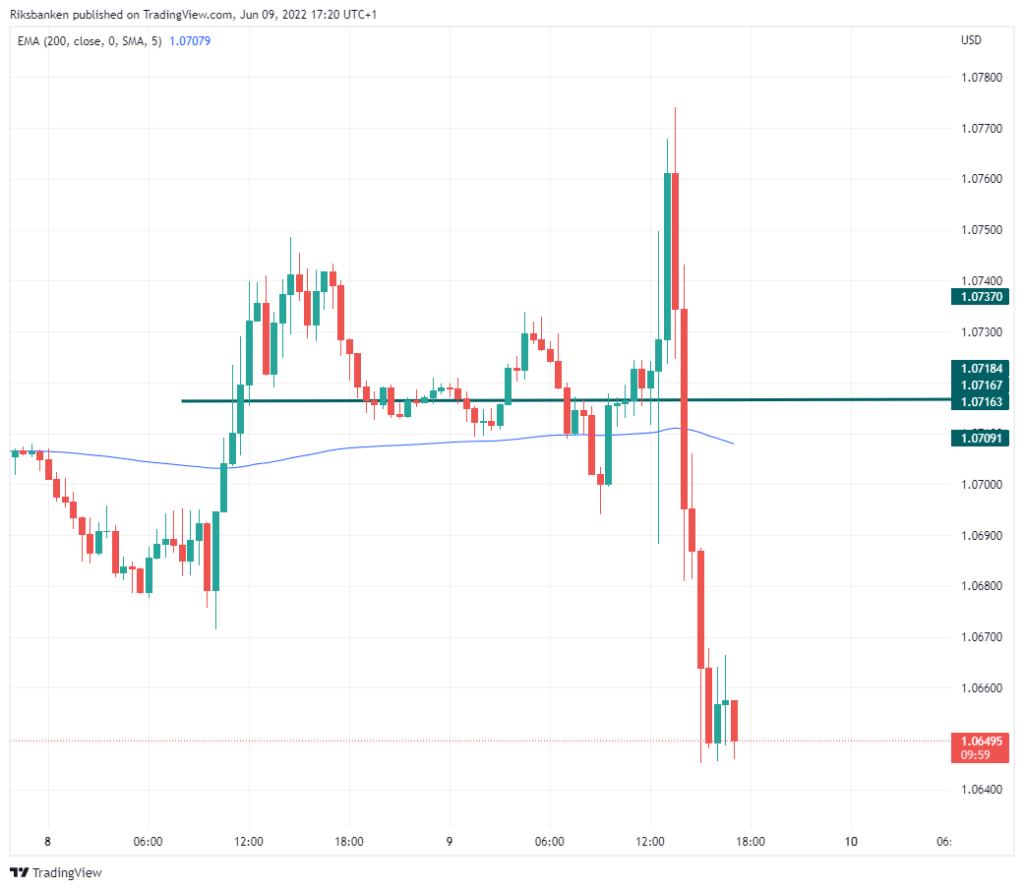
In today’s volatile markets, it’s difficult to extrapolate too much from forex market movements. But EUR/USD’s reaction to today’s announcement suggests currency traders were expecting more from the ECB in terms of the outlook for interest rates or found the downgrade to the ECB's euro area growth forecasts disconcerting. Why else would have EUR/USD ultimately fallen so sharply below its pre-decision pivot price. Looking ahead, it’s up to ECB speakers other than Lagarde to clarify the ECB’s position and potentially the EUR/USD’s direction.
ECB Review – Ready for Lift-off – Confirmed!
At today's ECB meeting today, the ECB decided to end the net purchases under the APP programme on 1 July and announce that they 'intend' to hike policy rates by 25bp in July. For September they remain data dependent, but they essentially communicated that they will have to see an improvement of the inflation dynamics in order not to hike 50bp rate hike. Beyond that a sequence of gradual hikes will follow.
As a result of ECB's guidance, we change our expectation for the size of the September rate hike to 50bp, but otherwise our call remains unchanged of 25bp in the other meetings between July this year and March 2023.
Risks are still skewed for more than one 50bp rate hikes, but with the current very uncertain outlook we expect the economic outlook will dampen the medium inflation pressure, paving the way for 'only' 25bp hike.