Sample Category Title
Daily Technical Analysis
EUR/USD
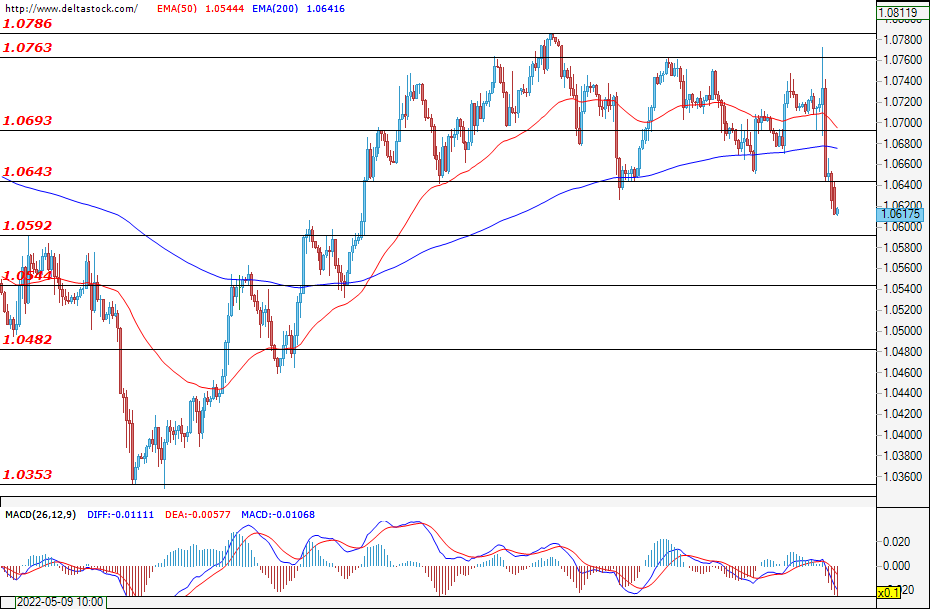
On Thursday, the session started promisingly and, from the very beginning, the euro managed to rise to the key level of 1.0765. However, this level is the upper end of the range in which the currency pair has been locked in since the end of May. Right after ECB’s decision to keep the key interest rate unchanged at 0.00%, the bears attacked without delay. Their strength was so immense that they even managed to break the lower end of the range 1.0643 and the day ended in a new weekly bottom of 1.0617. The last day of the week is important for the single European currency, because traders expect CPI data from the United States at 13:30 GMT. If expectations for the inflation rising with 0.7% are confirmed, the dollar may continue to rise and the euro to move to the next support level 1.0545. The possibility of a weak dollar and the pair returning to the mentioned levels of the range should not be ruled out.
USD/JPY
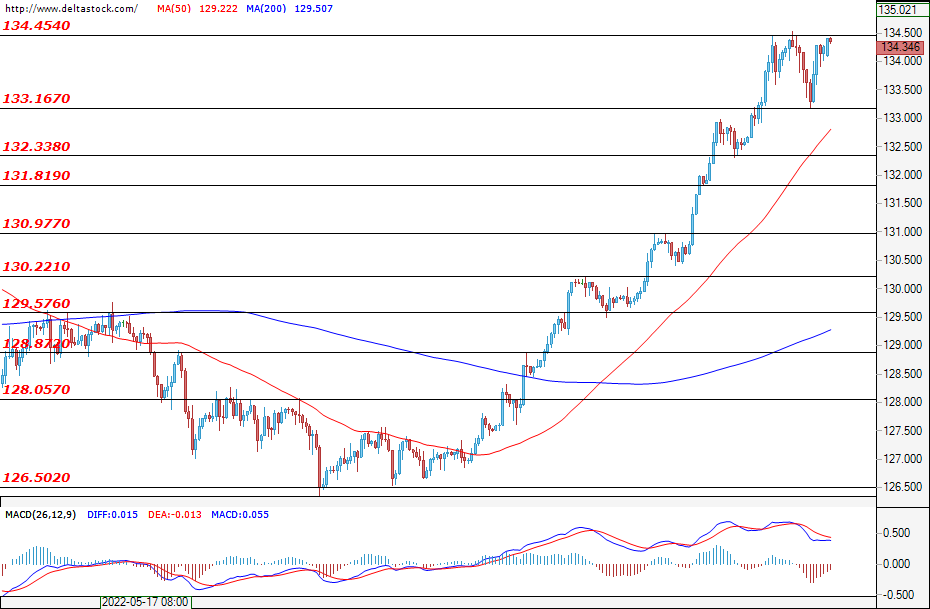
In the early hours of Thursday, the yen peaked at 134.45 and began a correction, which with the opening of the European session continued to the key level of 133.16. There, the bulls in the dollar found support again and raised the currency pair back to the mentioned peak of 134.45. Whether the growth will continue and whether we will see a new weekly peak, depends on the traders’ reaction to the U.S. inflation data at 13:30 GMT. The opposite scenario and the deepening of the correction should not be ruled out as the levels of 132.33 may be reached again, if the reaction is negative.
GBP/USD
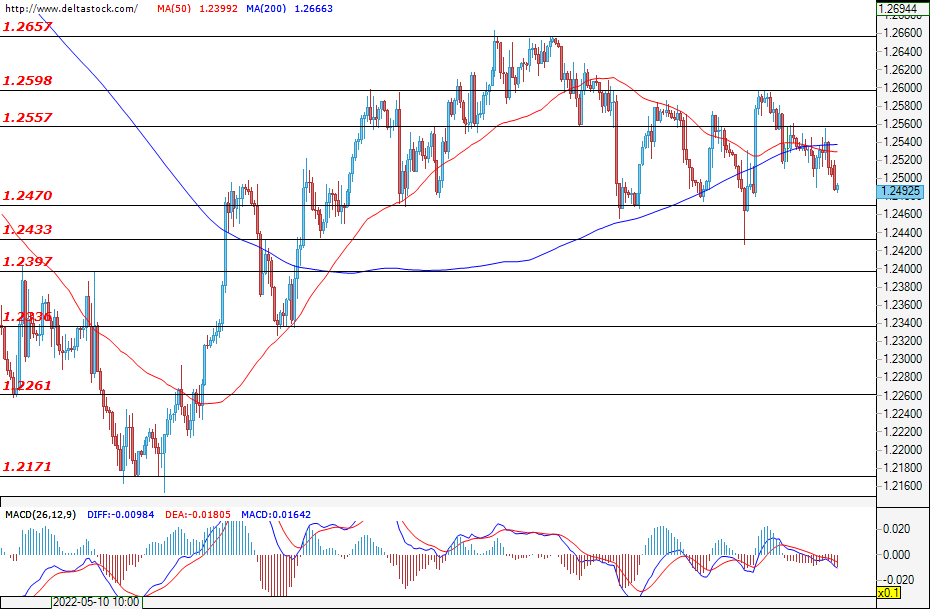
The sterling session was similar to the euro session, with an increase at the beginning of the day. The currency pair reached the support at 1.2557 and when the euro began to fall due to the rise of the dollar, the pound did not remain unaffected and headed down to the bottom of its weekly range of 1.2470. The bears’ momentum wasn’t enough to reach the support at 1.2470. Whether the growth of the dollar will continue and the bottom of the range will break, depends on whether the reaction of traders to the dollar will be positive, after the release of the U.S. CPI data at 15:30 EEST today. However, if they are disappointed, the bulls in the cable can take advantage of this and raise it to 1.2600.
EUGERMANY40
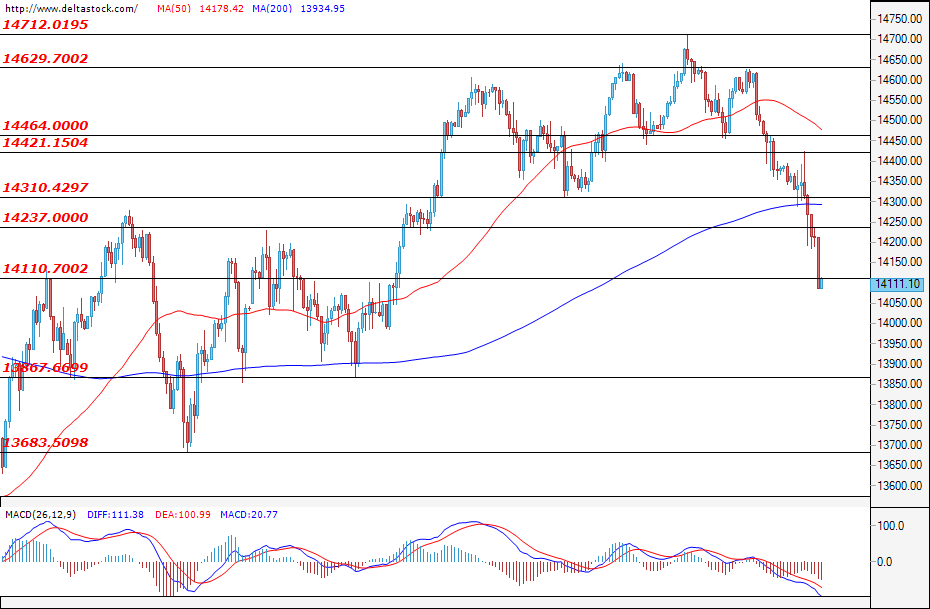
After reaching a peak of 14712 on Monday, EUGERMANY40 took a downward trend and each rise simply gives a good price for a new entry for the bears in the stock market. The session on Thursday started with a slight increase to 14420, but it was just a good price for new shorts. After ECB’s decision to keep the key interest rate unchanged, the index plunged, broke the level of 14237 and ended the day with a new bottom of 14111. This level is extremely important because it will either form a support zone, or may end the week below 14000.
US30
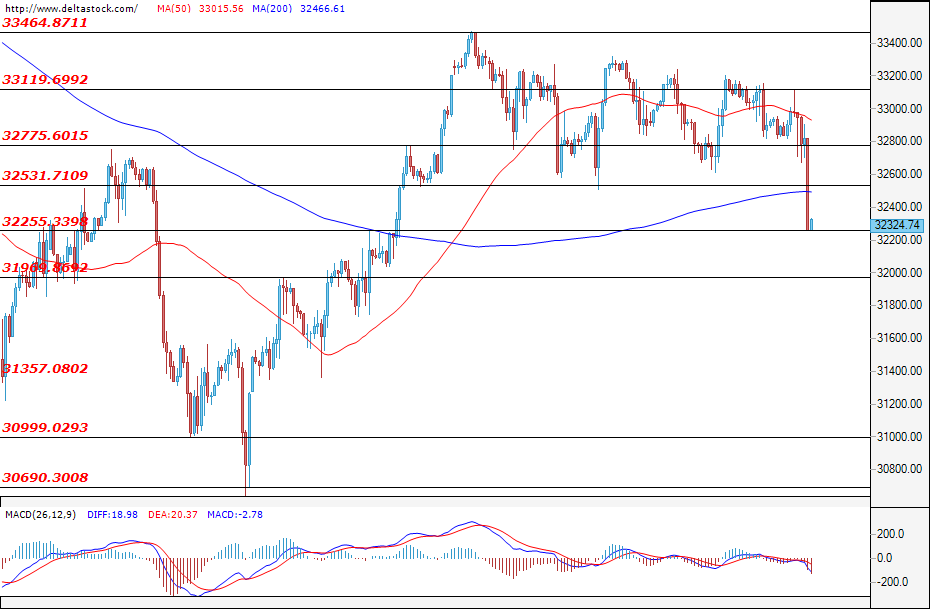
With the opening of the U.S. session on Thursday, the blue-chip index tried to bounce back to the prices it reached during the European session, namely 33120. However, the bears took complete control soon after the data regarding the unemployment claims at 13:30 GMT was worse than expected.. Тhis led to a decline in the price of the index and it broke two key levels along the way - 32775 and 32531. The day ended in red after a huge pressure and a drop of nearly $500. Whether prices around 32325 will support the index and bring it back depends on the U.S. inflation data at 15:30 EET on Friday. However, if traders accept them negatively, we may see a new weekly bottom at around 32000.
Elliott Wave View: USDCHF Shows an Impulsive Rally
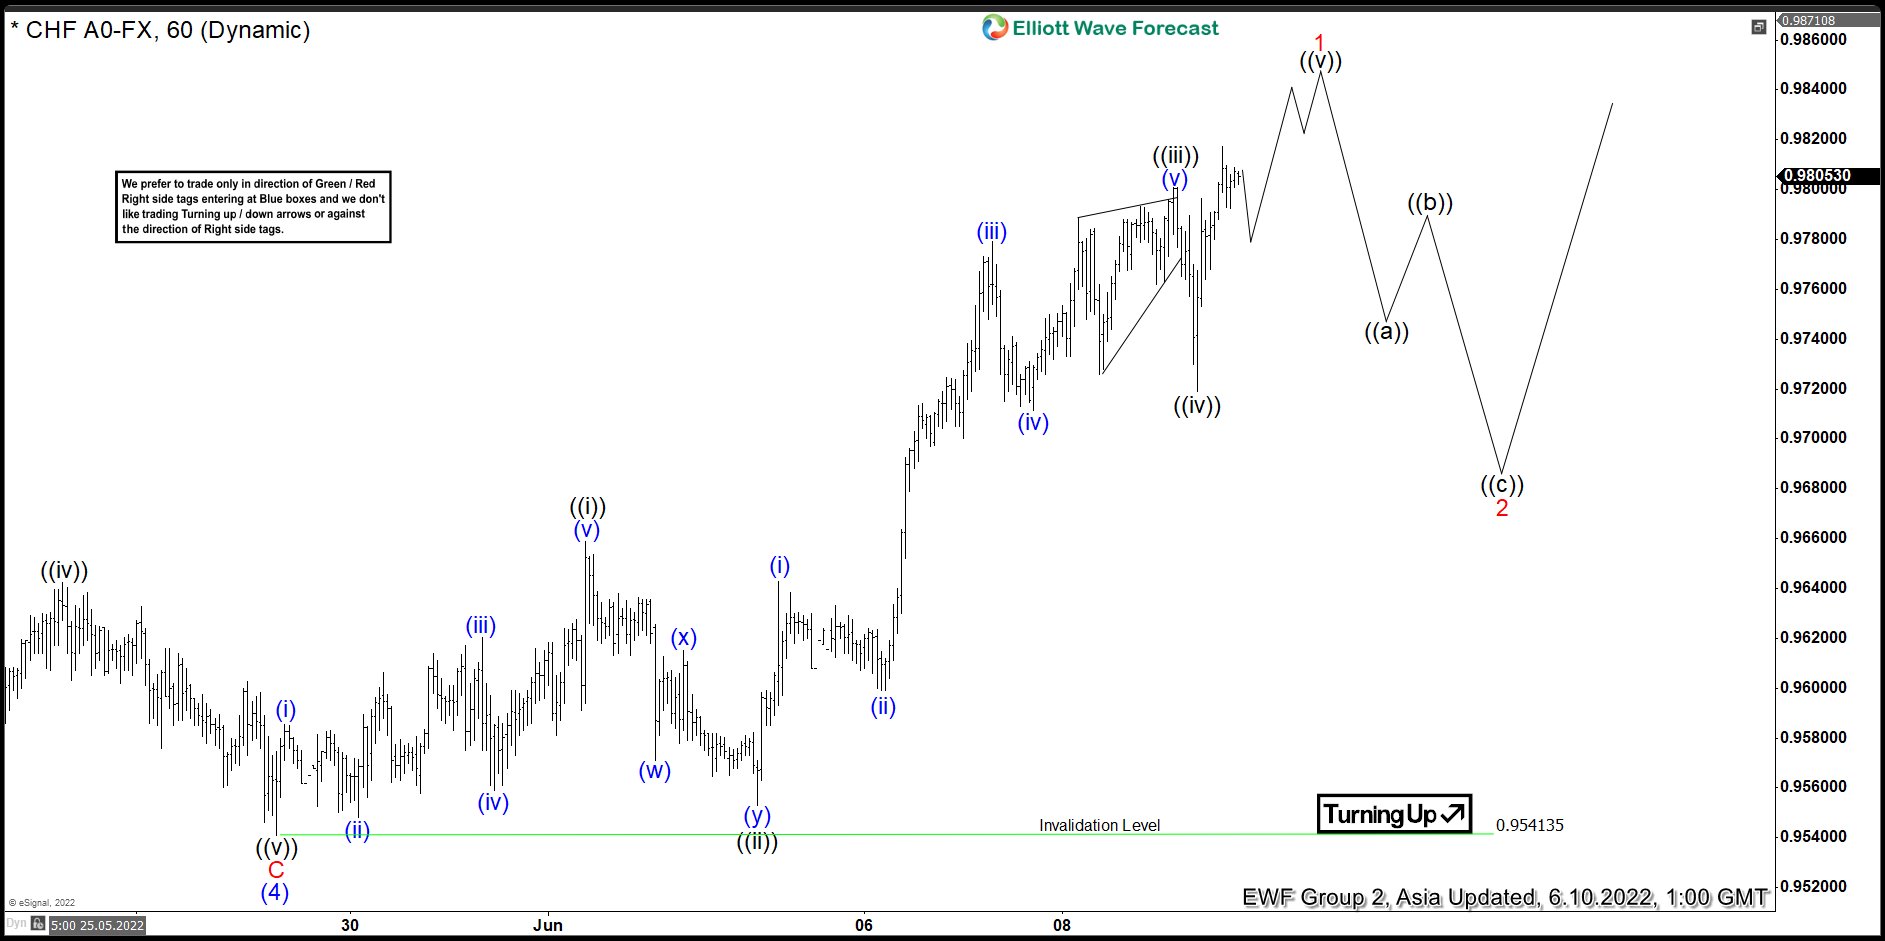
USDCHF ended wave (4) pullback at 0.954, and pair has now turned higher in wave (5). Pair still needs to break above the previous wave (3) high on 5/16/2022 high at 1.0064 to confirm the next leg higher has started. Internal subdivision of wave (5) is unfolding as a 5 waves impulse Elliott Wave structure. Up from wave (4), wave (i) ended at 0.958 and pullback in wave (ii) ended at 0.954. Pair then extends higher in wave (iii) towards 0.962 and pullback in wave (iv) ended at 0.956. Final leg higher wave (v) ended at 0.9659 which completed wave ((i)).
Pullback in wave ((ii)) ended at 0.955 with internal subdivision as a double three. Pair then resumes higher in wave ((iii)) with 5 waves subdivision. Up from wave ((ii)), wave (i) ended at 0.964 and dips in wave (ii) ended at 0.96. Pair then resumed higher in wave (iii) towards 0.978, wave (iv) dips ended at 0.9711, and wave (v) of ((iii)) ended at 0.98. Pair then did a pullback in wave ((iv)) which ended at 0.9719. Near term, pair can see a few more upside before ending wave ((v)) and wave 1 in higher degree. Afterwards, it should pullback in wave 2 to correct cycle from 5/27/2022 low before it resumes higher. Near term, as far as pivot at 0.954 low stays intact, expect dips to find support in 3, 7, or 11 swing for further upside.
USDCHF 60 Minutes Elliott Wave Chart
US 100 Struggles for Support
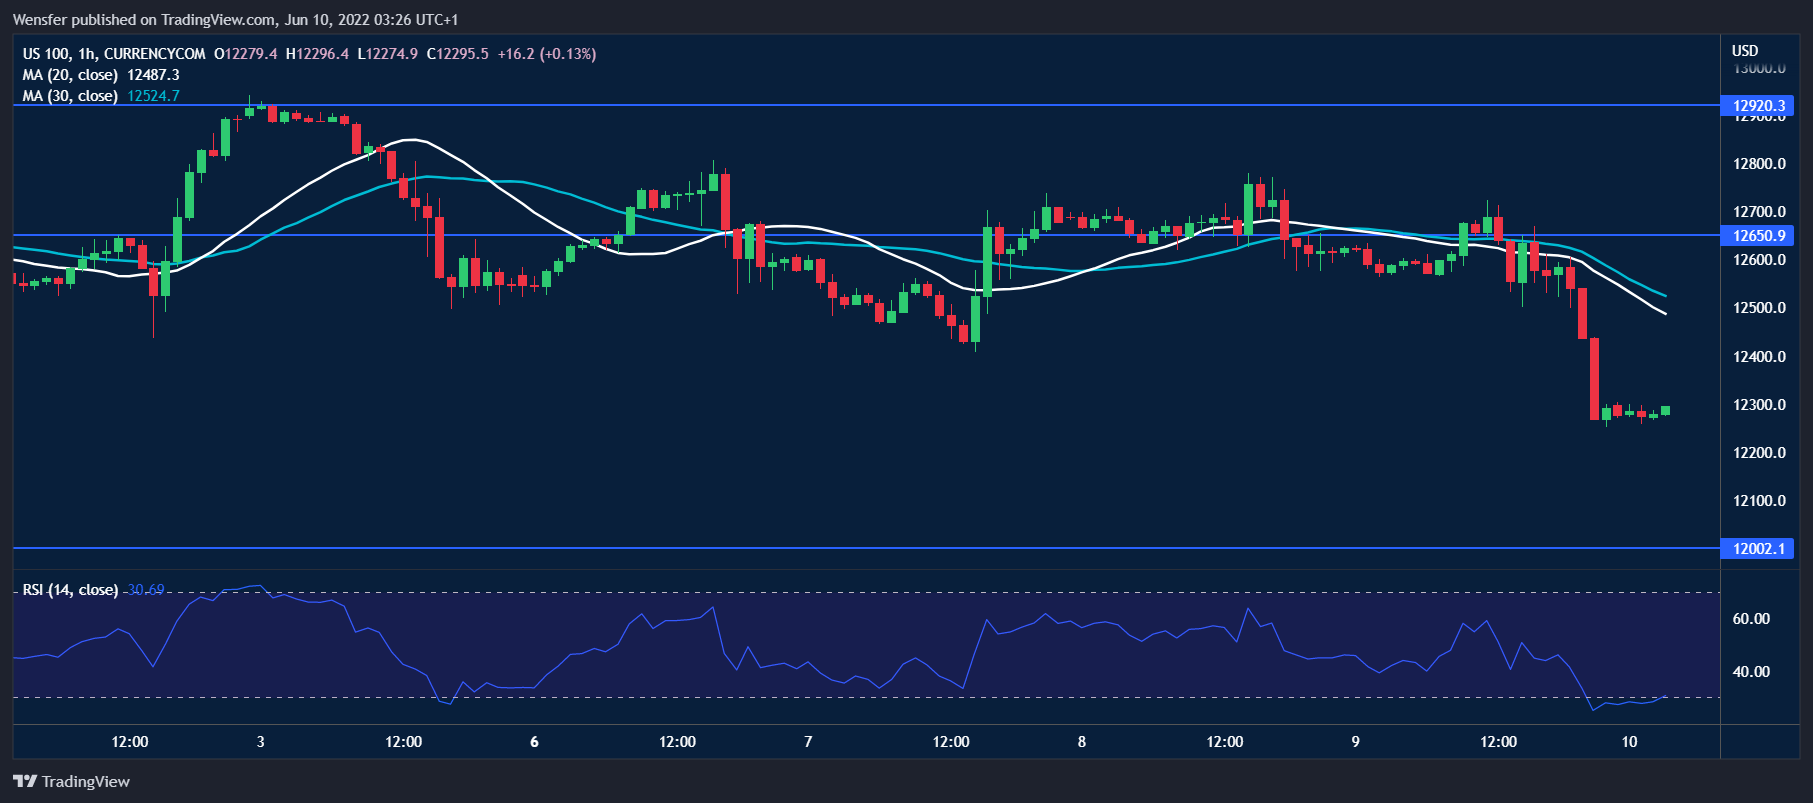
The Nasdaq 100 weakened after US jobless claims hit a five-month high. The index is struggling to hold onto its gains after it rose above the daily resistance at 12580. A drop below 12400, a former supply zone that has turned into a demand one, indicates a lack of commitment from the buy-side. A combination of profit-taking and fresh selling may depress the price action to the psychological level of 12000. 12650 is the closest resistance and 12920 a major ceiling before the rebound could make a comeback.
EUR/AUD Bounces Higher
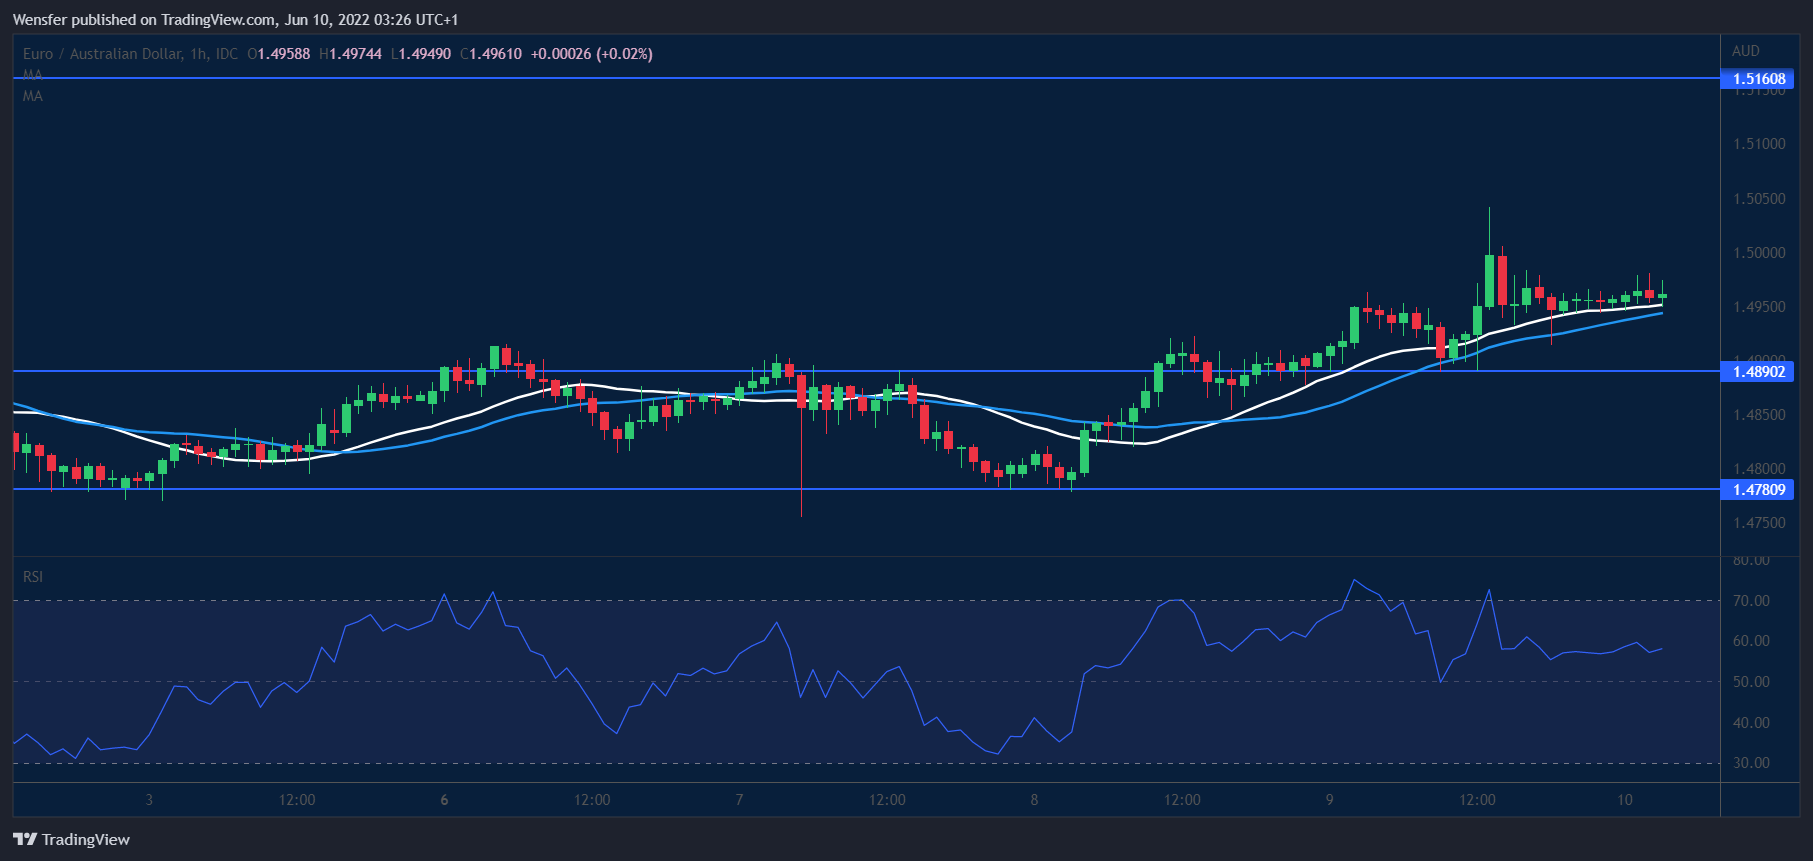
The euro soared after the ECB said it would kick off its rate hike cycle next month. The pair previously saw solid support at the double bottom at 1.4780. A break above 1.4910 has prompted sellers to cover their positions. The follow-up rally is a confirmation of a sustainable rebound. 1.5160 from the liquidation in late May is key resistance. Its breach could turn sentiment around in the medium-term and extend the reversal above 1.5280. In the meantime, the RSI’s overbought situation may cause a brief fallback towards 1.4890.
NZD/USD Seeks Support
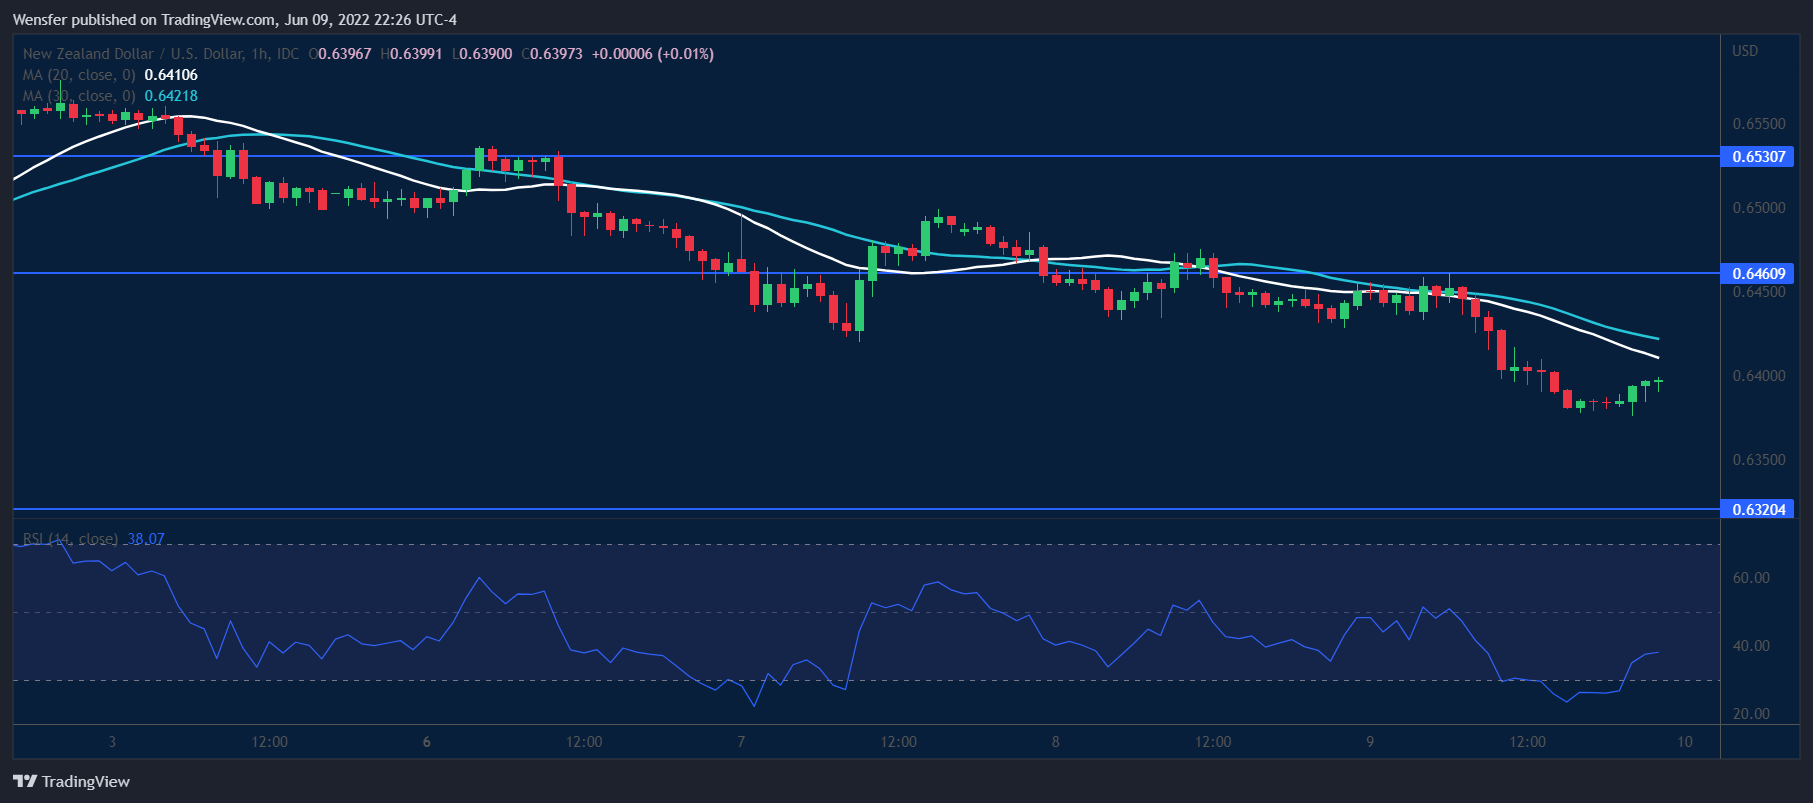
The US dollar bounces as traders reposition ahead of today’s CPI. On the daily chart, a break above the first resistance at 0.6550 and a MA cross suggest that the market mood may have brightened up. However, a pullback below 0.6420 has put short-term buyers under pressure. 0.6320 at the base of the initial breakout is the next level to gauge buying interest. An oversold RSI may trigger a ‘buy-the-dip’ behavior. But the bulls will need to lift offers at 0.6460 and then 0.6530 before the rally could be back on track.
GBP/JPY Daily Outlook
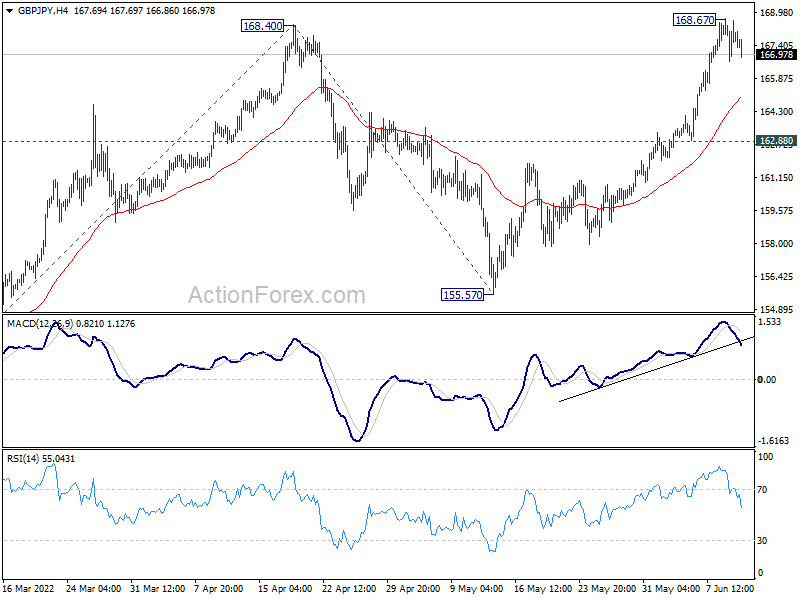
Daily Pivots: (S1) 166.84; (P) 167.78; (R1) 168.87; More...
Intraday bias in GBP/JPY remains neutral for consolidation below 168.67 temporary top. Downside of retreat should be contained above 162.88 minor support to bring another rally. On the upside, above 168.67 will resume larger up trend to 100% projection of 150.95 to 168.40 from 155.57 at 173.02.
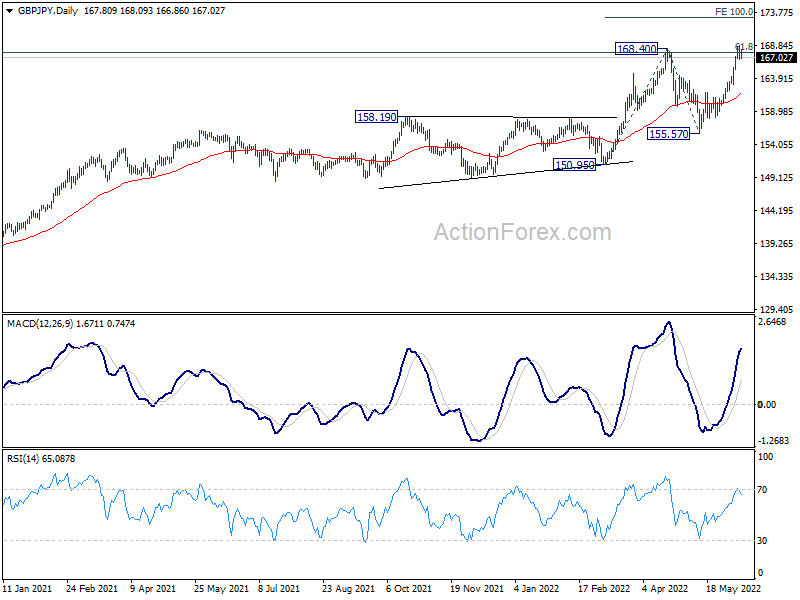
In the bigger picture, up trend from 123.94 (2020 low) is still in progress. Sustained break of 61.8% retracement of 195.86 (2015 high) to 122.75 (2016 low) at 167.93 will be a long term bullish signal, and could pave the way back to 195.86 high. This will now remain the favored case as long as 155.57 support holds, even in case of deep pull back.
EUR/JPY Daily Outlook
Daily Pivots: (S1) 141.97; (P) 143.08; (R1) 143.80; More....
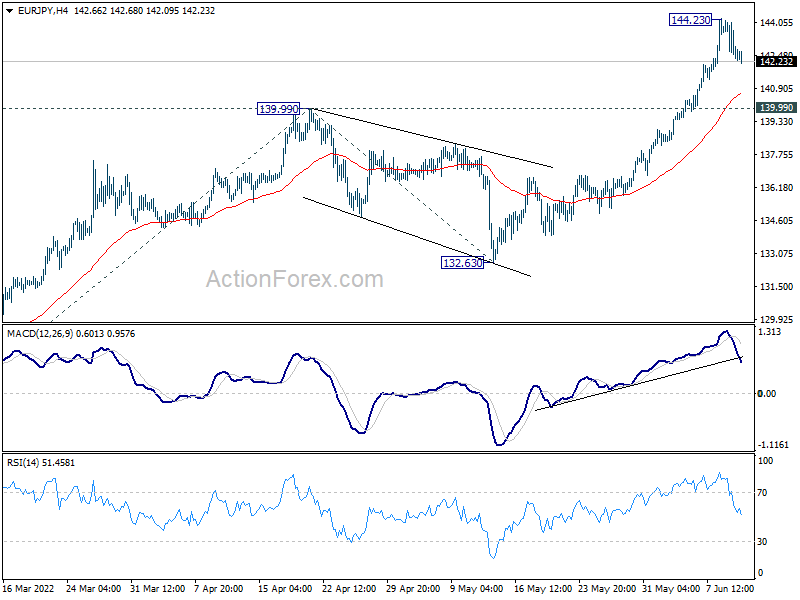
With a temporary top formed at 144.23, intraday bias in EUR/JPY is turned neutral for consolidations. Downside of retreat should be contained by 139.99 resistance turned support to bring rebound. On the upside, break of 144.23 will resumer larger up trend to 100% projection of 124.37 to 139.99 from 132.63 at 148.25.
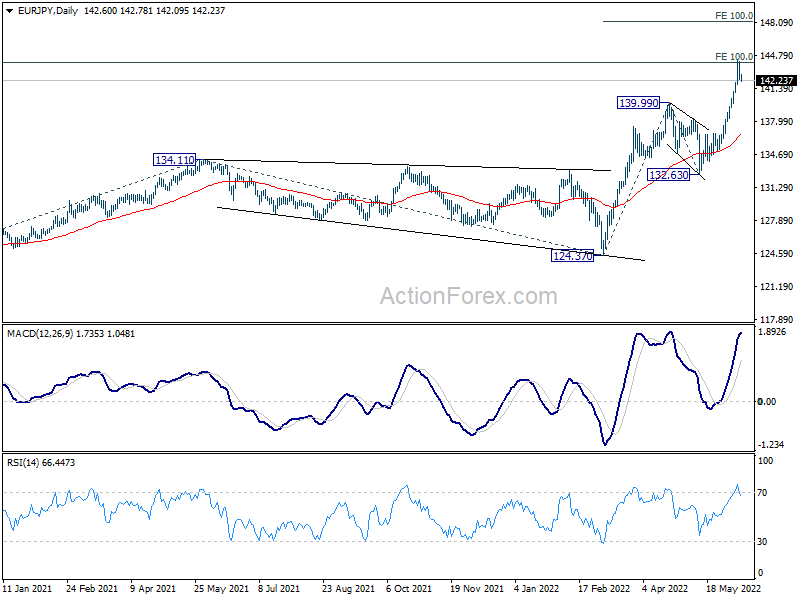
In the bigger picture, up trend from 114.42 (2020 low) is in progress. Such rise is seen as the third leg of the pattern from 109.30 (2016 low). Next target will be 100% projection of 114.42 to 134.11 from 124.37 at 144.06. Firm break there will indicate upside acceleration and target 149.76 long term resistance (2014 high). In any case, outlook will now remain bullish as long as 132.63 support holds, in case of deep pull back.
EUR/AUD Daily Outlook
Daily Pivots: (S1) 1.4891; (P) 1.4966; (R1) 1.5039; More...
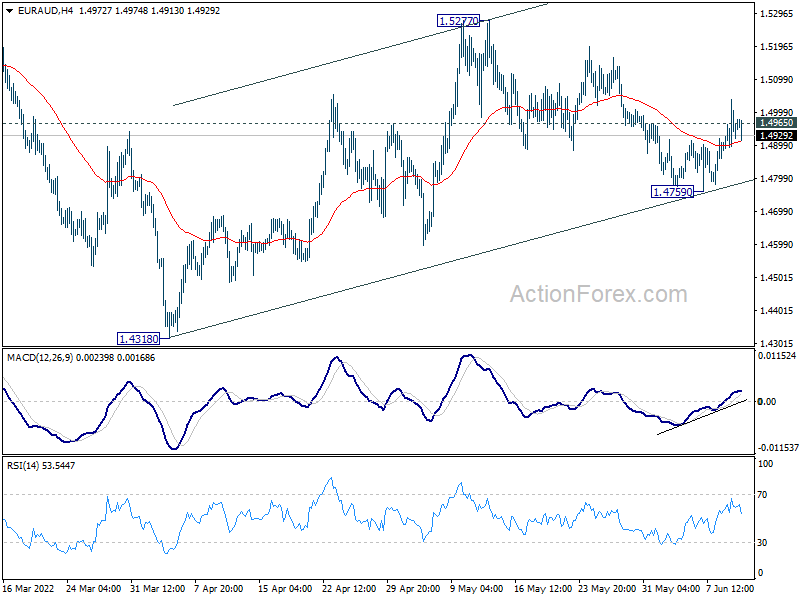
Intraday bias in EUR/AUD is back on the upside with break of 1.4965 minor resistance. Pull back from 1.5277 could have completed at 1.4759 already. Further rally would be seen back to retest this resistance. On the downside, through, break of 1.4759 will resume the fall from 1.5277 instead.
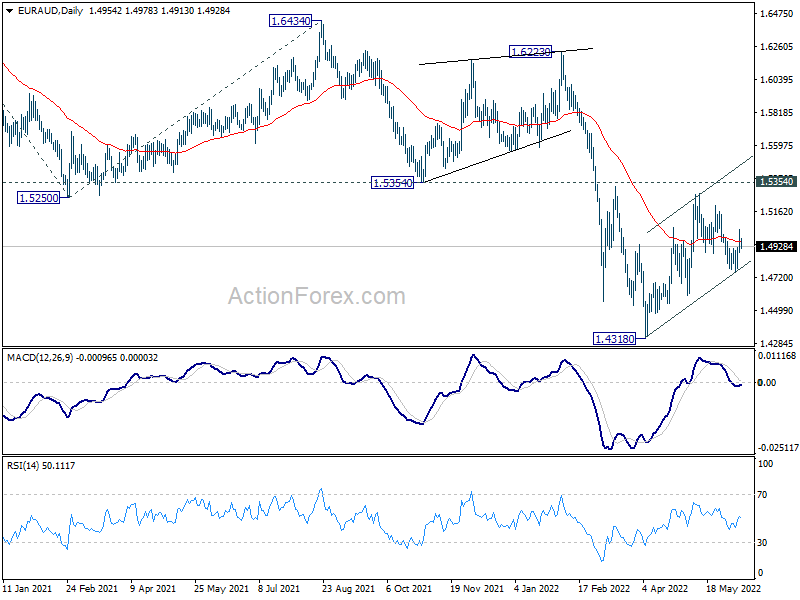
In the bigger picture, as long as 1.5354 support turned resistance holds, larger down trend from 1.9799 (2020 high) is still expected to continue. On resumption, next target is 61.8% projection of 1.9799 to 1.5250 from 1.6434 at 1.3623, which is close to 1.3624 long term support (2017 low). However, firm break of 1.5354 will indicate medium term bottoming and bring stronger rally back to 1.6434 key resistance.
EUR/GBP Daily Outlook
Daily Pivots: (S1) 0.8459; (P) 0.8525; (R1) 0.8565; More...
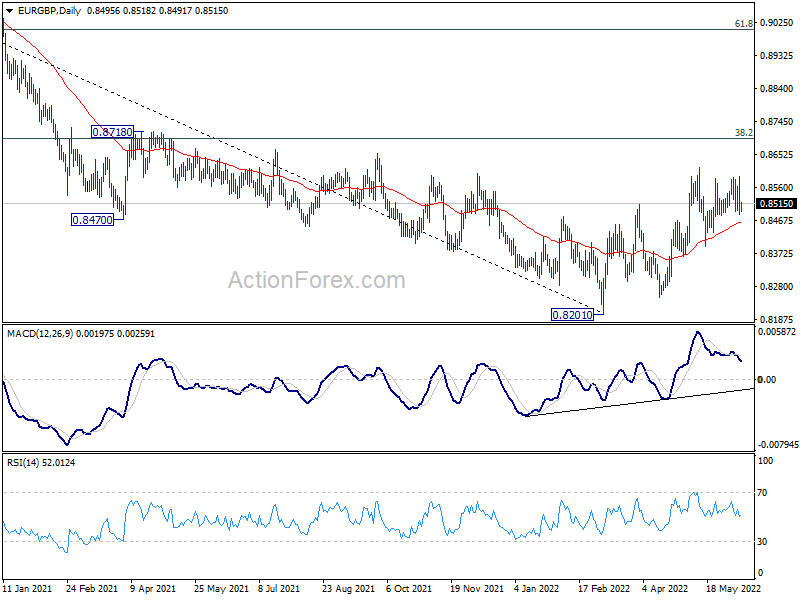
EUR/GBP is still extending the consolidation from 0.8617 and intraday bias remains neutral. With 0.8365 support intact, further rise is in favor. On the upside, break of 0.8617 will resume rise from 0.8201 medium term bottom to 0.8697 medium term fibonacci level. However, break of 0.8365 will dampen this bullish view, and turn bias back to the downside instead.
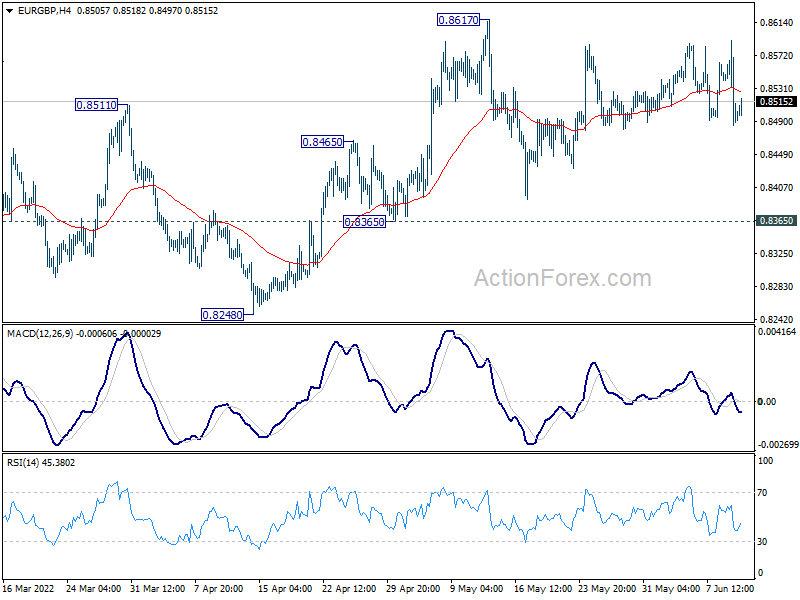
In the bigger picture, a medium term bottom could be in place at 0.8201, on bullish convergence condition in daily and weekly MACD. Rise from there could either be a correction to the down trend from 0.9499 (2020 high), or a medium term up trend itself. In either case, further rise should be seen to 38.2% retracement of 0.9499 to 0.8201 at 0.8697. Sustained break there will target 61.8% retracement at 0.9003.
EUR/CHF Daily Outlook
Daily Pivots: (S1) 1.0351; (P) 1.0432; (R1) 1.0492; More....
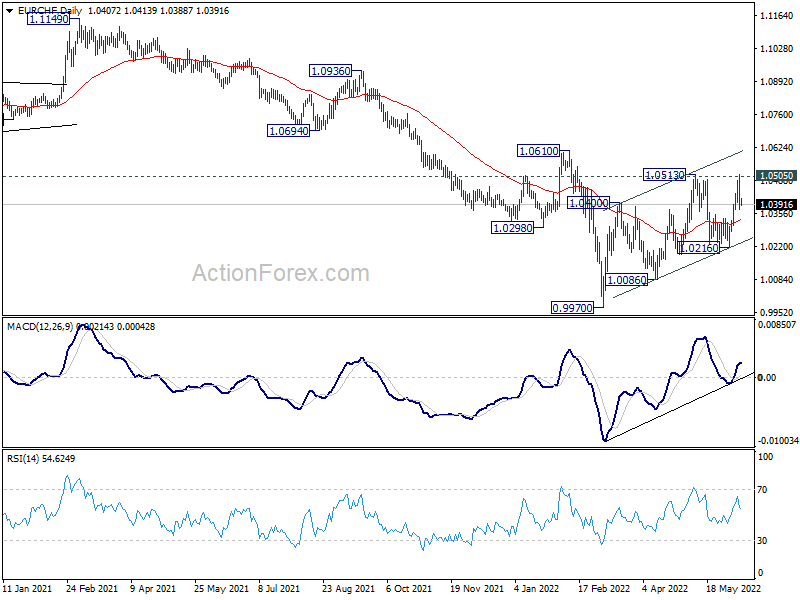
EUR/CHF retreated sharply after failing to break through 1.0513 resistance. Intraday bias is turned neutral first. On the upside, decisive break of 1.0513 will resume the whole rebound from 0.9970, for 1.0610 structural resistance. On the downside, break of 1.0216 will turn near term outlook bearish for 1.0086 support next.
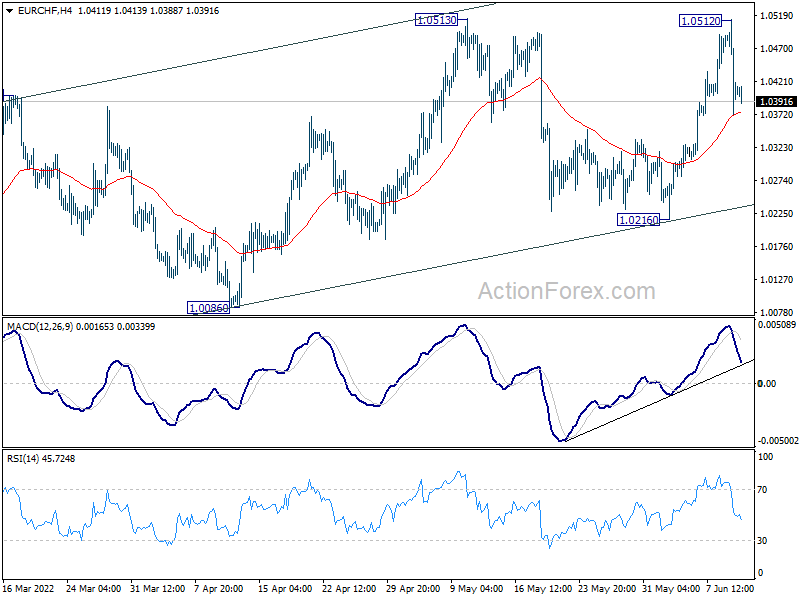
In the bigger picture, as long as 1.0505 support turned resistance (2020 low) holds, long term down trend from 1.2004 (2018 high) is expected to continue. Next target is 100% projection of 1.2004 to 1.0505 to 1.1149 at 0.9650. However, firm break of 1.0505 will suggest medium term bottoming, and bring stronger rebound towards 1.1149 structural resistance.