Sample Category Title
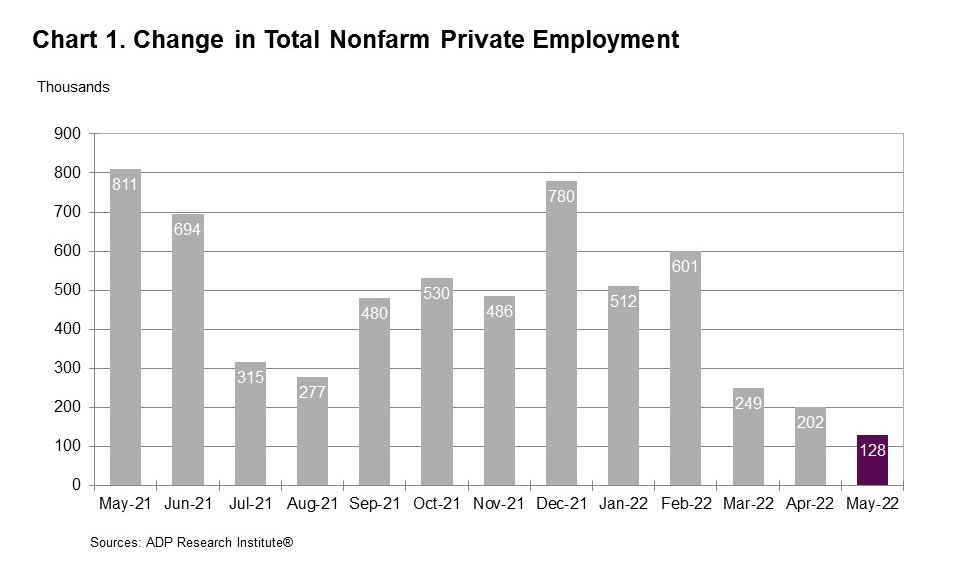
US ADP jobs rose 128k, growth rate tempered
US ADP private employment rose 128k only in May, well below expectation of 280k. By company size, small businesses jobs dropped -91k, medium businesses rose 97k, large businesses rose 122k. By sector, goods-producing jobs rose 24k, service-providing rose 104k.
"Under a backdrop of a tight labor market and elevated inflation, monthly job gains are closer to pre-pandemic levels," said Nela Richardson, chief economist, ADP. "The job growth rate of hiring has tempered across all industries, while small businesses remain a source of concern as they struggle to keep up with larger firms that have been booming as of late."
GBPCAD Wave Analysis
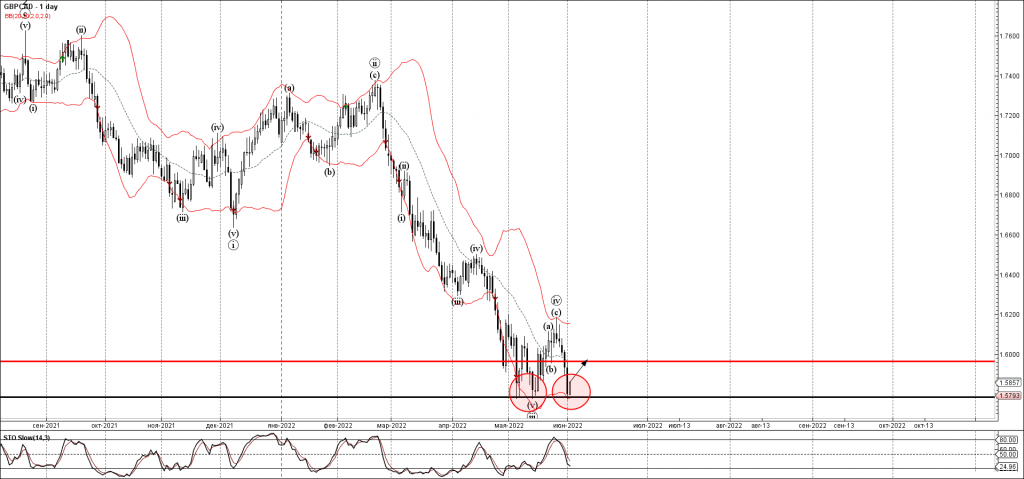
- GBPCAD reversed from key support level 1.5795
- Likely to rise to resistance level 1.5970
GBPCAD recently reversed up from the key support level 1.5795 (which stopped wave (iii) in the middle of May) – standing close to the lower daily Bollinger Band.
The upward reversal from the support level 1.5795 stopped the earlier minor impulse wave (v) from the end of May.
GBPCAD can be expected to rise further toward the next resistance level 1.5970 (former support from May).
EURJPY Wave Analysis
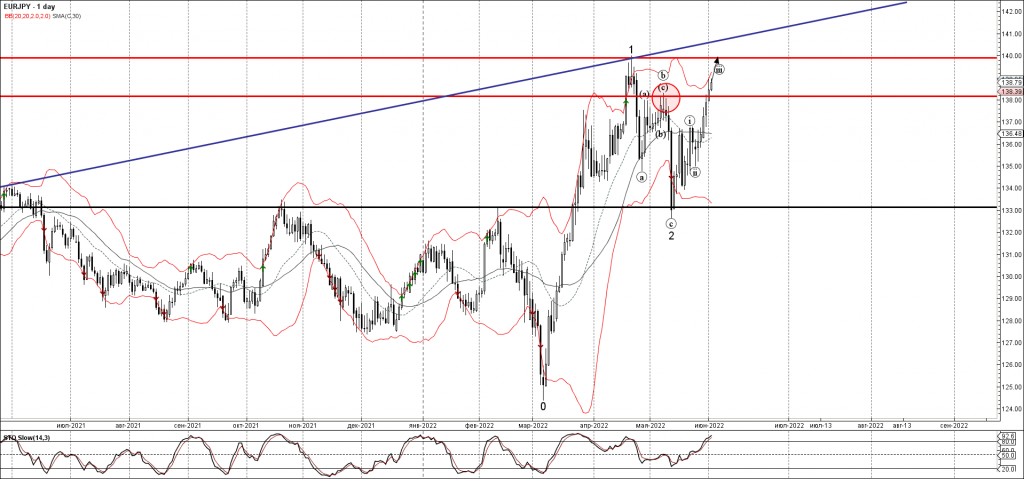
- EURJPY broke key resistance level 138.15
- Likely to rise to resistance level 140.00
EURJPY recently broke the key resistance level 138.15 (which stopped waves (a) and (b) at the start of May).
The breakout the resistance level 138.15 accelerated the active minor impulse wave (iii), which belongs to the higher order impulse wave 3 from last month.
Given the clear daily uptrend – EURJPY can be expected to rise further toward the next resistance level 140.00 (top of wave 1 from April).
WTI Wave Analysis
- WTI reversed from key resistance level 115.00
- Likely to fall to support level 110.00
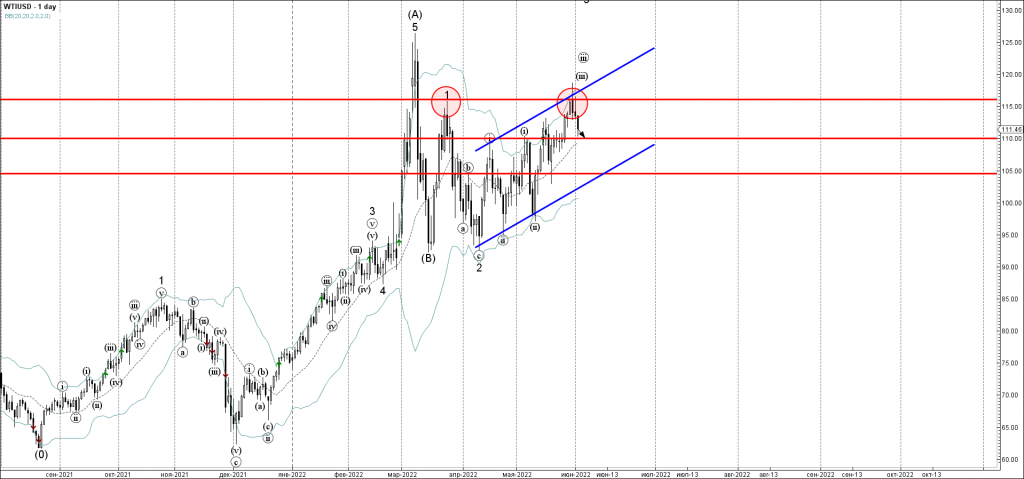
WTI crude oil recently reversed down from the key resistance level 115.00 (which stopped wave 1 at the end of March) – standing close to the upper daily Bollinger Band and the resistance trendline of the daily up channel from April.
The downward reversal from the resistance level 115.00 created the Bearish Engulfing, which started the active minor corrective wave (iv).
WTI crude oil can be expected to fall further toward the next support level 110.00 (former resistance from May).
Swiss Franc Rises on Higher Inflation
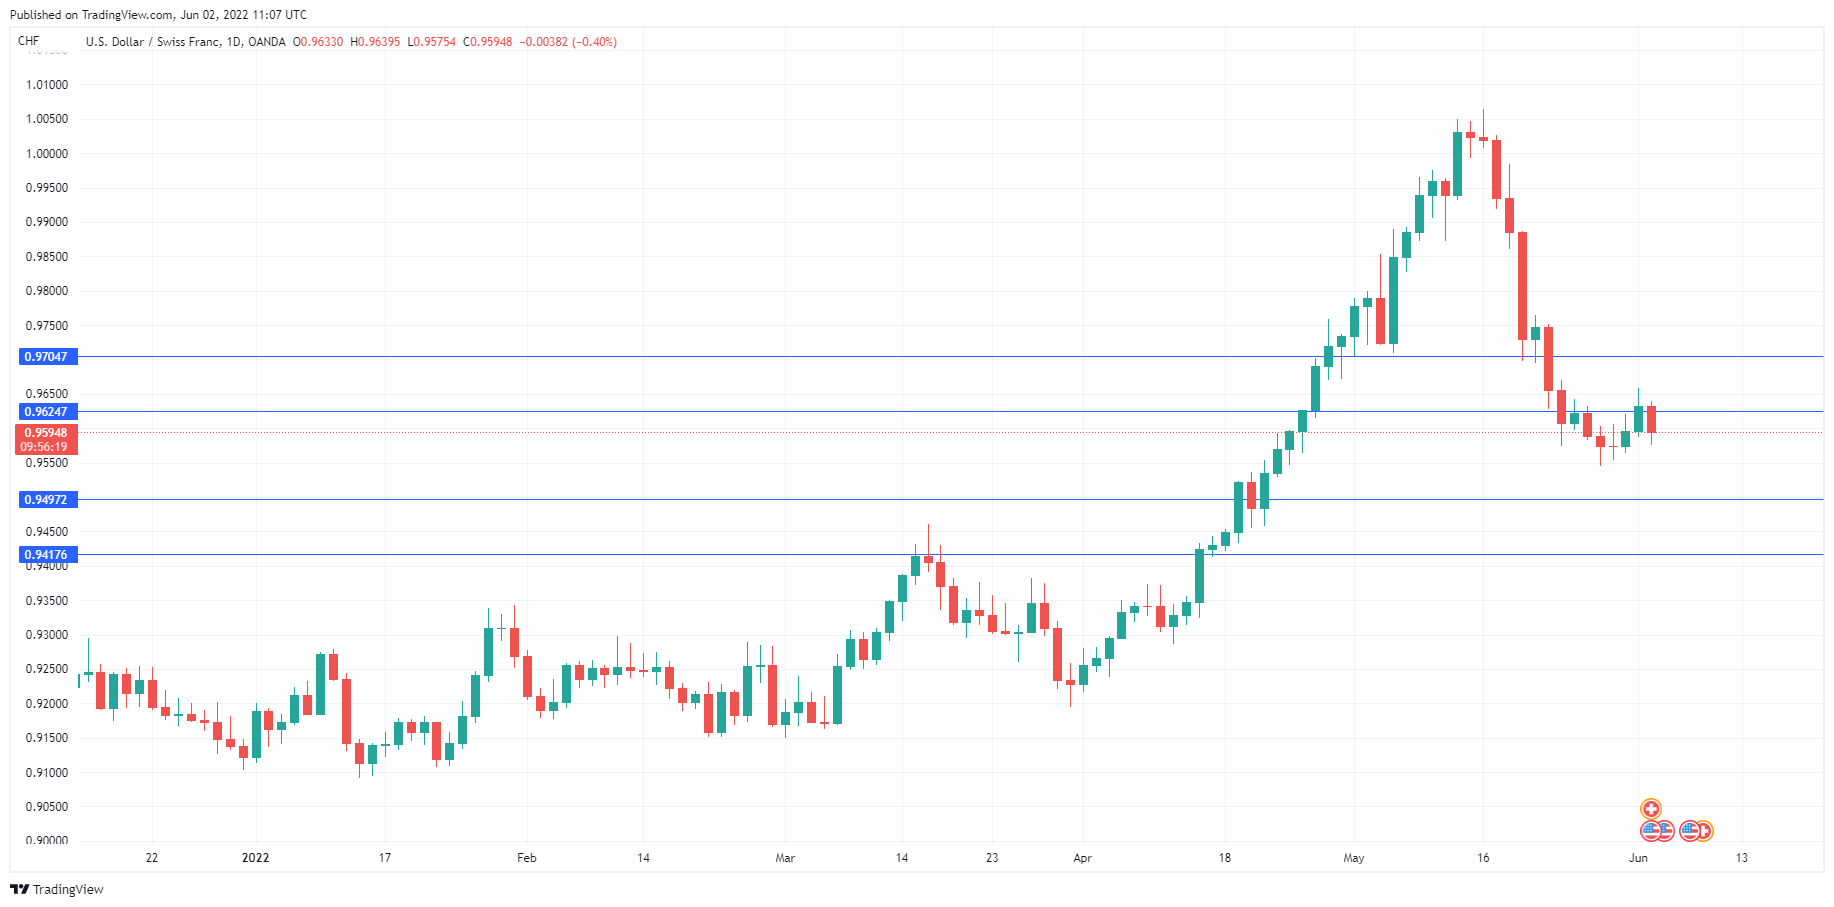
The Swiss franc is slightly higher on Thursday. USD/CHF is trading at 0.9596, down 0.39% on the day.
Those of us who think “staid and steady” when the Swiss franc comes to mind will be forgiven for not recognizing the currency lately. The Swissie took riders on a roller-coaster in the month of May, as USD/CHF rose 300 points and broke above parity for the first time since December 2019. The upswing didn’t last, as the pair reversed directions and dropped by some 400 points. The Swiss franc has stabilized over the past week after the May volatility. It is noteworthy that the EUR/CHF is trading at a one-month low.
Swiss inflation accelerates
Swiss inflation is moving upwards and hit a 14-year high in May. CPI rose 0.7% MoM, up from 0.4% in April (0.3% exp). On an annualized basis, CPI climbed 2.9%, up from 2.5% in April (2.6% exp.). Inflation remains much lower than the red-hot numbers we’re seeing in the eurozone or the UK, but Switzerland traditionally has enjoyed very low inflation, and higher prices are putting pressure on the Swiss National Bank (SNB) to address rising inflationary pressures.
The SNB has maintained an accommodative policy, which includes a benchmark rate of -0.75%, by far the lowest of any major bank. So far, the Bank is not showing any signs of tightening policy by raising rates, although that could change if the Swiss currency continues to appreciate.
Recent US data has been firm, with the notable exception of the housing sector. We’ll get a look at US nonfarm payrolls on Friday. The markets are braced for a slowdown, as the April forecast stands at 325 thousand, after a March gain of 428 thousand. It wasn’t so long ago that the NFP release was the highlight of the week, but with inflation, the Ukraine war and the OPEC+ meeting, NFP will be sharing the spotlight. Still, it should be considered a market-mover for the US dollar.
USD/CHF Technical
- There is resistance at 0.9624 and 0.9704
- USD/CHF has support at 0.9497 and 0.9417
AUD/USD: Aussie Keeps Firm Tone But Near-Term Action is Directionless and Looks for Fresh Signals
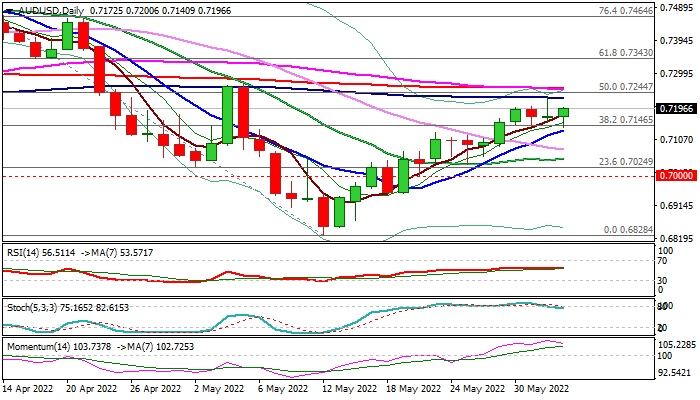
The AUDUSD regains traction on Thursday and regains 0.72 handle, following strong rejection at 100DMA (0.7227) on Wednesday, which resulted in a shallow pullback, contained by broken Fibo 38.2% of 0.7661/0.6828 and keeping larger bulls intact.
Fundamentals remain supportive for the Aussie as data released today showed that Australia’s trade surplus widened in April, while retail sales came in line with expectations.
Traders focus on RBA’s policy meeting next week, with wide expectations for 0.25% rate hike, but surprise 0.35%/0.4% raise is also on the table as strong inflationary pressures suggest that more aggressive action would be required.
Technical studies are mixed as strong bullish momentum is fading and stochastic reversed from overbought territory, while 100DMA (0.7227) and 200DMA (0.7227) weigh and conflict with 10/20/30DMA’s in bullish configuration and underpinning bulls.
Near-term action is holding within a range for the fourth straight day, in the movement that could be described so far as a consolidation.
Key events, such as US jobs data this week and RBA policy meeting next week, are in focus and expected to provide fresh direction signals.
Res: 0.7227; 0.7244; 0.7256; 0.7307
Sup: 0.7140; 0.7078; 0.7051; 0.7025
WTI Futures Falter Near 120 Mark, Bullish Risks Still in Play
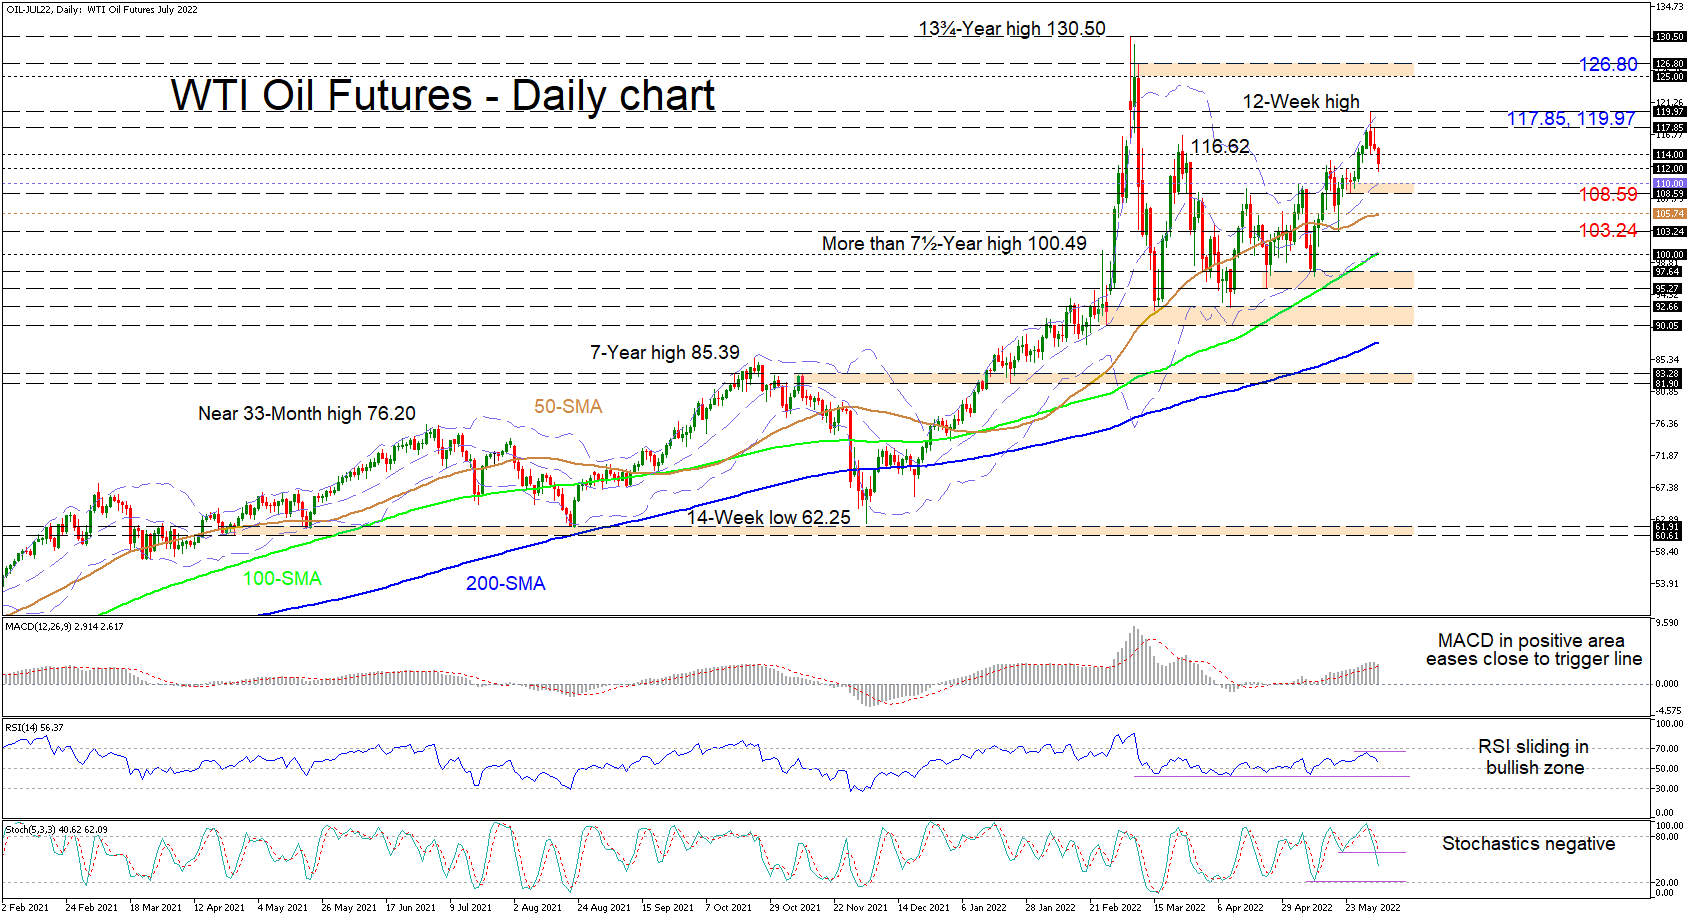
WTI oil futures are trading slightly above the 112.00 price level following a bearish pullback off a recorded twelve-week high, just shy of the 120.00 barrier in which the three-week rally stretched to. Despite the deep retreat in the price of the black liquid below even the March high of 116.62, the ascending simple moving averages (SMAs) are still endorsing the positive structure in the commodity.
The short-term oscillators are skewed to the downside championing the recent amplified selling in oil. The MACD, in the positive region, is implying that positive forces are waning, while the negatively charged RSI and stochastic oscillator are both indicating that selling forces are growing. Note that the MACD and the RSI are still in bullish regions as the price action maintains an upside structure.
Sustaining the current price trajectory, downside friction could persist from the 112.00 hurdle before sellers encounter a support zone from the mid-Bollinger band at 110.00 until the 108.59 nearby low. A break of this key obstacle could signify a return to slightly lower prices in the commodity with the 50-day SMA at 105.74 providing the next potential upside defence. In the event selling interest endures and drives the price past the May 19 trough of 103.24, the spotlight may then turn to the 100.00 price mark, where the 100-day SMA and the lower Bollinger band are currently located.
On the flipside, if buyers generate positive traction from the 112.00 region, which pilots the price of oil beyond the 114.00 border, they may then aim for the upper Bollinger band, which is residing between the 117.85 barrier and the 119.97 twelve-week peak. From here, successful bullish developments that conquer the 120.00 border could seek out the next potential resistance section linking the 125.00 level with the 126.80 obstacle.
Summarizing, WTI oil futures’ appreciating outlook has yet to crumble despite the noticeable withdrawal in the price from the 120.00 border. For the bullish bearing to endure, the price would need to dwell north of the mid-Bollinger band, basically the 108.59-110.00 support area. Yet, a price dive extending beneath the 108.59 low could begin to dissolve the recent positive structure, limiting near-term positive prospects.
USDJPY – Bulls Pause at Key 130 Resistance Zone ahead of US Jobs Data
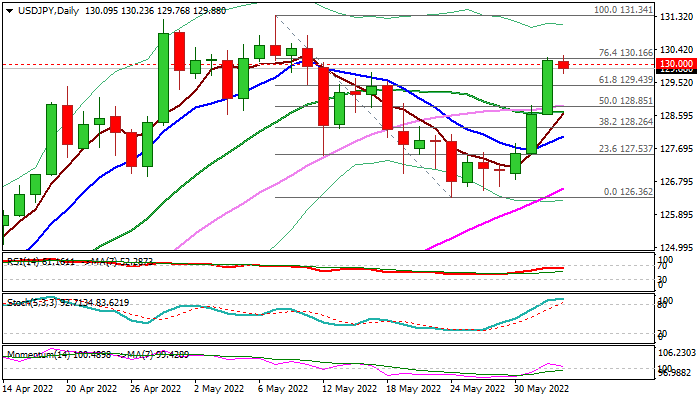
The USDJPY is trading within a narrow range around 130 handle on Thursday, after recovery from 126.36 (May 24 low) accelerated on Wednesday (up 1.1% for the day) and cracked pivotal barriers at 130.00/16 (psychological / Fibo 76.4% of 131.34/126.36 pullback).
Close above these levels is needed to generate fresh bullish signal for recovery extension towards 130.80 (May 11 high) and key resistance at 131.34 (20-year high, posted on May 9).
Bulls remain firmly in play and underpinned by rising and thickening daily cloud, but overbought conditions on daily chart and fading bullish momentum suggest bulls may pause for consolidation ahead of key US jobs reports (ADP today and NFP on Friday which would provide more details about the situation in the US labor market and direction signals for the dollar.
Broken Fibo 61.8% barrier at 129.43 reverted to solid support which should keep the downside protected to maintain near-term bullish bias.
Caution on extension below 128.85 (daily Kijun-sen / broken Fibo 50%).
Res: 129.61; 130.00; 130.16; 130.80
Sup: 129.76; 129.43; 128.85; 128.26
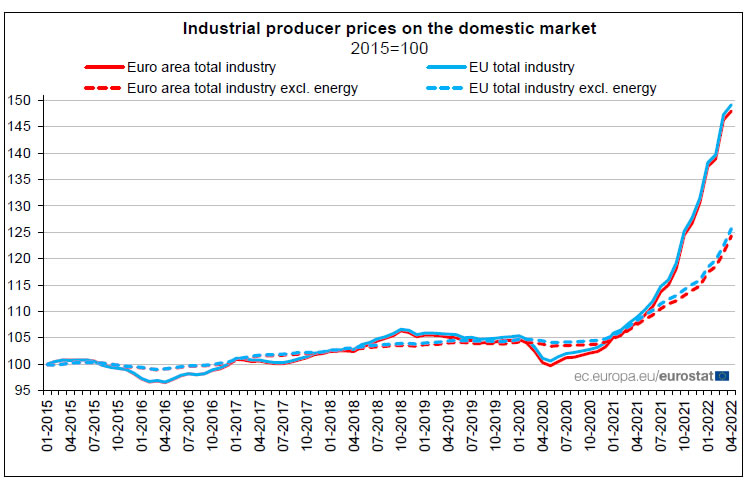
Eurozone PPI up 1.2% mom, 37.2% yoy in Apr, EU up 1.3% mom, 37.0% yoy
Eurozone PPI rose 1.2% mom, 37.2% yoy in April, below expectation of 2.3% mom, 38.6% yoy. For the month, Industrial producer prices increased by 3.8% for intermediate goods, by 2.7% for non-durable consumer goods and by 1.0% for capital goods and durable consumer goods, while they decreased by -1.2% in the energy sector. Prices in total industry excluding energy increased by 2.6%.
EU PPI rose 1.3% mom, 37.0% yoy. The highest monthly decreases in industrial producer prices were recorded in Ireland (-16.4%), Romania (-3.2%), Portugal (-2.2%) and Italy (-0.3%). The highest increases were observed in Slovakia (+9.3%), Luxembourg (+6.0%) and Bulgaria (+4.1%).
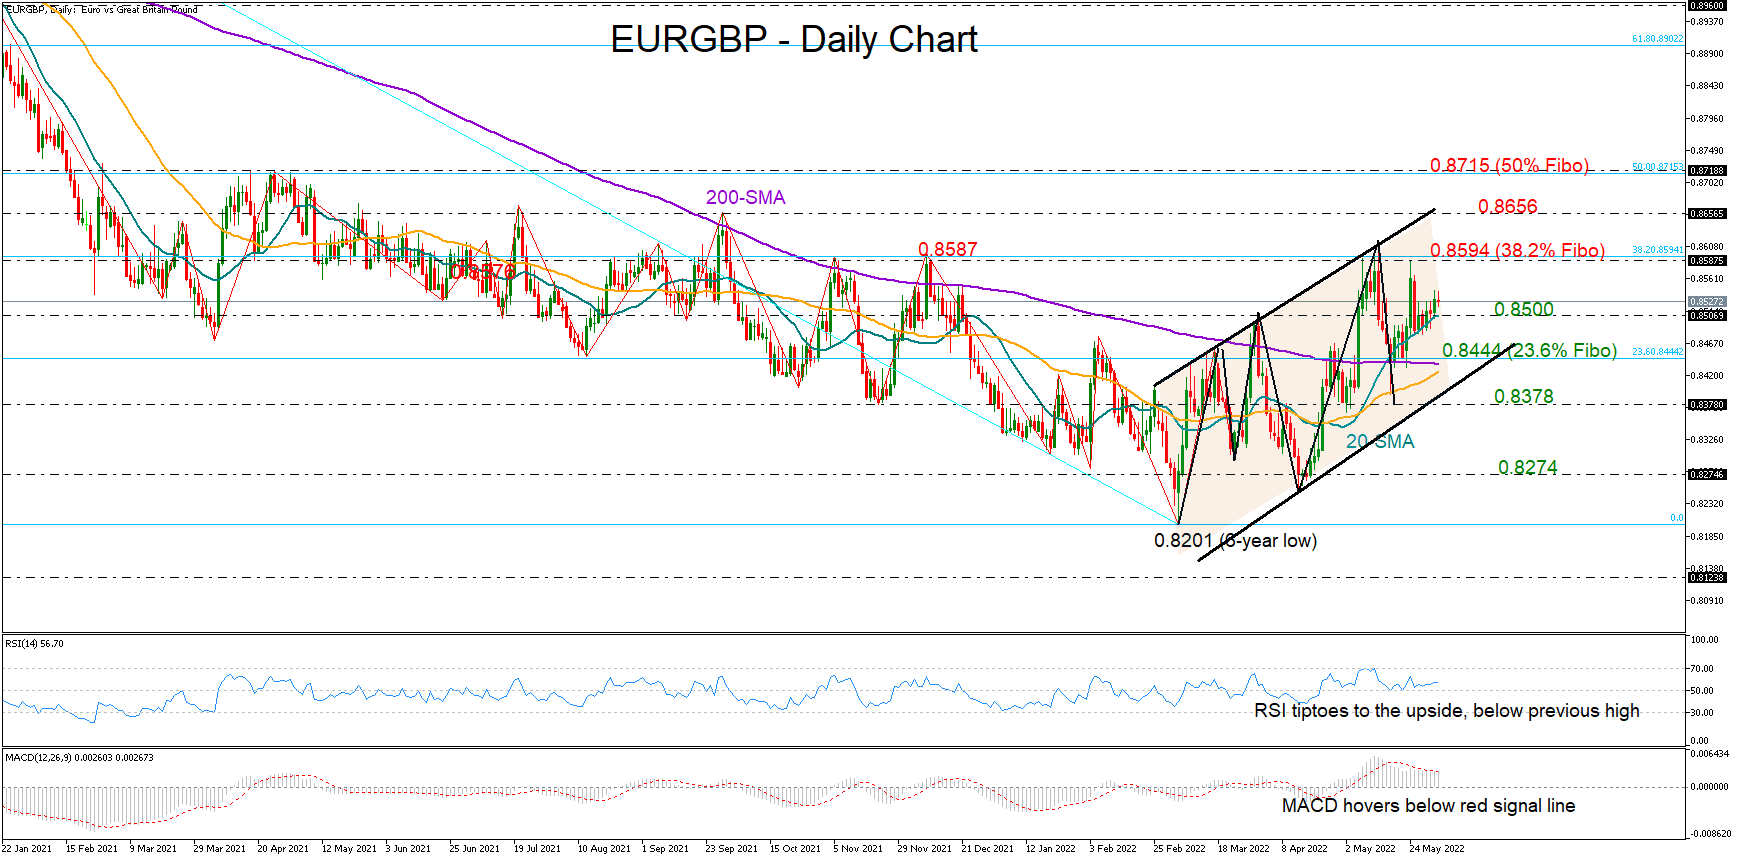
EURGBP Defends Series of Higher Highs; Eyes on 0.8594
EURGBP has been gradually gaining ground over the past week, with the 20-day simple moving average (SMA) buffering any selling pressures on the way up and hence defending the latest rebound on the key 200-day SMA at 0.8440.
The fact that the price could not reach the upper surface of the short-term bullish channel last week is feeding some caution, though the three-month market structure is still looking somewhat encouraging as the pair has been charting higher highs since the tumble to an almost six-year low of 0.8200. In other trend signals, the bullish intersection between the 20- and 200-day SMAs is endorsing further trend improvement. Note that the 50-day SMA is pushing for a golden crossover too.
The momentum indicators remain in the positive area but are still reflecting some conservatism among traders, making downside corrections likely. Particularly, despite its upside reversal within the bullish area, the RSI has yet to print new higher highs, while the MACD, although hovering within the positive zone, cannot find enough strength to pierce above its red signal line.
On the upside, there is no major resistance in sight until the crucial area of 0.8594, which coincides with the 38.2% Fibonacci retracement of the 0.9228 – 0.8200 downleg. If the bulls manage to knock down that wall, the price could continue towards the next key barrier of 0.8656, which strongly rejected upside moves during the second half of 2021. Further up, the spotlight will shift to the 50% Fibonacci and April’s 2021 bar of 0.8715, where any sustainable extension higher would switch the broad neutral outlook to positive.
Should sellers retake control below the 20-day SMA and the 0.8500 level, the price may seek shelter somewhere between the flattening 200-day SMA and the 50-day SMA, both converging to 0.8436. A step lower could quickly stretch towards the 0.8378 floor, while deeper, another sharp bearish correction could take place down to 0.8274.
In brief, although the short-term trend in EURGBP is showing a gradual improvement, traders may remain a bit cautious until the price successfully pierces above the 0.8587 boundary.