

Sample Category Title
Bitcoin Reclaims $30,000 Mark Amid Increasing Positive Correlation With Stock Indices
Bitcoin has kicked-off the week on the front foot, dragging most major altcoins higher and catching up with the stock markets’ latest rally, despite the recent decoupling between digital assets and the major US indices. Nevertheless, the king of cryptocurrencies had an extended record-breaking losing streak, recording nine consecutive weekly losses, while it is currently trading more than 50% beneath its all-time high. Therefore, even if some positive signs have emerged after the bulls managed to recapture the $30,000 psychological level, the road back to complete recovery appears to be long and bumpy.
Inflation remains the name of the game
Last Friday, the April US PCE inflation reading hit the markets, with the annual figure falling from 6.6% to 6.3% in line with analysts’ projections. This development reinforced the view that inflationary pressures have likely peaked in the US, which in turn boosted investors' bets that the Fed might eventually slow down its monetary tightening, paving the way for the recent relief rally in stock markets. Nonetheless, Bitcoin and the broader crypto space continued to head down, exhibiting signs that their strong positive correlation with equity markets has broken up.
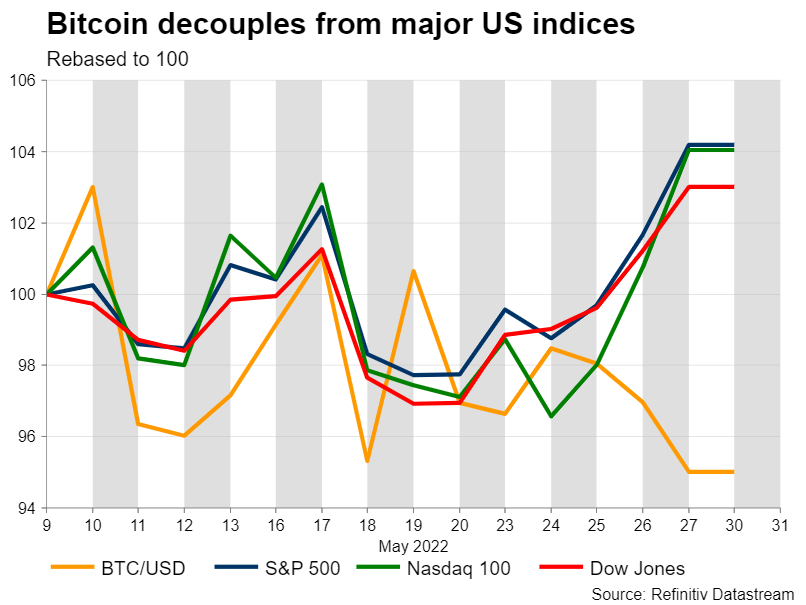
Unexpectedly, at the beginning of this week, most major crypto assets have been edging higher, mirroring the stocks’ recent rebound and indicating that their positive relation has partially returned.
Barrage of positive developments
The recent relief rally in equity markets has entrained cryptocurrencies higher, but it is not the sole factor. Firstly, China’s easing of Covid-19-related curbs has eased investors’ fears over a potential recession, increasing their appetite for risky assets. Moreover, the broader crypto space is getting a boost from the recent weakness observed in the US dollar, which is heading towards its first monthly loss in five months as markets project a shallower monetary path for the Fed.
Can the price break above its sideways pattern?
Bitcoin price has been trading within a tight range during the past two weeks, with investors scrutinizing the current complex market conditions, and appearing to be on hold for fresh catalysts that could provide strong directional impetus.
In the positive scenario, bullish actions could send the price to test the recent peak of $31,570 before the attention shifts to the $34,450 barrier.
On the flipside, should selling interest intensify, Bitcoin’s price may descend towards $28,000, which is the lower boundary of its recent rangebound pattern. A violation of the latter could set the stage for the 2022 low of $25,390.
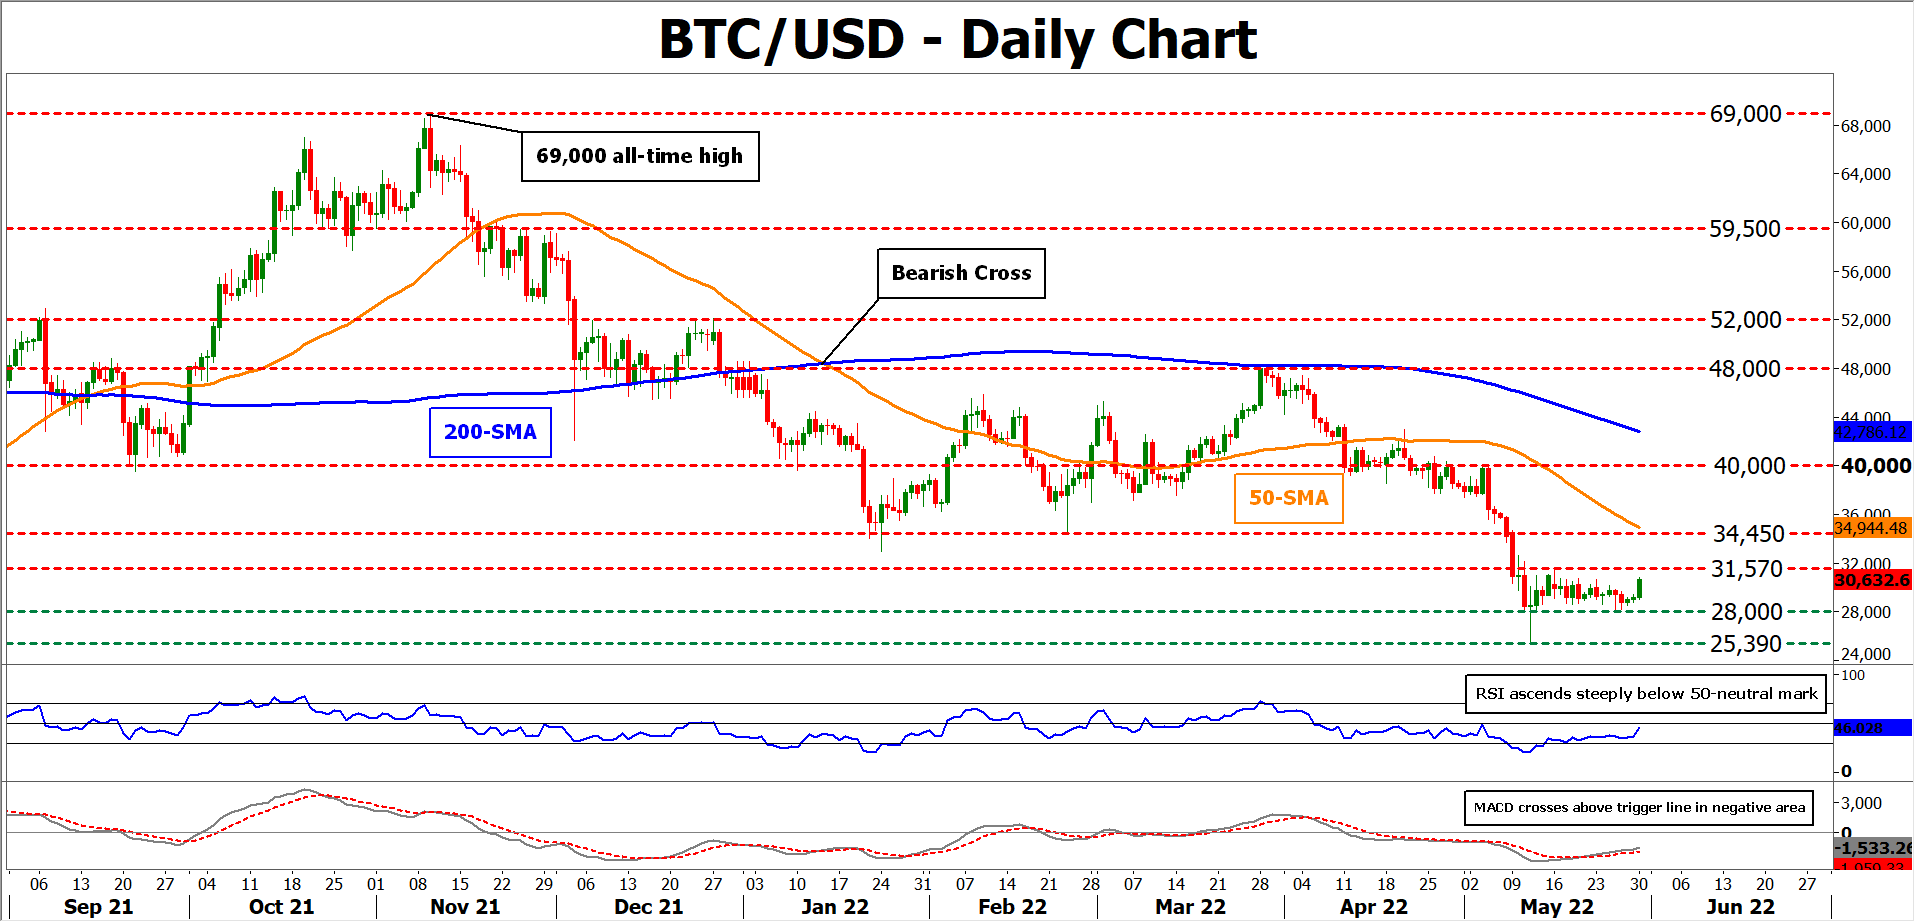
Overall, even though a raft of tailwinds has emerged for cryptocurrencies, their future is closely tied to the pace and magnitude of central banks’ monetary tightening. Therefore, in the upcoming week, the Eurozone CPI print may be a substantial driver for investors’ risk tolerance as it could provide insights into how hard the ECB will slam the brakes on the Eurozone economy.
GBPCAD Wave Analysis
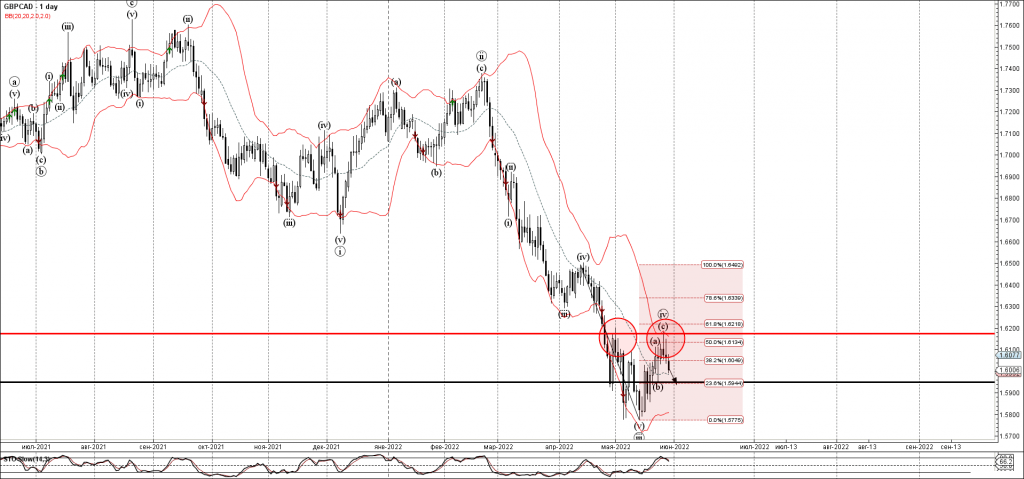
- GBPCAD reversed from resistance level 1.6175
- Likely to fall to support level 1.5950
GBPCAD recently reversed down from the key resistance level 1.6175 (top of the earlier minor correction from the start of May).
The resistance area near the resistance level 1.6175 was further strengthened by the upper daily Bollinger Band and by the 61.8% Fibonacci correction of the downward impulse from April.
Given the strong downtrend, GBPCAD can be expected to fall further toward the next support level 1.5950 (low of the earlier minor correction wave (b)).
EURJPY Wave Analysis
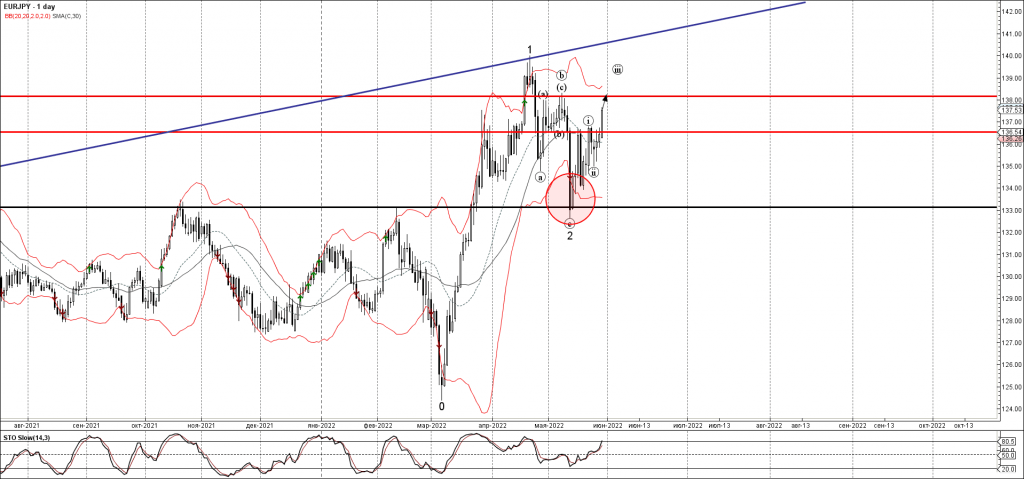
- EURJPY broke resistance level 136.60
- Likely to rise to resistance level 138.00
EURJPY currency pair continues to rise after the earlier breakout of the resistance level 136.60 (which stopped the previous minor wave (i)).
The breakout of the resistance level 136.60 continues the active minor impulse wave (iii) of the higher-order impulse wave 3 from the middle of May.
EURJPY can be expected to rise further toward the next round resistance level 138.00 (top of wave (b) from the start of this month).
Fed Waller supports 50bps hikes for several meetings
Fed Governor Christopher Waller said in a speech, "longer-range inflation expectations have moved up from a level that was consistent with trend inflation below 2 percent to a level that's consistent with underlying inflation a little above 2 percent."
When these expectations are "anchored", "they influence spending decisions today in a way that helps inflation move toward our target," he added.
"To ensure these longer-term expectations do not move up broadly, the Federal Reserve has tools to reduce demand, which should ease inflation pressures," he said".
"I support tightening policy by another 50 basis points for several meetings". In particular, "I am not taking 50 basis-point hikes off the table until I see inflation coming down closer to our 2 percent target." Additionally, Waller said he supports "having the policy rate at a level above neutral" by the end of this year.
AUDUSD’s Sturdy Two-Week Rally Tries to Keep Pace
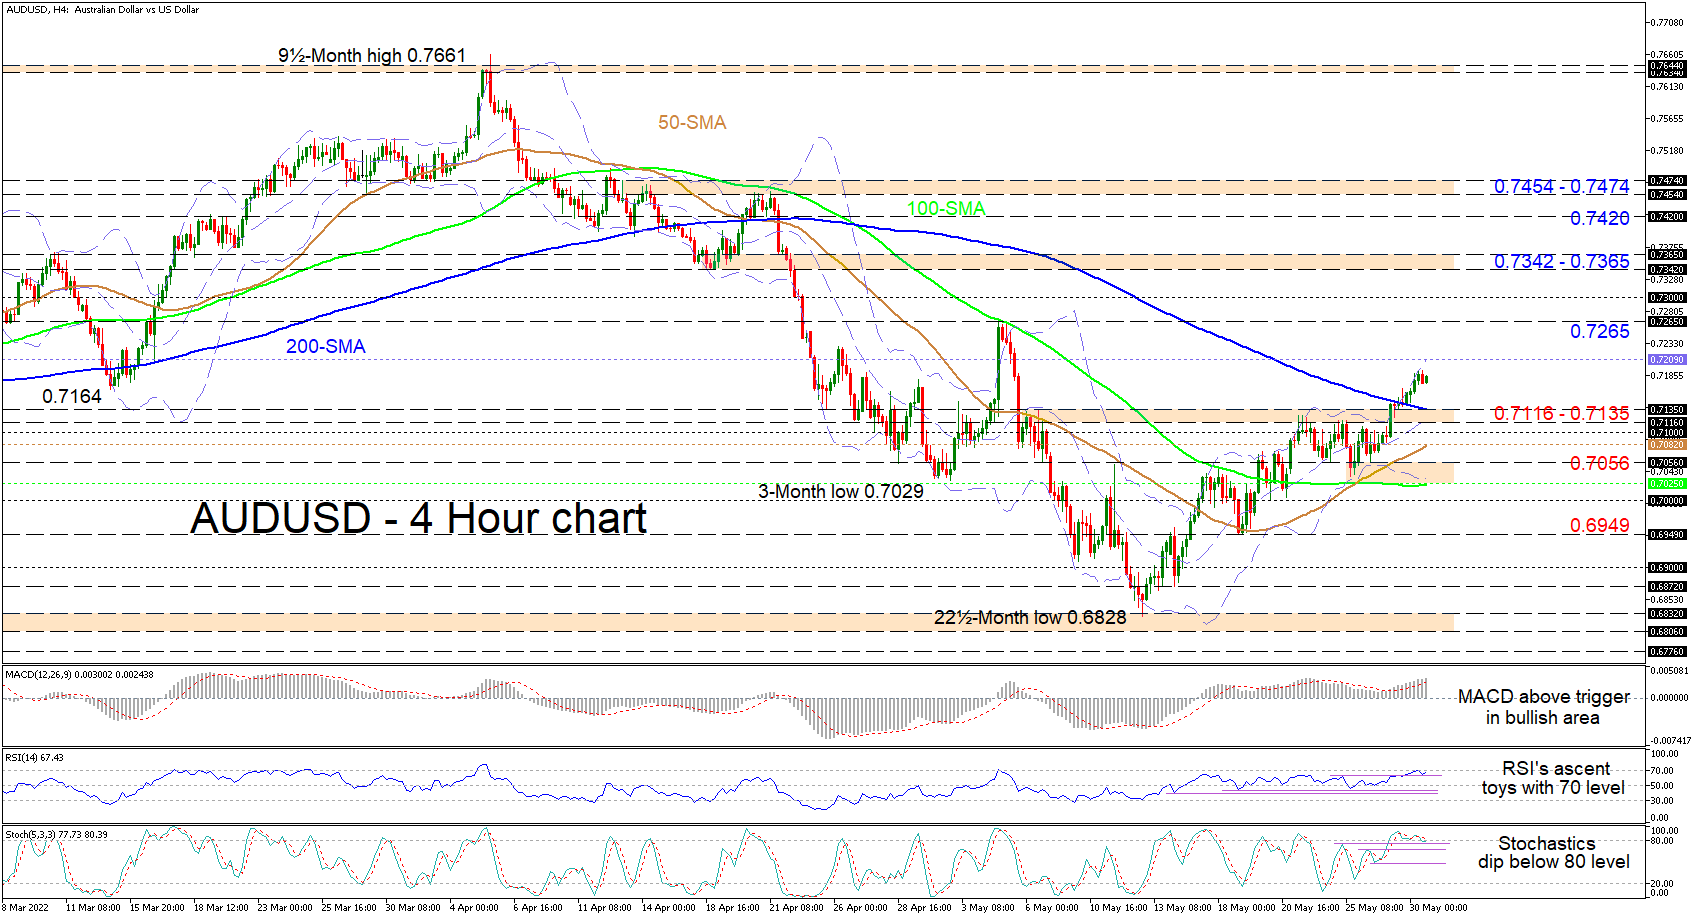
AUDUSD is starting to ease from the upper Bollinger band that is around the 0.7200 hurdle, after recent price action, which was glued to the upper Bollinger band, hiked the price above the falling 200-period simple moving average (SMA). The softened decline in the slopes of the 100- and 200-period simple moving averages (SMAs) is highlighting the latest successful efforts from buyers, who have recouped nearly 400 pips. Moreover, the climbing 50-period SMA is championing additional gains in the pair.
The short-term oscillators are indicating that the latest dwindling in positive momentum may be short lived. The MACD, is holding above its red trigger line in the positive region, while the RSI is retesting the 70 overbought barrier. Furthermore, the fresh minor dip in the stochastic lines below the 80 level is not demonstrating convincing downward forces.
Worth mentioning is the unfolding of the recent squeeze in the Bollinger bands, which are diverging and suggest that the surge in volatility is expected to grow.
If the positive trajectory endures, resistance could commence from the upper Bollinger band at 0.7209 ahead of the 0.7265 May high. Piloting even higher, the 0.7300 hurdle may then try to delay buyers from tackling the 0.7342-0.7365 resistance band that evolved from the mid-April trough. Recapturing the zone above this boundary could repower upside pressures, bringing the 0.7420 obstacle into play prior to the bulls challenging the 0.7454-0.7474 resistance section, which contains the highs over the second part of April.
Otherwise, if sellers resurface, support could originate at the 0.7116-0.7135 fortified region, which includes the 200-period SMA and the mid-Bollinger band. Moving lower, the 0.7100 mark and the rising 50-period SMA at 0.7082 could provide some downside friction ahead of a buffer zone from the 0.7056 low until the 100-period SMA at 0.7025. Should this deterrent fail to dismiss negative tendencies from returning, the 0.7000 border and the 0.6949 trough could draw traders’ attention.
Summarizing, AUDUSD’s freshly developing bullish move from the 22½-month low of 0.6828 is indicating potential. A jump above 0.7265 could boost buyers’ confidence, while a dive in the price below the 0.7025-0.7056 zone may reinforce a negative vibe in the pair.
Australian Dollar Extends Rally
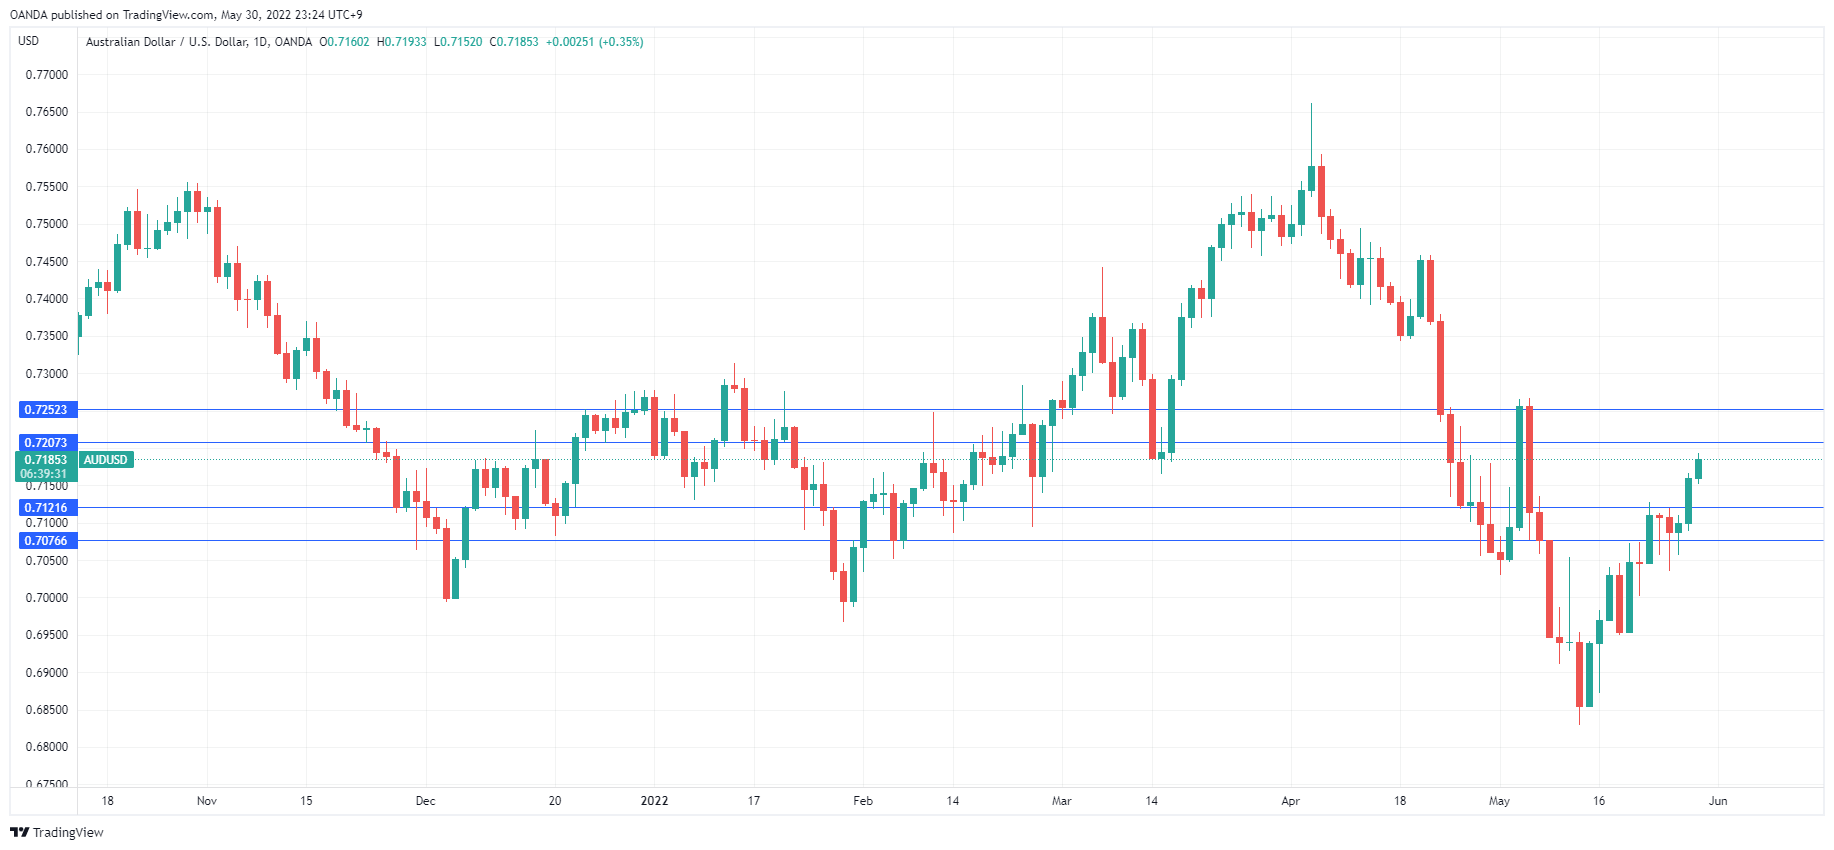
The Australian dollar continues to gain ground. AUD/USD has risen 0.31% on the day and is slightly below the 0.72 line. US markets are closed for a holiday, and with Australian data limited to tier-2 releases, the Australian dollar should have a relatively quiet day.
It was another strong week for the Australian dollar, which rose 1.62%. A strong Australian retail sales report on Friday helped the Aussie end the week with strong gains. April retail sales rose 0.4%, marking a fourth successive month of sales gains. This points to solid consumer spending despite rising inflation. Still, there is a concern that businesses will have to pass on higher costs to their customers, which will crimp consumer spending if inflation doesn’t peak soon.
For RBA policy makers, curbing inflation expectations is no less important than curbing inflation. If inflationary pressures are broad-based, there is the danger that inflation expectations will continue to accelerate and boost actual inflation.
Consumer spending, PCE price index weigh on US dollar
The week ended with solid consumer data out of the US, which has boosted risk sentiment and pushed the US dollar lower. Personal Spending rose 0.9% in April, above the forecast of 0.7%. The Core Personal Consumption Expenditures for April was unchanged with a gain of 4.9%. These readings indicate that consumer spending remains steady despite high inflation.
Investors also seized on the Core PCE Price Index for April, considered the Fed’s favorite inflation indicator. The index came in at 4.9%, down from 5.2% (4.9% exp.). This is the index’s first decline in 17 months. Although one reading does not make a trend, other inflation indicators also have dropped – April CPI and core CPI were both lower than in March, for example. It’s too early to tell if we have hit that long-sought-after inflation peak, but the markets have nonetheless lowered their expectations of Fed hikes, which has weakened the US dollar.
AUD/USD Technical
- 0.7207 is under pressure in resistance. Above, there is resistance at 0.7252
- There is support at 0.7121 and 0.7076
USD/JPY Outlook: Fresh Strength Suggests that Corrective Pullback Might be Over
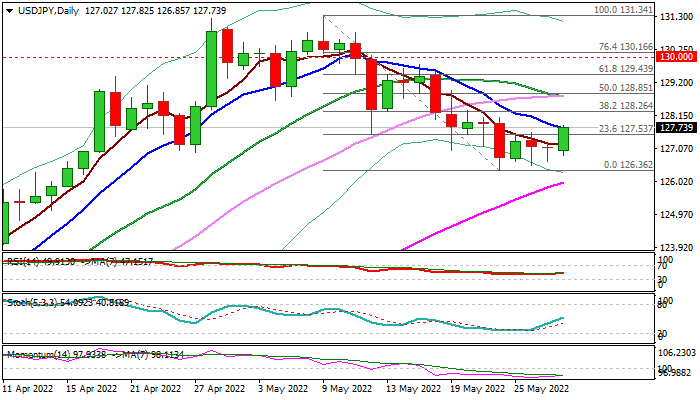
Bulls started to gain traction after pullback from 20-year high (131.34) found firm ground at 126.60/40 zone and fresh strength emerged on Monday.
Yen came under renewed pressure on rising prices of crude oil and a gap between the monetary policies of Fed and BoJ, which is likely to further widen, as the US central bank is hawkish while the Bank of Japan keeps the ultra-easy policy.
Daily techs started to improve as 14-d momentum turned north from deep negative territory and the larger action remains underpinned by rising and thickening daily cloud, however, fresh bulls need more evidence to generate positive signal.
Close above cracked 10DMA (127.73) is seen as initial requirement, with lift and close above 128.26 (Fibo 38.2% of 131.34/126.36 pullback) to further strengthen near-term structure and generate initial reversal signal.
Res: 127.94; 128.26; 128.85; 129.43.
Sup: 126.85; 126.31; 126.00; 125.82.
New German Inflation Record Did Not Scare off Euro Buyers
A preliminary estimate showed that German inflation continues to pick up, reaching 7.9 y/y in May. This is a new inflation record since 1951, and the reading was also above the forecast of 7.6%.
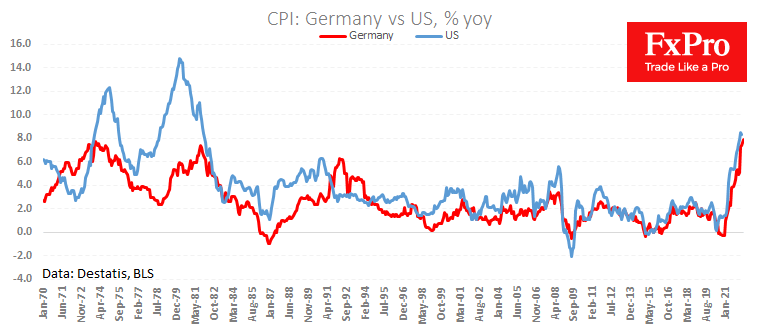
A separate release of import prices noted an acceleration of this type of inflation from 31.2% to 31.7%. Although it was slightly lower than the expected 32.0%, this extreme reading was not only due to a jump in energy and food prices but also to a 15% fall in EURUSD over the past 12 months.
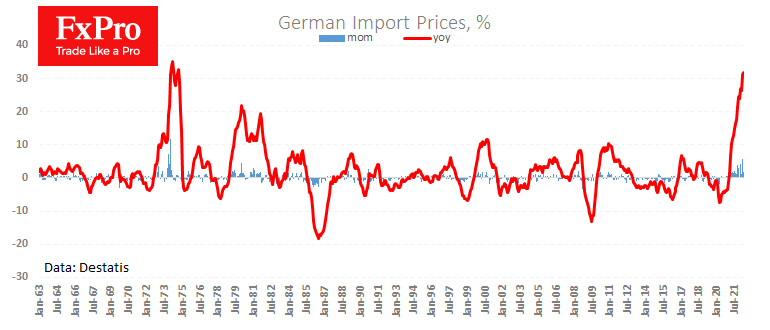
Historically, EURUSD has fallen in this way, with even more amplitude several times, but as a rule, it was during times of economic recession. Now we are seeing one of the rare instances of the single currency failing in a growing economy, which further inflates the sails of inflation.
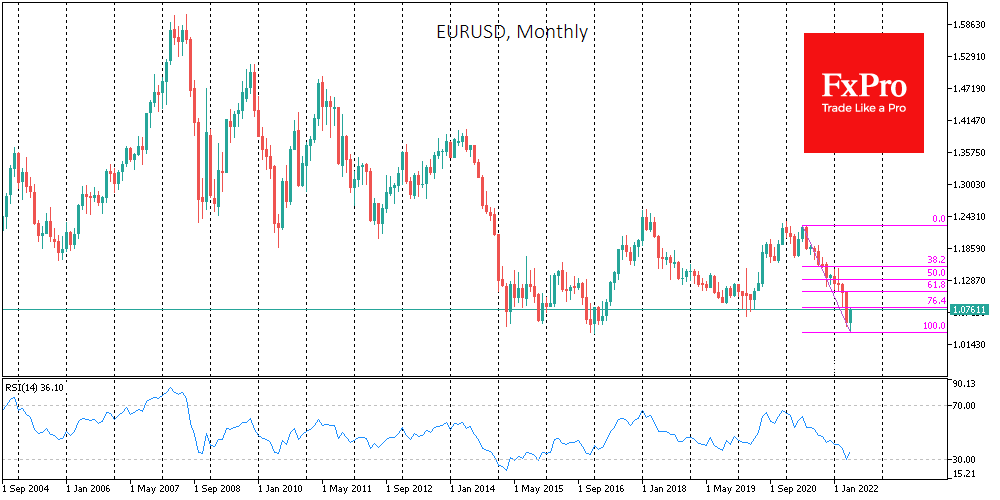
With such inputs, there remains pressure on the ECB for more dramatic monetary policy tightening measures.
Perhaps a hawkish U-turn by the European Central Bank is now the most plausible way to halt the weakening of the EURO and contain inflation.
And it seems that the ECB is just in the process of this turn, forming the basis for buying the euro against the dollar and pound after touching multi-year lows earlier in April and May.
Sunset Market Commentary
Markets
US markets are closed for Memorial Day today, putting the spotlight on first national inflation figures from several EMU countries in May. The monthly inflation dynamic accelerated again in Spain (0.7% M/M), Belgium (0.77% M/M) and Germany (1.1% M/M), resulting in fresh multidecade peak levels for Belgium (8.97% Y/Y) and Germany (8.7% Y/Y). The price pressure outpaced market expectations. Spanish core inflation reached a new high at 4.9% Y/Y, pointing to the broadening inflation problem. Today’s numbers imply that the euro zone figure will easily pass the 8% Y/Y bar from 7.5% Y/Y in April and compared with 7.8% Y/Y consensus. The national inflation prints immediately put selling pressure on European bonds across the complete curve. German yields add 7.5 bps (30-yr) to 10.5 bps (5-yr). The 2-yr yield sets a new cycle high at 0.45%. The German 10-yr yield escapes on the upside from a closing triangle pattern, paving the way back to the May recovery high at 1.19% and longer term resistance at 1.24% (38% retracement on 2008-2020 decline). 10-yr yield spread changes vs Germany are broadly unchanged with Italy underperforming (+3 bps). European money markets added to their ECB policy tightening bets. The Euribor 3-month forward curve shifts up to 10 bps higher for the Sep2023 contract with expectations for the policy rate peak now shifting from 1.5% towards 1.75%. Markets also very cautiously start betting on the possibility of an increased pace in the ECB tightening cycle in September. ECB chief economist Lane, amongst the most dovish governors, calls increases of 25 bps in the July and September meetings as the benchmark pace. ECB Lagarde in last week’s blog post didn’t rule out an acceleration by framing it as exiting negative interest rates by the end of the third quarter and stressing that pace and overall scale of interest rate hikes cannot be determined ex ante. The euro made a new attempt to take out support-turned-into-resistance at 1.0758. Despite the significant interest rate support and the absence of US investors, a firm break didn’t occur yet. The pair set an intraday high at 1.0780. The March low of 1.0806 immediately arrives as next resistance. EUR/GBP is only marginally stronger, flipping sides around the 0.85 big figure. European stock markets opened strong on the back of Friday’s WS gains and this morning’s constructive Asian session, but failed to build momentum given the bond sell-off. Main indices currently record 0.5% gains. The EuroStoxx50 nevertheless trades above the incoming downward trend line since the start of the year. A confirmed break makes the picture more neutral short term with recovery potential towards slightly above 4000 (62% retracement on YTD move and end of March high.
News Headlines
Belgian national inflation accelerated from 8.31% in April to 8.97% Y/Y in May (0.77% m/m). The fastest price increase since August 1982 wrongfooted those hoping the stabilization in April preceded a topping out process. Energy (+4.8 ppts) and food (+1.26 ppts) were among the biggest contributors. That said, inflation stripped for these two categories, also quickened from 4.08% to 4.43% with prices in the services sector advancing ever more rapidly (4.31% from 3.96%). Rents rose by 2.93%, more than the 2.62% last month. Measured by European standards, Belgian harmonized CPI came in at 9.9%, nearing the double digits for the first time since the series began in 1992.
Swedish real GDP contracted by 0.8% q/q in the first quarter of the year, more than the 0.4% analysts expected. It follows an upwardly revised 1.2% in 2021Q4. Sweden’s economy is still 3% bigger than one year ago. All components weighed on growth: exports rose 1% q/q but was more than offset by searing imports (2.8%), resulting in a negative net export contribution (-0.7 ppts). Household and government consumption fell 0.4% and 0.3% respectively while capital formation contracted by 1.3%. Despite falling below their growth estimates, the figure today won’t throw the Riksbank off track. Inflation (6.4% in April) became a top priority for the central bank. It started raising rates last month and will do so at least at every of the remaining policy meetings this year. The Swedish krone strengthens marginally to EUR/SEK 10.51 today. Swedish swap rates add 3.7 to 5.8 bps across the curve, lagging the EU move.