Sample Category Title
Crude Oil Updates the Highs
This week is starting with new highs in Brent – the asset has reached the highs of 9 March 2022 and updated $120.
There are several factors that support oil bulls – they are pretty clear but market players are still building on them. Increasing car traffic in the US due to the start of a travel season make the demand for fuel go up even when retail prices for energy are high. At the same time, the supply shortage in the domestic market didn’t go anywhere and it’s another thing that keeps prices “in suspense”.
In addition, investors aren’t forgetting about a possible oil embargo against Russian oil by the European Union. The suspense is getting more intense, and investors will remain nervous as long as it’s here.
The latest report from Baker Hughes confirmed that the shale industry remained rather inactive, although the volumes were slowly increasing. Over the past week, the Oil Rig Count in the US decreased by 2 units, down to 574. In Canada, the indicator increased by 15 units, up to 55.
Technical analysis – Brent oil
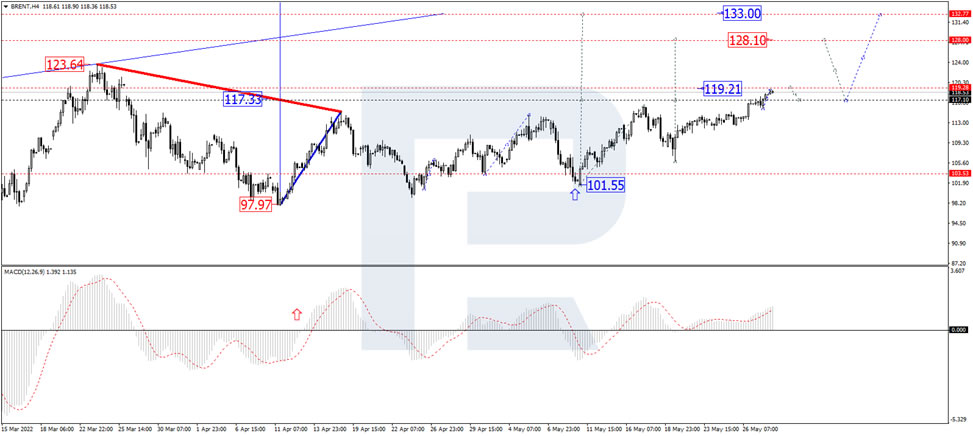
In the H4 chart, after forming a new consolidation range around 117.00 and breaking to the upside, Brent is expected to expand it up to 119.30 and may later fall to test 117.30 from above. After that, the instrument may resume moving within the uptrend with the target at 123.00 or even extend this structure up to 128.88. From the technical point of view, this scenario is confirmed by MACD Oscillator: its signal line is growing above 0 within the histogram area, which means that the uptrend in the price chart may continue.
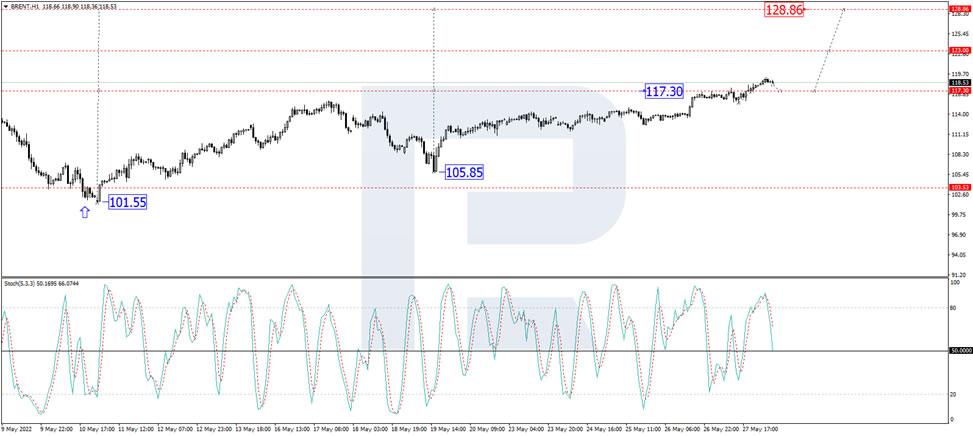
As we can see in the H1 chart, having rebounded from 117.10, Brent is growing to break 119.30. and may later continue trading upwards with the target at 123.00. From the technical point of view, this idea is confirmed by the Stochastic Oscillator: its signal line is moving below 80 and may later continue moving downwards to rebound from 50. After that, the line is expected to resume growing and reach 80.
EURUSD Tests March Boundary; Bias Encouraging
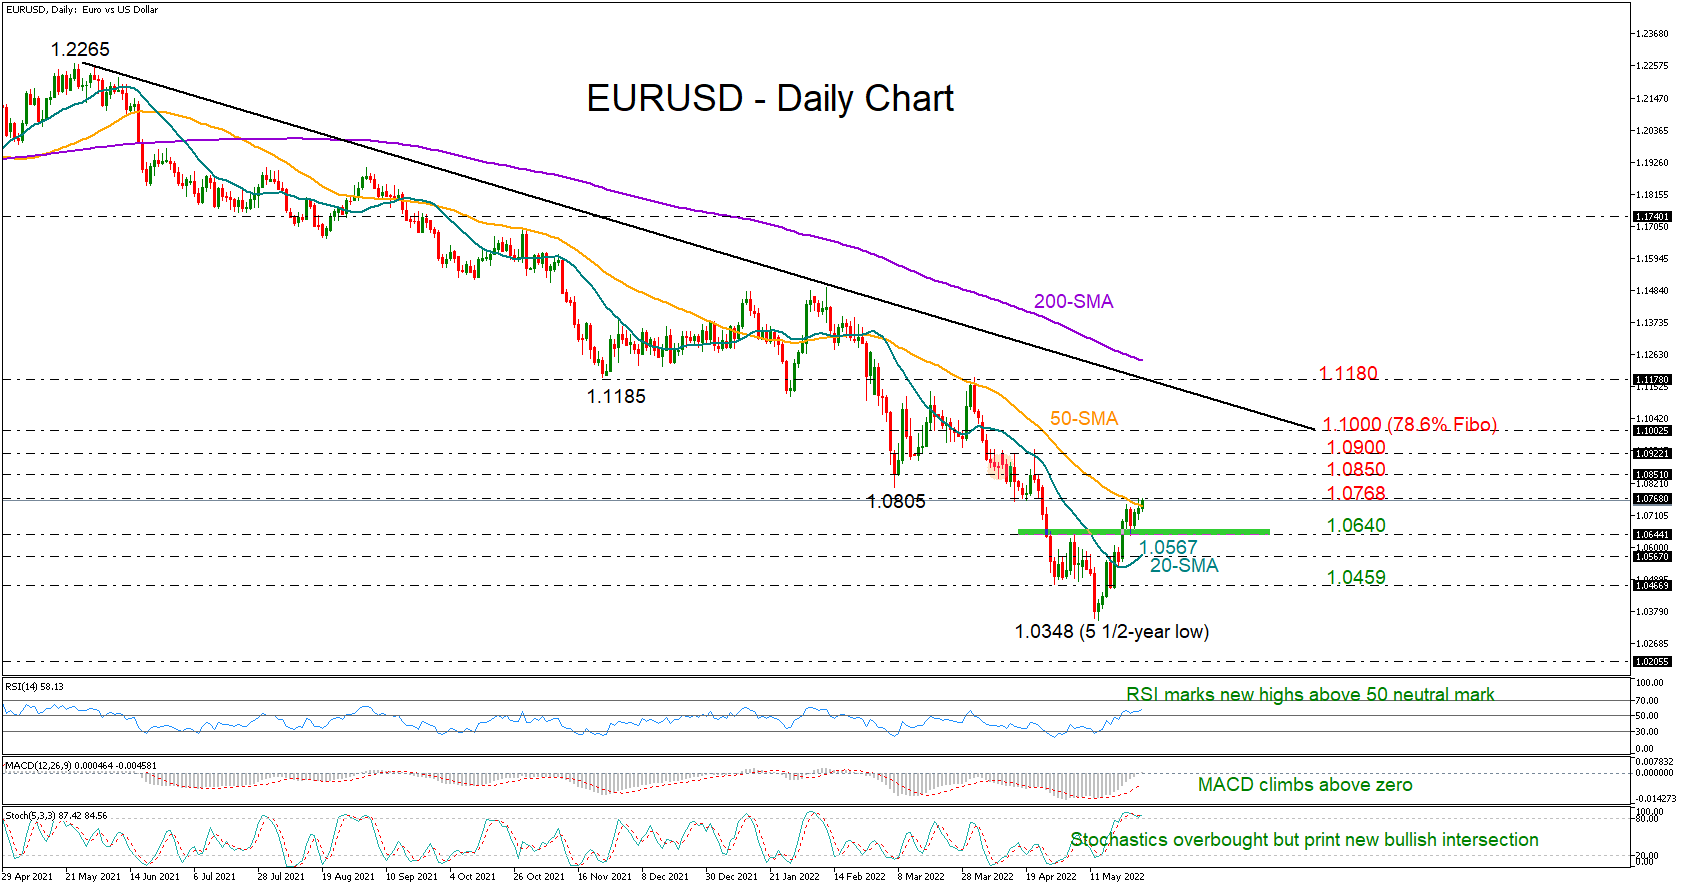
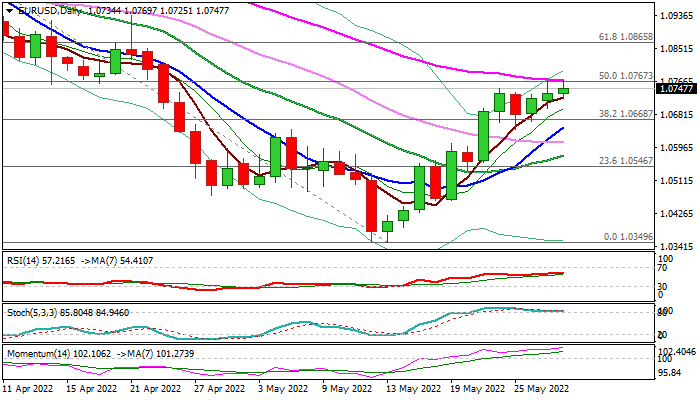
EURUSD opened with low volatility on Monday, remaining muted marginally below the 50-day simple moving average (SMA) and the 1.0768 key resistance level for the fifth consecutive session after securing two bullish weeks.
Despite the ongoing restrictions on the upside, the latest bounce on the former boundary of 1.0640 keeps buying interest alive. The momentum indicators are sending positive vibes as well; the MACD is trying to expand in the positive area for the first time since February, while the RSI is printing new highs above its 50 neutral mark.
Of course, some caution is still required as the Stochastics fluctuate in the overbought territory, though given the progressing positive intersection between the %D and %K lines, any negative correction could come with some delay, helping the pair to gain further ground before the next bearish round.
A decisive close above the 50-day SMA, which triggered the sell-off at the end of March, could initially pause somewhere between 1.0850 and 1.0900. Should the rally pick up steam above 1.1000 too, all eyes will shift to the tentative descending trendline currently seen around the March peak of 1.1180. Notably, the 200-day SMA at 1.1240 is converging towards the same area.
Should the bulls lose the battle at 1.0768, the pair may again seek shelter near the 1.0640 support zone. If that fails to hold, the 20-day SMA at 1.0567 may immediately come to the rescue. Otherwise, the focus will turn to the 1.0459 floor, where any break lower is expected to bring the 5½-year low of 1.0348, and therefore the long-term downtrend off 1.2348 under examination.
Summarizing, EURUSD is maintaining some optimism despite the latest congestion. A successful step above the 50-day SMA may confirm additional upside moves.
USDJPY Holds Within Ascending Channel in Near Term
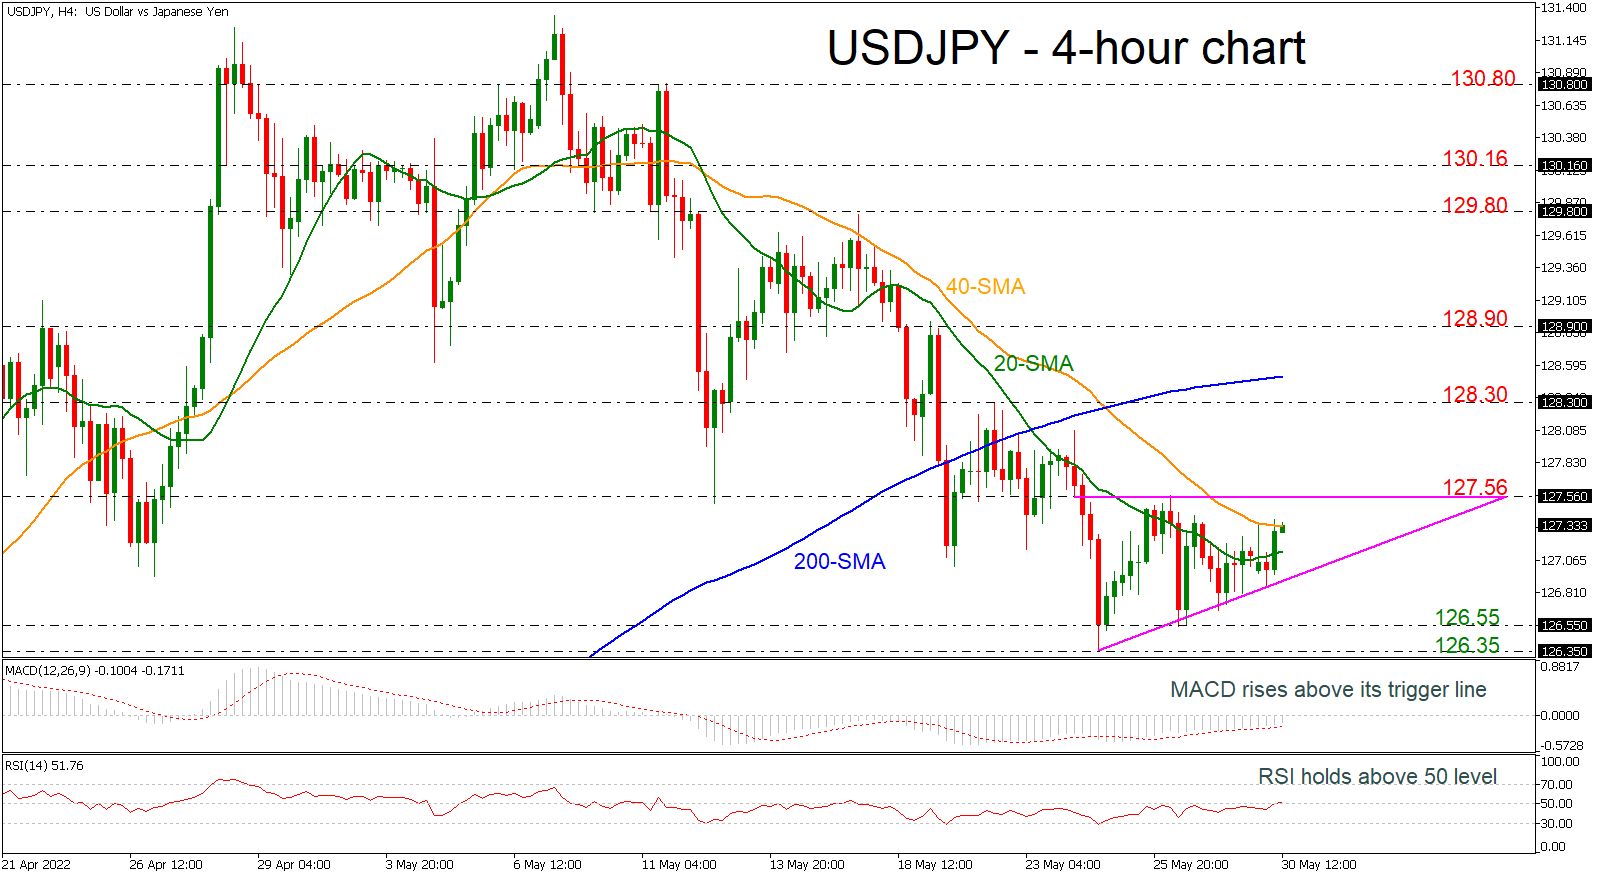
USDJPY is trying to create an ascending channel in the short-term, with strong resistance near the 127.56 barrier. The latest higher lows are showing some improvement and the moving averages are turning higher as well. The MACD oscillator is strengthening its positive momentum, while the RSI is surpassing above the neutral threshold of 50.
In case of an upward attempt, USDJPY would likely meet resistance at the 127.56 barrier, before posting a higher high at 128.30 and at the 200-period SMA currently at 128.50. A break above this line would ease downside pressure, while a climb above 128.90 would help the short-term bias to a bullish one.
Immediate support is being provided by the uptrend line near 127.00. However, should prices dip lower again, the next support would likely come from the 126.55 level. Further decreases would open the way for the 126.35 obstacle.
In the medium term, the bearish outlook remains intact and only a jump beyond the 200-period SMA may change the outlook to positive.
S&P500’s Bulls Awakening. Will Tech Analysis Beats Fundamentals?
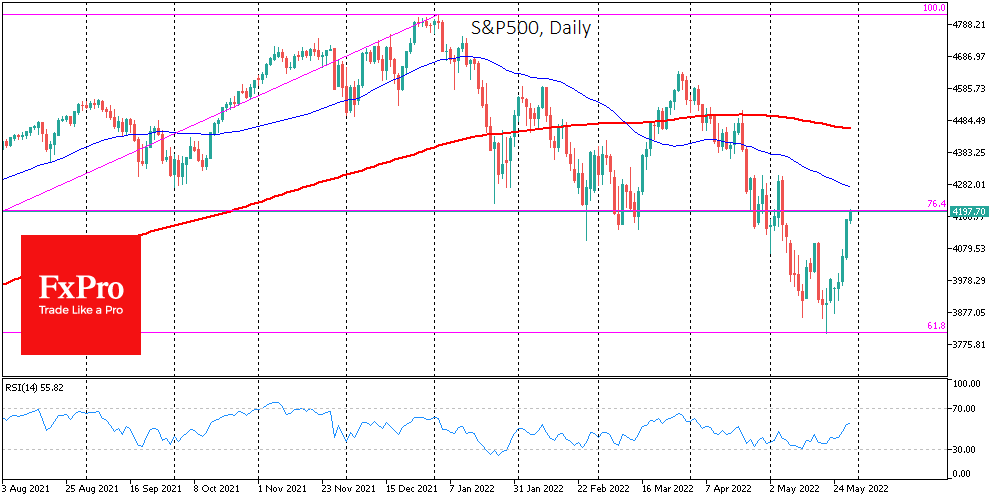
US stock indices developed a strong rebound all last week. The S&P500 spot index reached 4200, gaining more than 10% from the lows of May 20.
Such a rapid recovery has raised the question of whether we are seeing a brief bear market rally or whether the markets have passed the “bottom” of the correction. The situation looks like touching bear market territory was a red rag for the bulls, who have since turned to aggressive action.
Fundamental factors are now on the side of the former, while technical analysis favours the latter scenario.
Monetary authorities in the USA and other developed economies are increasing the pace of monetary policy tightening, focusing on fighting inflation rather than supporting economic growth. We continue to get bearish signals from this perspective, as the economy and markets have yet to feel the brunt of rates not seen in over ten years. Meanwhile, inflation and a slowdown in consumer demand due to high rates promise to eat into real corporate profits in the coming months. The tipping point in consumer activity is unlikely to come before we hear from the Fed that there will be no further rate hikes.
The S&P500 index has perfectly touched 61.8% of the rally from the lows of March 2020 to January 2022. We have seen some rallies in a falling market during the five-month decline. But so far, touching the formal bear market area (20% decline from the peak) in the S&P500 has attracted buyers.
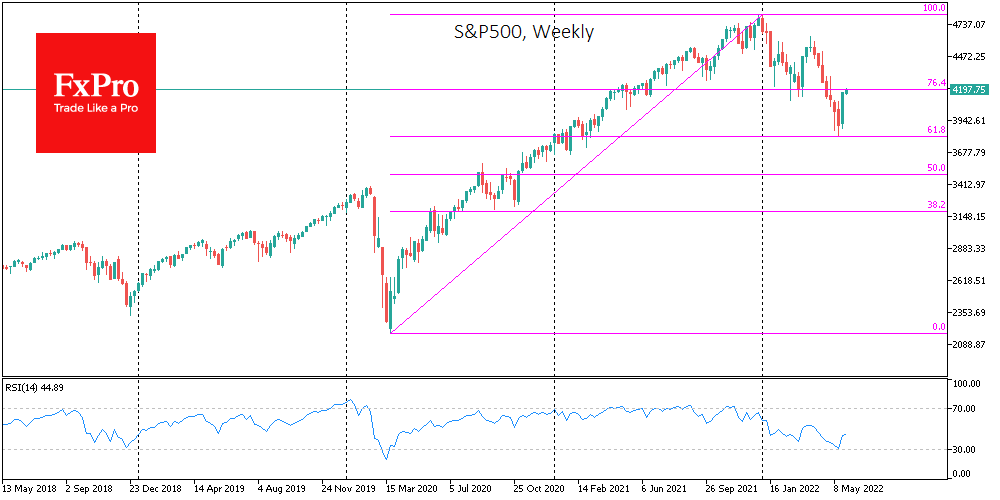
Moreover, by the time the lows were touched earlier this month, the market was already oversold, but there were also signs of divergence between the RSI on the daily timeframes and the index level. This is a clear indication that the selling was not as fierce as before.
The very fact that the S&P500 took a 7-week-long losing streak, one of the longest in history, and has now shown a sharp rebound, is setting a positive mood. The last time we saw such a bullish awakening was in November 2020, after which the stock market added for more than a year, even though there seemed to be no room for growth.
WTI Oil Hits 9-Week High as Traders Focus on EU Meeting on Russian Sanctions
WTI oil price rose to a nine-week high in early Monday, maintain bullish stance following last week’s 4.2% rally.
Traders focus on today’s EU summit, in which bloc’s leaders will try to reach an agreement on the sixth package of sanctions on Russia, on banning completely the imports of Russian oil.
So far, the EU leaders were not united in the decision, as it is still very difficult for the EU to reduce its energy dependency on Russian energy in the near-term, with the most dissonant tones coming from the Hungary and neighboring countries.
The oil market is already tight, amid rising demands for gasoline and diesel ahead of summer driving season and decision of OPEC+ bloc to stick to its existing plan for a limited output increase, with potential agreement on ban of Russia’s oil, to worsen the situation and send oil prices higher.
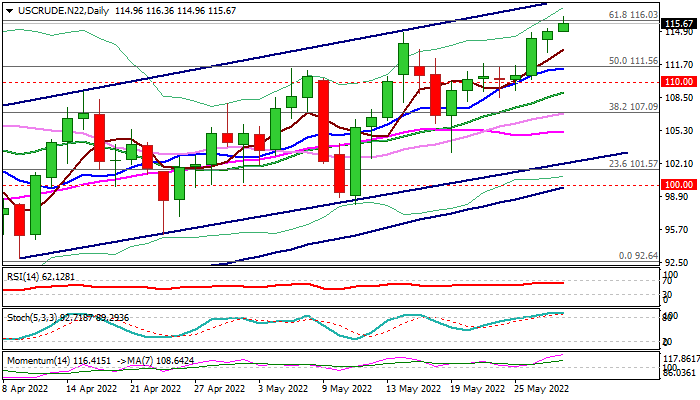
Technical picture remains positive on a daily chart, as bullish momentum continues to rise and moving averages are in full bullish setup, although overbought stochastic warns that bulls may lose steam as cracked barrier at 116.03 (Fibo 38.2% of $130.48/$92.64) marks significant obstacle.
Bulls may take a breather here, but expected to remain intact for break higher and acceleration towards targets at 118.02/120.00 (the bull-channel upper boundary / psychological).
Broken Fibo 50% level at 111.56 is reinforced by rising 10DMA and marks good support, which should contain potential dips and keep larger bulls intact.
Res: 116.03; 116.60; 117.40; 120.00
Sup: 114.80; 113.16; 111.56; 110.00
Gold’s Propelling Forces Pause Above 200-day SMA
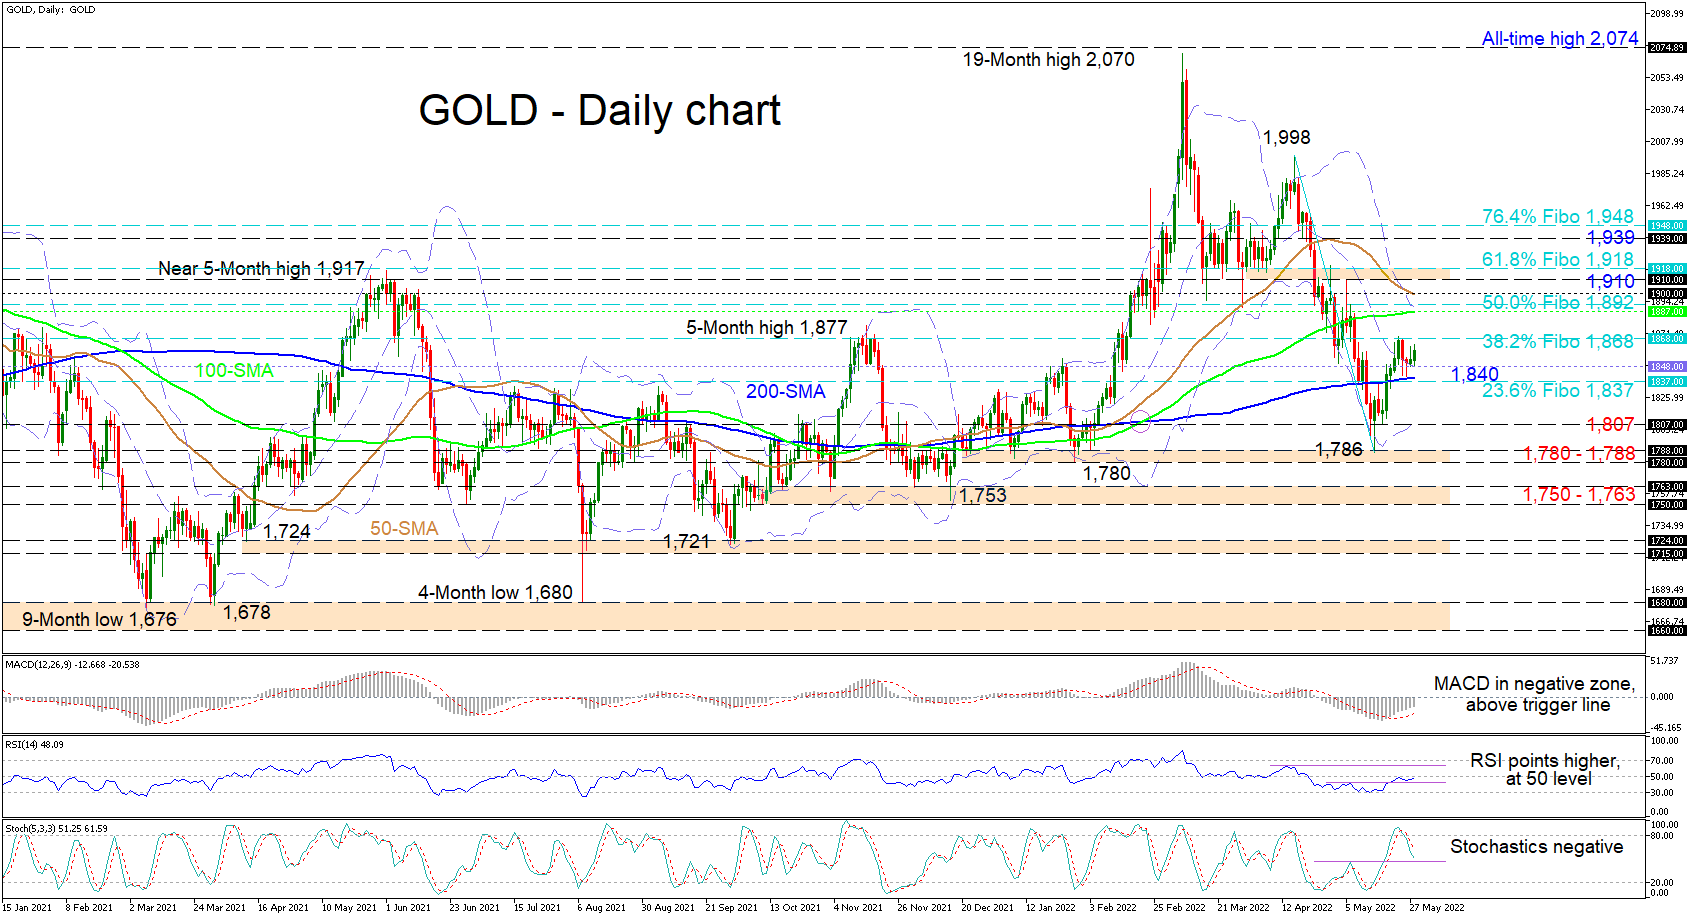
Gold is consolidating between the 1,837 and the 1,868 barriers, which are the 23.6% and the 38.2% Fibonacci retracement levels of the down leg from 1,998 until 1,786. The price is trading above its mid-Bollinger band at 1,848, after finding footing off the 200-day simple moving average (SMA) at 1,840. The SMAs are painting a picture that is lacking a clear trend, as the 100- and 200-day SMAs are sponsoring a positive bearing, while the falling 50-day SMA is aiming to complete a bearish crossover of the 100-day SMA.
The short-term oscillators are conveying mixed messages in directional momentum. The MACD, south of the zero threshold, is suggesting bullish forces are strengthening, while the RSI is indicating buyers are currently in control. Meanwhile, the negatively charged stochastic oscillator is backing additional downward price moves in the pair.
In the positive scenario, resistance could commence at the 38.2% Fibo of 1,868 that is in line with the May 24 high. Climbing further, the bulls may then encounter a fortified zone of resistance between the 100-day SMA at 1,887 and the 1,900 handle, an area that encompasses the 50-day SMA, the upper Bollinger band and the 50.0% Fibo of 1,892. In the event the price lifts beyond this boundary, a nearby resistance band linking the 1,910 high with the 61.8% Fibo of 1,918 could try to impede positive developments from tackling the 1,939 inside swing low and the nearby 76.4% Fibo of 1,948.
On the flipside, if the price recoils beneath the mid-Bollinger band at 1,848, coupled support could transpire from the 200-day SMA and the 23.6% Fibo at 1,837. Dipping lower, the bears may then eye the 1,807 obstacle, where the lower Bollinger band also resides, prior to targeting the 1,780-1,788 support base that extends back to the second half of December 2021. Breaching this key foundation, the 1,750-1,763 support border could then come under strong fire from sellers.
Summarizing, Gold is exhibiting a neutral demeanour, trading within the 23.6% and the 38.2% Fibonacci retracement levels. For the precious metal to revive a clearer direction, the price would need to break either below the 23.6% Fibo at 1,837 or above the 38.2% Fibo at 1,868. A drop in the price underneath the 1,780-1,788 boundary could reinforce negative tendencies, but a climb north of the 1,900 hurdle is required to boost buyers’ confidence.
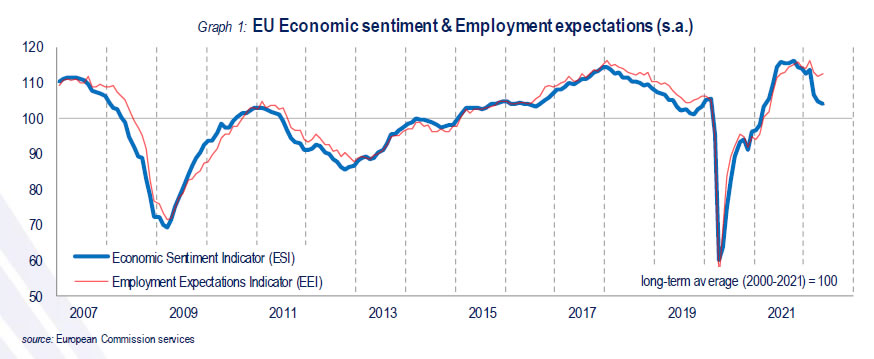
Eurozone economic sentiment ticked up to 105 in May, EU down to 104.1
Eurozone Economic Sentiment Indicator ticked up from 104.9 to 105.0 in May. Employment Expectations Indicator rose from 112.6 to 112.9. Industrial confidence dropped from 7.7 to 6.3. Services confidence rose from 13.6 to 14.0. Consumer confidence rose from -22.0 to -21.1. Retail trade confidence dropped from -3.9 to -4.0. Construction confidence rose from 7.0 to 7.2.
EU Economic Sentiment dropped from 104.6 to 104.1. Amongst the largest EU economies, the ESI rose markedly in Spain (+4.1) and, to a lesser extent, in France (+1.5) and Italy (+0.8), while it remained
EUR/USD Outlook: Bulls Remain in Play But Face Strong Headwinds
The Euro remains constructive in early Monday’s trading following strong advance in past two weeks, but bulls are facing headwinds from pivotal barrier at 1.0767 (50% retracement of 1.1184/1.0349/falling 55DMA).
Weaker dollar continues to underpin the single currency, along with bullish daily techs (rising positive momentum/multiple bull-crosses formed by 5/10/20/30 DMA’s), but bulls need a breakthrough 1.0767 to signal an extension of near-term recovery towards next strong barriers at 1.0865/78 (Fibo 61.8% of 1.1184/1.0349 / base of falling and thickening daily Ichimoku cloud).
Solid supports at 1.0668/1.0647 (broken Fibo 38.2%/rising 10DMA) should keep the downside protected to maintain near-term bullish bias.
Res: 1.0767; 1.0800; 1.0865; 1.0878.
Sup: 1.0725; 1.0668; 1.0647; 1.0607.
Is Bitcoin Forming a Reversal Following Stocks?
Bitcoin is down 2.5% over the past week, ending near $29,200. Ethereum lost 10.6%, while other leading altcoins in the top 10 fell from 1% (Polkadot) to 14.8% (Solana).
The total capitalisation of the crypto market, according to CoinMarketCap, sank 2.4% over the week to $1.26 trillion. Bitcoin’s dominance index jumped 1.3 points to 44.9% over the same time due to the better performance of the first cryptocurrency.
The cryptocurrency fear and greed index was down to 10 points by Monday. However, this drop does not consider the positive market performance in the early hours on Monday.
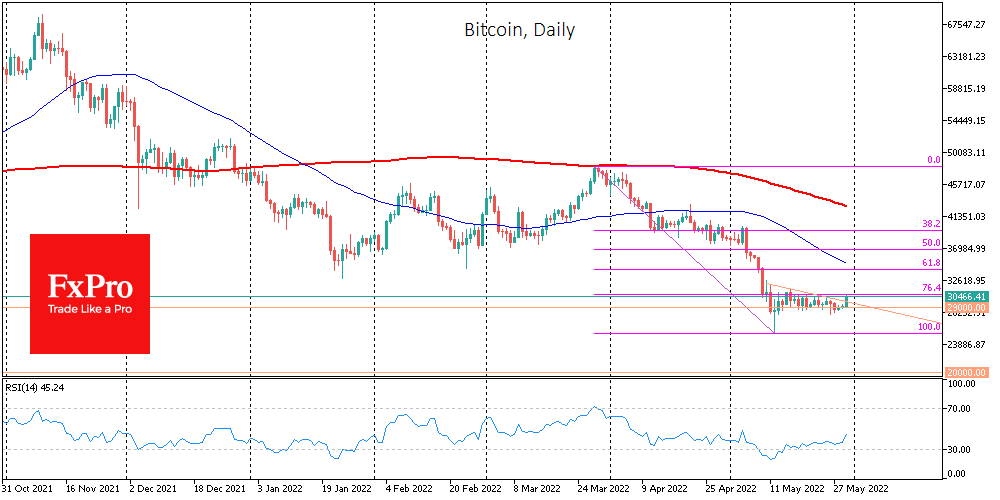
Bitcoin has closed lower for eight consecutive weeks, the longest sell-off streak in the first cryptocurrency’s existence. But the last two weeks have been very tentative declines.
On Monday morning, BTCUSD surpassed the $30K mark again and returned to last week’s highs, breaking above the downside resistance line in a strong move.
It will be premature to talk about a bullish counteroffensive until Bitcoin gets above $30.6K, its horizontal resistance line since mid-May. Renewed risk appetite in global markets is fuelling hopes of a turnaround. Divergence in equity and cryptocurrency dynamics was conspicuous last week, highlighting the weakness of the crypto market.
Dan Held, business development director at crypto exchange Kraken, believes the current crypto crisis is not as severe as previous ones, as institutional players have entered the market in recent years and increased market liquidity. We would add that thanks to the expanded crypto market capacity, we haven’t seen as much of a surge in the bull cycle of 2021 as we did in 2013 and 2017, which explains the not-so-high ‘winter’ losses.
MicroStrategy CEO Michael Saylor said he will always buy bitcoin. According to him, BTC is the most reliable asset in this very volatile world.
Bill Miller, head of investment firm Miller Value Partners, called bitcoin an effective means of accessing financial services regardless of military and economic situations.
Regulation of cryptocurrencies would help with the crisis in the crypto market, according to Deutsche Bank.
Daily Technical Analysis
EUR/USD
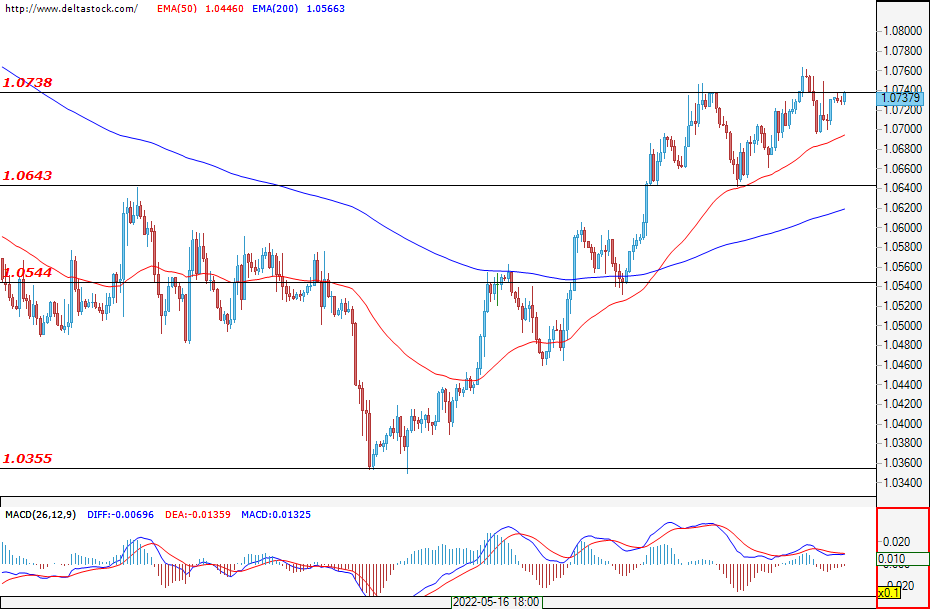
The pair scored a second week of gains and the bulls managed to form a local support at around 1.0640. In the early hours of today, the euro is trading higher and it seems that the bulls are about to overcome the first resistance at around 1.0740. It is possible for the rally to continue and so buyers could test the key resistance at 1.0850. Despite the good performance in recent days, the trend remains negative as seen from the higher time frames. Expectations at the moment are rather negative, and a change in sentiment can be expected only in the event of a breach above 1.0850. The pair could dip for another test of the support at 1.0640. Today, higher activity can be expected around the announcement of the inflation data for Germany at 12:00 GMT. The week is expected to be dynamic, with the most anticipated event in the economic calendar being the data on newly created jobs for the United States, expected to come out on Friday at 12:30 GMT.
USD/JPY
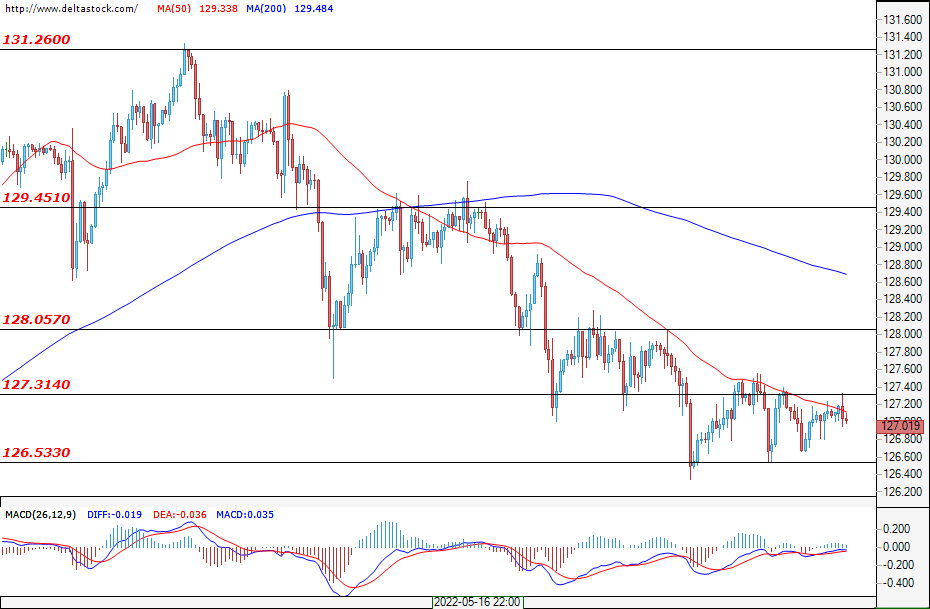
The ninja slowed the decline and prices consolidated above the support at 126.50. This zone is also the main support at the moment, and in case of a breach, the declines can deepen towards 125.00. Declining volatility may be interpreted as an early signal for the end of the correction and so the bulls may continue to once more ride the main trend. A breach of the resistance at 127.30 would confirm the bullish attitudes and the first target of this movement could be the area at around 129.45.
GBP/USD
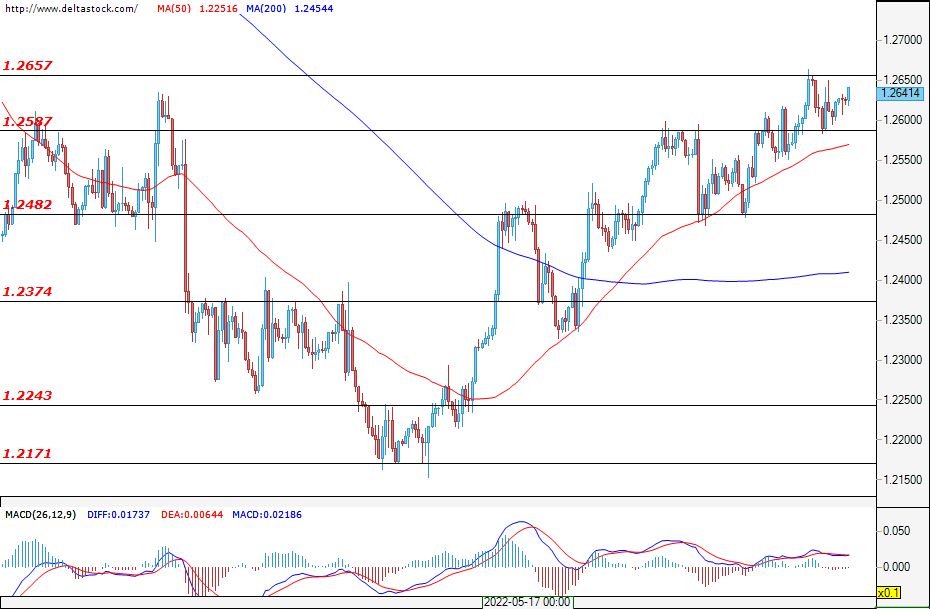
Last week, the Cable managed to overcome the key resistance at 1.2587 and prices are currently holding steady above this level. At the moment, 1.2480 can be considered as the main support, after the zone previously defended itself against the bearish pressure several times in a row. The expectations therefore remain positive, yet a correction from the current levels should still not be ruled out. A breach of 1.2660 could create an opportunity for a rally against the resistance coming from the higher time frames at 1.2980. The bulls can expect their first support for the day to be at 1.2587, while the main weekly ones are 1.2480 and 1.2370.
EUGERMANY40
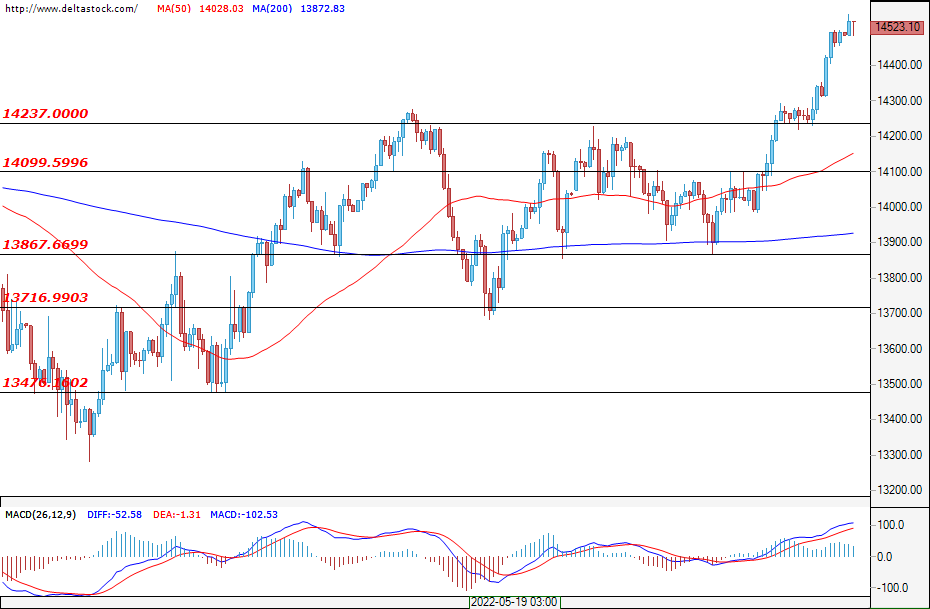
The German index booked some good gains at the end of last week. In the early hours of today, there have been some slight gains as well and the bulls are about to test the resistance at around 14580. It is expected that the area will not be breached from the first attempt and that the bears could regroup and re-enter the market. It is possible for the prices to pull back towards the support between 14280 and – 14240 and the market could enter a range phase. Today, an increase in activity can be expected with the announcement of the consumer price index for Germany at 13:00 GMT.
US30
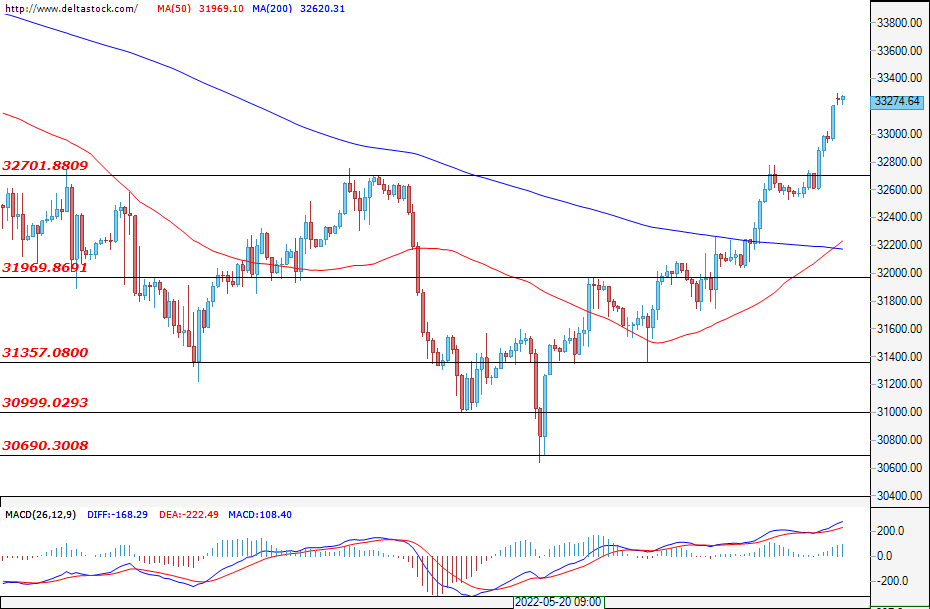
The U.S. blue chips recorded five consecutive days of gains and the bulls managed to overcome the key resistance at 32700. The forecasts are for a retracement movement and a subsequent breach. If it is successful, then investors can expect for prices to reach the 34100 level. Today, the major U.S. stock exchanges will be closed in honour of Memorial Day and so low market activity can be expected. The first support for the bulls is 32700 and the breach of the resistance at 33100 has not yet been confirmed. Keeping prices above this area would significantly improve investor sentiment.