

Sample Category Title
USD/CAD Daily Outlook
Daily Pivots: (S1) 1.2772; (P) 1.2834; (R1) 1.2885; More...
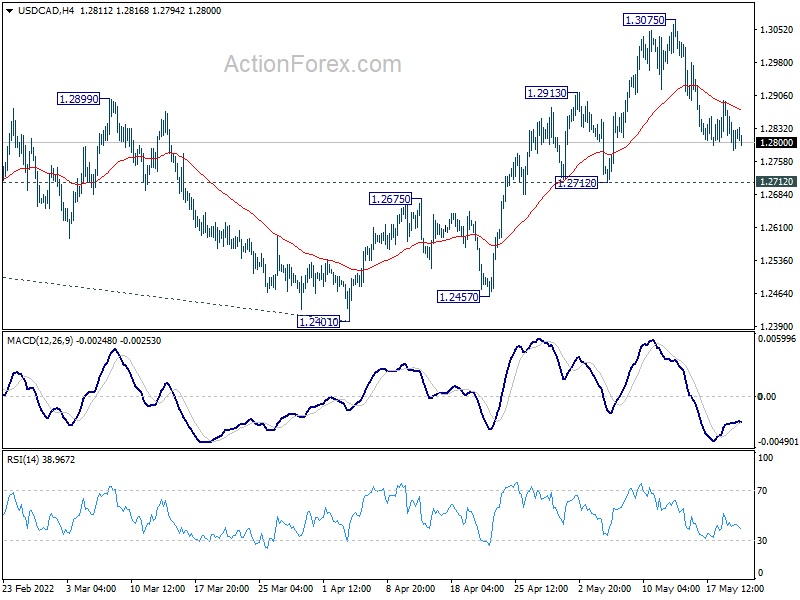
Intraday bias in USD/CAD stays neutral and further rally is in favor with 1.2712 support intact. On the upside, break of 1.3075 will resume the rise from 1.2401. Sustained trading above 1.3022 fibonacci level will carry larger bullish implications. Next target will be 100% projection of 1.2005 to 1.2947 from 1.2401 at 1.3343. On the downside, however, break of 1.2712 support will indicate rejection by 1.3022 key fibonacci resistance, and bring deeper decline back to 1.2401 support.
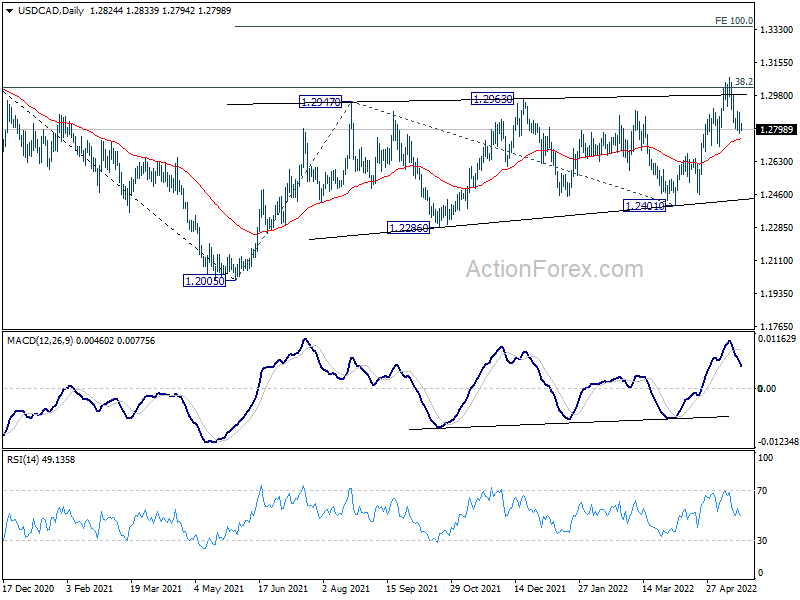
In the bigger picture, focus stays on 38.2% retracement of 1.4667 (2020 high) to 1.2005 (2021 low) at 1.3022. Sustained break there should confirm that the down trend from 1.4667 has completed after defending 1.2061 long term cluster support. Further rise would then be seen towards 61.8% retracement at 1.3650. However, rejection by 1.3022 will maintain medium term bearishness. Break of 1.2005 will resume the down trend from 1.4667 and that carries larger bearish implications too.
AUD/USD Daily Report
Daily Pivots: (S1) 0.6976; (P) 0.7024; (R1) 0.7097; More...
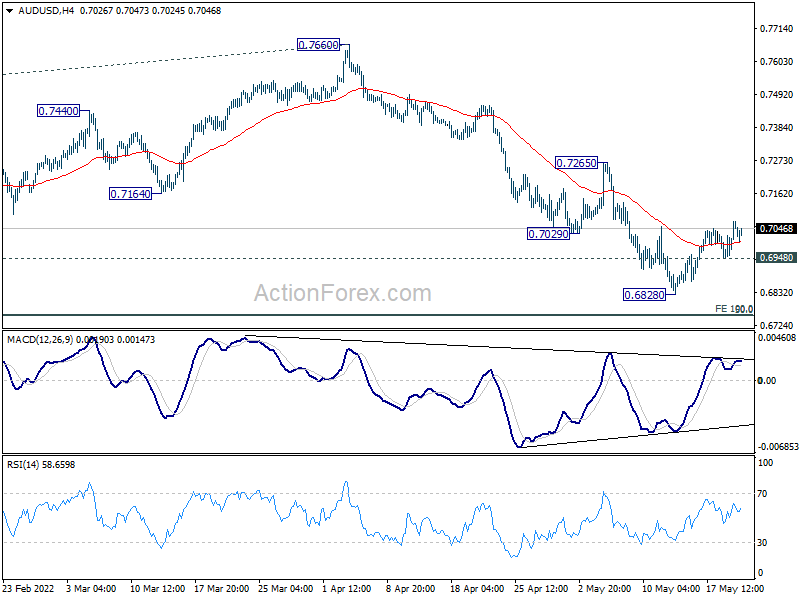
Intraday bias in AUD/USD is mildly on the upside at this point. Rebound from 0.6828 short term bottom would target 55 day EMA (now at 0.7187). On the downside, below 0.6948 minor support will bring retest of 0.6828 support first. Firm break there will resume larger fall from 0.8006, and target 0.6756/60 medium term fibonacci level next.
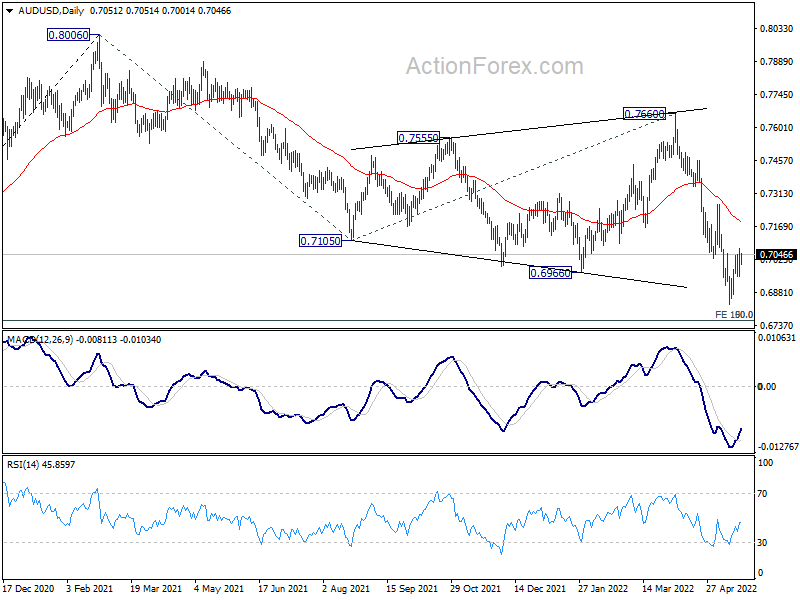
In the bigger picture, price actions from 0.8006 are seen as a corrective pattern to rise from 0.5506 (2020 low). Deeper fall should be seen to 50% retracement of 0.5506 to 0.8006 at 0.6756. This coincides with 100% projection of 0.8006 to 0.7105 from 0.7660 at 0.6760. Strong support is expected from 0.6756/60 cluster to contain downside to complete the correction. However, sustained break of 0.6756/60 would argue that AUD/USD is indeed already in a medium term down trend.
USD/JPY Daily Outlook
Daily Pivots: (S1) 126.92; (P) 127.94; (R1) 128.84; More...
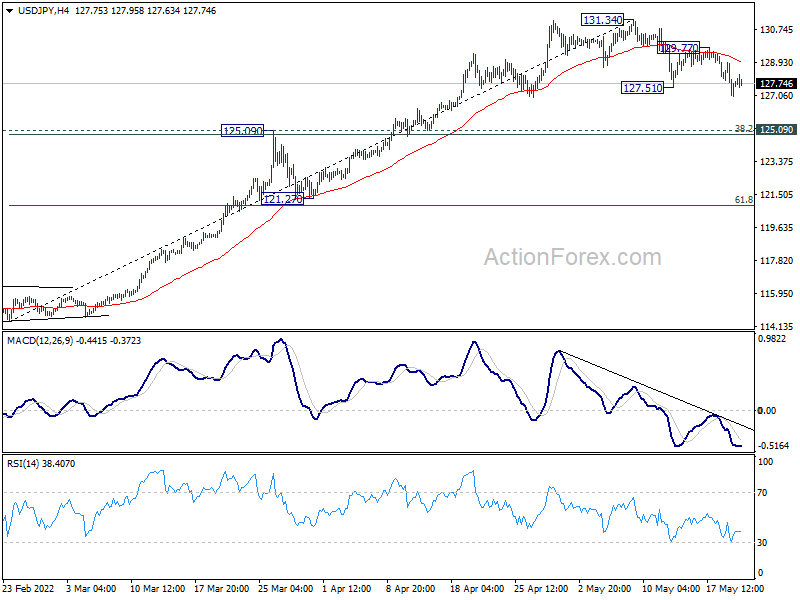
Intraday bias in USD/JPY remains on the downside. Correction from 131.34 would extend lower to 125.09 cluster support (38.2% retracement of 114.40 to 131.34 at 124.86). Strong support is expected from there to contain downside to bring rebound. On the upside, break of 129.77 minor resistance will suggest that the correction is finished and bring retest of 131.34.
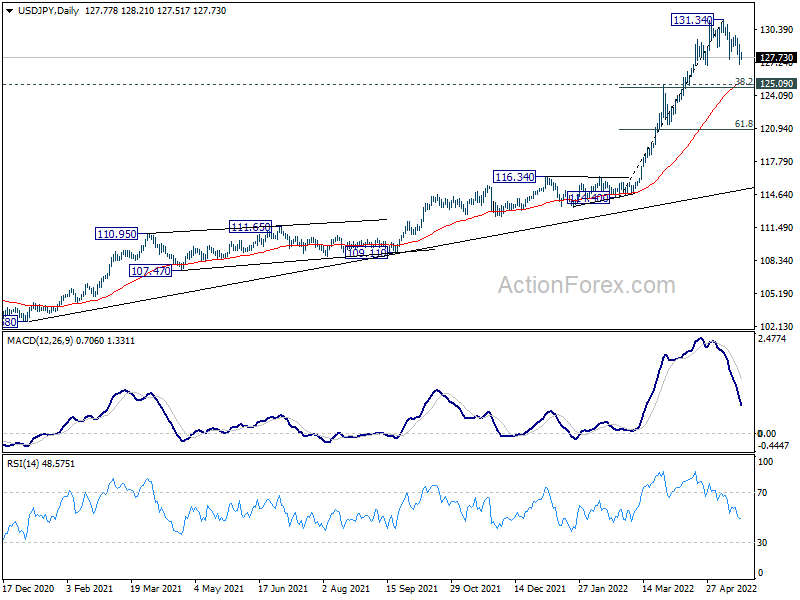
In the bigger picture, current rally is seen as part of the long term up trend form 75.56 (2011 low). Sustained trading above 61.8% projection of 75.56 (2011 low) to 125.85 (2015 high) from 98.97 at 130.04 will pave the way to 100% projection at 149.26, which is close to 147.68 (1998 high). For now, this will remain the favored case as long as 121.27 support holds.
EUR/USD Daily Outlook
Daily Pivots: (S1) 1.0496; (P) 1.0551 (R1) 1.0642; More...
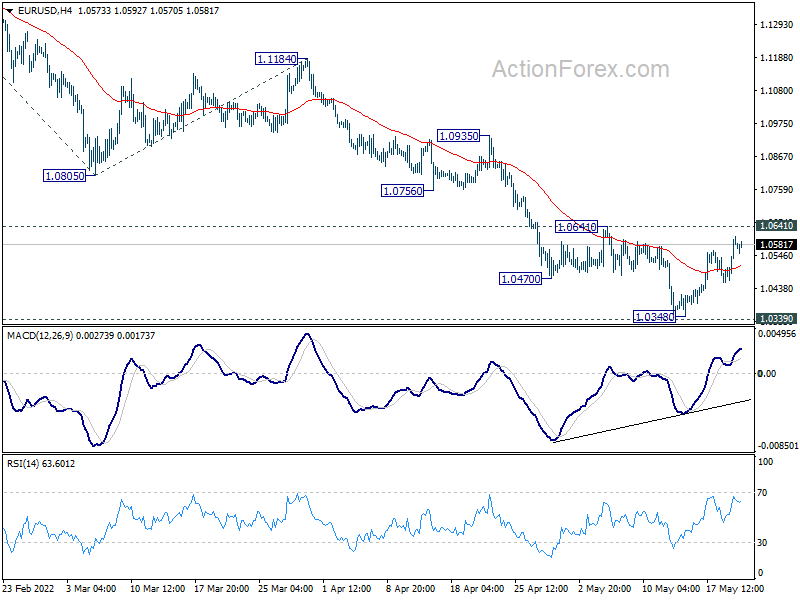
EUR/USD is staying in range above 1.0348 and intraday bias remains neutral first. Considering bullish convergence condition in 4 hour MACD, break of 1.0641 resistance will confirm short term bottoming at 1.0348, ahead of 1.0339 long term support. Intraday bias will be turned back to the upside for 1.0805 support turned resistance. On the downside, however, decisive break of 1.0339 will carry larger bearish implication and target 161.8% projection of 1.1494 to 1.0805 from 1.1184 at 1.0069.
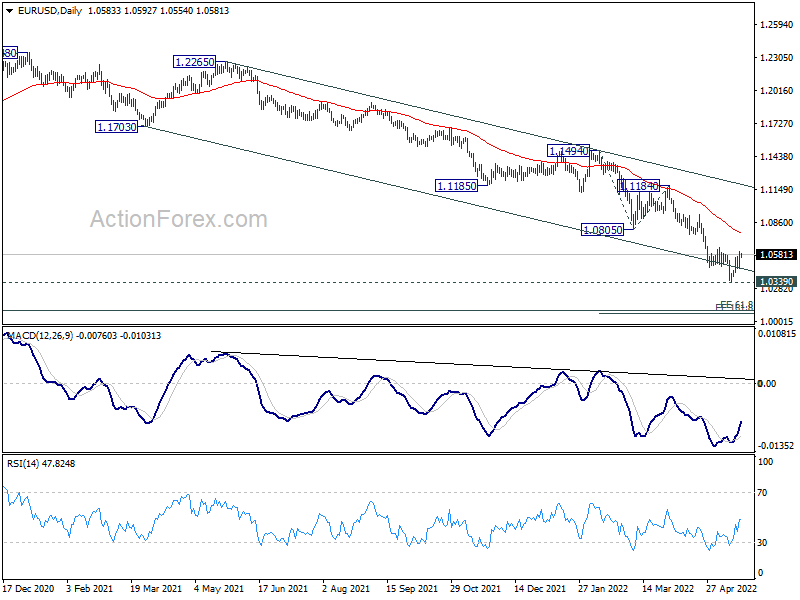
In the bigger picture, break of medium term channel support suggests downside acceleration. Current decline from 1.2348 (2021 high) is probably resuming long term down trend from 1.6039 (2008 high). Decisive break of 1.0339 will confirm this bearish case. Next target is 61.8% projection of 1.3993 to 1.0339 from 1.2348 at 1.0090. This will now remain the favored case as long as 1.0805 support turned resistance holds.
GBP/USD Daily Outlook
Daily Pivots: (S1) 1.2364; (P) 1.2445; (R1) 1.2551; More..
Intraday bias in GBP/USD remains neutral and outlook is unchanged. . Further decline will remain in favor as long as 1.2637 resistance holds. On the downside, break of 1.2154 will resume the down trend from 1.4248. However, considering bullish convergence condition in 4 hour MACD, break of 1.2637 will confirm short term bottoming at 1.2154. Intraday bias will be turned back to the upside for 55 day EMA (now at 1.2789).
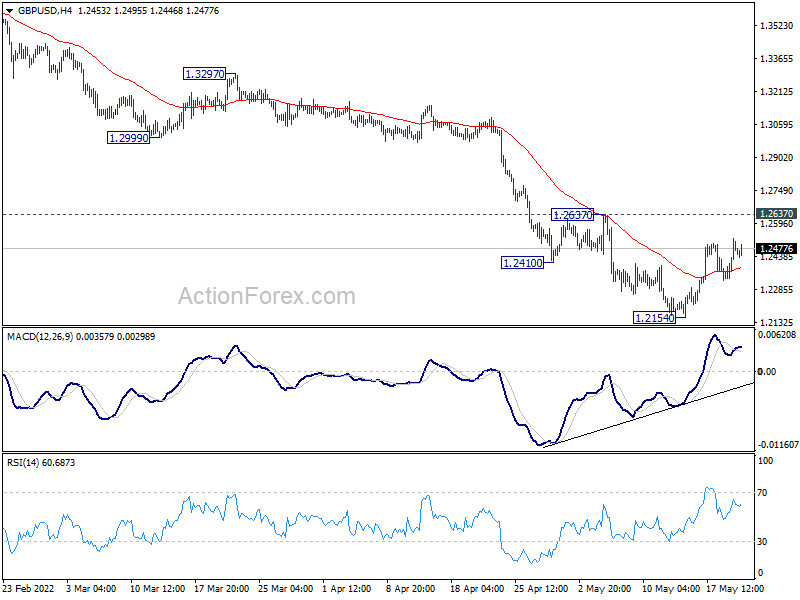
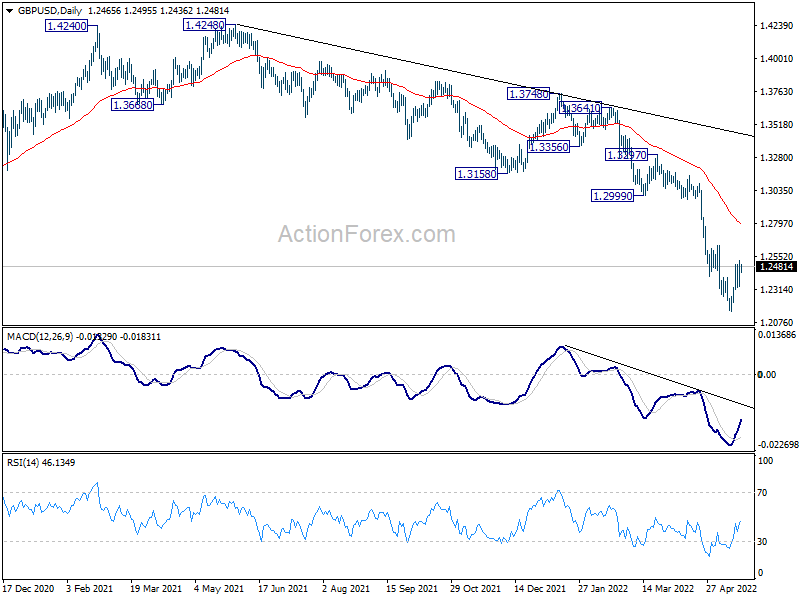
In the bigger picture, based on current momentum, fall from 1.4248 (2018 high) at least at the same degree as the rise from 1.1409 (2020 low). That is, fall from 1.4248 could be a leg inside the pattern from 1.1409, or resuming the longer term down trend. In either case, deeper decline is expected as long as 1.2999 support turned resistance holds. Next target is 1.1409 low.
Sterling Shrugs Strong Retail Sales, Dollar Holding Above Near Term Support
Dollar and Yen traded with an undertone in Asian session today but Aussie is also mildly weaker. On the other hand, Swiss Franc is the stronger one, followed by Kiwi and Canadian. Sterling is treading water despite strong UK retail sales data. Swiss Franc is staying at the winner for the week, on talks that SNB is turning more open for rate hike. Sterling is a distant second. Dollar is the worst performing one, followed by Canadian and Yen.
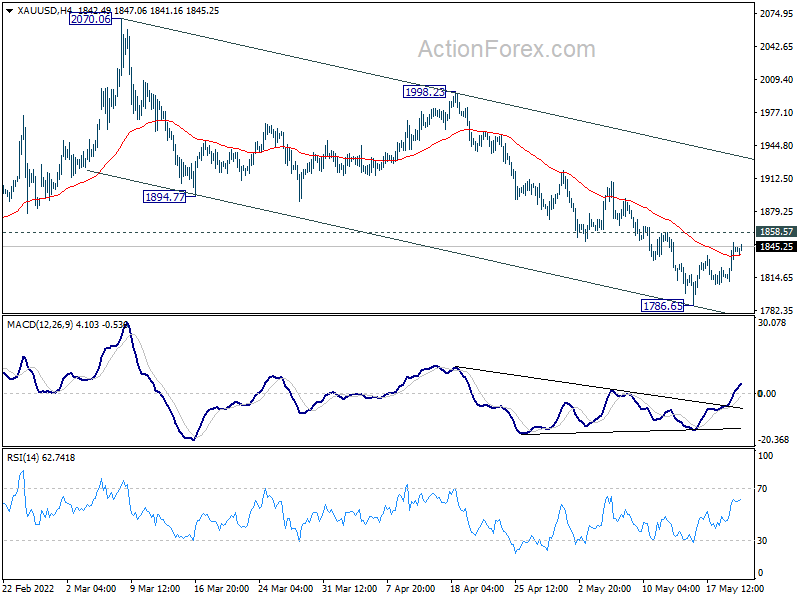
Technically, a big question is on whether Dollar's selloff could gather momentum before weekend to secure more selloff next week. Focuses will be on 1.0641 resistance in EUR/USD, 1.2627 resistance in GBP/USD, and 1.2712 support in USD/CAD. Also, if Gold could break through 1858.57 minor resistance, that could be a hint on Dollar weakness too.
In Asia, Nikkei closed up 1.28%. Hong Kong HSI is up 2.20%. China Shanghai SSE is up 1.26%. Singapore Strait Times is up 1.37%. Japan 10-year JGB yield is down -0.0026 at 0.240. Overnight, DOW dropped -0.75%. S&P 500 dropped -0.58%. NASDAQ dropped -0.26%. 10-year yield dropped -0.031 to 2.855.
UK retail sales rose 1.4% mom in Apr, ex-fuel sales up 1.4% mom
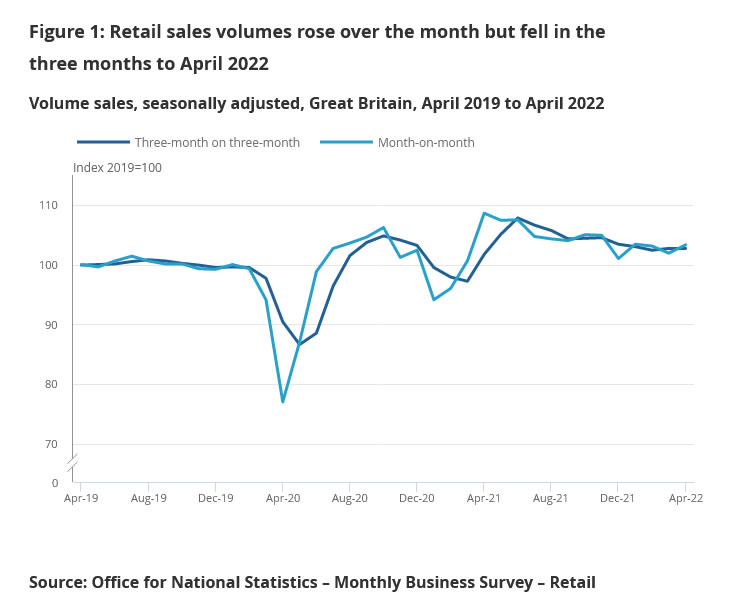
UK retail sales rose 1.4% mom in April, well above expectation of -0.2% mom decline. That's also more than enough to recover the -1.2% mom decline in March. Ex-fuel sales also rose 1.4% mom, versus expectation of -0.2% mom, reversing the -0.9% mom decline in March.
However, for the most recent 3 months on previous 3 months, headline sales dropped -0.3% while ex-fuel sales dropped -0.5%.
From Germany, PPI came in at 2.8% mom, 33.5% yoy in April, above expectation of 1.4% mom, 31.4% yoy.
New Zealand export rose 17% yoy in Apr, imports rose 15% yoy
New Zealand goods exports rose 17% yoy to NZD 6.3B in April. Imports rose 15% yoy to NZD 5.7%B. Monthly trade surplus came in at NZD 584m, versus expectation of NZD -350m deficit.
Exports rose for all top destinations except China, which was down -1.8%. Exports to Australia was up 4.9%, US up 26%, EU up 26%, Japan up 58%.
Import from all top partners rose, including China (up 8.9%), EU (up 18%), Australia (up 44%), US (up 29%), Japan (up 0.5%).
Japan CPI core rose to 2.5% yoy in Apr, CPI core-core rose to 0.8% yoy
Japan headline CPI (all items) rose from 1.2% yoy to 2.5% yoy in April. CPI core (ex-fresh food) rose from 0.8% yoy to 2.1% yoy. CPI core-core (ex-fresh food, energy) rose from -0.7% yoy to 0.8% yoy.
The 2.1% CPI core reading was slightly above expectation of 2.0% yoy. It topped BoJ's 2% target for the firs time since March 2015. Also, it should be noted that CPI core-core was positive for the first time since July 2020.
GBP/USD Daily Outlook
Daily Pivots: (S1) 1.2364; (P) 1.2445; (R1) 1.2551; More..
Intraday bias in GBP/USD remains neutral and outlook is unchanged. . Further decline will remain in favor as long as 1.2637 resistance holds. On the downside, break of 1.2154 will resume the down trend from 1.4248. However, considering bullish convergence condition in 4 hour MACD, break of 1.2637 will confirm short term bottoming at 1.2154. Intraday bias will be turned back to the upside for 55 day EMA (now at 1.2789).
In the bigger picture, based on current momentum, fall from 1.4248 (2018 high) at least at the same degree as the rise from 1.1409 (2020 low). That is, fall from 1.4248 could be a leg inside the pattern from 1.1409, or resuming the longer term down trend. In either case, deeper decline is expected as long as 1.2999 support turned resistance holds. Next target is 1.1409 low.
Economic Indicators Update
| GMT | Ccy | Events | Actual | Forecast | Previous | Revised |
|---|---|---|---|---|---|---|
| 22:45 | NZD | Trade Balance (NZD) Apr | 584M | -350M | -392M | |
| 23:01 | GBP | GfK Consumer Confidence May | -40 | -39 | -38 | |
| 23:30 | JPY | National CPI Core Y/Y Apr | 2.10% | 2.00% | 0.80% | |
| 06:00 | GBP | Retail Sales M/M Apr | 1.40% | -0.20% | -1.40% | -1.20% |
| 06:00 | GBP | Retail Sales Y/Y Apr | -4.90% | -7.20% | 0.90% | 1.30% |
| 06:00 | GBP | Retail Sales ex-Fuel M/M Apr | 1.40% | -0.20% | -1.10% | -0.90% |
| 06:00 | GBP | Retail Sales ex-Fuel Y/Y Apr | -6.10% | -8.40% | -0.60% | -0.20% |
| 06:00 | EUR | Germany PPI M/M Apr | 2.80% | 1.40% | 4.90% | |
| 06:00 | EUR | Germany PPI Y/Y Apr | 33.50% | 31.40% | 30.90% | |
| 14:00 | EUR | Eurozone Consumer Confidence May P | -21 | -22 |
UK retail sales rose 1.4% mom in Apr, ex-fuel sales up 1.4% mom
UK retail sales rose 1.4% mom in April, well above expectation of -0.2% mom decline. That's also more than enough to recover the -1.2% mom decline in March. Ex-fuel sales also rose 1.4% mom, versus expectation of -0.2% mom, reversing the -0.9% mom decline in March.
However, for the most recent 3 months on previous 3 months, headline sales dropped -0.3% while ex-fuel sales dropped -0.5%.
Cliff Notes: Historic Labour Market Strength Sees Wage Pressure Build
Key insights from the week that was.
After a very strong run, Australia’s labour market took a breather in April, with only 4k jobs created in the month (market consensus 30k). Still, the unemployment rate recorded a new near 50-year low of 3.9% (note, March was also revised down to 3.9%). Further highlighting the current strength of labour demand, hours worked rose 1.3% in the month as part-time roles transitioned to full-time, and more full-time positions were created.
Ahead, we continue to expect further strong gains for employment, resulting in a low for the unemployment rate of 3.2% late this year despite record participation. As this trend persists, the wage pulse is set to build, from a modest 2.4%yr at Q1 2022 to 4.0%yr in 2023. The detail of the Q1 WPI provides support for this view, with the 15% of private workers who received an increase in the quarter seeing their pay rise by 3.4%, a percentage point more than the current annual rate and the largest increase since June 2013. The 2022 minimum wage decision may provide additional support, with unions having put forward an ambit claim for 5.5%.
The minutes of the May RBA meeting provided additional evidence from their business liaison work of labour market strength and growing momentum for wages. Also of significance for the inflation outlook, firms reported they were becoming more confident in raising prices.
As detailed by Chief Economist Bill Evans, the current momentum in inflation and uncertainty surrounding the outlook suggests the most appropriate path for policy is a moderate but front-loaded hiking cycle from the current level of 0.35% (following May’s 25bp increase) to 0.75% in June; 1.75% come November; and a peak of 2.25% by May 2023. Australia’s high level of household debt will then see debt service at highs back to the GFC, affecting both discretionary income and sentiment.
In New Zealand, this week saw the release of our team’s latest quarterly Economic Overview, a detailed assessment of current conditions and the outlook for the NZ economy. In this release, the team upgraded their expectation for the RBNZ, with a peak cash rate of 3.50% now seen at year end to combat a potent combination of global and local inflation pressures. House sales and prices have already taken a hit and are expected to weaken further as the cycle continues. That said, the cumulative decline should only take prices back to the level seen in early 2021. Through confidence and wealth, this shock is expected to pass to consumption and GDP growth in time, creating the slowdown necessary to quell inflation pressures and risks. Recognising the hit household incomes are taking, the NZ Government’s Budget 2022 provided some temporary, targeted cost-of-living relief.
For the US, FOMC speakers including Chair Powell again highlighted this week that, for the time being, inflation pressures and risks remain their focus. Concern over the strength and persistence of inflation in the UK and Euro Area meanwhile had a broad impact, global equities hit hard by fears of stagflation.
We believe it is important to distinguish between the risk of above-target but decelerating inflation with activity growth near trend and that of a stalled or contracting economy with inflation a multiple of target (stagflation).
Our baseline forecast for the US sees GDP growth modestly below trend in 2023; but, throughout that year, inflation is expected to throttle back to be only marginally above 2.0%yr. Achieving this feat in the US requires the abating of energy price growth, not a material fall, and other supply-side price pressures coming back from extreme levels to a moderate positive pace – a process that has clearly set it but has a long way to run.
As emphasised by Chair Powell this week, it is not enough to trust this trend will run its course. Instead, demand’s strength has to be actively reined in through financial conditions and real household incomes. Equally though, this does not mean central banks have to halt growth altogether and risk recession. In the US and across most of the developed world, there is a clear belief in acting quickly to move policy and tighten financial conditions towards a neutral level, but only taking an outright contractionary stance if risks materialise. Fears over the outlook for growth therefore should be recognised as a function of market behaviour and uncertainty, not the actions of central banks.
Finally to events in China. Data headlines over the past week caused considerable angst over the economic outlook, far more than the detailed data suggest is warranted. The biggest concern was retail sales, reported to be down 11% in April versus a year ago. However, assessed on a year-to-date basis, the cost to 2022 consumption from COVID-zero policies is seen to be much more manageable, with activity down only 0.2% in the first four months of 2022 versus the same period in 2021. Also important is that year-to-date growth in fixed asset investment largely held up in April, the narrow geographic focus of the lockdowns helping to maintain activity elsewhere.
If success in controlling the spread of the virus in Shanghai and Beijing holds, then the recovery should be swift and sizeable. Supporting this view, the past month has seen authorities’ support of the economy continue to build through announced and mooted policy initiatives, and by encouraging credit availability/ borrowing. This is not to say that we will see a surge in any and all projects no matter their profitability; but rather that local government and State Owned Enterprises’ curated lists of productivity enhancing old and new economy infrastructure projects are being given the green light. Meanwhile, with the residential construction sector having completed its reform phase and given recently announced policy easing, confidence should return amongst buyers and builders in the second half of 2022, supporting a strong recovery in activity.
Clearly, as long as it is active globally, COVID-19 will remain a risk for China. But the continuation of heavy restrictions on international travel should give authorities comfort that the domestic economy can re-open and operate with limited risks hence. This approach to COVID-zero would provide a double win for GDP, limiting the loss to imports while building momentum and confidence in local activity. This is a key support for our view that GDP can still achieve growth near authorities' target for 2022 despite a weak Q2. Apart from the virus, looking ahead the other significant risk to China growth is external demand which is coming under pressure from tighter financial conditions, weakening real incomes and, of course, uncertainty.
Technical Outlook and Review
DXY:
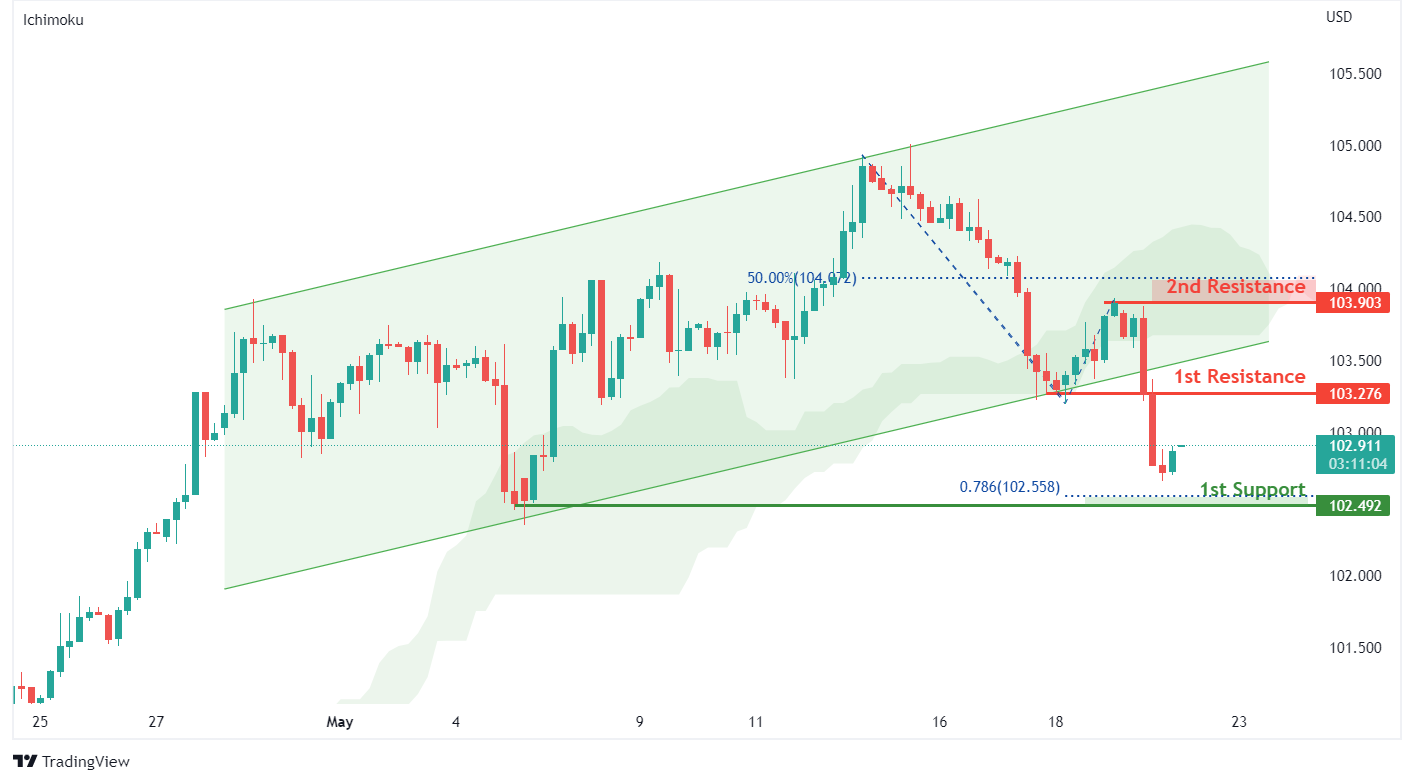
On the H4, with prices below the ichimoku indicator and prices breakout of the ascending channel, we have a bearish bias that price will drop to our 1st support at 102.492 where the horizontal swing low support and 78.6% Fibonacci projection are from our 1st resistance at 103.276 in line with the horizontal pullback resistance. Alternatively, price may break 1st resistance structure and head for 2nd resistance at 103.903 where the horizontal swing high resistance and 50% Fibonacci retracement are.
Areas of consideration:
- H4 time frame, 1st resistance at 103.276
- H4 time frame, 1st support at 102.492
XAU/USD (GOLD):
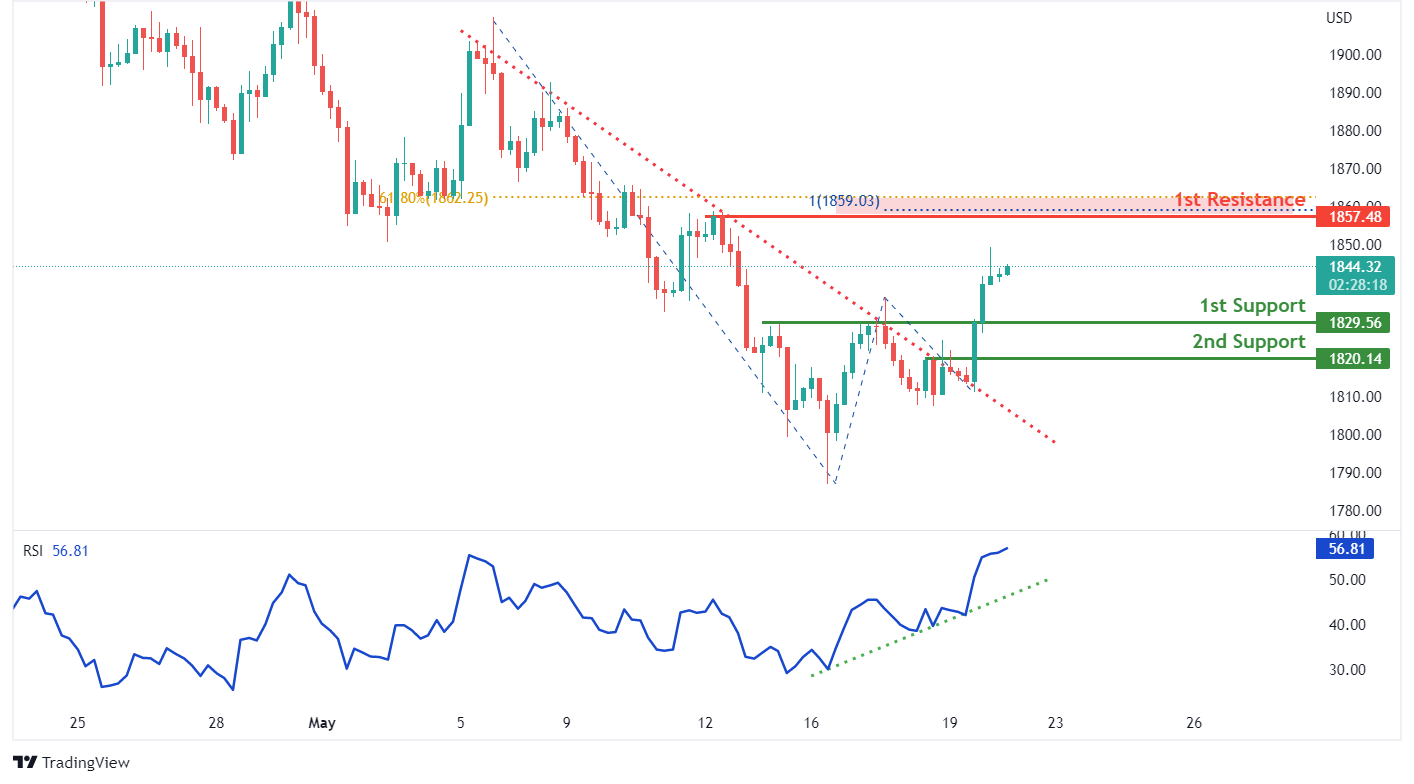
On the H4, with RSI moving in a bullish momentum and prices breaking out of the descending trendline,we have a bullish bias that price will rise from our 1st support at 1829.56 where the horizontal overlap support is to our 1st resistance at 1857.48 in line with the horizontal swing high resistance, 61.8% Fibonacci retracement and 100% Fibonacci projection. Alternatively, price may break 1st support structure and head for 2nd support at 1820.14 where the horizontal pullback support is.
Areas of consideration:
- H4 time frame, 1st Resistance at 1857.48
- H4 time frame, 1st Support at 1829.56
GBP/USD:
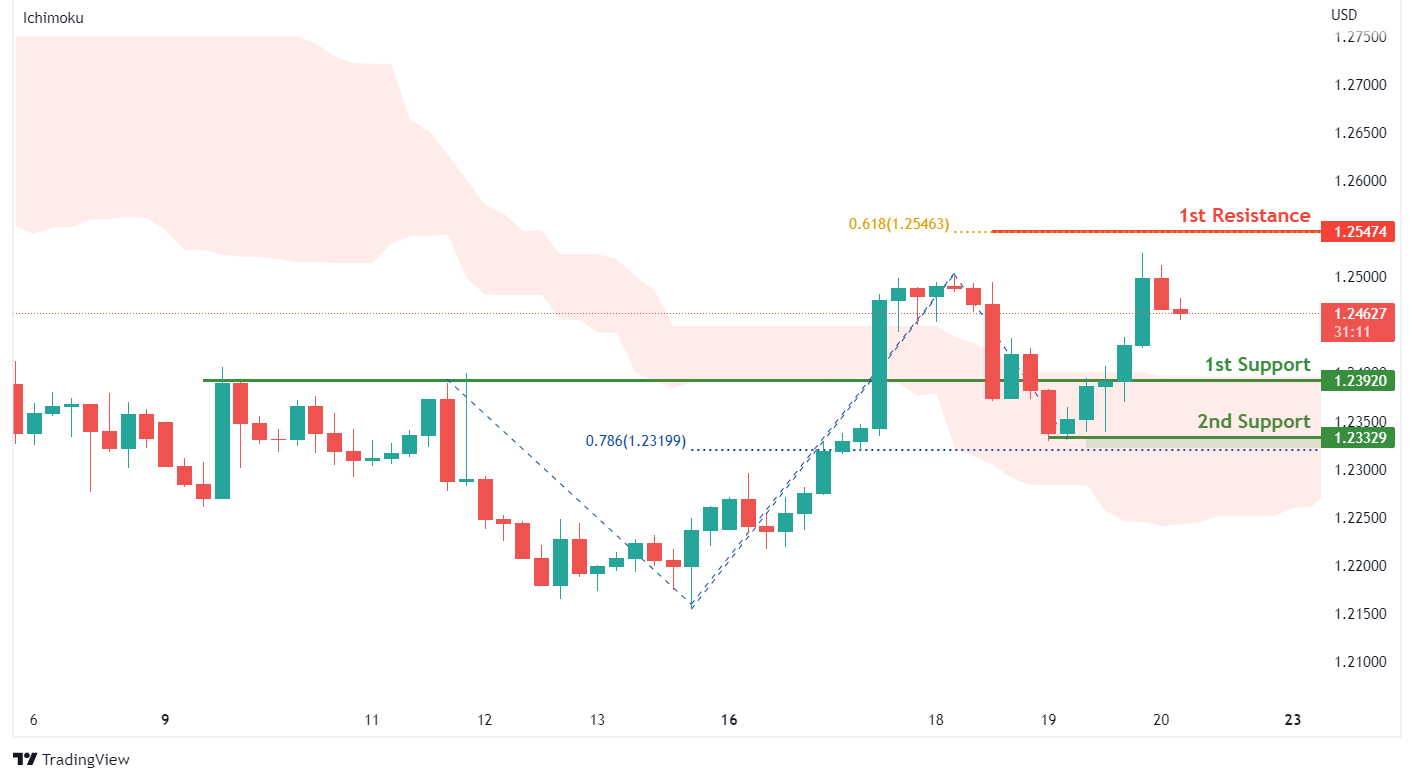
On the H4, with price moving above the ichimoku indicator, we have a bullish bias that price will rise from our 1st support at 1.23920 where the horizontal overlap support is to our 1st resistance at 1.25474 in line with the 61.8% Fibonacci projection. Alternatively, price may break 1st support structure and head for 2nd support at 1.23329 where the horizontal swing low support and 78.6% Fibonacci projection are.
Areas of consideration:
- H4 1st resistance at 1.25474
- H4 1st support at 1.23920
USD/CHF:
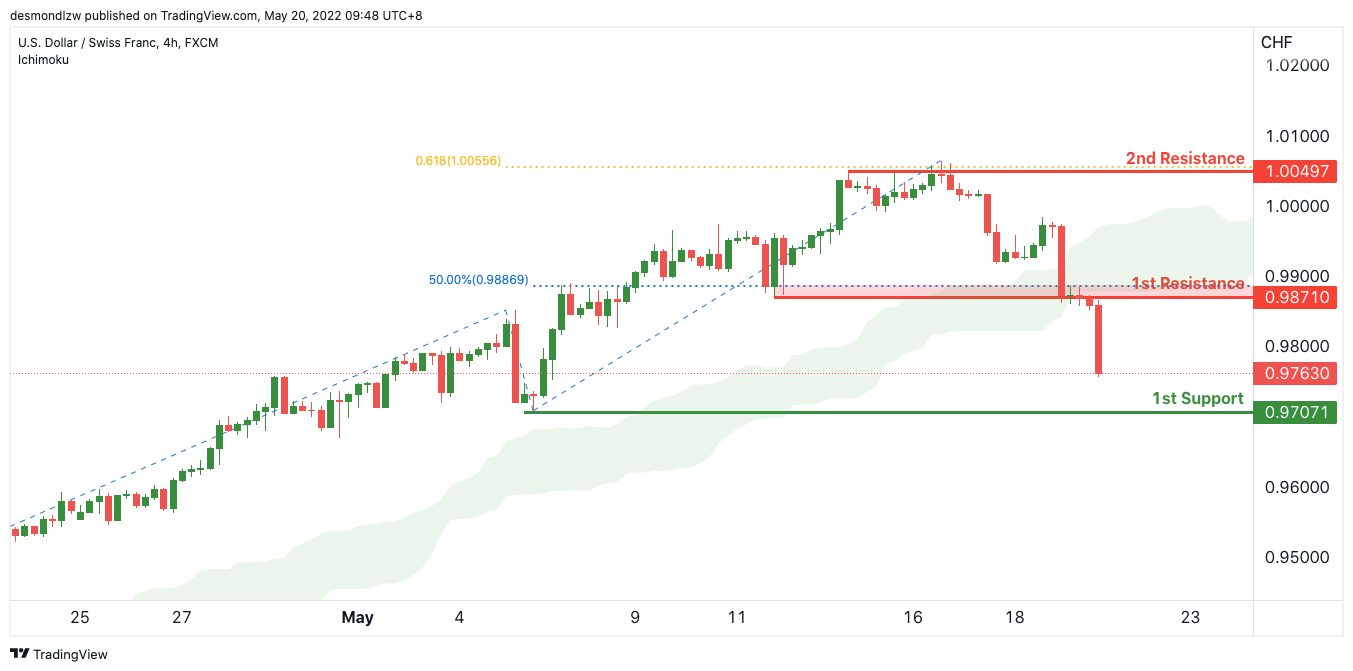
On the H4, with price moving below the ichimoku cloud, we have a bearish bias that price will drop from our 1st resistance at 0.98710 where the 50% Fibonacci retracement is to our 1st support at 0.97071 in line with the swing low support. Alternatively, price may break 1st resistance structure and head for 2nd resistance where the 61.8% Fibonacci retracement.
Areas of consideration
- 1st support level at 0.97071
- 1st resistance level at 0.98710
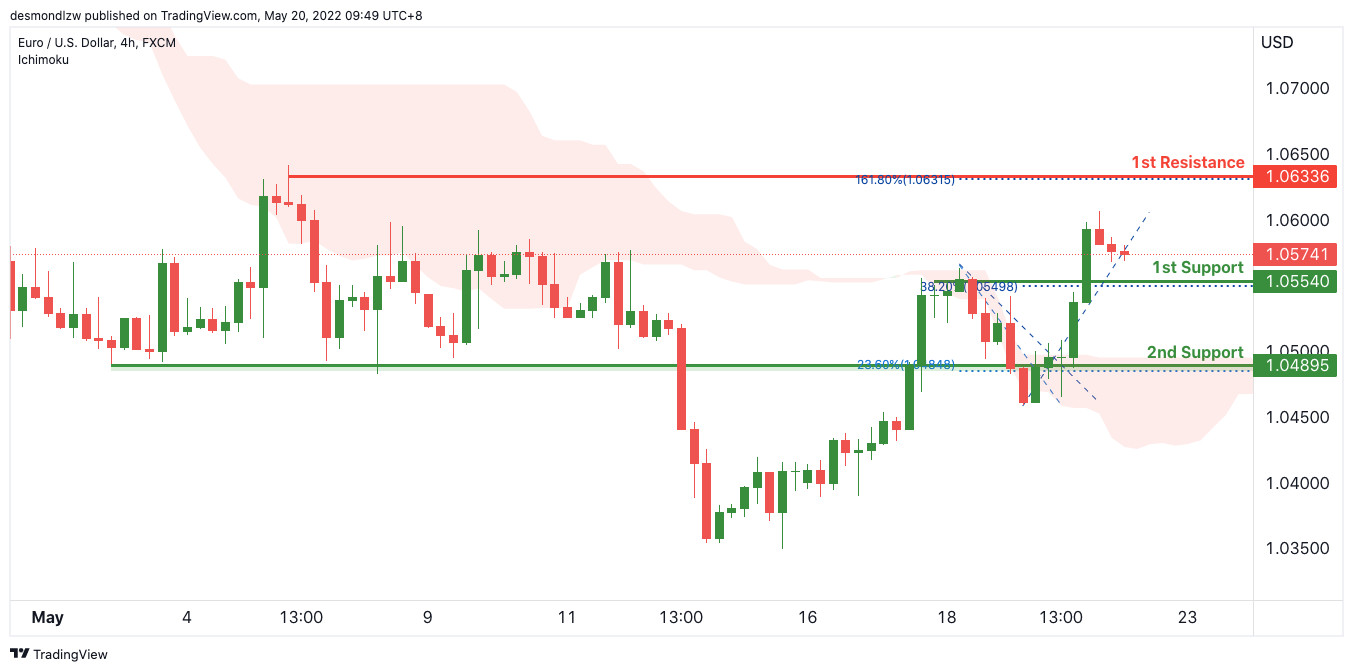
EUR/USD :
On the H4, with price expected to reverse off the ichimoku cloud resistance, we have a bearish bias that price will drop from our 1st resistance at 1.04826 where the 23.6% Fibonacci retracement is to our 1st support at 1.03586 in line with the horizontal swing low support. Alternatively, price may break 1st resistance structure and head for 2nd resistance where the horizontal swing high resistance is.
Areas of consideration :
- H4 1st resistance at 1.04826
- H4 1st support at 1.03586
USD/JPY:
On the H4, with prices moving below the ichimoku indicator, we have a bearish bias that price will drop from our 1st resistance at 128.085 where the 38.2% Fibonacci retracement and horizontal overlap resistance is to our 1st support at 126.787 in line with the 78.6% Fibonacci projection. Alternatively, price may break 1st resistance structure and head for 2nd resistance at 128.831 where the horizontal swing high resistance and 61.8% Fibonacci retracement is.
Areas of consideration:
- H4 time frame, 1st resistance at 128.085
- H4 time frame, 1st support at 126.787
AUD/USD:
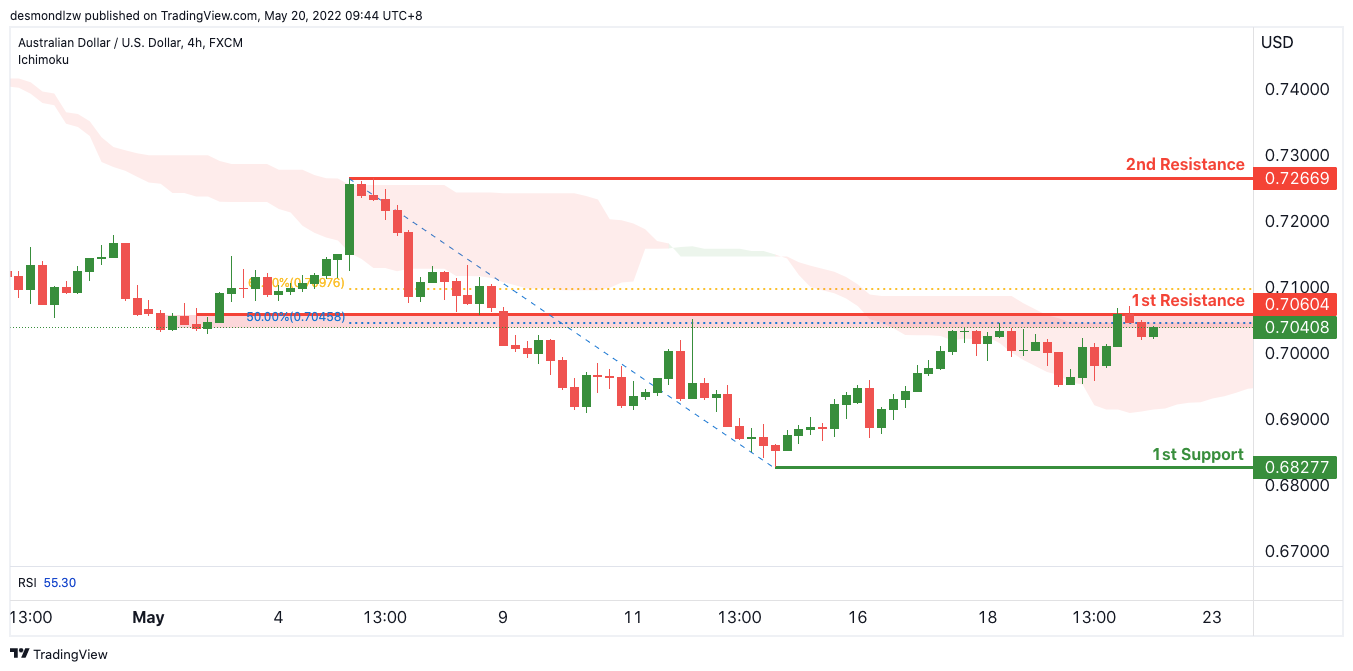
On the H4, with price expected to reverse off the ichimoku cloud resistance, we have a bearish bias that price will drop from our 1st resistance at 0.70604 where the overlap resistance and 50% Fibonacci retracement is to our 1st support at 0.68277 in line with the swing low support. Alternatively, price may break 1st resistance structure and head for 2nd resistance where the horizontal swing high resistance is.
Areas of consideration
- H4 1st resistance at 0.70604
- H4 1st support at 0.68277
NZD/USD:
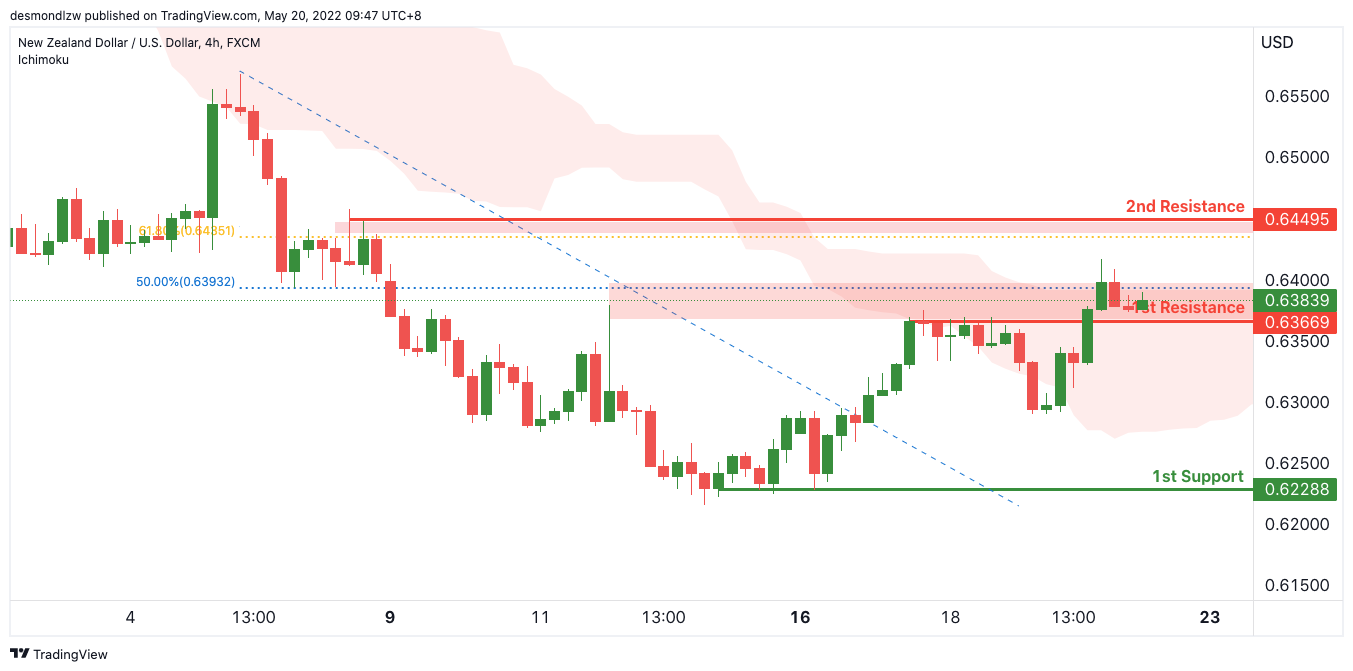
On the H4, with price expected to reverse off the ichimoku cloud resistance, we have a bearish bias that price will drop from our 1st resistance at 0.63669 where the overlap resistance and 50% Fibonacci retracement is to our 1st support at 0.62288 in line with the swing low support. Alternatively, price may break 1st resistance structure and head for 2nd resistance where the horizontal swing high resistance is.
Areas of consideration:
- H4 time frame, 1st support at 0.62288
- H4 time frame, 1st resistance at 0.63669
USD/CAD:
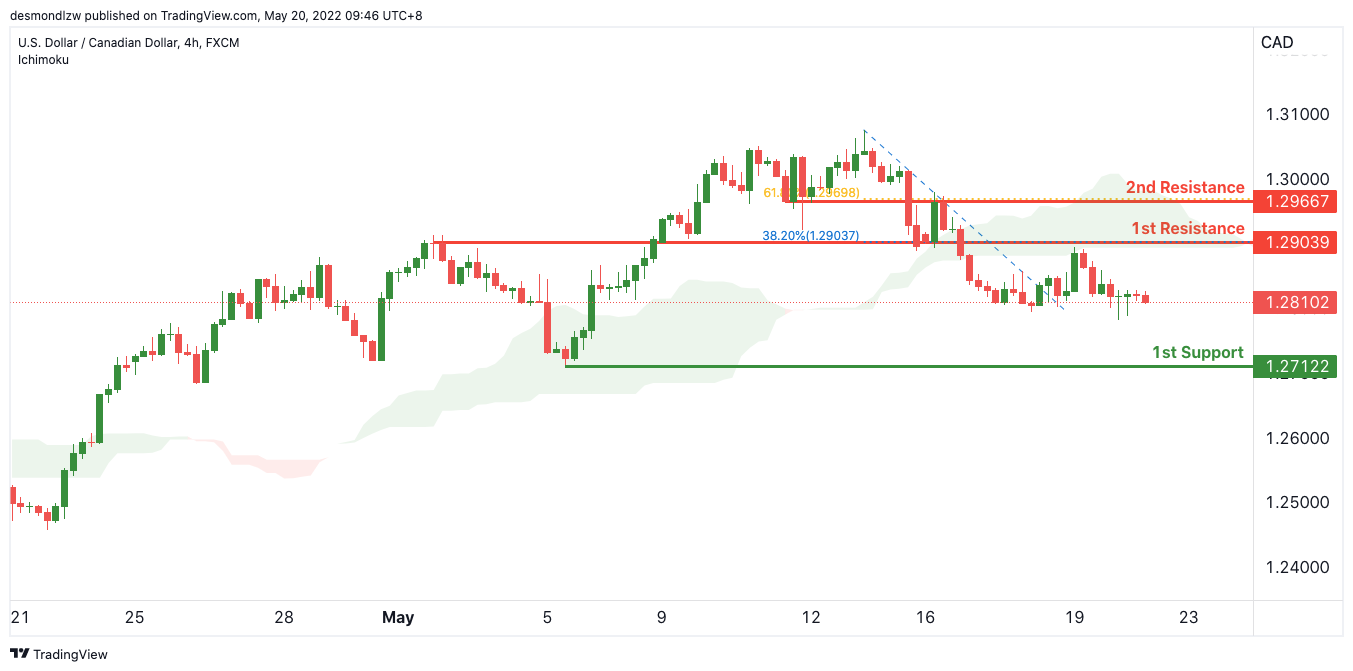
On the H4, with price moving below the ichimoku, we have a bearish bias that price will drop from our 1st resistance at 1.29039 where the horizontal pullback resistance is to our 1st support at 1.27122 in line with the swing low support. Alternatively, price may break 1st resistance structure and head for 2nd resistance where the horizontal swing high resistance is.
Areas of consideration:
- H4 time frame, 1st resistance at 1.29039
- H4 time frame, 1st support at 1.27122
OIL:
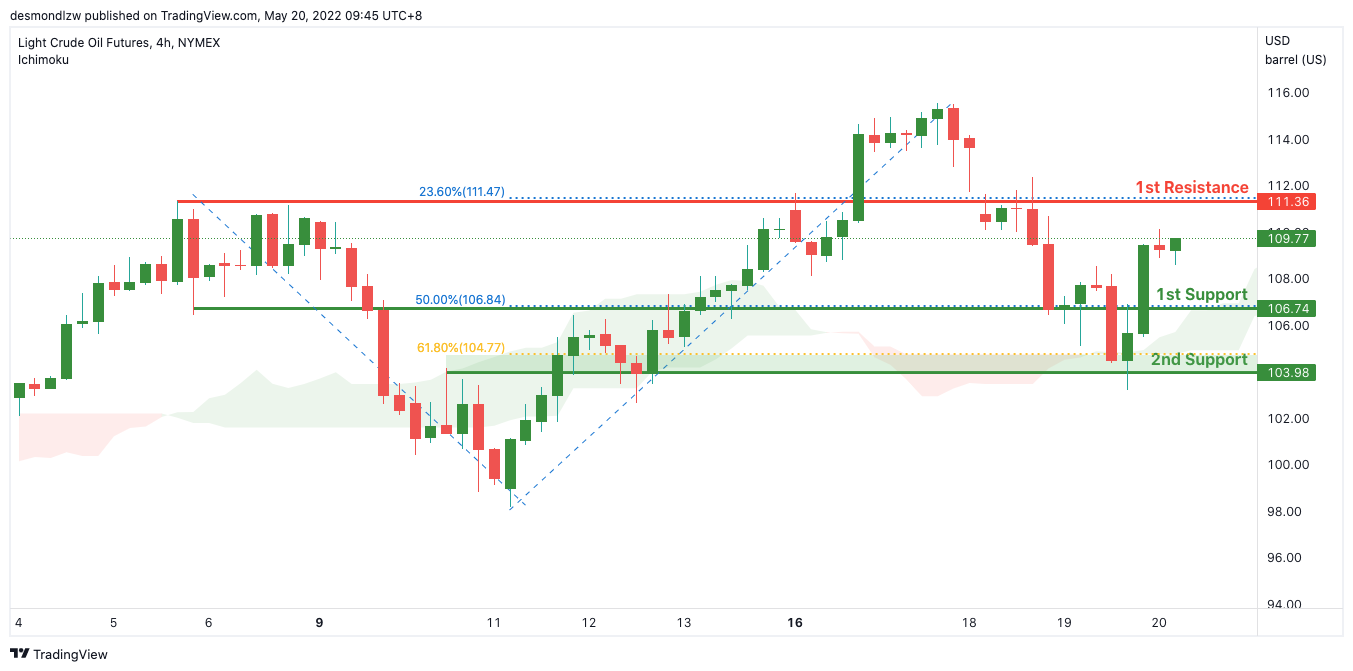
On the H4, with price expected to bounce off the ichimoku cloud, we have a bullish bias that price will rise to our 1st resistance at 111.36 where the 23.6% Fibonacci retracement from our 1st support at 106.74 in line with the horizontal overlap support and 50% fibonacci retracement. Alternatively, price may break 1st support structure and head for 2nd support where the horizontal pullback resistance is.
Areas of consideration:
- H4 time frame, 1st resistance of 111.36
- H4 time frame, 1st support of 106.74
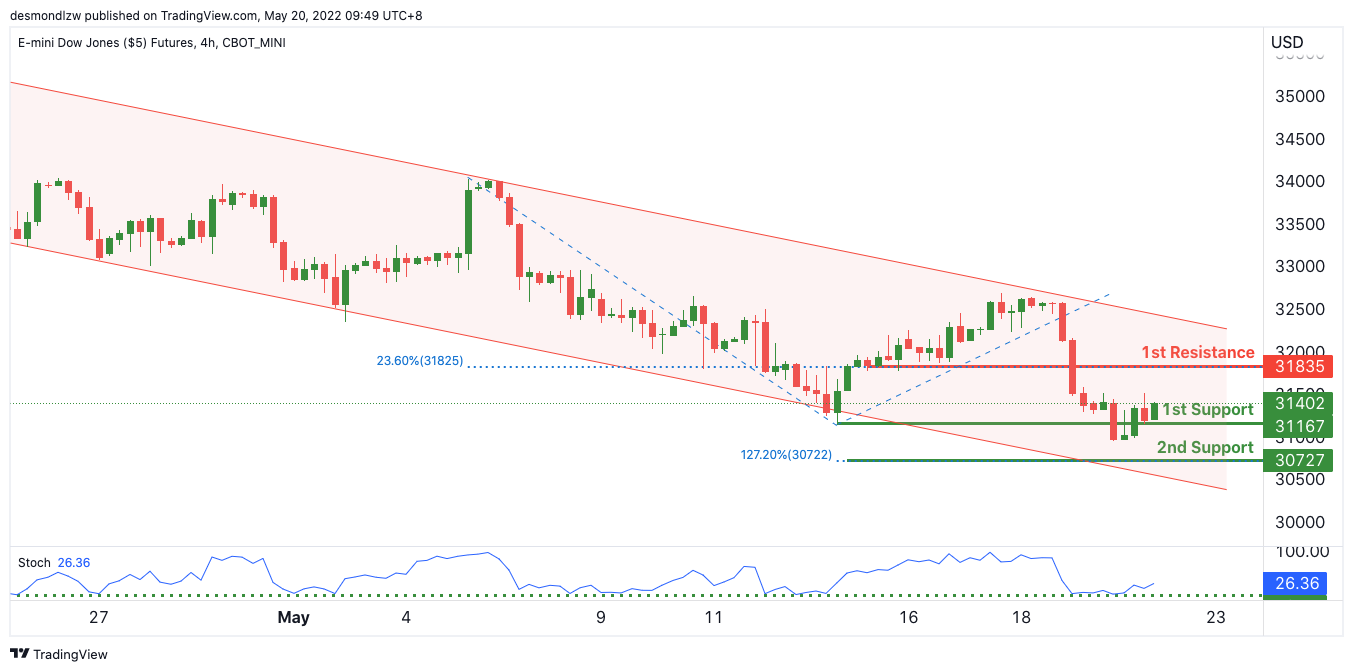
Dow Jones Industrial Average:
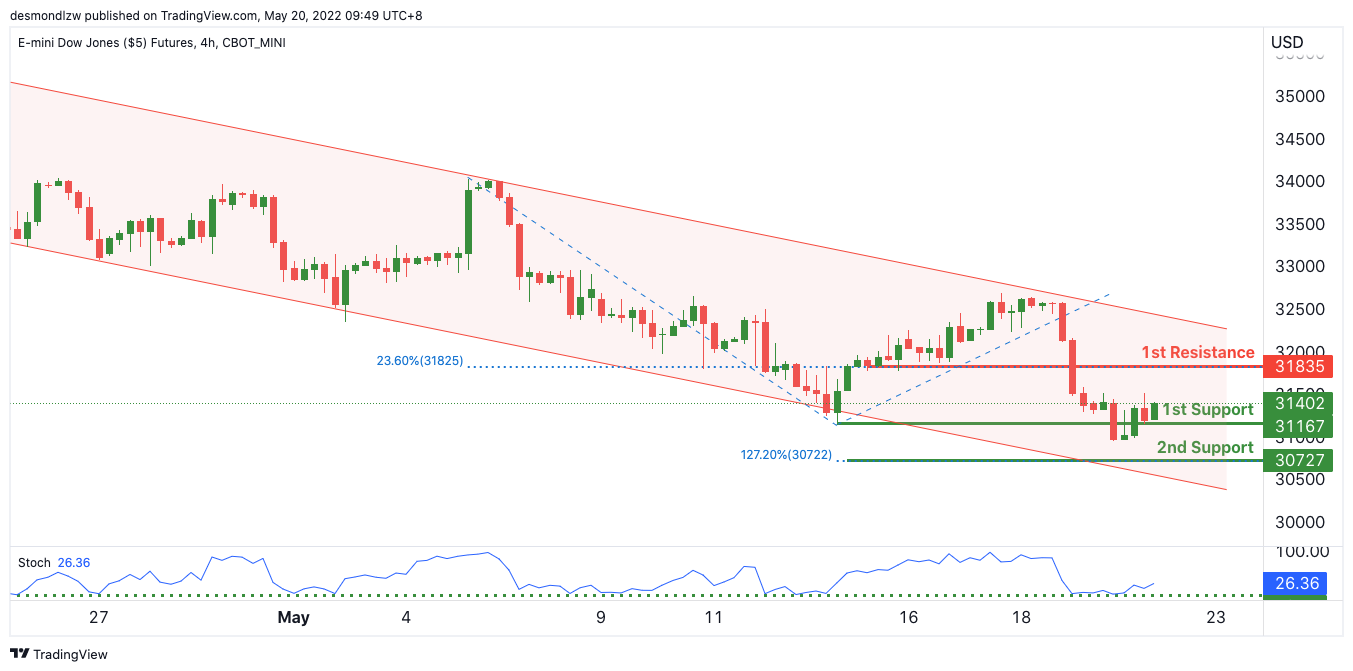
On the H4, with price expected to bounce off the ichimoku cloud, we have a bullish bias that price will rise to our 1st resistance at 31835 where the 23.6% Fibonacci retracement from our 1st support at 31167 in line with the horizontal overlap support and 50% fibonacci retracement. Alternatively, price may break 1st support structure and head for 2nd support where the horizontal pullback resistance is.
Areas of consideration :
- H4 time frame, 1st resistance at 31835
- H4 time frame, 1st support at 31167
Japan CPI core rose to 2.5% yoy in Apr, CPI core-core rose to 0.8% yoy
Japan headline CPI (all items) rose from 1.2% yoy to 2.5% yoy in April. CPI core (ex-fresh food) rose from 0.8% yoy to 2.1% yoy. CPI core-core (ex-fresh food, energy) rose from -0.7% yoy to 0.8% yoy.
The 2.1% CPI core reading was slightly above expectation of 2.0% yoy. It topped BoJ's 2% target for the firs time since March 2015. Also, it should be noted that CPI core-core was positive for the first time since July 2020.