Sample Category Title
WTI Futures Retreat to Mid-Bollinger Band, Tad Below 105 Mark
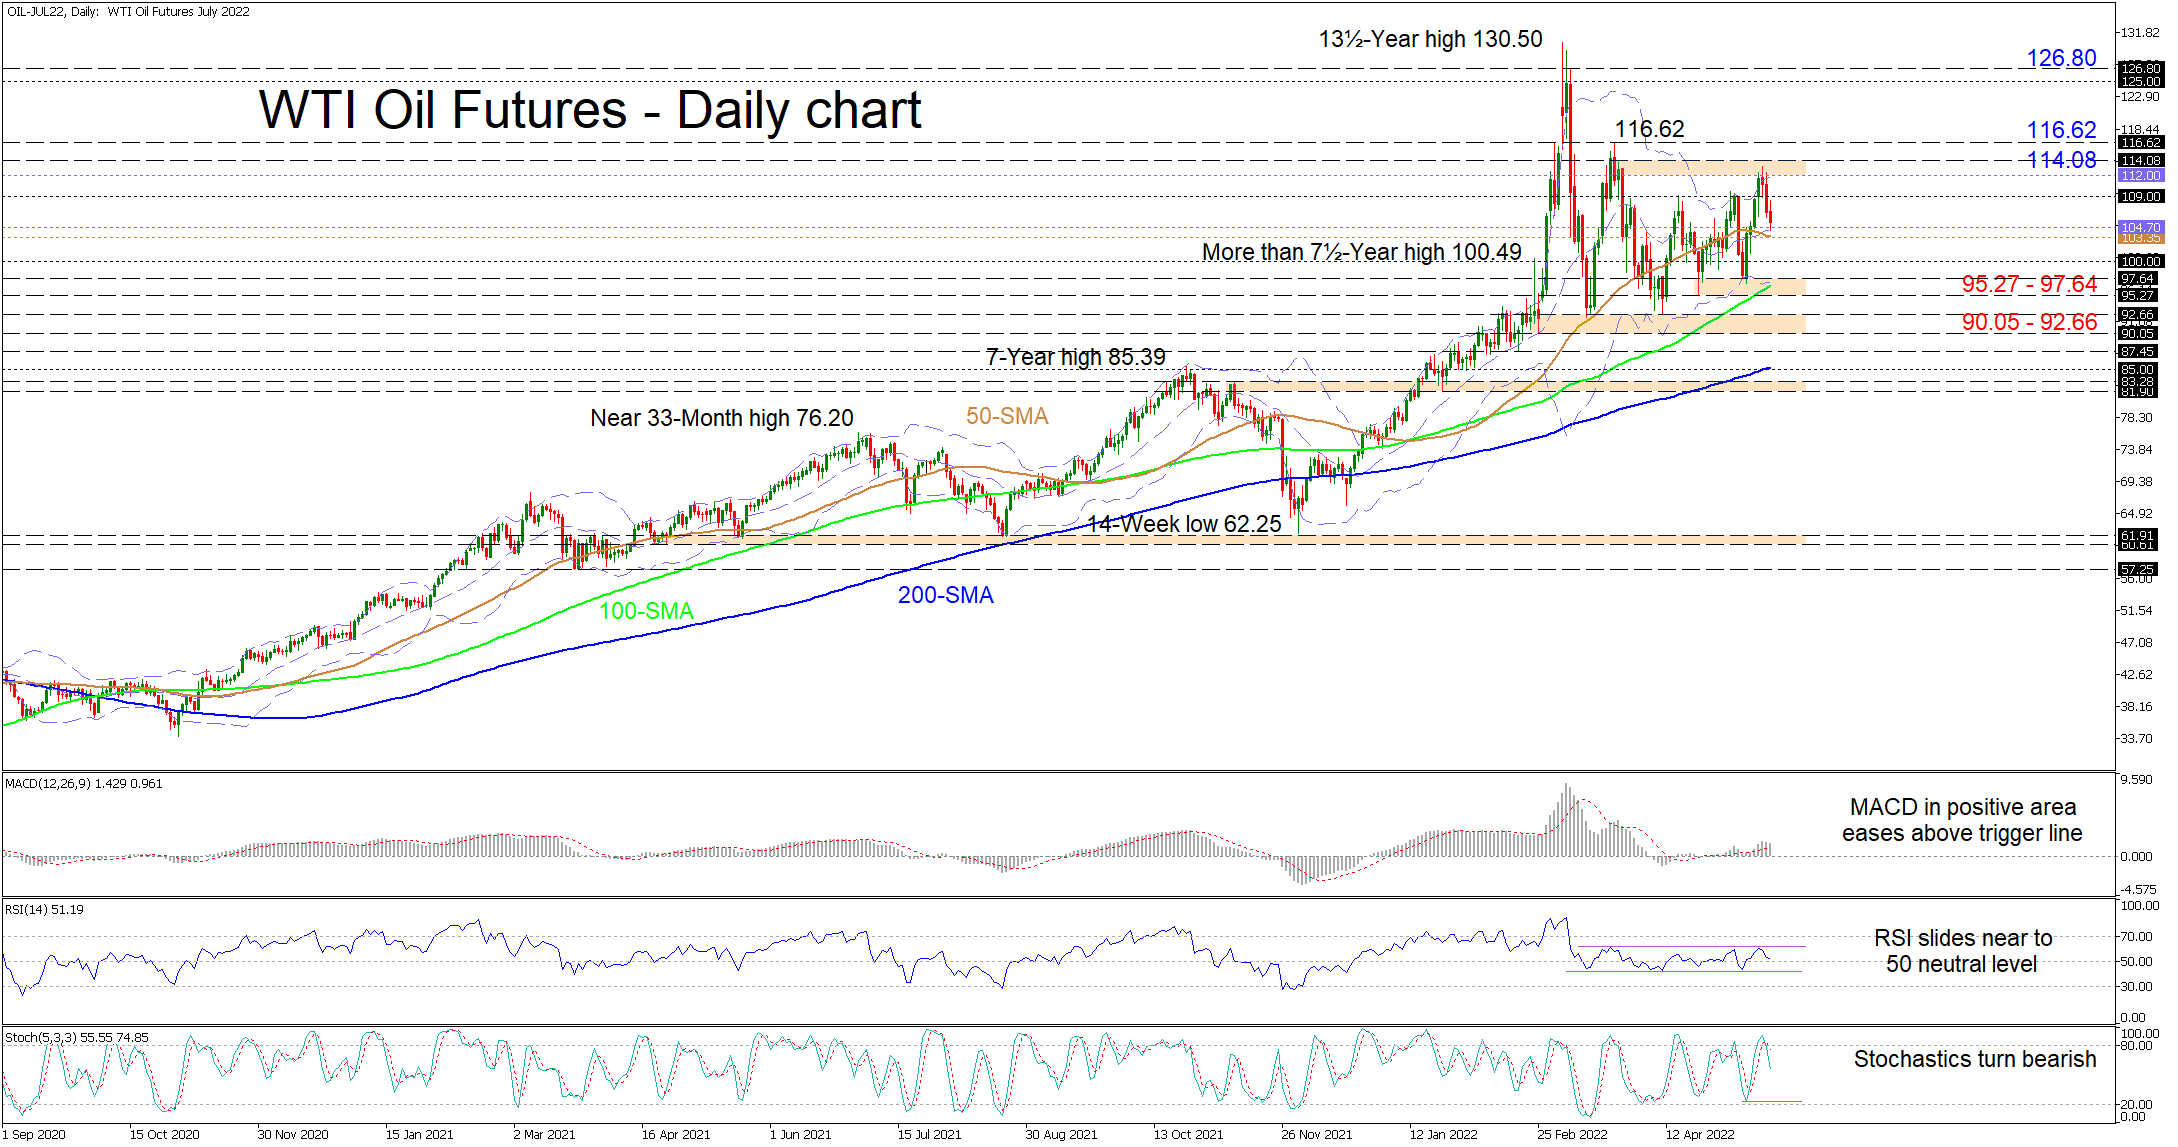
WTI oil futures have recoiled toward the vicinity of the mid-Bollinger band and the 50-day simple moving average (SMA) after upside pressures ran out of steam near the 114.00 price hurdle. The ascending longer-term 100- and 200-day SMAs are defending the broader positive structure, while the rolling over of the 50-day SMA, is reflecting modest dwindling in the price of the valuable commodity.
Elaborating on this we can see that the pullback in the price still has some ways to go to cause a dent in the bullish structure, having to sink past the support region containing the 100-day SMA in order to spark downside worries.
For now, the short-term oscillators are sponsoring the surge in negative momentum. The MACD, not too far north of the zero threshold, is waning toward its red trigger line, while the downward pointing RSI is testing the 50 level. Moreover, the stochastic oscillator is promoting additional declines in the black liquid's price.
In the negative scenario, immediate support may transpire from the mid-Bollinger band at 104.70 and the 50-day SMA at 103.35. However, if the retracement in the price of oil from the proximity of the upper Bollinger band at 112.00 matures further, the 100.00 border could come under attack prior to sellers challenging the reinforced 95.27-97.64 support boundary. Should this tough zone fail to dismiss negative tendencies from snowballing, the 90.05-92.66 base may then draw traders’ attention.
Alternatively, if buyers unearth positive traction somewhere around the mid-Bollinger band and the 50-day SMA, preliminary resistance could evolve at the 109.00 handle prior to the 112.00-114.08 section. Piloting higher and beyond the 116.62 key high, upside momentum could propel the price in the direction of the 125.00 mark and the March 9 high of 126.80.
Summarizing, WTI oil futures’ broader positive structure is ranging between 92.66 and 116.62. For positive prospects to grow the price would need to initially breach the 114.08, while a dive past the 95.27 trough could trigger more robust selling in the commodity.
US Market Nears Peak Panic
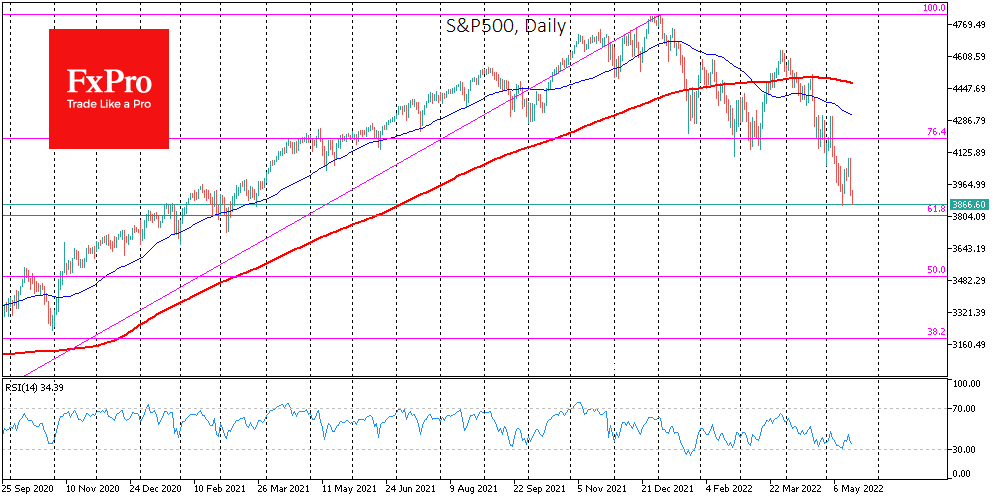
The US market crashed significantly in Wednesday’s trading, with echoes of the fall reverberating across Asian exchanges on Thursday morning. The US S&P500 is down more than 4 per cent for the day, the biggest fall since June 2020. The Nasdaq is now 5.5% lower than it was at the start of the day on Wednesday. Both indices have rolled back to the lows reached a week ago.
Behind investors, pessimism was caused by disappointing reports from major US retailers. Giants such as Walmart, Target, and Amazon suffer from rising costs due to a spike in purchasing prices and energy combined with increasing labour costs.
April’s latest retail sales report showed that Americans are spending commensurately with rising inflation. This transition for retailers from a boom to a pace barely keeping up with increasing prices raises fears that an economic slowdown awaits the economy going forward.
However, this simplistic extrapolation risks being a mistake. The major retail players have not kept up with the price surge, as we can see in the latest reports from Walmart and Target and the following market reaction. But history suggests that stopping the acceleration of inflation is enough for retailers to find the ground beneath their feet.
The slowdown in price growth is a golden time for retailers and the overall stock market. This trend can easily be traced back to both the shock waves of price surges in the 1970s and 1980s and the chronically low inflation of the 2010s.
As a result, investors have little choice but to wait for reliable signs that inflation has turned around. We may have to be patient for a few months. But it also cannot be ruled out that the rate of price increases is near or past its peak.
That’s hard to believe when looking at price rises in shops but much easier to consider when looking at declining volatility in the energy market and a 15% fall in the base metals’ basket.
The Chinese renminbi, which lost 6.4% over the month, also acts as a significant suppressor of inflation in the USA and elsewhere via lower imported inflation.
Thus, yesterday’s panic selloff in the markets and the persistence of investor anxiety on Thursday heralds the approach of a panic peak. And with it, perhaps a local low preceding a rebound.
USD/JPY: Negative Signals Developing on Daily Chart and Point to a Deeper Drop
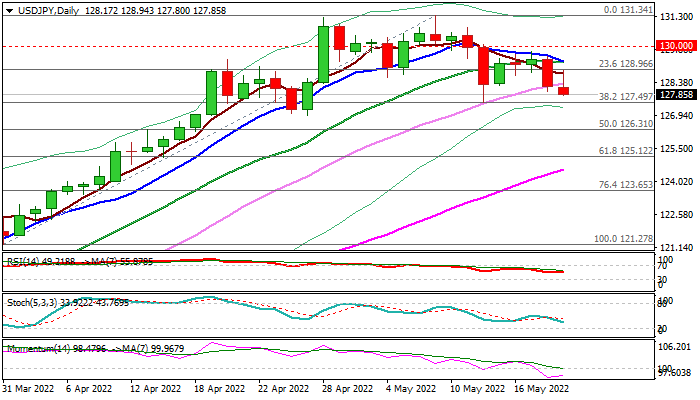
The USDJPY extends lower in early Thursday’s trading, following nearly 1% drop on Wednesday, as yen was supported by increased flow into safety on risk aversion.
Negative signal is developing on daily chart as near-term recovery attempts from May 12 low at 127.51 repeatedly failed to clear daily Tenkan-sen (129.42) forming a bull-trap pattern.
In addition, daily 10/20DMA converged and on track to form a bear-cross, while 14-d momentum dipped into negative territory.
Fresh bears broke below daily Kijun-sen (128.21) and pressure pivotal supports at 127.50 zone (May 12 low / double- Fibo, 38.2% of 121.27/131.34 upleg / 23.6% of 114.64/131.34) violation of which would add to bearish signals on completion of failure swing pattern on daily chart and open way for deeper drop.
A higher base at 127.00 zone (Apr 26/27 lows) marks next target, followed by 126.31 (50% of 121.27/131.34).
Daily close below Kijun-sen to maintain strong bearish bias, while Tenkan-sen marks an upper breakpoint.
Res: 128.21; 128.94; 129.42; 129.78
Sup: 127.50; 127.00; 126.31; 125.22
AUD/USD: Bulls Return to Play on Solid Jobs Data, Easing of China’s Restrictions
The Australian dollar regained traction on Thursday and recovered a good part of Wednesday’s 1% drop, underpinned by fresh optimism over relaxing Covid restrictions in China and solid Australia’s jobs data.
Unemployment in Australia fell to 3.9% in April, the lowest in nearly 50 years, although the mood was soured by a strong miss in employment increase (4000 in Apr vs 30,000 f/c).
Solid data signal further tightening in the labor market that would increase pressure on the Reserve Bank of Australia for further rate hikes and offer further support to the currency.
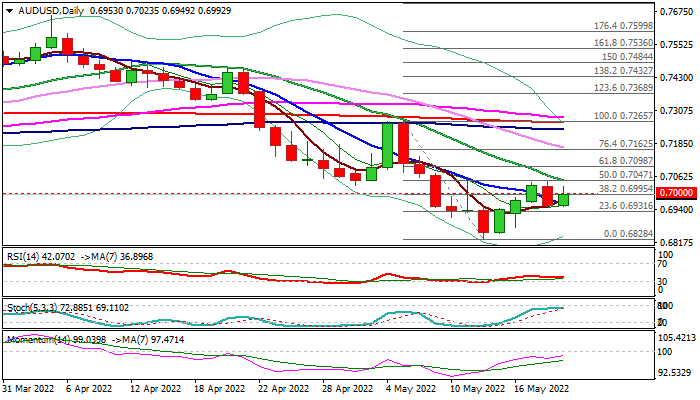
Fresh strength faces headwinds at initial 0.70 barrier, which guards pivotal 0.7047 barrier (falling 20DMA / 50% retracement of 0.7265/0.6828), with firm break here to signal reversal and open way for stronger rebound.
Price action of equities and commodities, which strongly influence the performance of the Aussie dollar, will be closely monitored by investors.
Res: 0.7000; 0.7023; 0.7047; 0.7098
Sup: 0.6949; 0.6931; 0.6872; 0.6828
GBP/USD: Cable Rises on BoE Optimism But Risk Aversion and Negative Techs Weigh
Cable regained strength after being deflated on Wednesday (down 1.2% for the day) by high inflation figure.
Investors turned focus towards the BoE, which is expected to raise rates by 25 basis points in the policy meeting next month that would bring the benchmark rate to 1.25%, in efforts to bring soaring inflation under control and ease strong pressure on households and the economy.
The Britain’s financial minister Sunak, who was criticized for not adequately helping the households during the current crisis, has backed the BoE, in joint efforts to ease the impact of crisis.
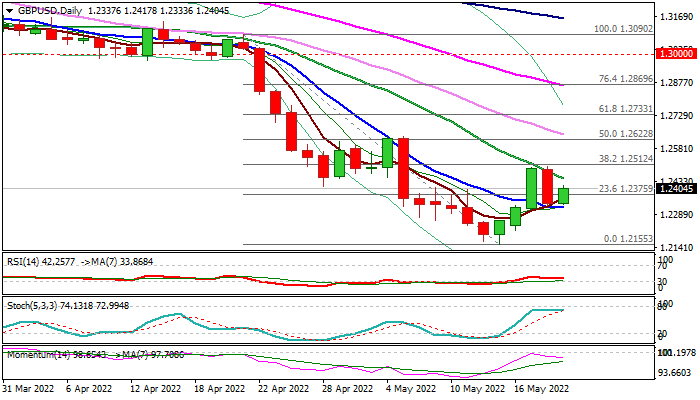
Fresh recovery managed to recover almost a half of Wednesday’s loss, but needs to extend above falling 20DMA (1.2446) and a double top of Tue/Wed (1.2500) to generate stronger bullish signal.
On the other side, renewed risk aversion weighs on sterling, along with negatively aligned daily studies, as bearish momentum started to rise.
Solid support at 1.2323 (10DMA) needs to hold to keep bulls alive, otherwise break here would weaken near-term structure and shift focus lower.
Res: 1.2512; 1.2534; 1.2600; 1.2622
Sup: 1.2323; 1.2286; 1.2236; 1.2200
Pound Stems Bleeding, Retail Sales Next
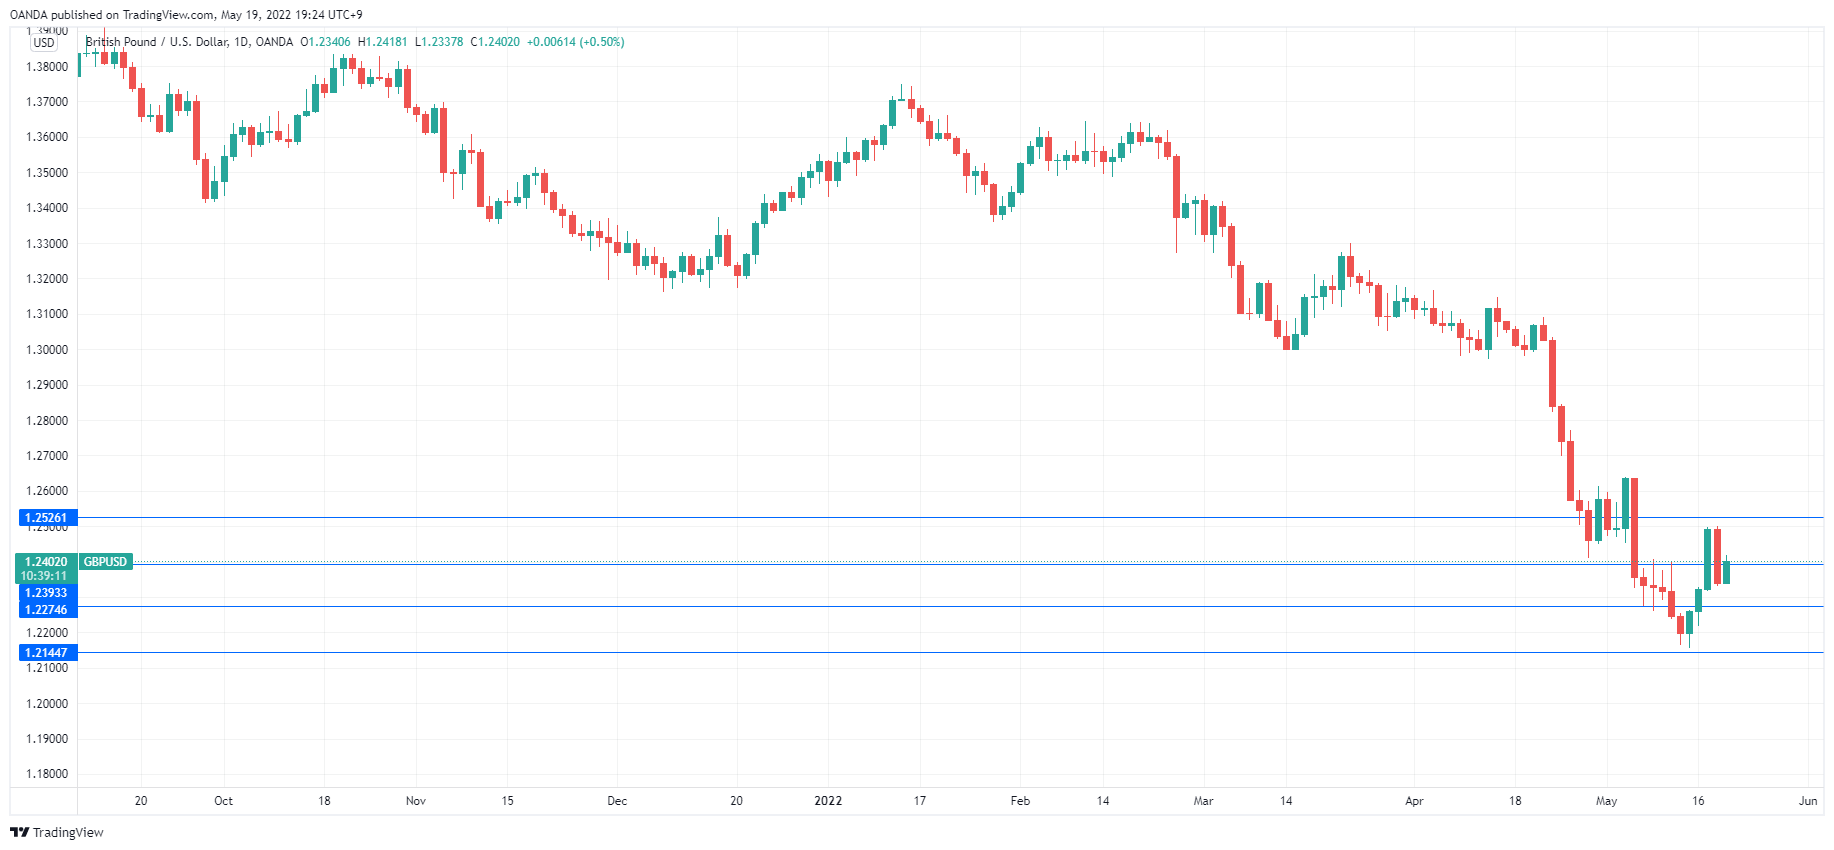
The British pound has reversed directions on Thursday, after sliding 1.22% a day earlier. GBP/USD is trading at 1.2402 in the European session, up 0.50% on the day. The UK releases retail sales on Friday, with an estimate of -0.2%, which would mark a third successive decline.
Red-hot inflation gets hotter
UK inflation continues to accelerate, and the April CPI of 9.0% unnerved investors and sent the pound tumbling lower. CPI jumped from 7.0% in March, and the only sliver of good news was that the reading was lower than the forecast of 9.1%. Core CPI rose to 6.2%, up from 5.7%, indicating that inflationary pressures are broad-based. This means that the cost of living crisis isn’t going away anytime soon. In fact, it could get worse, with the BoE forecasting that the inflation could top 10% later this year.
The BoE finds itself playing catch-up with the inflation curve and has been heavily criticised for assuming inflation was transient and not tightening earlier. The same criticism can be levelled at the Federal Reserve, but the Fed has responded with super-size 50-bps increases, while the BoE has opted for modest 25-bps hikes. Brexit tensions are back in the form of the Northern Ireland protocol, which is exacerbating inflationary pressures.
With no sign of an ‘inflation peak’, businesses and consumers are in a sour mood and pressure is mounting on the BoE to be more aggressive with its tightening. The BoE has defended its policy, saying that the Ukraine war and other factors driving inflation are beyond the Bank’s control. That may be true, but the markets are looking to the BoE to right the listing ship and get a handle on inflation. Bailey & Co. are understandably hesitant to implement 50-bps hikes, out of concern that this will stall the economy and cause a recession. I don’t envy the BoE policy makers, who must find the right pace of hikes which will lower inflation while guiding the economy to a soft landing.
GBP/USD Technical
- GBP/USD is testing resistance at 1.2393. Above, there is resistance at 1.2525
- There is support at 1.2275 and 1.2143
US 30 Index’s Gains Curbed by Ichimoku Cloud and 100-MA
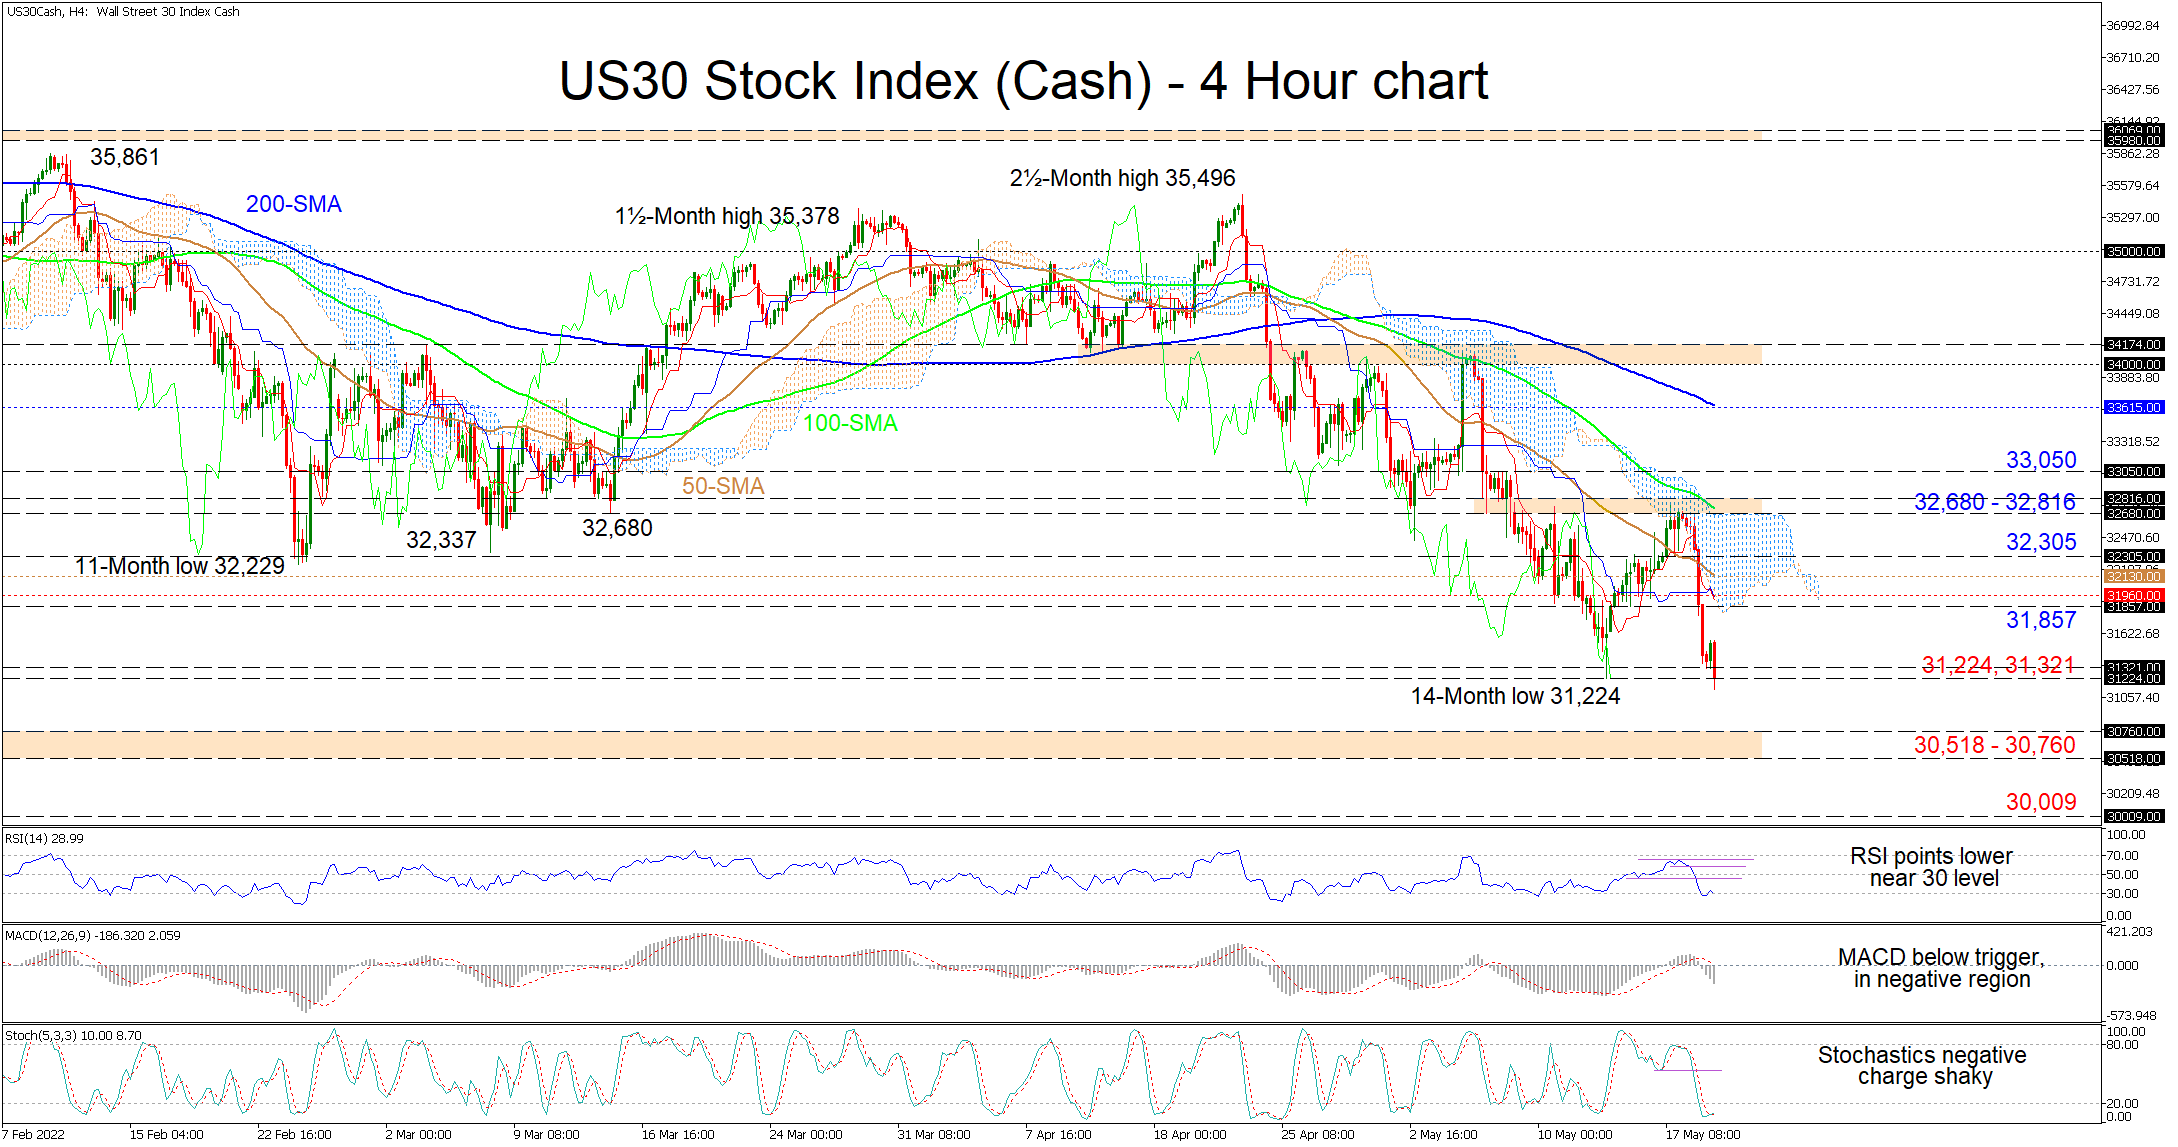
The US 30 stock index (Cash) has been driven back down to the vicinity of its recently recorded 14-month low of 31,224 by the restricting Ichimoku cloud and the descending 100-period simple moving average (SMA). That said the falling SMAs are endorsing the approximately one-month downward bearing from the 35,496 high, which pierced marginally below the 31,321 low reached back in March 2021, where the price had found its latest footing prior to current selling pressures.
The Ichimoku lines are indicating that negative forces are close to regaining full command, while the short-term oscillators are hinting of the pause in the selloff in the index. The now downward pointing RSI has snagged around the 30 oversold level, while the negative charge of the stochastic oscillator is being tested. Meanwhile, the MACD is promoting additional declines in the price as it is diving deeper in the indicator’s bearish territory.
If the price closes definitively beneath the immediate support barriers of 31,321 and 31,224, this will validate that the index is likely to surrender extra ground, verifying the recent weakness from yesterday. The next support region to challenge sellers’ dominance could exist around the 30,518-30,760 area formed by lows early on in February and March 2021. Remaining heavy, the bears may then aim for the 30,009 barrier.
Otherwise, if buyers re-emerge and drive the price north of the 14-month low’s vicinity, initial resistance could stem from the 31,857 inside swing low coinciding with the Ichimoku cloud’s lower surface, and the Ichimoku lines overhead at 31,960. If buying interest endures, the falling 50-period SMA at 32,130 and the 32,305 obstacle could impede buyers from challenging the fortified 32,680-32,816 resistance band.
Summarizing, the US 30 index’s bearish bias looks to be rekindling. A close in the current 4-hour red candle beneath the 31,321 and the 31,224 support borders may suggest further dampening in the index’s outlook. That said, for optimism to return in the index, a pickup in sentiment would need to drive the price over the 32,680-32,816 resistance and beyond the 33,050 barrier.
US 100 Index Holds above May’s Lows Despite Big Fat Sell-off
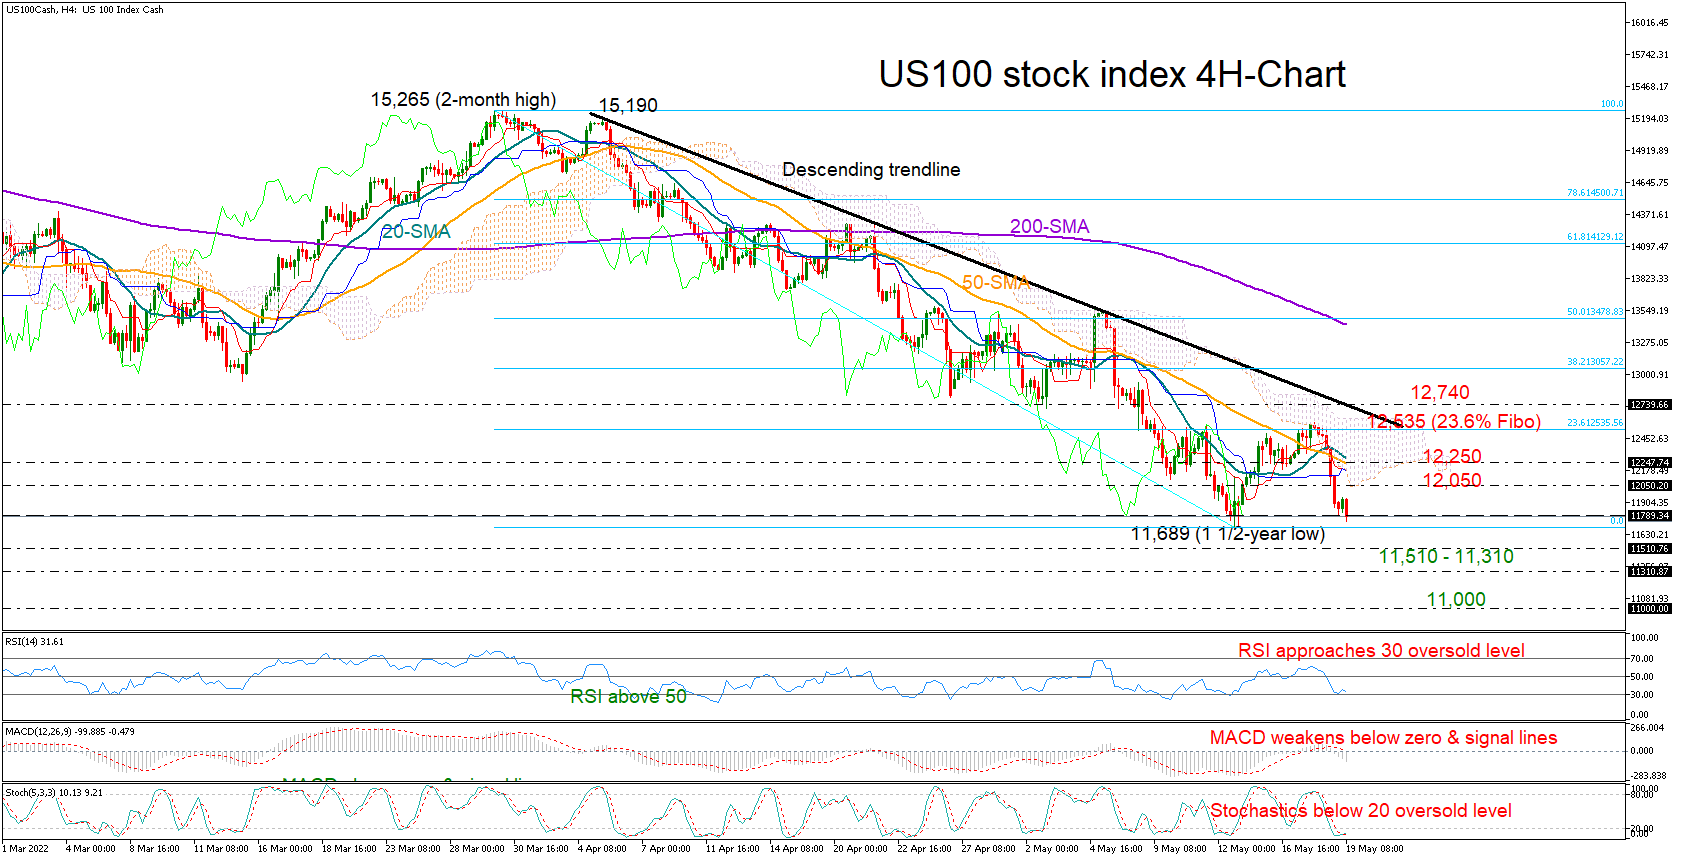
The US 100 stock index (cash) was smashed by worrying earnings from US retailers on Wednesday, but the big-fat sell-off was not strong enough to close below 11,874 for the second time this month.
Sellers are expected to dictate the short-term trading in the four-hour chart as the momentum indicators are dipped in the bearish area, though with the Stochastics and the RSI hovering near their oversold levels, an upside correction cannot be ruled out. In other encouraging signals, the red Tenkan-sen line hasn't confirmed a bearish cross with the blue Kijun-sen yet, while the positive intersection between the 20- and 50-period simple moving averages (SMAs) is intact despite the negative slope in the lines.
Hence, traders will keep a close eye on the 11,874 floor as the market exhibits its seventh straight week of losses. Failure to bounce here may see further weakness towards the 11,310 – 11,510 territory last active during the fourth quarter of 2020. If downside pressures persist, the next stop could be around the 11,000 psychological mark, while a steeper freefall may touch the crucial base of 10,765 from September 2020.
In the positive scenario, where the index sustains the foothold at 11,874, the constraining surface of the Ichimoku cloud currently around 12,050 may immediately deter any improvement towards the 20- and 50-period SMAs at 12,250. Should buyers drive higher, the focus will turn to the 23.6% Fibonacci retracement of the 15,265 – 11,689 downleg at 12,535. Yet, the descending trendline drawn from the 15,190 mark might be a more important obstacle at 12,740.
Summarizing, although the tech-led US 100 stock index managed to stay above May’s trough, increasing speculation that selling interest is fading, a drop below 11,874 could pour cold water to that hope.
Sea of Red in US Equities as Margin Challenges Continue
American shares declined sharply as investors focused on the rising risks of inflation on corporate profits. The main catalyst for the sell-off was the latest earnings by Walmart and Target, two of the biggest retailers in the US. On Tuesday, Walmart published strong results but warned about the impact of rising prices. On Wednesday, Target said that fuel and freight costs would be $1 billion higher than where it expected. It blamed the rising fuel prices and wages. As a result, its stock crashed by more than 25%. Other retailers like Home Depot, Lowe’s, and Kroger all declined sharply. Retailers also expressed concerns that they had over hired. The Dow Jones declined by more than 700 points.
The price of crude oil declined sharply as fears of a recession continued. Investors are worried about the slowing Chinese economy. Data published this week revealed that the country’s retail sales and industrial production declined sharply in April. Oil also declined after the latest data by the EIA. The numbers revealed that oil inventories declined by more than 3.3 million barrels last week. This was a big surprise considering that investors were expecting the data to show that inventories rose by more than 1.38 million barrels. Oil also declined because of the overall weak sentiment in the market after Nikkei reported that China was considering cutting industrial production.
Concerns about inflation continued during the American session. On Wednesday, data by the UK showed that the country’s inflation jumped to the highest level in over 40 years. Additional data from Canada revealed that the headline CPI rose by a multi-decade high of 6.8% while core CPI rose by 5.7%. Meanwhile, the economic calendar will have several important events today. Earlier on, the Japanese government published the latest trade numbers while Australia delivered the latest jobs numbers. In Europe, the ECB will publish the latest minutes while in the US, the key data to watch will be the Philadelphia Fed manufacturing index.
XBRUSD
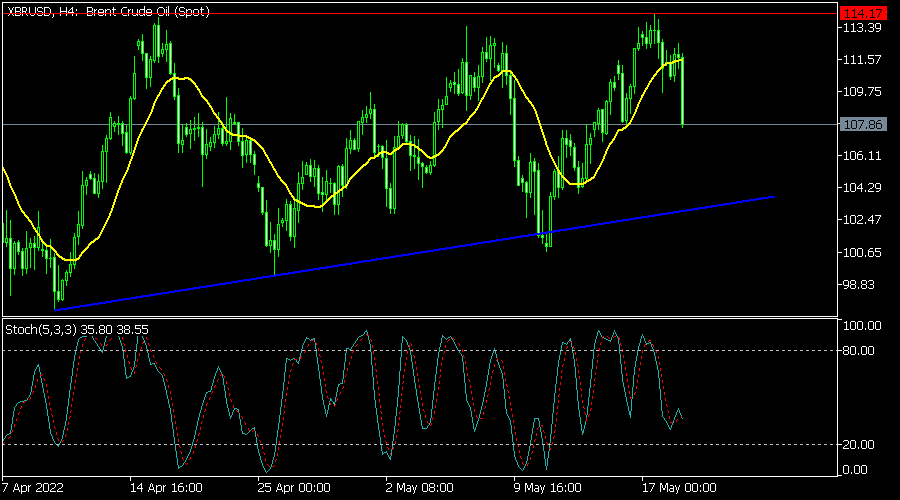
The XBRUSD pair declined sharply over concerns about the China slowdown. The pair declined to a low of 108, which was the lowest it has been since Friday. The pair moved below the 25-day moving average while the Stochastic Oscillator has moved below the overbought level. Further, the pair has formed a triple-top pattern. Therefore, there is a likelihood that the pair will keep falling as bears target the key support at 102.
EURUSD
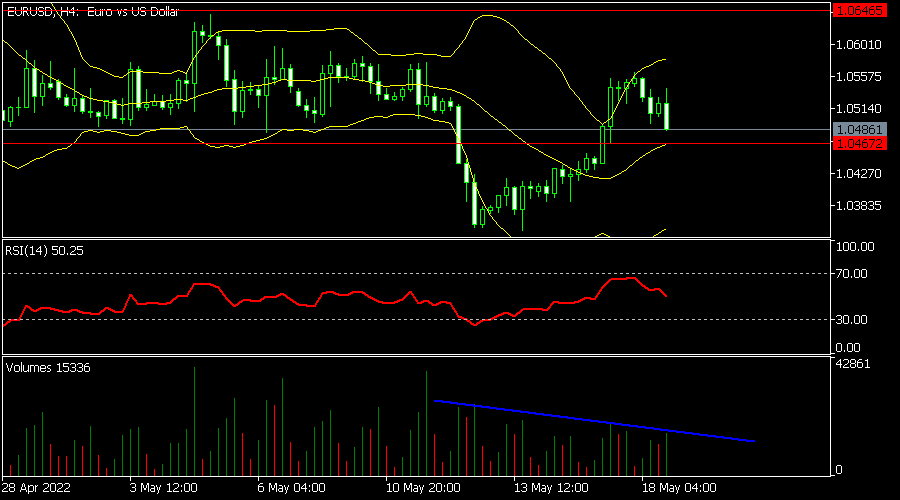
The EURUSD pair declined to a low of 1.0487, which is slightly above the middle line of the Bollinger Bands. The Relative Strength Index (RSI) has moved below the overbought level. The volume indicator has continued dropping. The pair has also declined below the 25-day moving average. The pair will likely keep falling as bears target the key support at 1.0400.
USDCHF
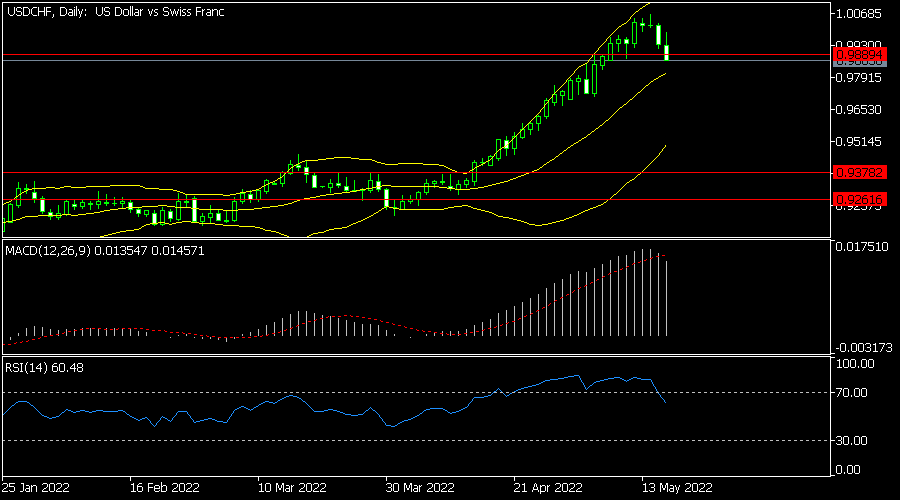
The USDCHF pair declined sharply after it tested its parity level last week. On the daily chart, the pair has moved between the middle and upper lines of the Bollinger Bands. It remains above the 25-day moving average while the MACD and Relative Strength Index have started pointing downwards. Therefore, the pair will likely keep falling in the near term.
Aussie Rebounds on Jobs Report
Unemployment falls to record low
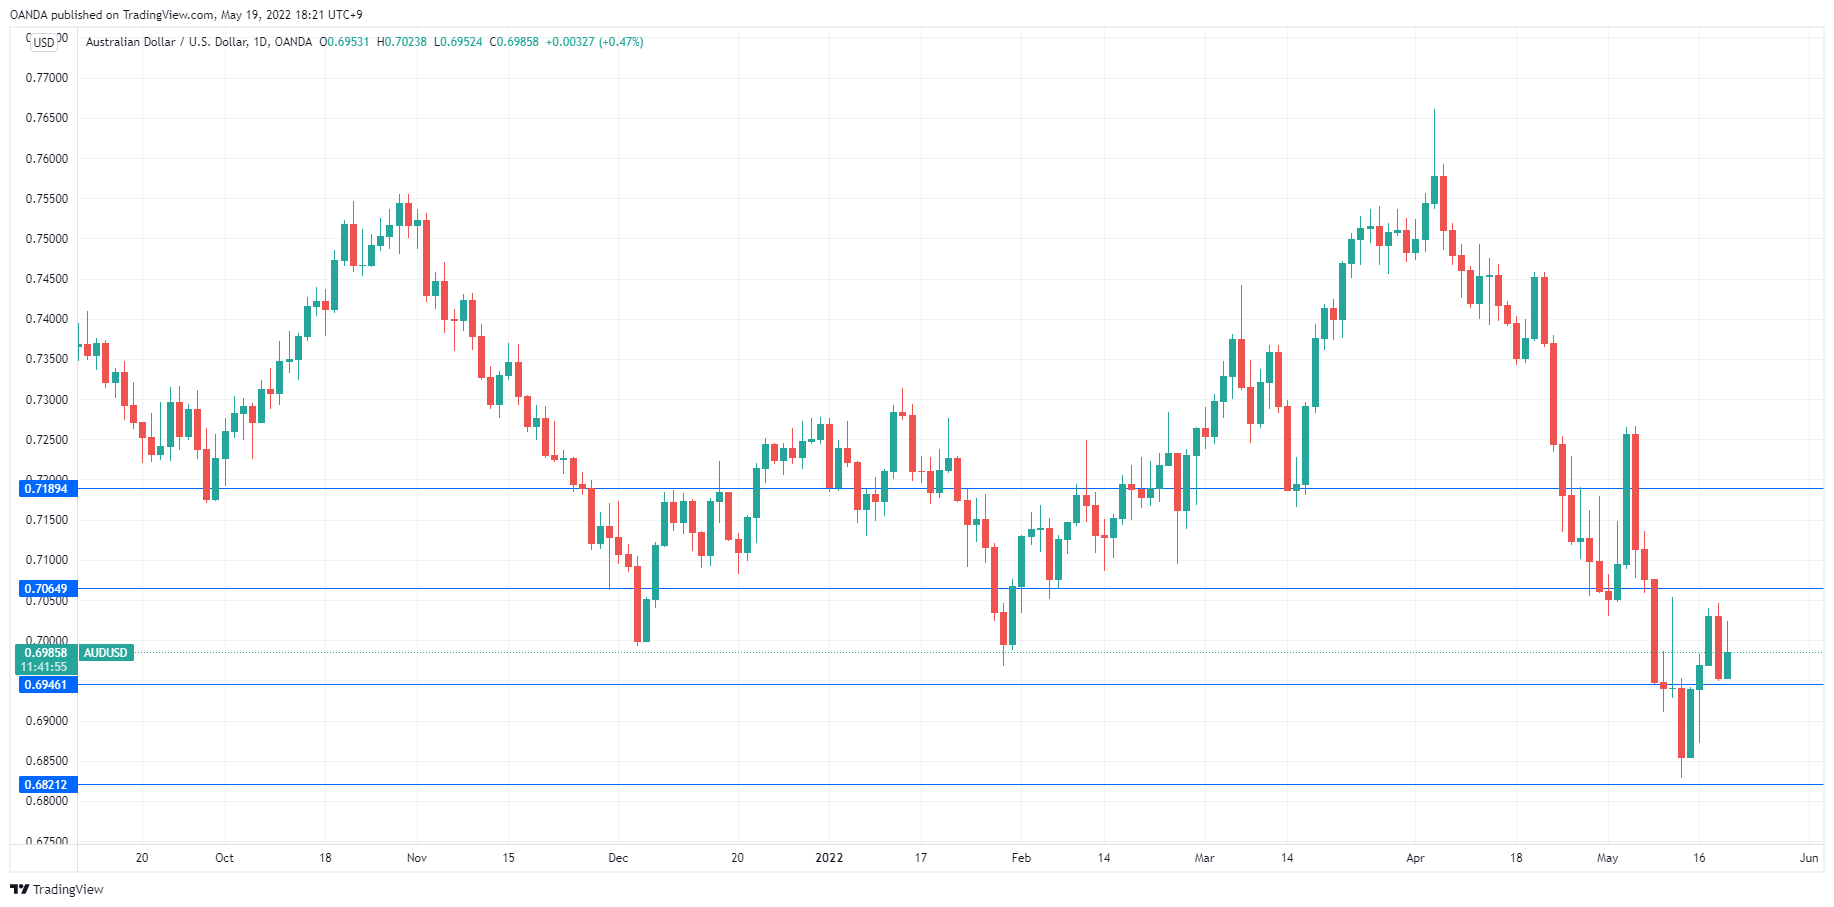
The Australian dollar has rebounded on Thursday. AUD/USD is trading at 0.6980 in the European session, up 0.38% on the day.
Australia’s April employment report was a further confirmation that the labour market remains tight. The economy created 4,000 new jobs, which is a marginal gain. However, there was an impressive gain in the number of full-time jobs (92.4 thousand), as part-time jobs declined (88.4 thousand). This move towards more full-time jobs should translate into stronger consumer spending. Even more importantly, the unemployment rate fell to a record low of 3.9%, down from 4.0%.
The employment data was solid but not spectacular, which means that the RBA will most likely deliver a modest 0.25% rate hike at the June meeting. Wage growth ticked higher to 2.4% in Q1, up from 2.3% prior. At one time, RBA Governor Lowe insisted that he would not raise rates until wage growth hit 3%, but he was forced to abandon this position as inflation has continued to accelerate. The Federal Reserve has adopted a front-load approach to tightening, which means higher rates earlier on in the tightening cycle. The RBA hasn’t given any signals that it will follow suit. Still, the RBA minutes indicated that a supersize 40-bps rate hike was considered at the May meeting, although policy makers ended up delivering a 25-bps increase. We’ll probably see another 25-bps hike in June, although a 40-bps move shouldn’t be completely discounted.
Australians will vote in a federal election on Saturday. Prime Minister Scott Morrison is in a tight race against Labour leader Anthony Albanese. Morrison can be expected to maintain fiscal and monetary policy, and if he wins this could give the Australian dollar a slight boost. A Labour government could raise taxes and spending, which would be bearish for the Australian dollar.
AUD/USD Technical
- AUD/USD faces resistance at 0.7064 and 0.7189
- There is support at 0.6946 and 0.6821