Sample Category Title
Daily Technical Analysis
EUR/USD
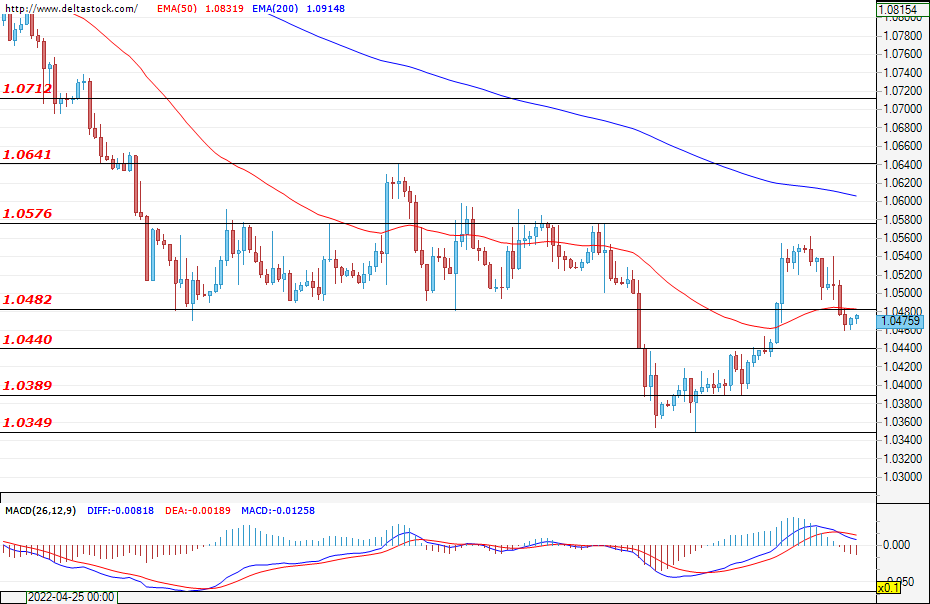
The bullish momentum faded and the euro lost some ground against the dollar during yesterday's session. The pair tested the support zone at 1.0482, and during the early hours of today`s trading, the EUR/USDis hovering under the mentioned zone. If the bearish attack continues and the breach is confirmed, then we will most likely see a test of the lower target at 1.0440, a violation of which could easily deepen the decline towards the support at 1.0389. If the bulls re-enter the market, then a successful test of the resistance zone at 1.0576 could continue the recovery for the EUR/USD and strengthen the positive expectations for the future path of the currency pair. An increase in market volatility can be expected around the announcement of the data on the Initial Jobless Claims for the U.S. (today; 12:30 GMT).
USD/JPY
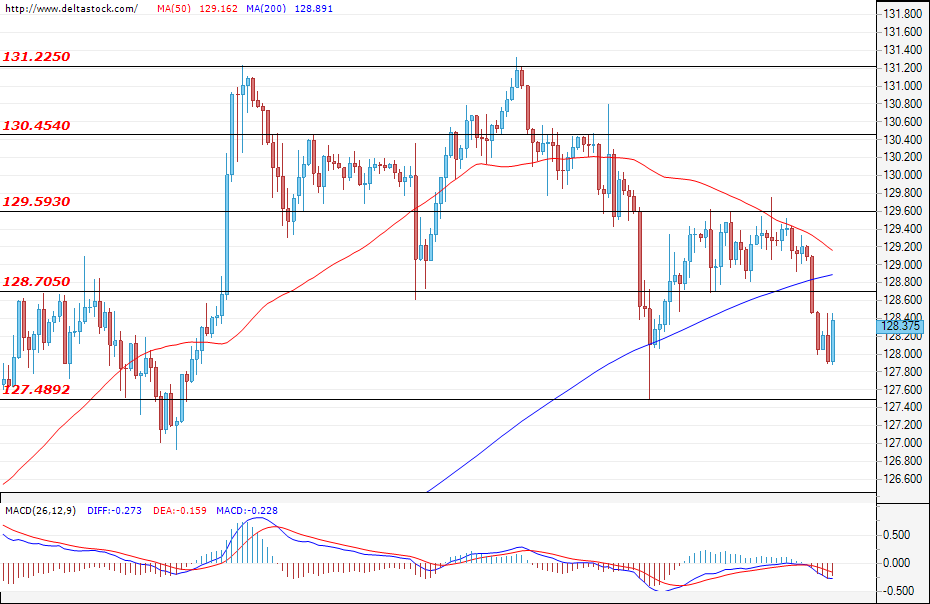
The bulls did not manage to gain enough momentum to successfully violate the resistance zone at 129.59 and the dollar depreciated against the yen. The pair breached the support at 128.70, and at the time of writing the analysis, trading is still limited below the aforementioned level.. If the bears prevail, then the expectations would be for a test of the support zone at 127.48. A successful breach here could easily lead to future losses and a move towards the levels from April at around 127.00. The first target for the bulls is the mentioned zone at 128.70, which is now acting as resistance, followed by the level at 129.59. A violation of the upper target at 130.45 could lead to a change in the current sentiment of the market participants and could incite an attack on the high at 131.22.
GBP/USD
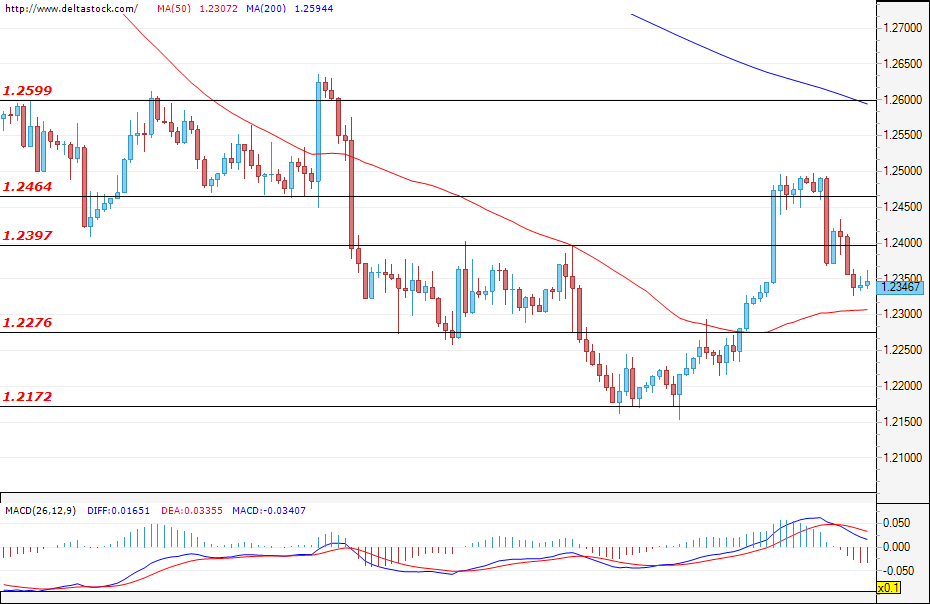
After the unsuccessful attack on the important zone at 1.2464, the sterling erased some of its recent gains against the dollar and the pair is trading below the support level at 1.2397.. If trading remains limited under the aforementioned zone, then the expectations would be for the depreciation of the sterling against the greenback to continue towards 1.2276, a breach of which would make a move towards 1.2172 highly probable.. If the bulls re-enter the market and breach the mentioned zone at 1.2397, then a follow-up breach of the major resistance at 1.2464 could mark the current move as corrective and could easily head the pair for a test of the upper target at 1.2599.
EUGERMANY40
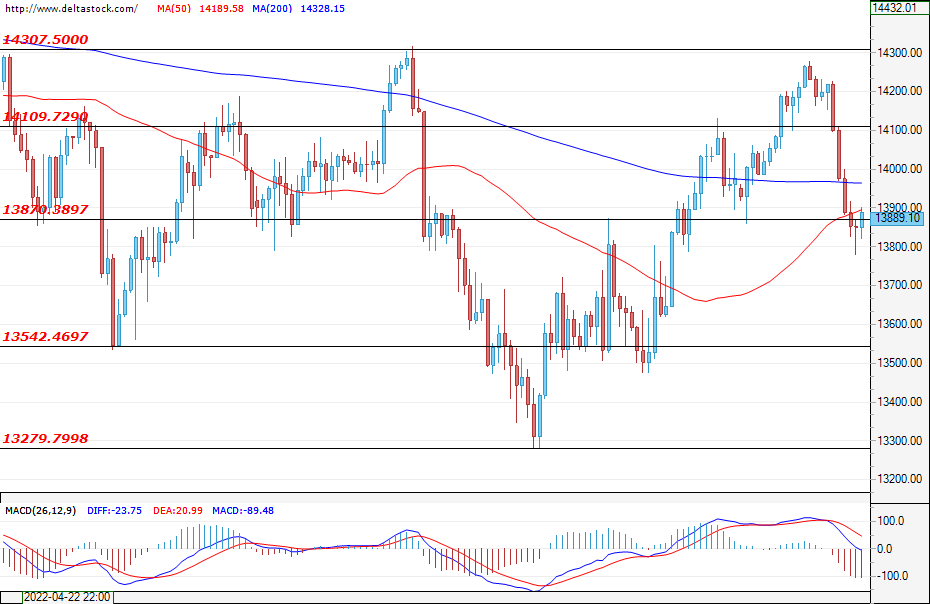
After the rally was limited to around the zone at 14250, the German index underwent a massive sell-off and tested the support at 13870. A confirmation of the breach here could continue the sell-off and could easily head the price for an attack on the next target at 13542. A violation of the lower zone at 13279 could lead to new losses and could strengthen the negative expectations for the future path of the index. The first resistance for the bulls is now the level of 14109, followed by the upper zone at 14307. Keeping in mind the extreme drop from yesterday, however, a corrective movement towards the mentioned resistances is quite likely.
US30
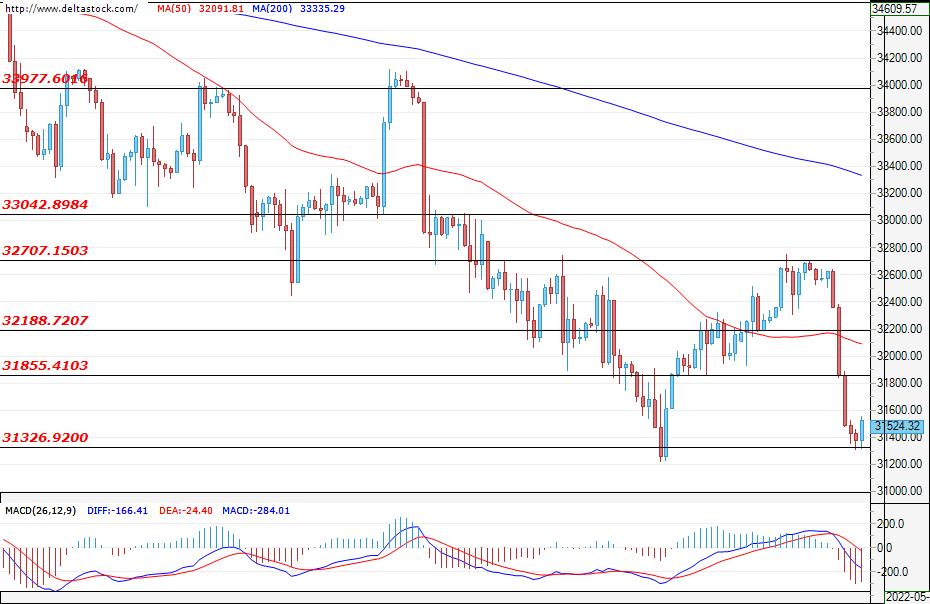
The inflation fears among market participants and the weak earnings of some American companies helped the bears prevail and the index erased most of its recent gains from the previous trading sessions. The drop was limited to the support zone at 31326, and at the time of writing, the price is hovering above the mentioned level. Worse-than-expected data in the U.S. for the Initial Jobless Claims (today; 12:30 GMT) could encourage the sellers to launch another attack on the level at 31326, while a successful breach could easily lead to new losses and could strengthen the negative expectations for the future path of the US30. If the bulls take control, then a breach of the first resistance at 31855, followed by a violation of the upper target at 32188, could continue the recovery and head the price for the important zone at 32707.
Bitcoin is Now Better than the Stock Market But Still in Decline
On Wednesday, Bitcoin was down 3%, ending the day around $29,200, remaining near that mark on Thursday morning. Ethereum lost 4.3%. Other altcoins in the top 10 fell from 1.8% (BNB) to 9.8% (Cardano).
The total capitalisation of the crypto market, according to CoinMarketCap, fell 3.6% overnight to $1.24 trillion. The Bitcoin Dominance Index rose 0.4% to 44.7%. The Cryptocurrency Fear and Greed Index was up 1 point to 13 by Thursday and remains in ‘extreme fear’ territory.
Bitcoin resumed its decline on Wednesday amid a sharp weakening of US stock indices, which fell even more than BTC. The Nasdaq and S&P 500 lost more than 4% on Wednesday. The impressive oversold strength accumulated by the crypto market after it collapsed 40% from late March levels (versus 16% for the S&P500) temporarily limits the declining scale.
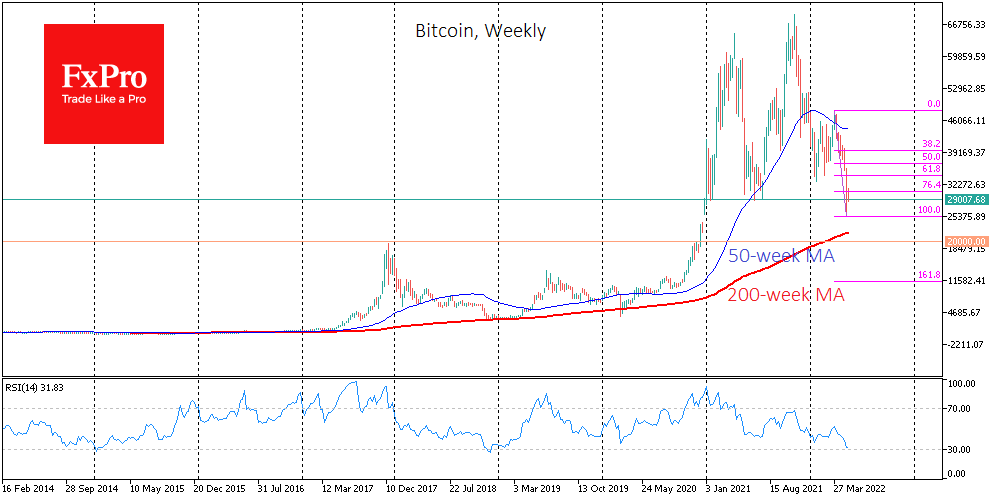
Nevertheless, the overall negative market sentiment has prevented the bulls from turning out in full force. So far, it isn’t easy to see reliable signs of oversold or rebound formation. We should be prepared for the cryptocurrency market to test support at last week’s lows again in the near term. We consider the area near 20K the final target for a potential selloff, which corresponds to Bitcoin’s long-term support line.
Among the news that caught our eye were:
Former US Federal Reserve chief Ben Bernanke called Bitcoin a harmful currency. He lashed out at cryptocurrencies, calling them “a great tool for extortionists”.
Binance lost $1.6 billion due to the collapse of Terra tokens on the exchange’s balance sheet.
Billionaire Bill Ackman said one of the main reasons for Terra’s collapse was a pyramid scheme of business. Investors were promised a 20% yield backed by a token whose value was determined by demand from new investors.
South Korea’s Financial Services Commission, amid tensions in the Stablecoin market, is proposing to register cryptocurrencies based on their level of risk to investors.
Microsoft has warned crypto investors of an increase in the activity of a new type of malware called Cryware, which allows the theft of assets from hot cryptocurrency wallets.
Birgit Rodolph, executive director of the German BaFin, called for universal regulation of the DeFi industry across the EU.
AUDUSD Bears Take a Breather after Almost 2-Year Low
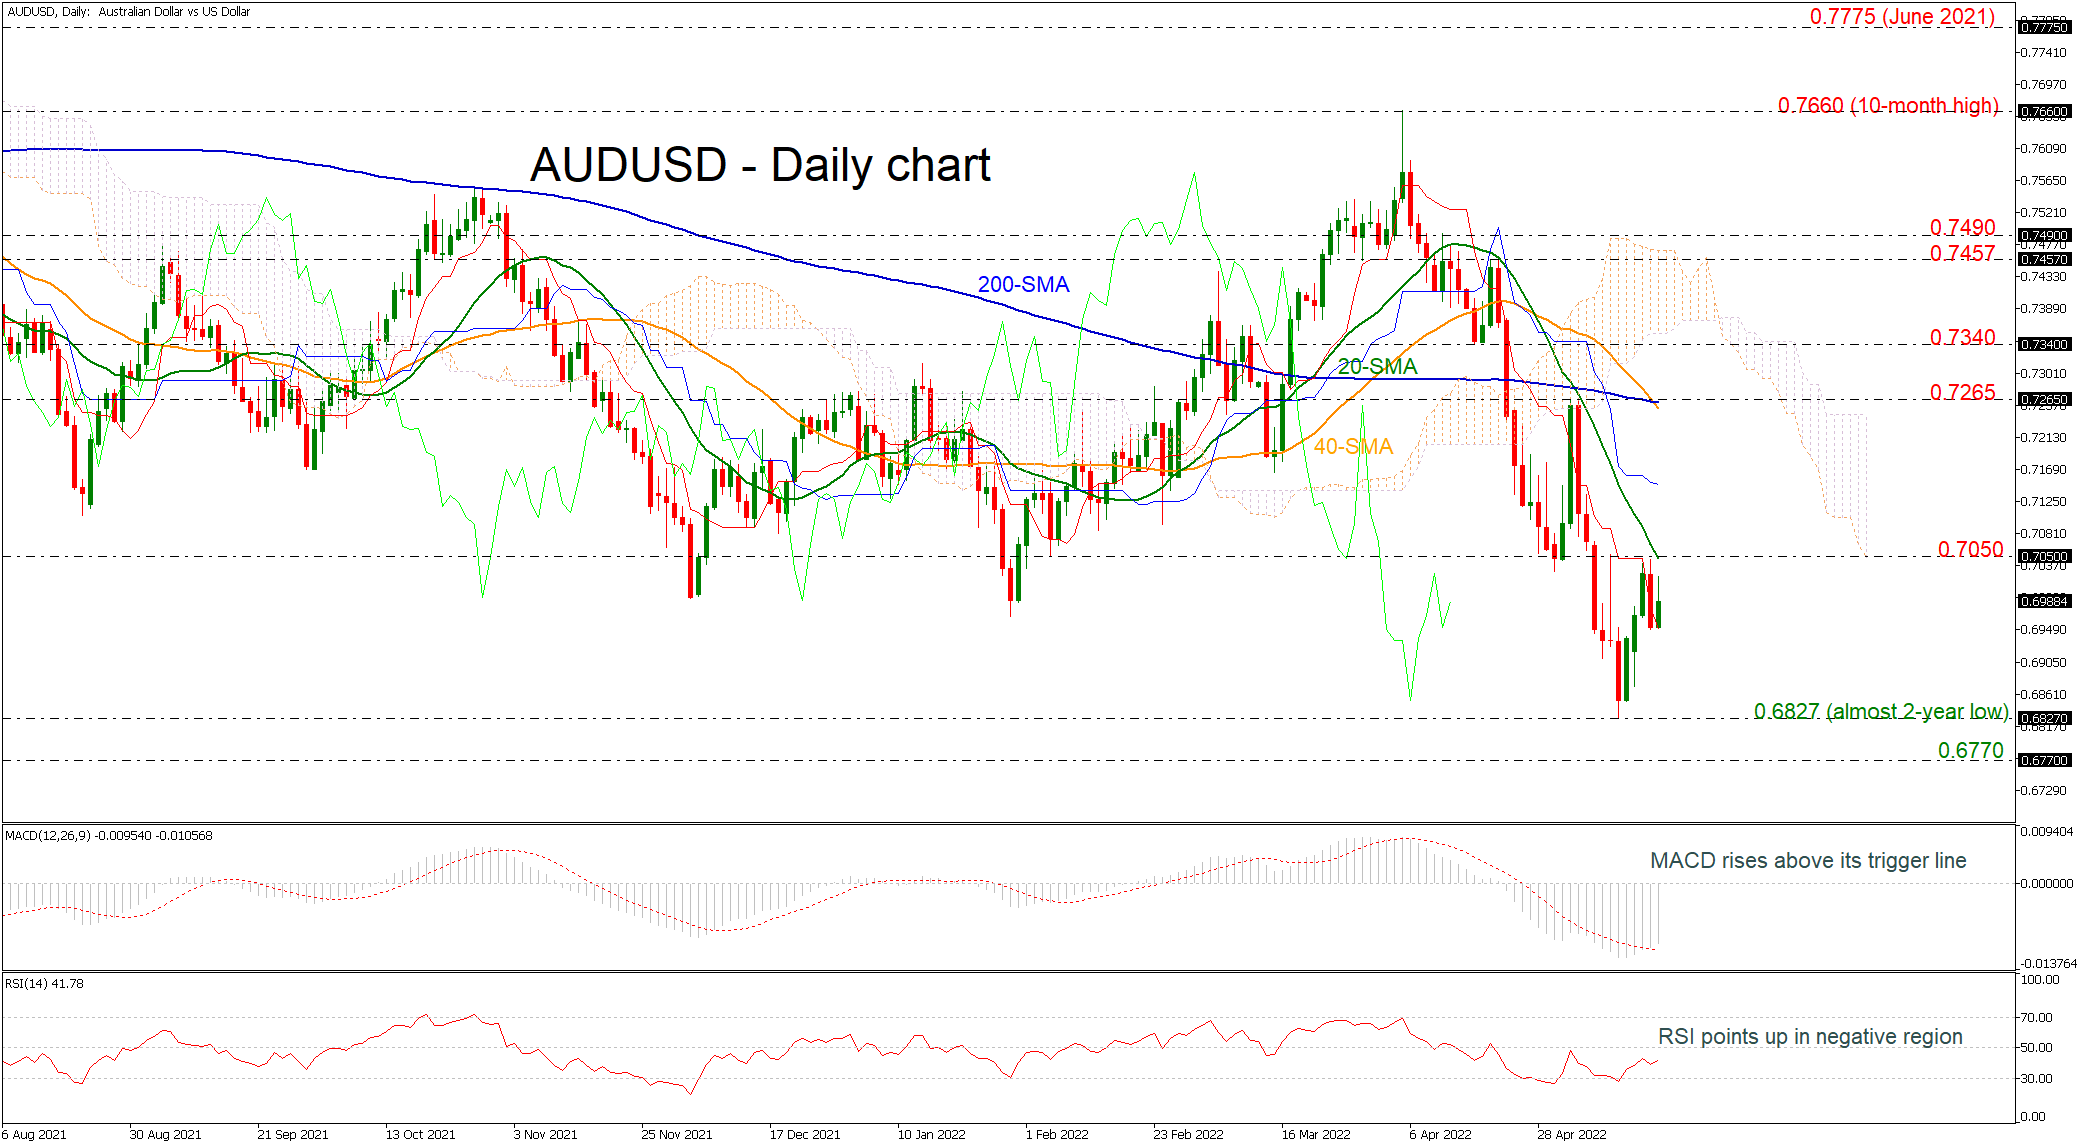
AUDUSD could not find enough buyers to overcome the 0.7050 resistance level, with the spotlight remaining to the downside as the steep negative bias is still holding.
Encouragingly, however, the RSI and the MACD continue to hold above their recent lows, while the latter has also managed to crawl back above its red signal line, providing some optimism that the bulls may not give up the battle yet.
The 0.7050 number, which overlaps with the 20-day simple moving average (SMA), could challenge any bullish attempts towards the bearish crossover within the 40- and 200-day SMAs near the 0.7265 barrier. The bottom of the Ichimoku cloud is also in the neighbourhood near the 0.7340 resistance. Hence, any breakout at this point may gather extra interest, with the price likely speeding up to 0.7457 in the aftermath.
Alternatively, an extension lower again will strengthen the case for a down-trending market, likely activating a fresh bearish wave below the almost two-year low of 0.6827. Failure to hold above that floor could cause another negative extension towards the 0.6770 restrictive region, registered in June 2020. Even lower, the market could meet the inside swing high of April 2020 at 0.6570.
In brief, AUDUSD has been developing in a descending movement since the beginning of the previous month; however, upside corrections cannot be ruled out in the near term according to the technical indicators.
We Can Now Firmly Label this Week’s Earlier Action as Bear Market Rally or Dead Cat Bounce
Markets
A heavy selling wave on US stock markets eventually reversed intraday weakness on core bond markets while granting the dollar a push in the back. Main US indices ceded 3.6% (Dow) to 4.7% (Nasdaq). Retailers underperformed after weaker-than-expected earnings by amongst others Target. The CFO warned that fuel and freight costs will be $1bn higher than forecast this year, but that the company would absorb the costs rather than raise prices on shoppers. Walmart raised a more or less similar concern thought they already passed some of the price increases to consumers. Home improvement companies like Lowe’s and Home Depot posted small profits, but warned that the amount of shoppers is drying up. All of these clues suggest that Joe Sixpack will start being impacted by the higher cost-of-living as well.
We can now firmly label this week’s earlier action as a bear market rally or a dead cat bounce. Action on European and US stock markets this year morphed into a sell-on-upticks pattern. Fast policy normalization (plans), the high inflation environment and feeble growth prospects are responsible.
The heavy sell-off generated a safe haven bid into core bonds. US Treasuries outperformed. The US yield curve bull flattened with yields dropping 3.2 bps (2-yr) to 11.4 bps (30-yr). Daily changes on the German curve varied between +1.9 bps (3-yr) and -2.8 bps (30-yr).
There will be some catching-up action this morning, though Bunds were underperforming US Treasuries during European dealings as more ECB governors shed their light on the upcoming normalization cycle. ECB Rehn mentioned broad consensus to get rid of negative interest rates relatively quickly, suggesting no pauses once the rate hikes begin.
The dollar ended a three-day correction yesterday with the trade-weighted greenback bouncing from an open at 103.34 to a close of 103.81. EUR/USD slid from 1.055 to 1.0464. Only the yen managed to outpace the greenback yesterday with USD/JPY closing at 128.23 from an open at 129.38. Risk sentiment on stock markets will remain the dominant trading theme today. Main Asian benchmarks lose 1% to 2% despite rumours that Chinese banks may cut their benchmark lending rates for a second time this year.
Today’s eco calendar contains US weekly jobless claims and Philly Fed Business Outlook. The latter might show similar warning signals as the Empire Manufacturing Survey earlier this week. Minutes of the ECB meeting could be interesting, put probably outdated and no longer influential following the past week’s “coming out” in favour of a July rate hike. Risk aversion favours bonds and the dollar..
News Headlines
The Australian labour market added 4k jobs in April. That was below expectations for 30k. A surge in full time employment (92.4k) was partially offset by a decline in part time jobs. The unemployment rate stabilized at the lowest since 1974 (3.9%), despite the meagre jobs growth. A slight decline in the participation rate to 66.3% helped realize that. Hours worked jumped by 1.3% m/m but reflected a bounce back from a flood-affected March. There is still double the amount of people working no or reduced hours due to Covid illness compared to before the pandemic. The outcome eyes mixed but should be seen against an economy near full capacity. It comes after slightly less-than-expected Q1 wage growth and is the last important data ahead of Saturday’s general elections. The Aussie dollar was largely unaffected. AUD/USD recaptures 0.70 but that strengthening move came one hour later. The Russian economy slowed from 5% to 3.5% y/y (vs. 3.7% expected) in Q1 this year, data showed yesterday. Mining, the sector that includes oil and gas, helped spur growth by an 8.5% increase. Economic growth in the country is expected to shrink significantly in the coming quarters following a series of sanctions by the western countries. The Russian central bank has penciled in a contraction of 10% this year. Russian CPI eased to 0.05% week-over-week. That’s the slowest pace since September last year, driven in part by dampened consumer demand. In the aftermath of the Russian invasion on February 24, weekly CPI shot up to more than 2%. USD/RUB marginally weakened 64.36 yesterday and extends losses to 63.66 this morning. It’s the strongest RUB level since early 2020.
EUR/USD Daily Outlook
Daily Pivots: (S1) 1.0425; (P) 1.0495 (R1) 1.0529; More...
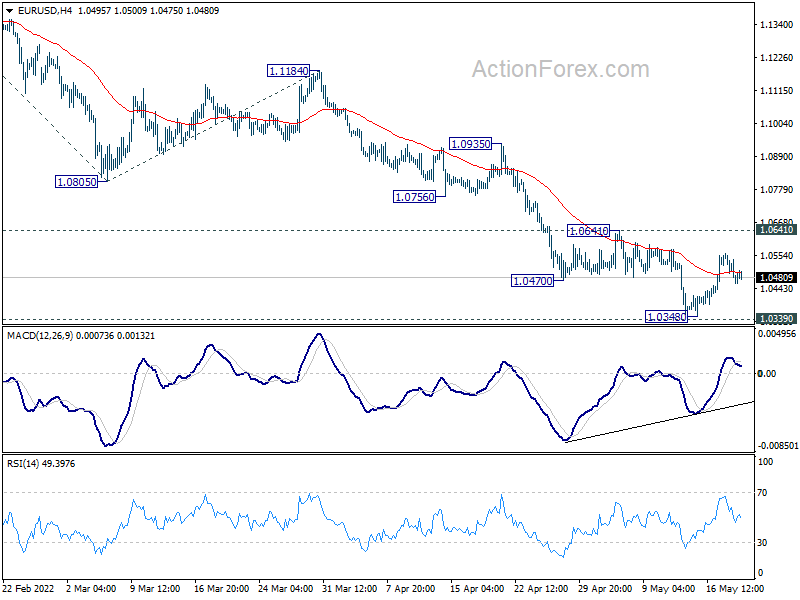
Intraday bias in EUR/USD stays neutral at this point. Considering bullish convergence condition in 4 hour MACD, break of 1.0641 resistance will confirm short term bottoming at 1.0348, ahead of 1.0339 long term support. Intraday bias will be turned back to the upside for 1.0805 support turned resistance. On the downside, however, decisive break of 1.0339 will carry larger bearish implication and target 161.8% projection of 1.1494 to 1.0805 from 1.1184 at 1.0069.
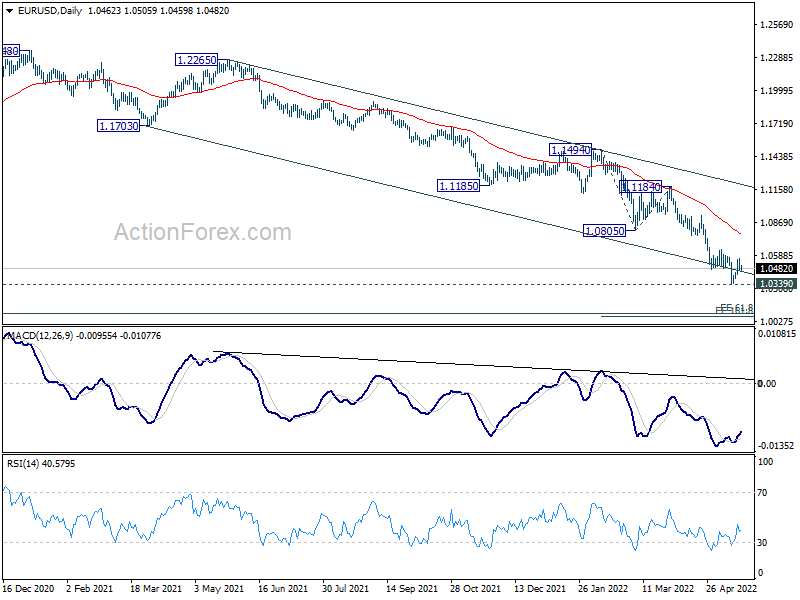
In the bigger picture, break of medium term channel support suggests downside acceleration. Current decline from 1.2348 (2021 high) is probably resuming long term down trend from 1.6039 (2008 high). Decisive break of 1.0339 will confirm this bearish case. Next target is 61.8% projection of 1.3993 to 1.0339 from 1.2348 at 1.0090. This will now remain the favored case as long as 1.0805 support turned resistance holds.
GBP/USD Daily Outlook
Daily Pivots: (S1) 1.2284; (P) 1.2392; (R1) 1.2455; More..
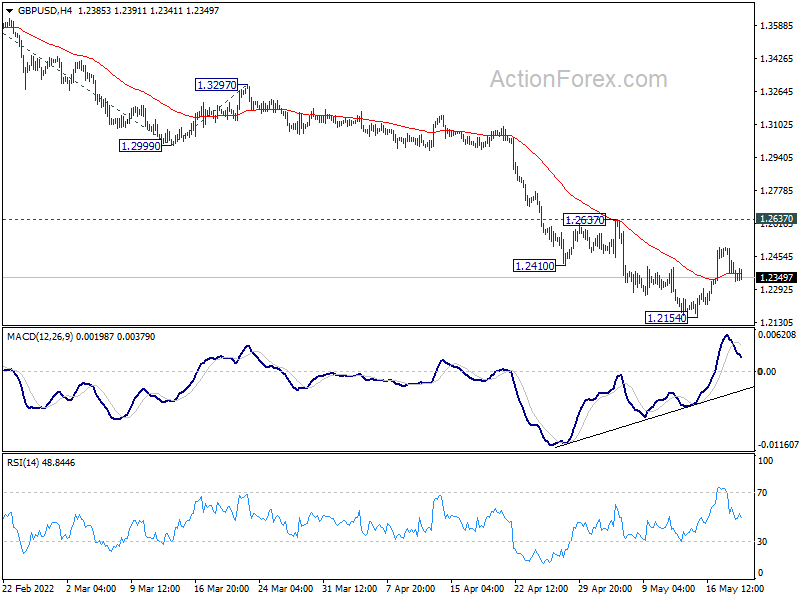
Intraday bias in GBP/USD remains neutral for consolidation above 1.2154. Further decline will remain in favor as long as 1.2637 resistance holds. On the downside, break of 1.2154 will resume the down trend from 1.4248 to 200% projection of 1.3641 to 1.2999 from 1.3297 at 1.2013. However, considering bullish convergence condition in 4 hour MACD, break of 1.2637 will confirm short term bottoming at 1.2154. Intraday bias will be turned back to the upside for 55 day EMA (now at 1.2796).
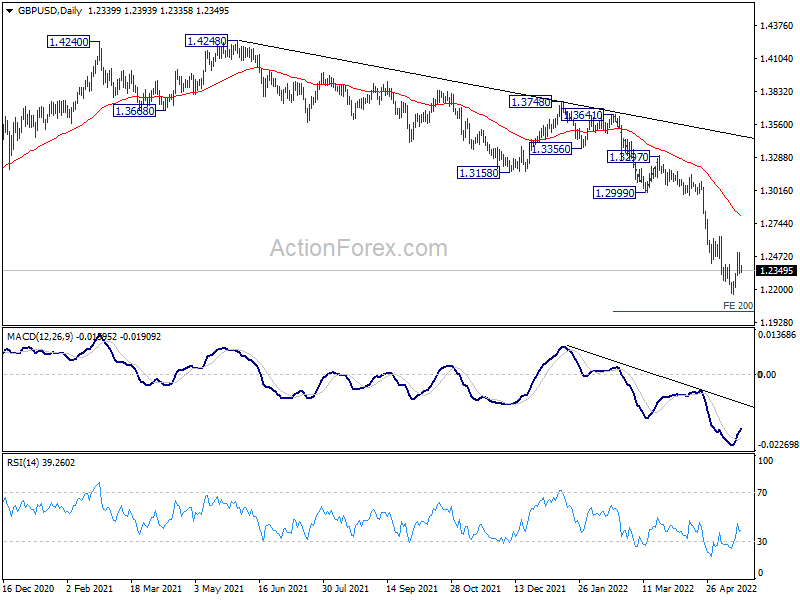
In the bigger picture, based on current momentum, fall from 1.4248 (2018 high) at least at the same degree as the rise from 1.1409 (2020 low). That is, fall from 1.4248 could be a leg inside the pattern from 1.1409, or resuming the longer term down trend. In either case, deeper decline is expected as long as 1.2999 support turned resistance holds. Next target is 1.1409 low.
USD/CHF Daily Outlook
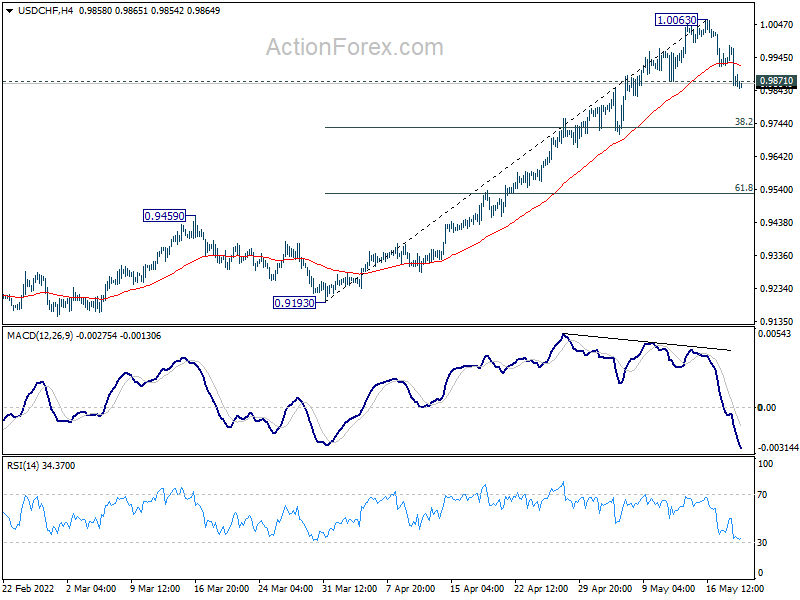
Daily Pivots: (S1) 0.9835; (P) 0.9910; (R1) 0.9959; More...
A short term top is in place at 1.0063 on bearish divergence condition in 4 hour MACD. Intraday bias in USD/CHF is now mildly on the downside for 38.2% retracement of 0.9193 to 1.0063 at 0.9731. For now, risk will stay mildly on the downside as long as 1.0063 resistance holds, in case of recovery.
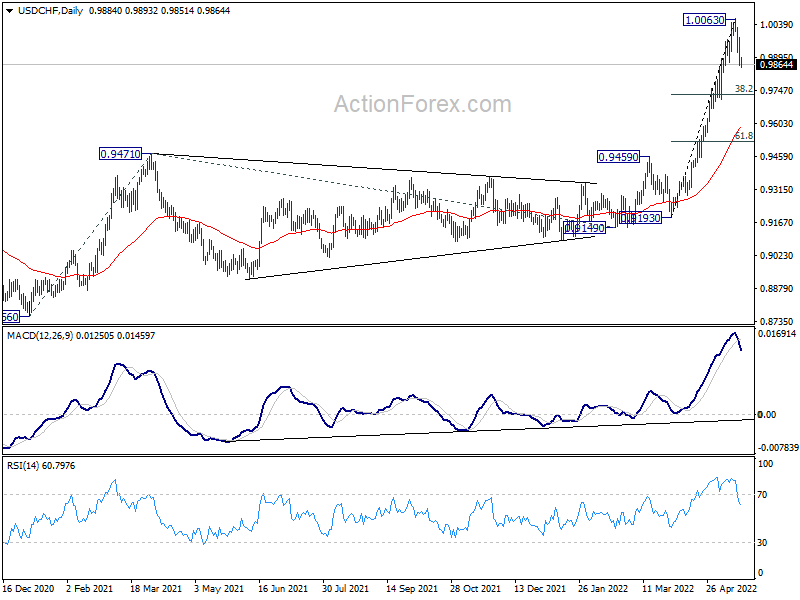
In the bigger picture, down trend from 1.0342 (2016 high) should have completed with three waves down to 0.8756 (2021 low) already. Rise from 0.8756 is likely a medium term up trend of its own. Next target is 161.8% projection of 0.8756 to 0.9471 from 0.9149 at 1.0306, which is close to 1.0342 (2016 high). This will remain the favored case as long as 0.9459 resistance turned support holds.
USD/JPY Daily Outlook
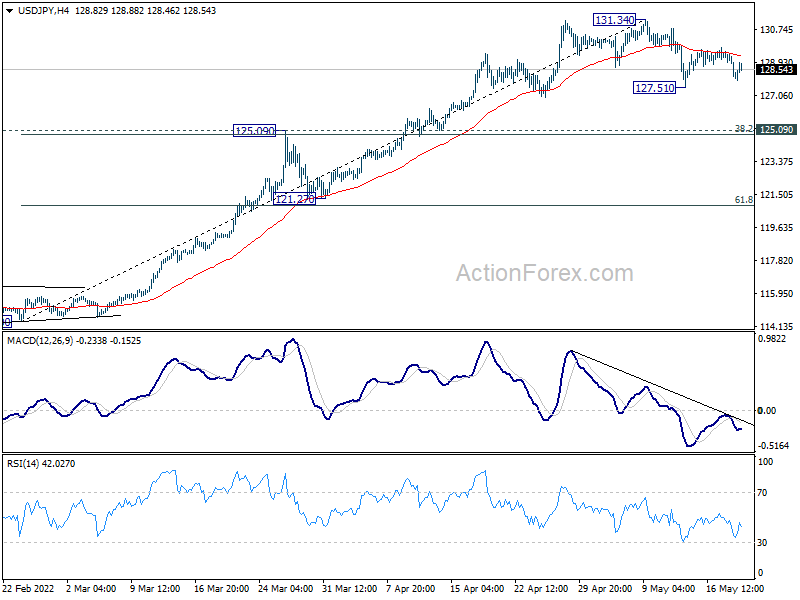
Daily Pivots: (S1) 127.65; (P) 128.60; (R1) 129.18; More...
Intraday bias in USD/JPY remains neutral and corrective pattern could extend further. Break of break of 127.51 will target 125.09 cluster support (38.2% retracement of 114.40 to 131.34 at 124.86). On the upside, firm break of 131.34 will resume larger up trend.
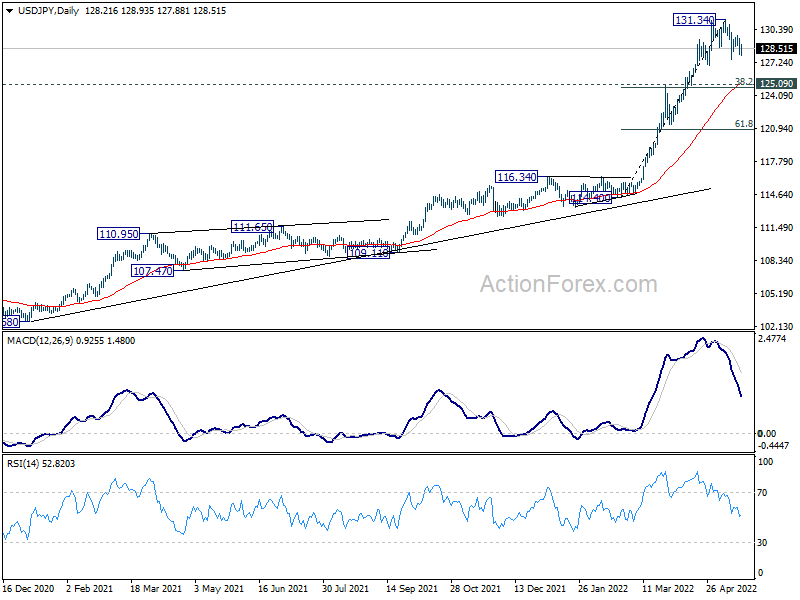
In the bigger picture, current rally is seen as part of the long term up trend form 75.56 (2011 low). Sustained trading above 61.8% projection of 75.56 (2011 low) to 125.85 (2015 high) from 98.97 at 130.04 will pave the way to 100% projection at 149.26, which is close to 147.68 (1998 high). For now, this will remain the favored case as long as 121.27 support holds.
AUD/USD Daily Report
Daily Pivots: (S1) 0.6919; (P) 0.6983; (R1) 0.7016; More...
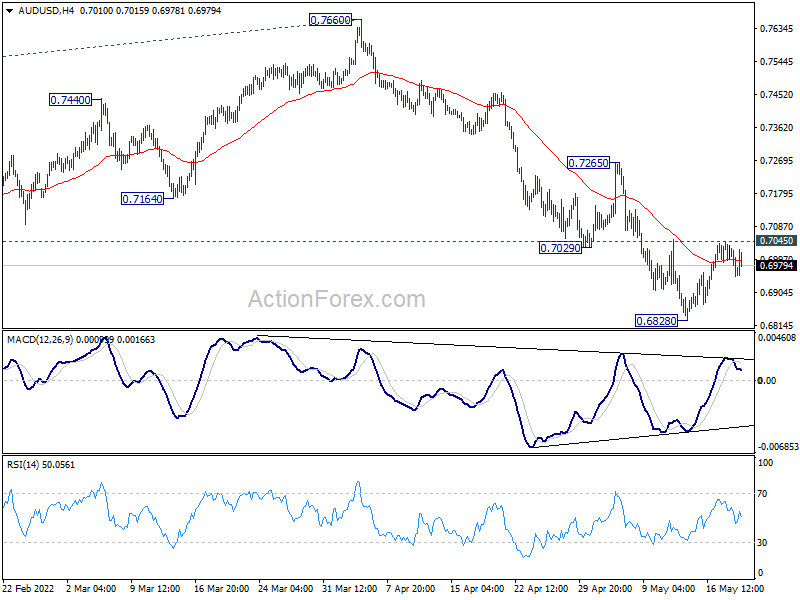
Intraday bias in AUD/USD remains neutral for the moment. On the upside, above 0.7045 will resume the rebound from 0.6828 to 0.7265 resistance next. On the downside, though, break of 0.6828 will resume larger fall from 0.8006, and target 0.6756/60 medium term fibonacci level next.
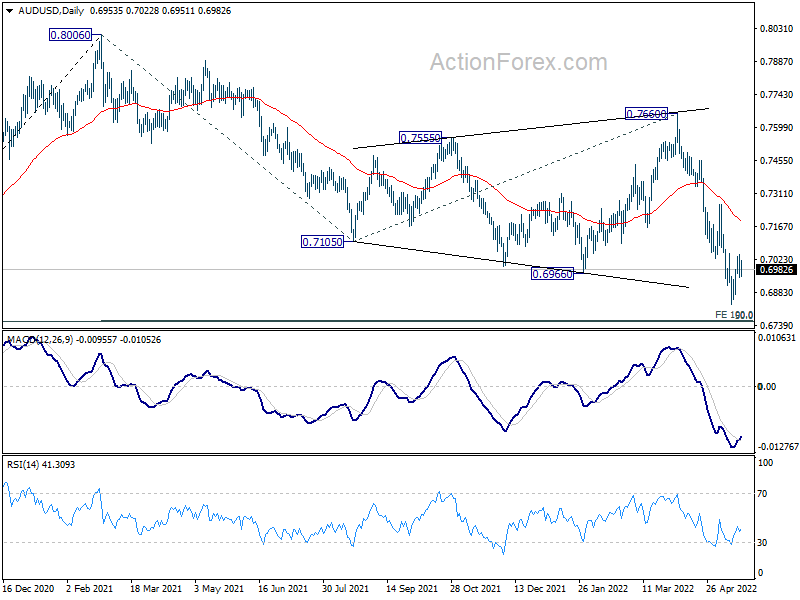
In the bigger picture, price actions from 0.8006 are seen as a corrective pattern to rise from 0.5506 (2020 low). Deeper fall should be seen to 50% retracement of 0.5506 to 0.8006 at 0.6756. This coincides with 100% projection of 0.8006 to 0.7105 from 0.7660 at 0.6760. Strong support is expected from 0.6756/60 cluster to contain downside to complete the correction. However, sustained break of 0.6756/60 would argue that AUD/USD is indeed already in a medium term down trend.
USD/CAD Daily Outlook
Daily Pivots: (S1) 1.2827; (P) 1.2862; (R1) 1.2927; More...
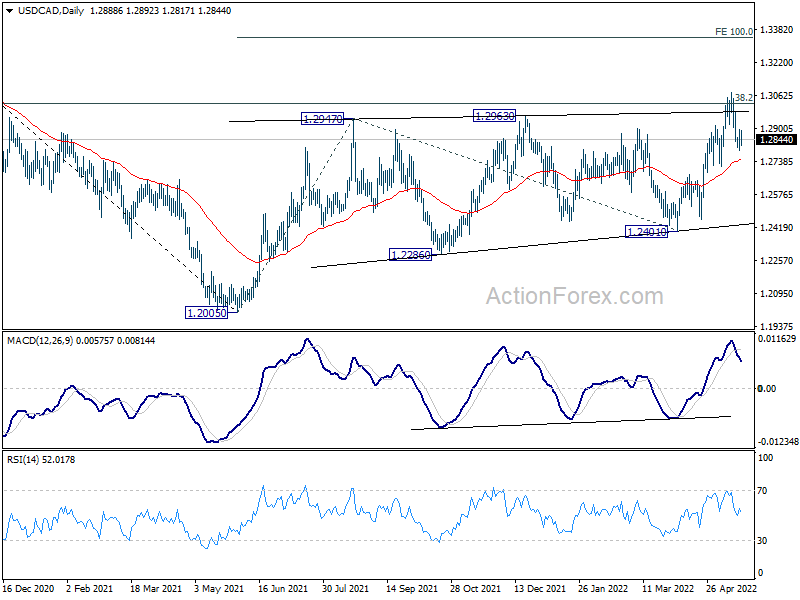
Intraday bias in USD/CAD remains neutral for the moment. Overall, further rally is in favor with 1.2712 support intact. On the upside, break of 1.3075 will resume the rise from 1.2401. Sustained trading above 1.3022 fibonacci level will carry larger bullish implications. Next target will be 100% projection of 1.2005 to 1.2947 from 1.2401 at 1.3343. On the downside, however, break of 1.2712 support will indicate rejection by 1.3022 key fibonacci resistance, and bring deeper decline back to 1.2401 support.
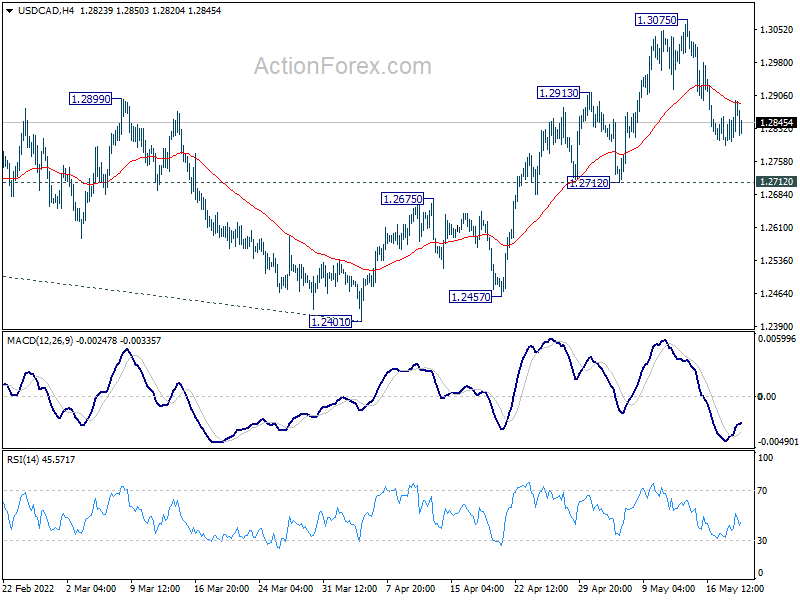
In the bigger picture, focus stays on 38.2% retracement of 1.4667 (2020 high) to 1.2005 (2021 low) at 1.3022. Sustained break there should confirm that the down trend from 1.4667 has completed after defending 1.2061 long term cluster support. Further rise would then be seen towards 61.8% retracement at 1.3650. However, rejection by 1.3022 will maintain medium term bearishness. Break of 1.2005 will resume the down trend from 1.4667 and that carries larger bearish implications too.