Sample Category Title
WTI Wave Analysis
- WTI reversed from resistance area
- Likely to fall to support level 105.00
WTI crude oil recently reversed down from the resistance area located between the key resistance level 110.00 (which has been reversing the price from April) and the upper daily Bollinger Band.
This resistance zone near was further strengthened by 50% Fibonacci correction of the downward ABC correction (2) from the start of March.
WTI crude oil can be expected to fall further toward the next support level 105.00.

EURGBP Bearish Bias Enhanced by Capping Ichimoku Cloud
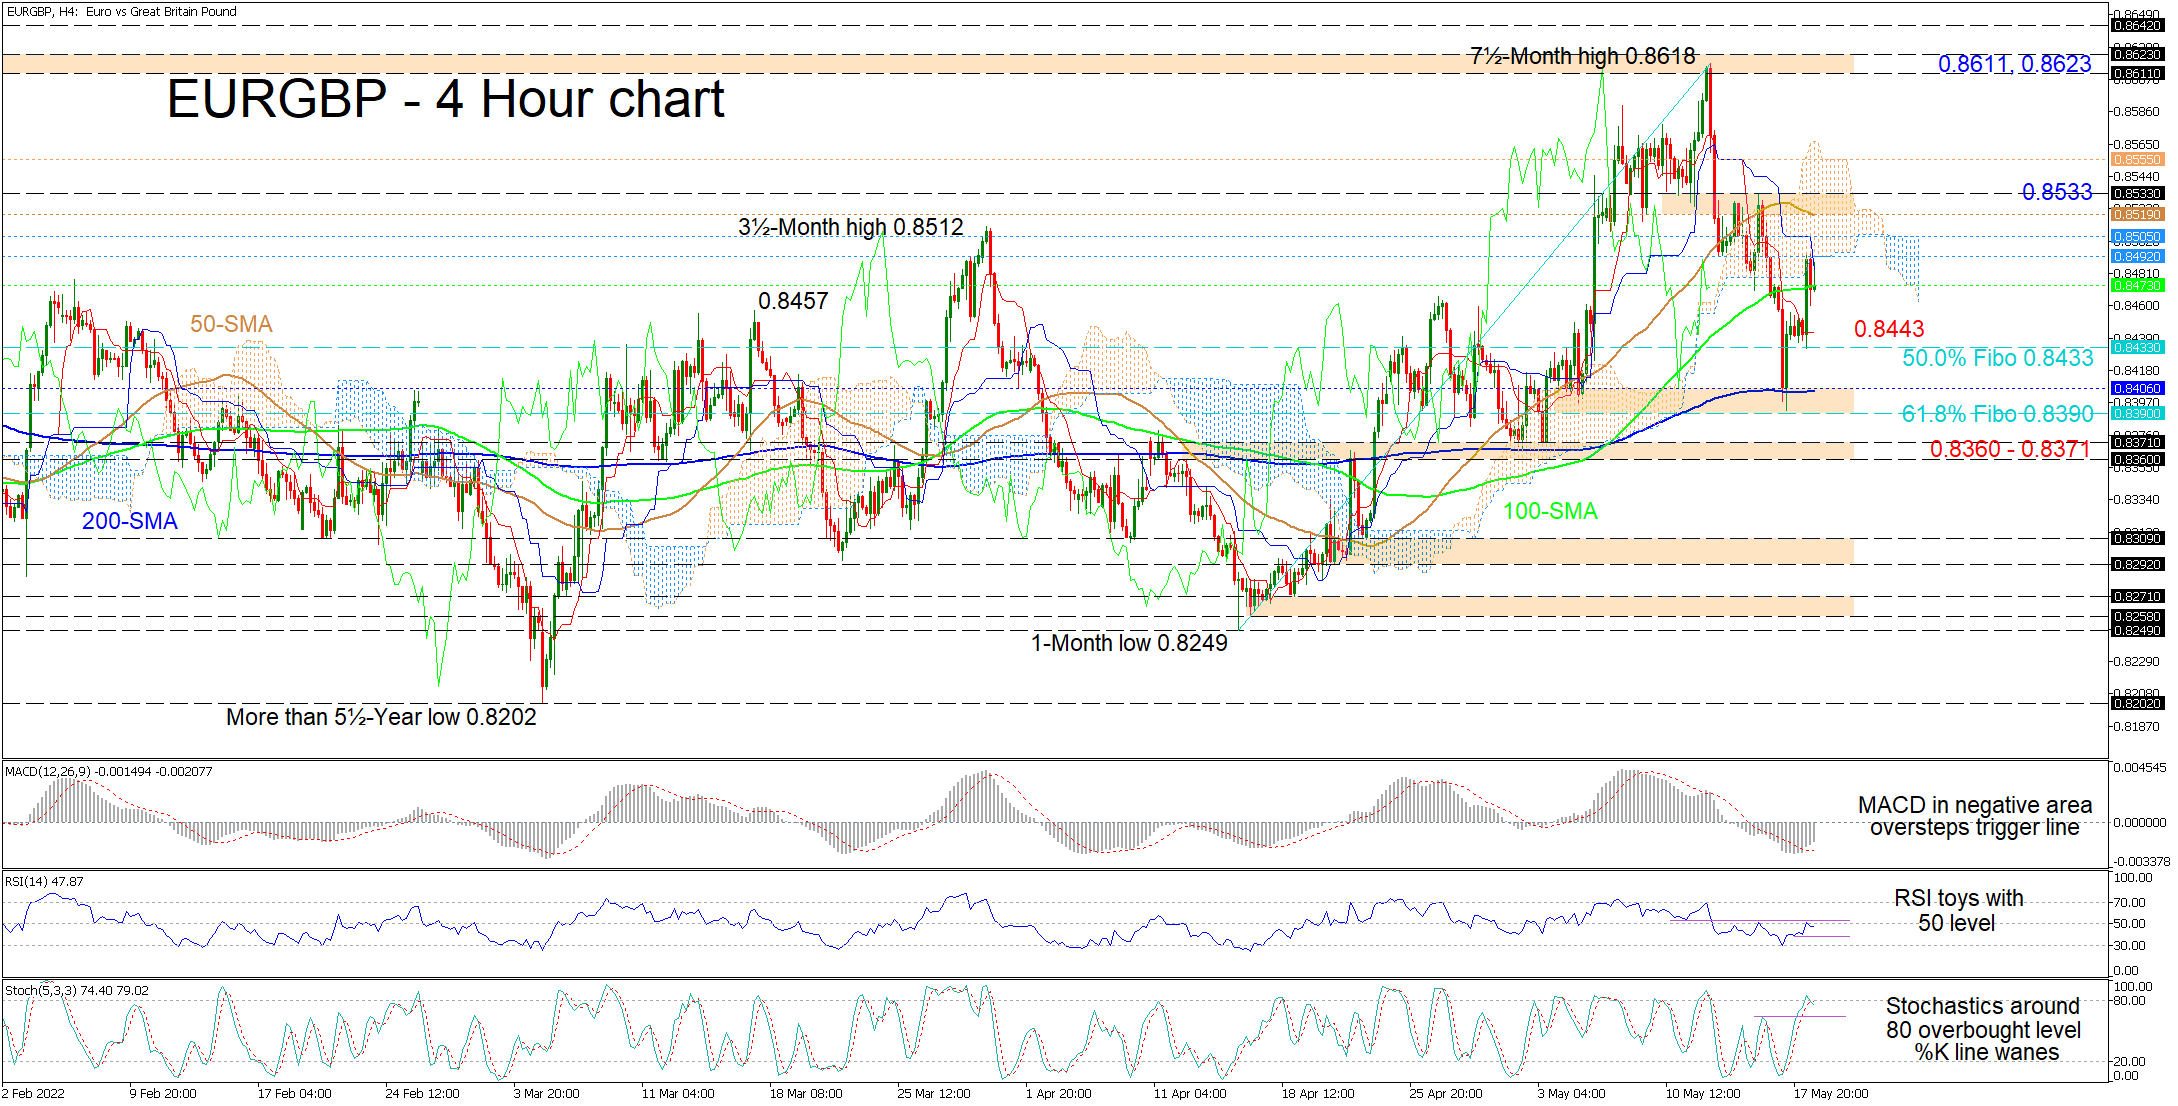
EURGBP's positive impetus, which evolved from the vicinity of the 200-period simple moving average (SMA) at 0.8406, is trading around the 100-period SMA at 0.8473 after fading from the lower surface of the Ichimoku cloud. The cloud has revived the more than one-week decline from the seven-and-a-half-month peak of 0.8618, something which the rolled over 50-period SMA is also endorsing.
The Ichimoku lines are suggesting that downside risks remain active, while the positive message from the short-term oscillators appears somewhat shaky. The MACD, in the negative region, is climbing above its red trigger line, while the RSI is flirting with the 50 neutral threshold. The positive charge of the stochastic oscillator is also in question as the stochastic lines are residing at the 80 overbought mark.
If positive forces continue to evaporate and the pair retreats beneath the 100-period SMA at 0.8473, sellers may then encounter downside friction around the red Tenkan-sen line at 0.8443 and the 0.8433 level, which is the 50.0% Fibonacci retracement of the up leg from 0.8249 until 0.8618. Remaining skewed to the downside, the bears could then challenge the tough support section from the 200-period SMA at 0.8406 until the 61.8% Fibo of 0.8390, an area that also includes the valid trough of May. Sinking beneath the 61.8% Fibo mark would boost the descent in the pair, with the price weighing on the 0.8360-0.8371 support border that stretches back to mid- April.
In the positive scenario, initial heavy resistance exists between the cloud’s lower surface at 0.8492 and the 0.8505 level. Should the bulls push even higher, they may then tackle a resistance zone linking the 50-period SMA at 0.8519 with the 0.8533 barrier. From here, if positive developments in the pair endure and pilot beyond the 0.8555 mark, traders’ attention could then shift to the resistance band, moulded by the 0.8611 inside swing low in September 2021 and the October 2021 high of 0.8623.
As things stand, EURGBP gains are being curbed by the Ichimoku cloud, while downside risks linger in the background. For another deep retracement to be avoided, the bulls would need to thrust the price north of the 0.8533 high.
UK Inflation Soars to 9%
Pound slides after CPI report
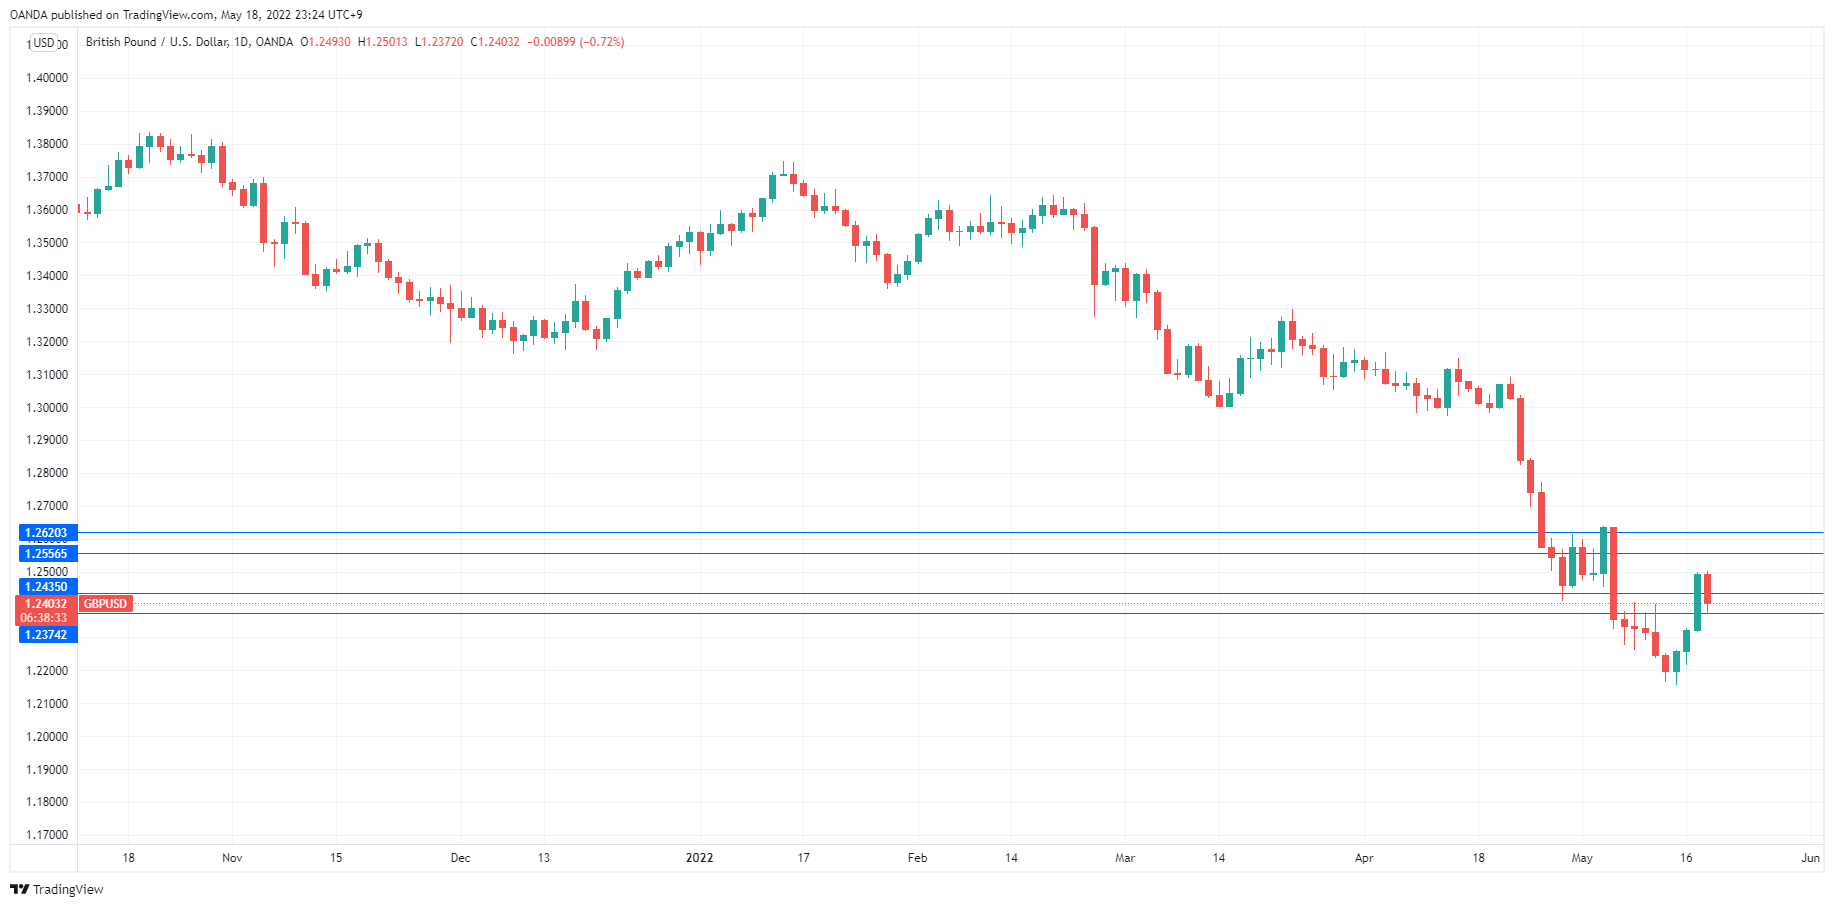
The British pound has taken a tumble after April CPI jumped to 9.0% YoY, up sharply from 7.0% in March. GBP/USD has fallen 100 points today and is trading at 1.2390 in North American trade.
UK inflation continues to run at a 40- year high, and the cost of living crisis is undoubtedly keeping Finance Minister Sunak and BoE Governor Bailey awake at night. Core CPI didn’t provide any relief, as it rose to 6.2%, up from 5.7% prior. This indicates that inflationary pressures are broad-based and aren’t about to ease anytime soon. The only positive in the CPI release was that it was a bit lower than the forecast of 9.1%, but I’m sure few in the City of London are taking any solace from that tidbit.
The BoE has essentially raised the white flag on the inflation front, saying that many of the factors at play, such as the Ukraine war and soaring energy costs are beyond the Bank’s control. The BoE has warned that things could get worse, projecting that inflation will top 10% later this year and warning of a likely recession. Bailey & Co. are doing their best to catch up with the inflation curve as they aggressively hike rates while trying not to choke off economic growth.
With the spectre of 10% inflation looming, confidence in the BoE may be ebbing. Like the Fed, the BoE has come under heavy criticism for not reacting to spiralling inflation quickly enough, and the 25-bps incremental hikes may not prove to be sufficient. The Fed has gone full throttle with a 50-bps hike and more to follow, and pressure is mounting on the BoE to follow suit.
The US is also facing spiralling inflation, and Fed Chair Powell has signalled that the Fed will deliver 0.50% hikes in June and July. Former Fed Chair Bernard Bernanke weighed in on Fed policy, saying that it was a mistake for the Fed not to react earlier to rising inflation. Bernanke also warned that the US economy could face stagflation in the next year or two.
GBP/USD Technical
- GBP/USD has broken below support at 1.2436. Below, 1.2374 is under pressure
- There is resistance at 1.2557 and 1.2619
Sunset Market Commentary
Markets
ECB policy makers keep up the July rate hike rhetoric. ECB Muller, de Cos and Rehn were today’s chosen ones. Interestingly, more governors start talking about what could come next after an inaugural July move. ECB Rehn was most outspoken, suggesting broad agreement amongst ECB members that negative interest rates should end “relatively quickly”. Tomorrow’s Minutes could give us some more flavour on how fast the mindset amongst governors is changing these days. This week’s comments in any case point to the fact that Frankfurt’s reaction function will likely be in line of the one of other normalizing central banks: hiking rates at any possible opportunity and showing preparedness to step it up (eg ECB Knot yesterday or Holzmann earlier) in magnitude if necessary. European money markets picked up the signal again with 3m Euribor futures rising around 5 bps in yield terms in the end 2022/end 2023 segment. European yield curves bear flatten. German yields add around 6 bps at the front end while trading more or less stable at the very long end. As we effectively approach the start of the tightening, we’ll probably see more of those flatteners in Europe. Up until now, the rising yield environment mostly came with (bear) steepeners. The US yield curve flattens as well today, but moves are less outspoken than in Europe. Daily changes vary between +2.2 bps (2-yr) and -0.5 bps (30-yr). The relative interest rate support couldn’t establish a further comeback of the single currency against a generally better dollar today. The pair changes hands in the low 1.05-area for most of the day. Key support is still located at 1.0341 while first, minor, intermediate resistance at 1.0642 remains untested. Stock markets lacked yesterday vigor and help explain the relatively better USD performance. Today’s only datapoints were US housing numbers. They gradually start to show an over-the-top market, but alarm bells aren’t really ringing yet. April housing starts stabilized on a monthly basis (-0.2% M/M) while building permits declined by 3.2% M/M. Sterling grabbed quite some headlines as well over the past couple of sessions. This morning’s highest inflation print since 1982 (6.2% Y/Y for core and 9% Y/Y for headline) didn’t really came as a surprise. Yesterday’s heavy UK Gilt sell-off initially didn’t continue, capping sterling’s comeback as well. It was only later in the session when UK Gilts start following especially European bonds south, capping EUR/GBP’s intraday march from 0.8440 towards 0.85. News Headlines
Headline inflation in Canada accelerated by 0.6% m/m to 6.8% in April, up from 6.7% last month. Expectations were for a stabilization. The three core measures watched by the Bank of Canada crushed consensus, coming in at an average 4.23% compared to 3.83% expected and faster than an upwardly revised March (from 3.76% to 3.93%). Shelter (1.1% m/m) and food (0.9%) were among the biggest contributors. Transportation (0.5%) eased considerably after a 3.5% surge in March with gasoline prices (a subcategory) even printing a 0.7% decline. Today’s outcome further solidifies market expectations for more 50 bps rate hikes (at least three through the September policy meeting) by the Bank of Canada after delivering such a large increase in April. The Canadian swap yield curve bear flattens with yields up by more than 4 bps. Moves occurred already before the CPI publication though. The Canadian dollar trades almost unchanged in the 1.282 area.
The Norwegian government updated its outlook for gas deliveries in 2022. They are now expected to hit 122 billion cubic meters, up 8% (or 9 billion cubic meters) compared to last year. If realized, the gas sales would rival the record sales seen in 2017. “The companies are producing at full, or near full capacity. High prices give the company’s strong incentives to utilize the production capacity on the fields”, Minister of Petroleum and Energy Terje Aasland said in a statement. Demand is higher than ever as Europe seeks to cut Russian imports this year by two-thirds. Gas flows from Russia to the bloc exceeded 155 billion cubic meters, or 40% of total consumption, last year.
EUR/USD: Recovery Faces Headwinds But Bulls Remain in Play above 10DMA
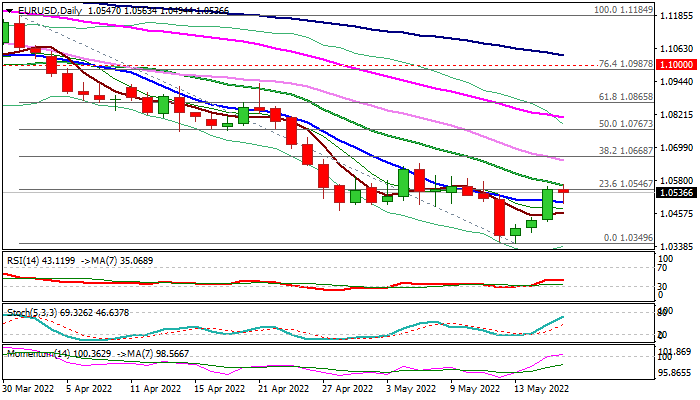
The Euro eases on Wednesday after three-day recovery leg from five-year low at 1.0349 showed signs of stall and was capped by falling 20DMA.
Rebound was fueled by profit-taking on improved sentiment and expectations for more ECB rate hikes, in attempts to catch up with Fed, however, initial optimism was deflated on concerns that the eurozone will not be able follow Fed in fighting soaring inflation and avoid recession scenario.
Technical studies have improved on daily chart and remain partially supportive for further recovery, as 14-d momentum rose into positive territory, while broken 10DMA (1.0497) reverted to support and underpins the action.
Near-term bias is expected to remain bullish while 10DMA holds, but bulls see break of 20DMA as minimum requirement, with rise above 1.0649 (May 5 lower top / daily Kijun-sen) to confirm recovery extension.
Caution on break and close below 10DMA that would weaken near-term structure and further weakness.
Res: 1.0560; 1.0598; 1.0641; 1.0668
Sup: 1.0497; 1.0458; 1.0428; 1.0388
Canadian Inflation Edges Higher in April
- Consumer price inflation increased to 6.8% year-on-year (y/y) in April, up from 6.7% in March.
- Food prices were a main driver, with prices rising 9.7% y/y. Statistics Canada noted that "this increase, which exceeded 5% for the fifth month in a row, was the largest increase since September 1981."
- Shelter also contributed significantly, up 7.4% y/y. It was referenced that "higher prices for energy sources used to heat homes, such as natural gas (+22.2%) and fuel oil and other fuels (+64.4%), contributed to the increase." Furthermore, "homeowners' replacement cost (+13.0%) which is related to the price of new homes, and other owned accommodation expenses (+17.2%) which includes commissions on the sale of real estate, both increased in April."
- Prices at the pump dropped a touch in April, down 0.7% month-on-month, after a double-digit gain in March. This follows a modest drop in global energy prices.
- Seasonally adjusted, month-on-month prices were up 0.7% following a 1% gain in March. Excluding food and energy, the index was up 0.5%, down from 0.7% in March.
- All three of the Bank of Canada's core inflation metrics picked up steam in April. CPI-trim rose 0.3 percentage points (pp) to 5.1%, CPI-common by 0.2pp to 3.2%, and CPI-median by 0.4pp to 4.4%.
Key Implications
- The cost of basic necessities continues to push higher in Canada, with food and shelter driving the price increases. We are not expecting much of a reprieve going forward, with food supplies likely remaining tight. On the shelter side, we are likely to see a continuation of rent price increases alongside rising mortgage interest costs. This will be balanced against the impact of declining house prices. Furthermore, energy prices at gas stations may have taken a breather in March, but anyone who has filled up their tank over the last couple of weeks knows that an acceleration of prices will show up in next month's CPI print.
- All of this re-enforces the view that the Bank of Canada will hike by another 50 basis points (bps) on June 1st, followed by another 50 bps in July. Bond yields in Canada increased following this morning's data release, with most of the curve converging around the 3% level.
USD/JPY Mid-Day Outlook
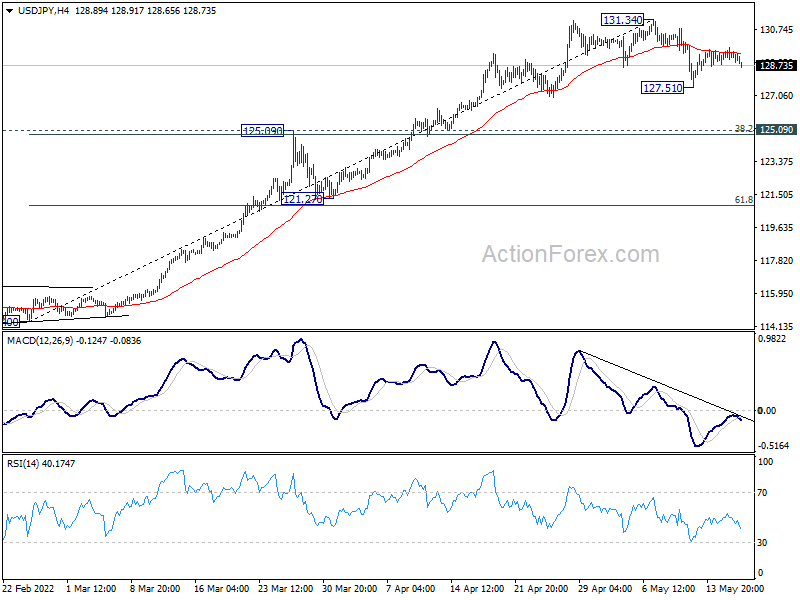
Daily Pivots: (S1) 128.87; (P) 129.32; (R1) 129.82; More...
USD/JPY is staying in consolidation from 131.34 and intraday bias remains neutral for the moment. Another fall could be seen and break of 127.51 will target 125.09 cluster support (38.2% retracement of 114.40 to 131.34 at 124.86). On the upside, firm break of 131.34 will resume larger up trend.
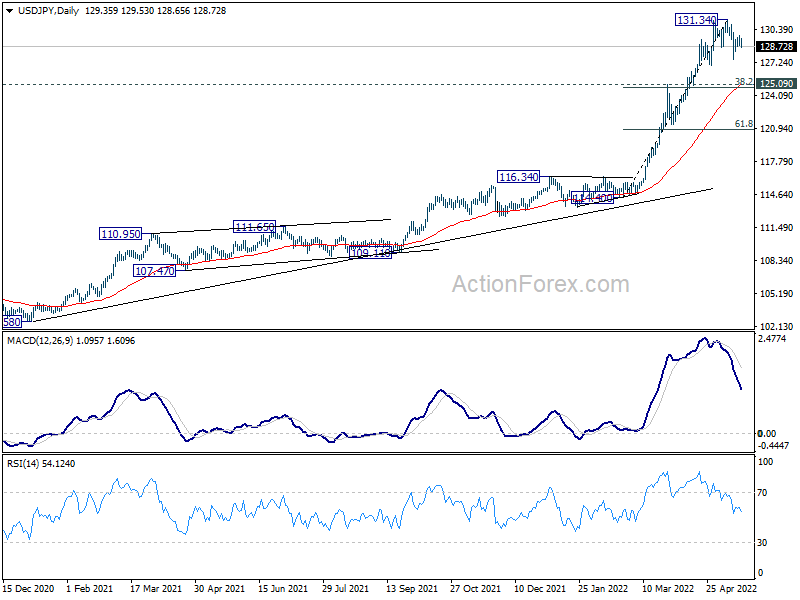
In the bigger picture, current rally is seen as part of the long term up trend form 75.56 (2011 low). Sustained trading above 61.8% projection of 75.56 (2011 low) to 125.85 (2015 high) from 98.97 at 130.04 will pave the way to 100% projection at 149.26, which is close to 147.68 (1998 high). For now, this will remain the favored case as long as 121.27 support holds.
USD/CHF Mid-Day Outlook
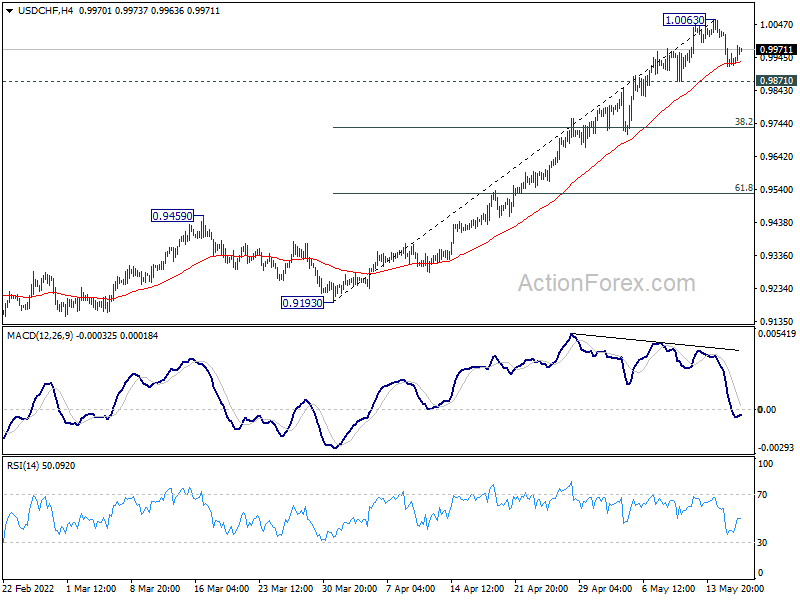
Daily Pivots: (S1) 0.9896; (P) 0.9963; (R1) 1.0006; More....
USD/CHF is staying in range below 1.0063 and intraday bias remains neutral. Considering bearish divergence condition in 4 hour MACD, break of 0.9871 support will indicate short term topping at 1.0063. Intraday bias will be turned to the downside for 38.2% retracement of 0.9193 to 1.0063 at 0.9731. On the upside, above 1.0063 will resume larger up trend.
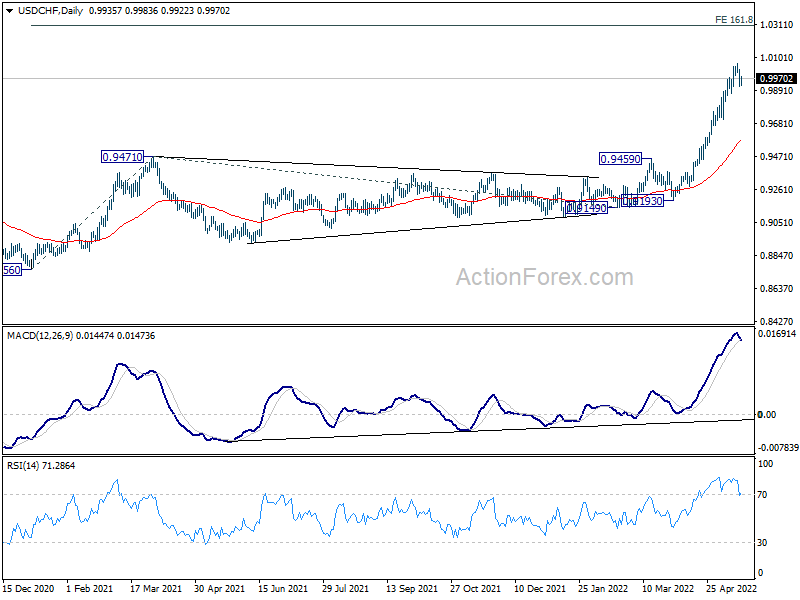
In the bigger picture, down trend from 1.0342 (2016 high) should have completed with three waves down to 0.8756 (2021 low) already. Rise from 0.8756 is likely a medium term up trend of its own. Next target is 161.8% projection of 0.8756 to 0.9471 from 0.9149 at 1.0306, which is close to 1.0342 (2016 high). This will remain the favored case as long as 0.9459 resistance turned support holds.
EUR/USD Daily Outlook
Daily Pivots: (S1) 1.0468; (P) 1.0512 (R1) 1.0594; More...
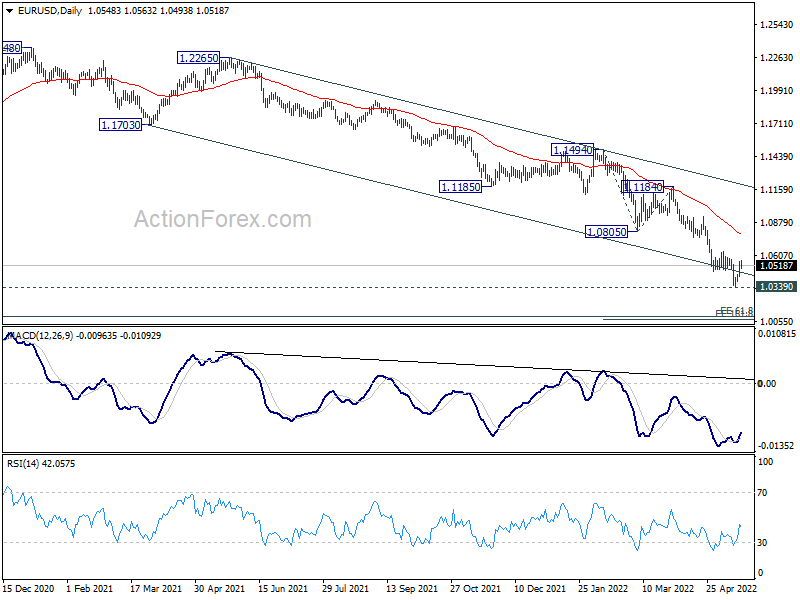
EUR/USD is still bounded in range above 1.0348 and intraday bias remains neutral first. Considering bullish convergence condition in 4 hour MACD, break of 1.0641 resistance will confirm short term bottoming at 1.0348, ahead of 1.0339 long term support. Intraday bias will be turned back to the upside for 1.0805 support turned resistance. On the downside, however, decisive break of 1.0339 will carry larger bearish implication and target 161.8% projection of 1.1494 to 1.0805 from 1.1184 at 1.0069.
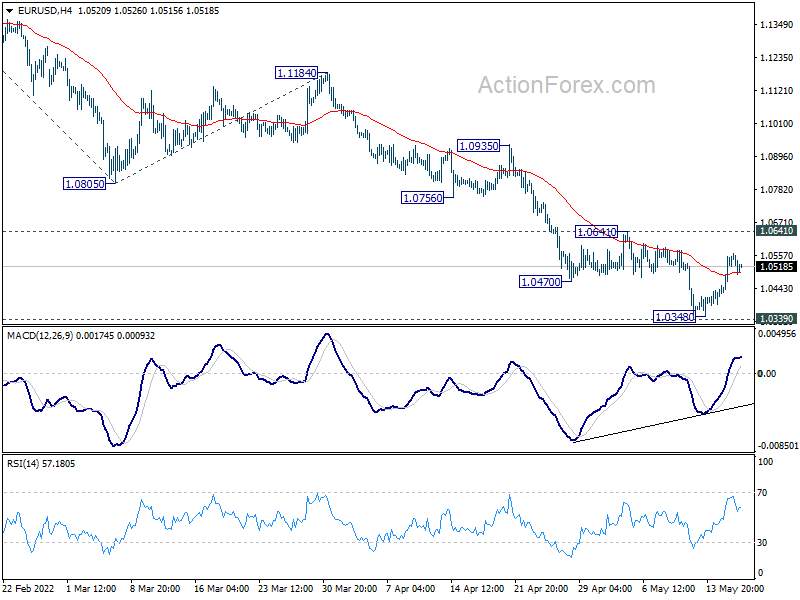
In the bigger picture, break of medium term channel support suggests downside acceleration. Current decline from 1.2348 (2021 high) is probably resuming long term down trend from 1.6039 (2008 high). Decisive break of 1.0339 will confirm this bearish case. Next target is 61.8% projection of 1.3993 to 1.0339 from 1.2348 at 1.0090. This will now remain the favored case as long as 1.0805 support turned resistance holds.