Sample Category Title
GBP/JPY Daily Outlook
Daily Pivots: (S1) 156.96; (P) 159.37; (R1) 160.68; More...
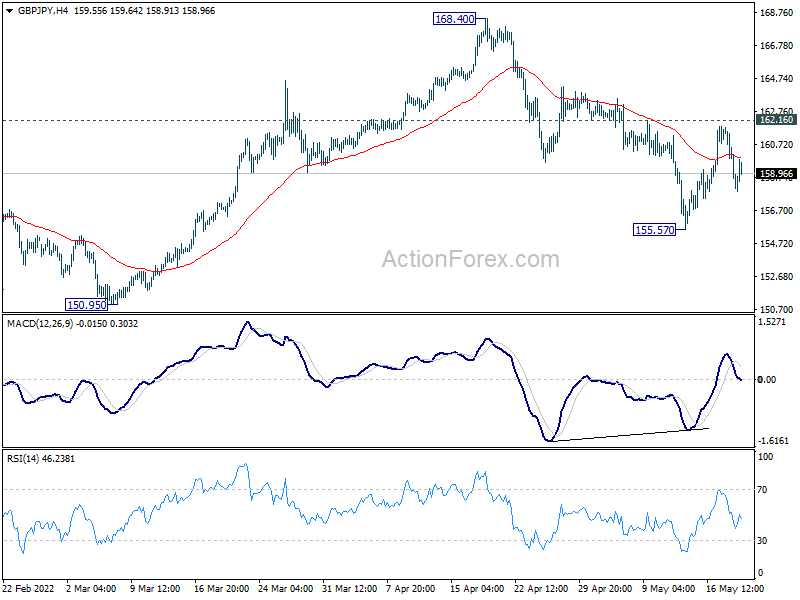
Intraday bias in GBP/JPY remains neutral at this point. Risk will stay on the downside as long as 162.16 minor resistance holds, as correction from 168.40 could extend. On the downside, below 155.57 will target 150.95 key structural support next. Nevertheless, firm break of 162.16 will indicate that the correction has completed, and bring retest of 168.40 high next.
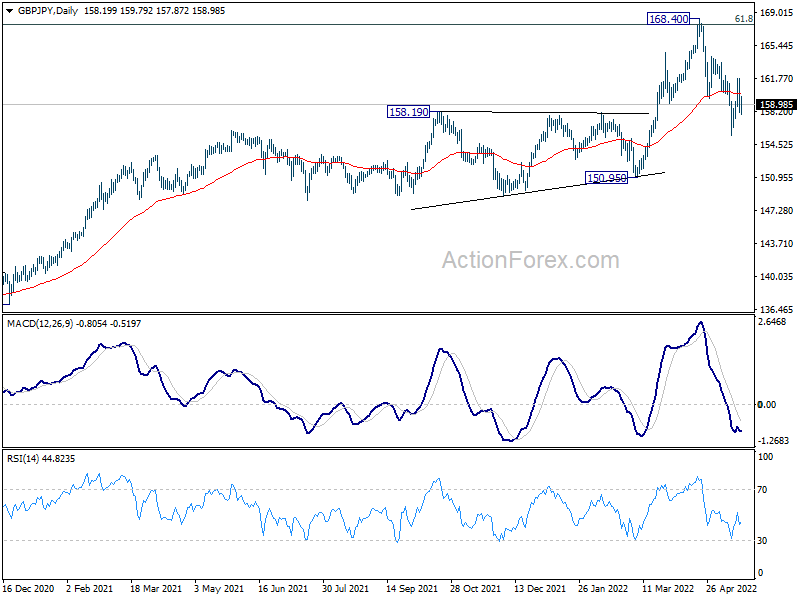
In the bigger picture, up trend from 123.94 (2020 low) is still in progress. Sustained break of 61.8% retracement of 195.86 (2015 high) to 122.75 (2016 low) at 167.93 will be a long term bullish signal, and could pave the way back to 195.86 high. This will now remain the favored case as long as 150.95 support holds, even in case of deep pull back. However, firm break of 150.95 will indicate rejection by 167.93, and bearish trend reversal.
EUR/JPY Daily Outlook
Daily Pivots: (S1) 133.30; (P) 134.99; (R1) 135.89; More....
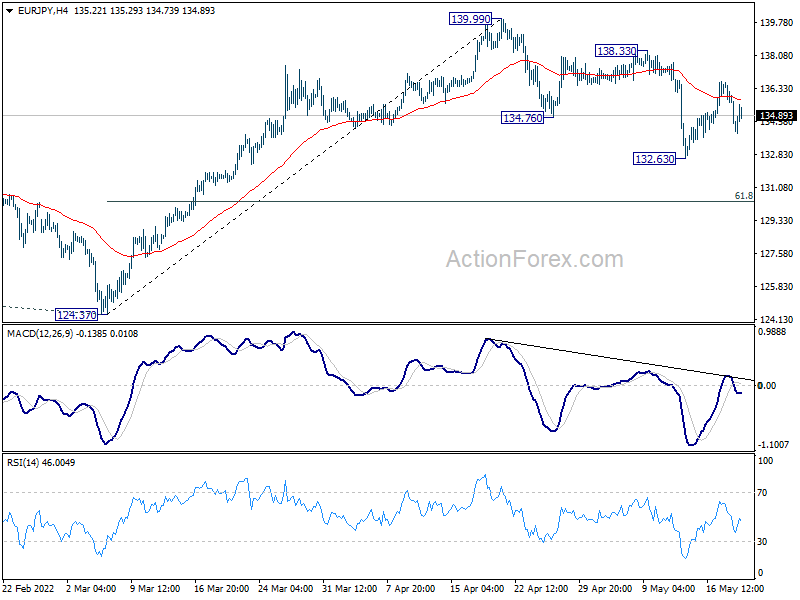
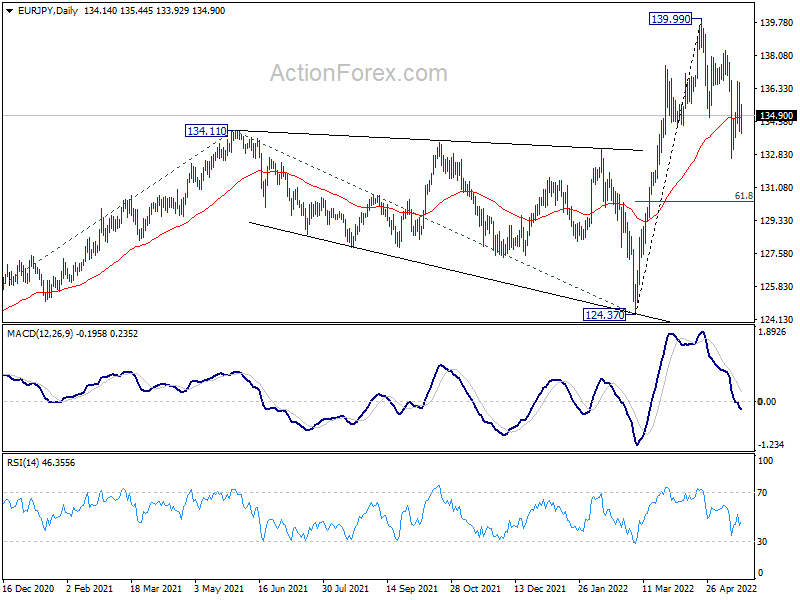
Intraday bias in EUR/JPY stays neutral for the moment. Corrective fall from 139.99 could still extend lower. Below 132.63 will target 61.8% retracement of 124.37 to 139.99 at 130.33. Nevertheless, break of 138.33 will indicate that the correction has completed, and bring retest of 139.99 high next.
In the bigger picture, up trend from 114.42 (2020 low) is in progress. Such rise is seen as the third leg of the pattern from 109.30 (2016 low). Next target will be 100% projection of 114.42 to 134.11 from 124.37 at 144.06. In any case, outlook will now remain bullish as long as 124.37 support holds, in case of deep pull back.
EUR/GBP Daily Outlook
Daily Pivots: (S1) 0.8445; (P) 0.8469; (R1) 0.8505; More...
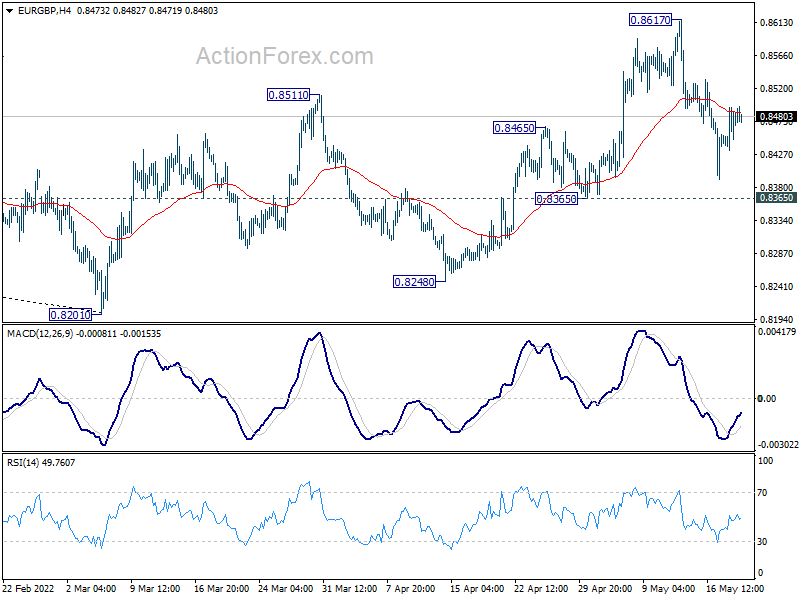
Intraday bias in EUR/GBP stays neutral for the moment. Also, with 0.8365 support intact, further rise is still in favor. On the upside, break of 0.8617 will resume rise from 0.8201 medium term bottom to 0.8697 medium term fibonacci level. However, break of 0.8365 will dampen this bullish view, and turn bias back to the downside instead.
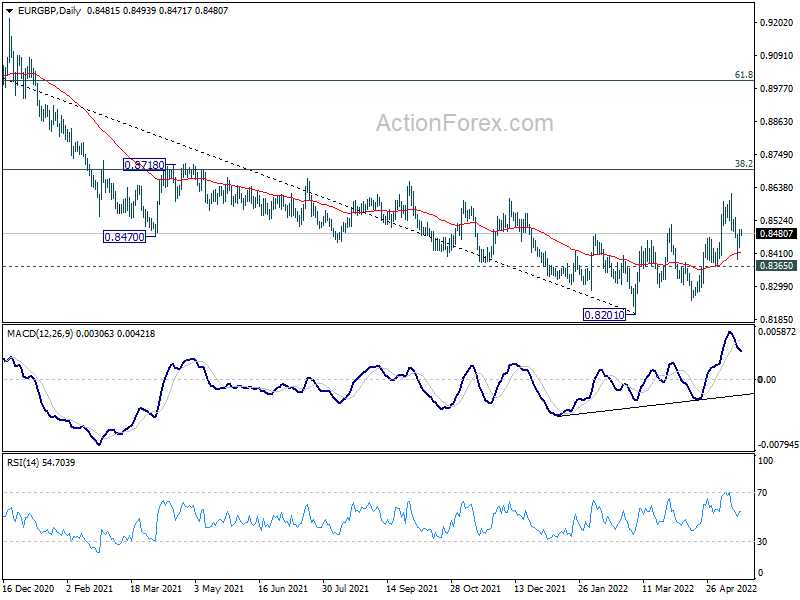
In the bigger picture, a medium term bottom could be in place at 0.8201, on bullish convergence condition in daily and weekly MACD. Rise from there could either be a correction to the down trend from 0.9499 (2020 high), or a medium term up trend itself. In either case, further rise should be seen to 38.2% retracement of 0.9499 to 0.8201 at 0.8697. Sustained break there will target 61.8% retracement at 0.9003.
EUR/AUD Daily Outlook
Daily Pivots: (S1) 1.4997; (P) 1.5027; (R1) 1.5081; More...
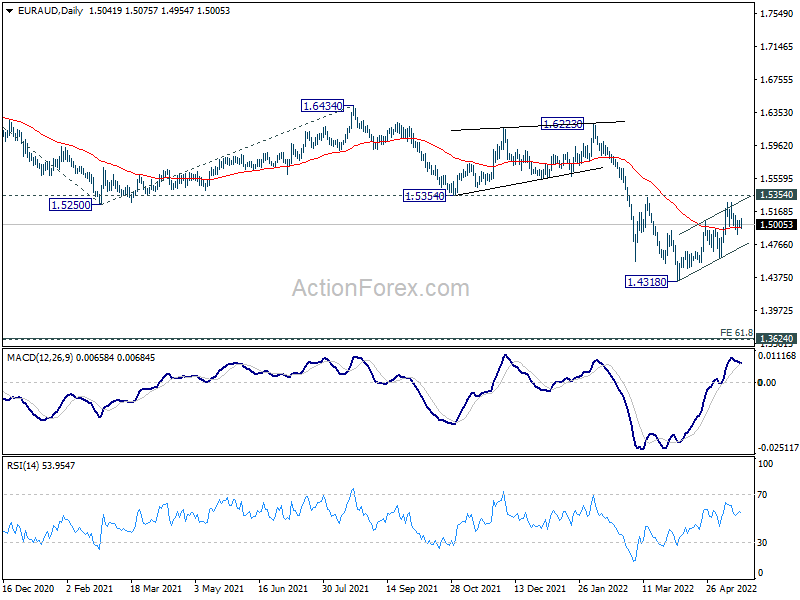
Intraday bias in EUR/AUD is turned neutral with current recovery, but risk stays on the downside with 1.5227 resistance intact. Corrective rebound from 1.4318 could have completed with three waves up to 1.5277 already. Below 1.4885 will target 1.4597 support first. Break there will bring retest of 1.4318 low next.
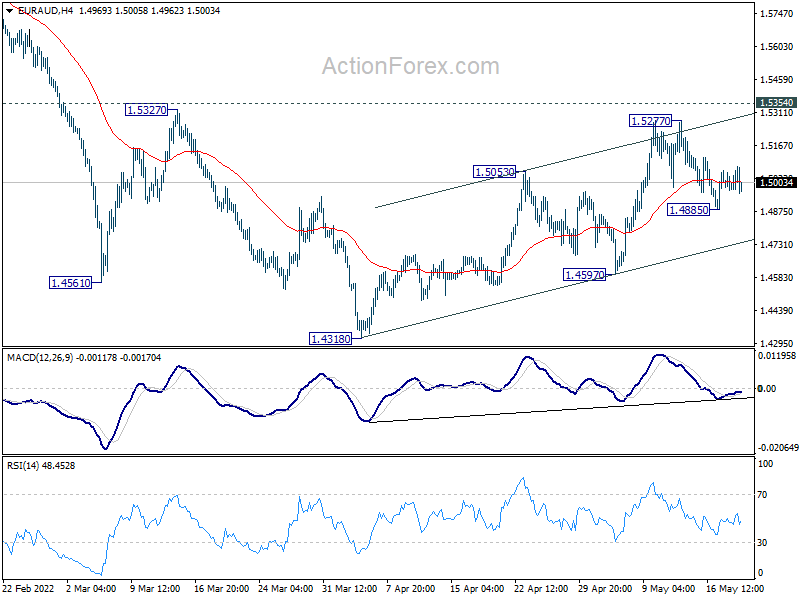
In the bigger picture, as long as 1.5354 support turned resistance holds, larger down trend form 1.9799 (2020 high) is still expected to continue. On resumption, next target is 61.8% projection of 1.9799 to 1.5250 from 1.6434 at 1.3623, which is close to 1.3624 long term support (2017 low). However, firm break of 1.5354 will indicate medium term bottoming and bring stronger rally back to 1.6434 key resistance.
EUR/CHF Daily Outlook
Daily Pivots: (S1) 1.0283; (P) 1.0389; (R1) 1.0446; More....
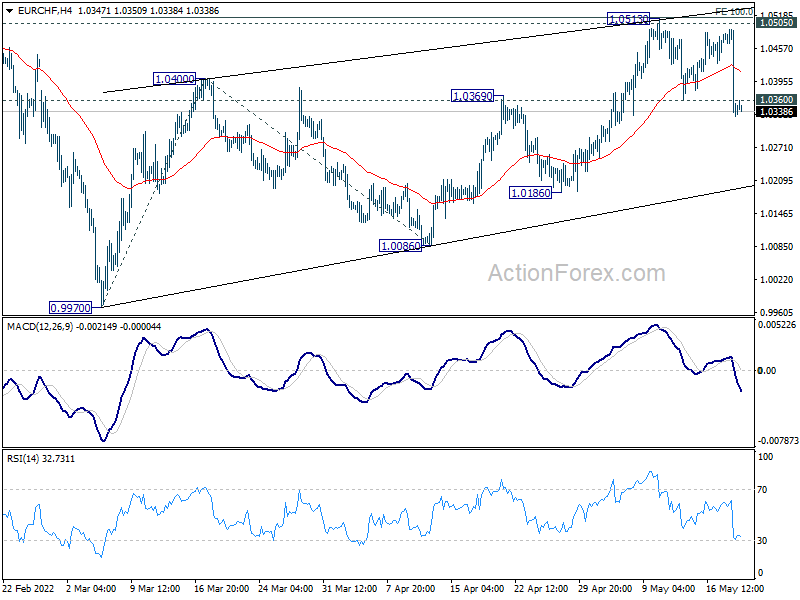
EUR/CHF's break of 1.0360 minor support argues that rebound from 0.9970 has completed as a three-wave corrective move at 1.0513. That came after rejection by 100% projection of 0.9970 to 1.0086 from 1.0400 at 1.0516 and 1.0505. Intraday bias will be turned back to the downside for 1.0186 support first. For now, risk will stay on the downside as long as 1.0513 resistance holds, in case of recovery.
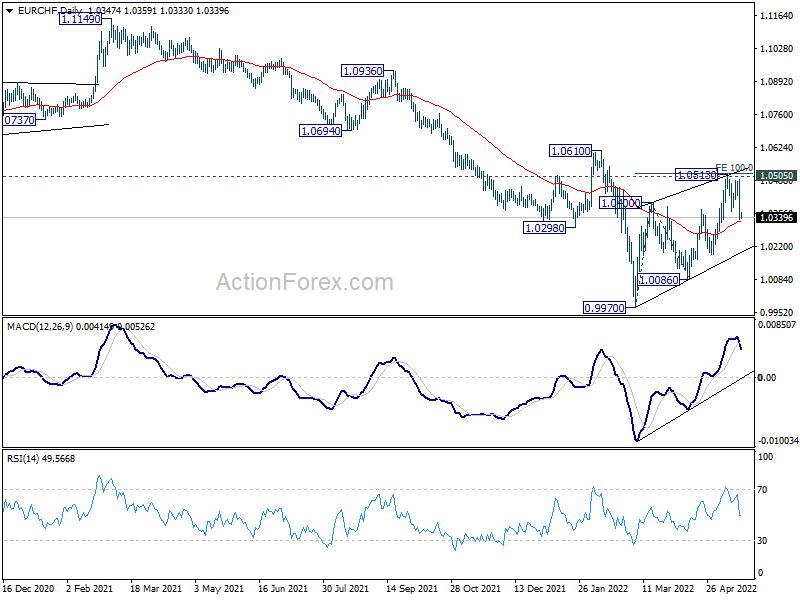
In the bigger picture, as long as 1.0505 support turned resistance (2020 low) holds, long term down trend from 1.2004 (2018 high) is expected to continue. Next target is 100% projection of 1.2004 to 1.0505 to 1.1149 at 0.9650. However, firm break of 1.0505 will suggest medium term bottoming, and bring stronger rebound towards 1.1149 structural resistance.
Swiss Franc Jumps on Risk Aversion, Dollar and Yen Lag Behind
Markets are back in risk-off mode as down dropped more than -1100 pts overnight. Dollar and Yen tried to rebound but there was no follow through buying. Indeed, both remain the worst performing ones for the week. Instead, safe-haven flow seems to be benefiting Swiss Franc more this time. Franc is also helped by buying against Euro and Sterling. Aussie is firm despite weaker than expected job data.
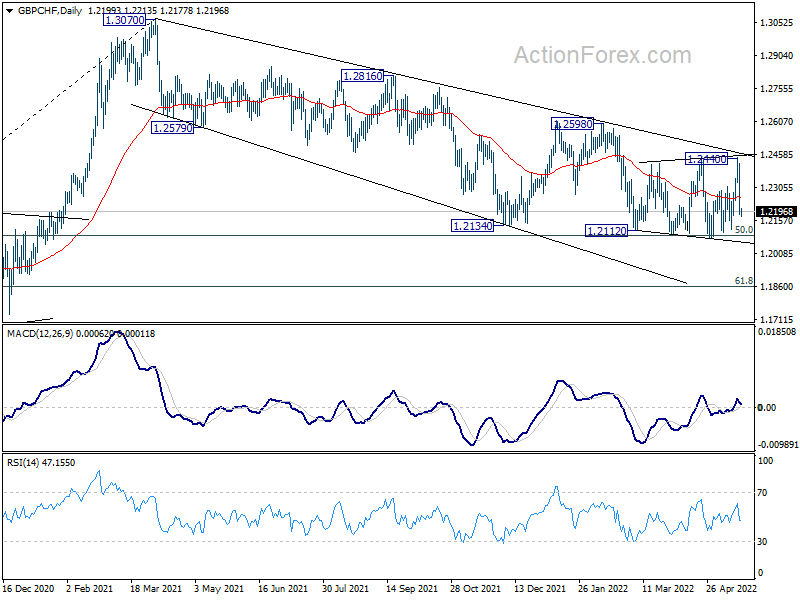
Technically, EUR/CHF's break of 1.0360 support is the first sign that whole corrective rebound from 09970 has completed. Deeper fall is now in favor to retest this low, with prospect of resuming medium term down trend. At the same time, GBP/CHF's consolidation from 1.2112 might also be finished after rejection by trend line resistance. Next focus will be 1.2075 support. Firm break there will also resume the down trend from 1.3070. Such developments are worth monitoring for the next few days.
In Asia, at the time of writing, Nikkei is down -1.74%. Hong Kong HSI is down -2.48%. China Shanghai SSE is down -0.09%. Singapore Strait Times is down -0.36%. Japan 10-year JGB yield is down -0.0031 at 0.243. Overnight, DOW dropped -3.57%. S&P 500 dropped -4.04%. NASDAQ dropped -4.73%. 10-year yield 0.082 to 2.886, after rejection by 3%.
Fed Harker: The economy can withstand a measured, methodical approach to tightening
Philadelphia Fed President Patrick Harker said yesterday, "I anticipate a sequence of increases in the funds rate at a measured pace until we are confident that inflation is moving toward the Committee's inflation target."
"I still am in the camp that we can have, if not a soft landing, a safe landing," he said. He expected the economy to grow between 2% and 3% this year, adding that "this economy can withstand a measured, methodical approach to tightening financial conditions."
Japan exports rose 12.5% yoy in Apr, imports rose 28.2% yoy
Japan exports rose 12.5% yoy to JPY 8076B in April. Imports rose 28.2% yoy to JPY 8915B, a new record. Trade deficit came in at JPY 839B.
Trade with China shrank notably. China-bound shipments fell -5.9% yoy, the biggest drop since March 2020. Imports from China also fell -5.5% yoy, the most since September 2020. On the other hand, exports to the US jumped 17.8% yoy while imports rose 15.3% yoy.
In seasonally adjusted terms, exports rose 1.0% mom to JPY 7629B. Imports rose 7.9% mom to JPY 9248B. Trade deficit came in at JPY -1619B, larger than expectation of JPY -1520T.
Australia employment rose just 4k in Apr, unemployment at record 3.9%
Australia employment rose just 4k in April, missing expectation of 30k growth. Full time jobs rose 92.4k while part0time jobs dropped -88.4k.
Unemployment rate was unchanged at 3.9%, matched expectations. Participation rate dropped -0.1% to 66.3%. Monthly hours worked rose 23m hours, or 1.3% mom.
Bjorn Jarvis, head of labour statistics at the ABS, said, "3.9 per cent is the lowest the unemployment rate has been in the monthly survey. The last time the unemployment rate was lower than this was in August 1974, when the survey was quarterly."
Looking ahead
Eurozone current account and ECB minutes will be released in European session. Later in the day, Canada will publish new housing price index, RMPI and IPPI. US will release Philly Fed survey and existing home sales.
EUR/CHF Daily Outlook
Daily Pivots: (S1) 1.0283; (P) 1.0389; (R1) 1.0446; More....
EUR/CHF's break of 1.0360 minor support argues that rebound from 0.9970 has completed as a three-wave corrective move at 1.0513. That came after rejection by 100% projection of 0.9970 to 1.0086 from 1.0400 at 1.0516 and 1.0505. Intraday bias will be turned back to the downside for 1.0186 support first. For now, risk will stay on the downside as long as 1.0513 resistance holds, in case of recovery.
In the bigger picture, as long as 1.0505 support turned resistance (2020 low) holds, long term down trend from 1.2004 (2018 high) is expected to continue. Next target is 100% projection of 1.2004 to 1.0505 to 1.1149 at 0.9650. However, firm break of 1.0505 will suggest medium term bottoming, and bring stronger rebound towards 1.1149 structural resistance.
Economic Indicators Update
| GMT | Ccy | Events | Actual | Forecast | Previous | Revised |
|---|---|---|---|---|---|---|
| 22:45 | NZD | PPI Input Q/Q Q1 | 3.60% | 1.00% | 1.10% | 1.20% |
| 22:45 | NZD | PPI Output Q/Q Q1 | 2.60% | 1.30% | 1.40% | 1.50% |
| 23:50 | JPY | Trade Balance (JPY) Apr | -1.62T | -1.52T | -0.90T | -1.02T |
| 23:50 | JPY | Machinery Orders M/M Mar | 7.10% | 3.70% | -9.80% | |
| 01:30 | AUD | Employment Change Apr | 4.0K | 30.0K | 17.9K | |
| 01:30 | AUD | Unemployment Rate Apr | 3.90% | 3.90% | 4.00% | 3.90% |
| 08:00 | EUR | Eurozone Current Account (EUR) Mar | 20.3B | 20.8B | ||
| 11:30 | EUR | Eurozone ECB Meeting Accounts | ||||
| 12:30 | CAD | New Housing Price Index M/M Apr | 1.00% | 1.20% | ||
| 12:30 | CAD | Raw Material Price Index Apr | 10.30% | 11.80% | ||
| 12:30 | CAD | Industrial Product Price M/M Apr | 3.70% | 4.00% | ||
| 12:30 | USD | Initial Jobless Claims (May 13) | 202K | 203K | ||
| 12:30 | USD | Philadelphia Fed Manufacturing Survey May | 16.2 | 17.6 | ||
| 14:00 | USD | Existing Home Sales Apr | 5.63M | 5.77M | ||
| 14:30 | USD | Natural Gas Storage | 90B | 76B |
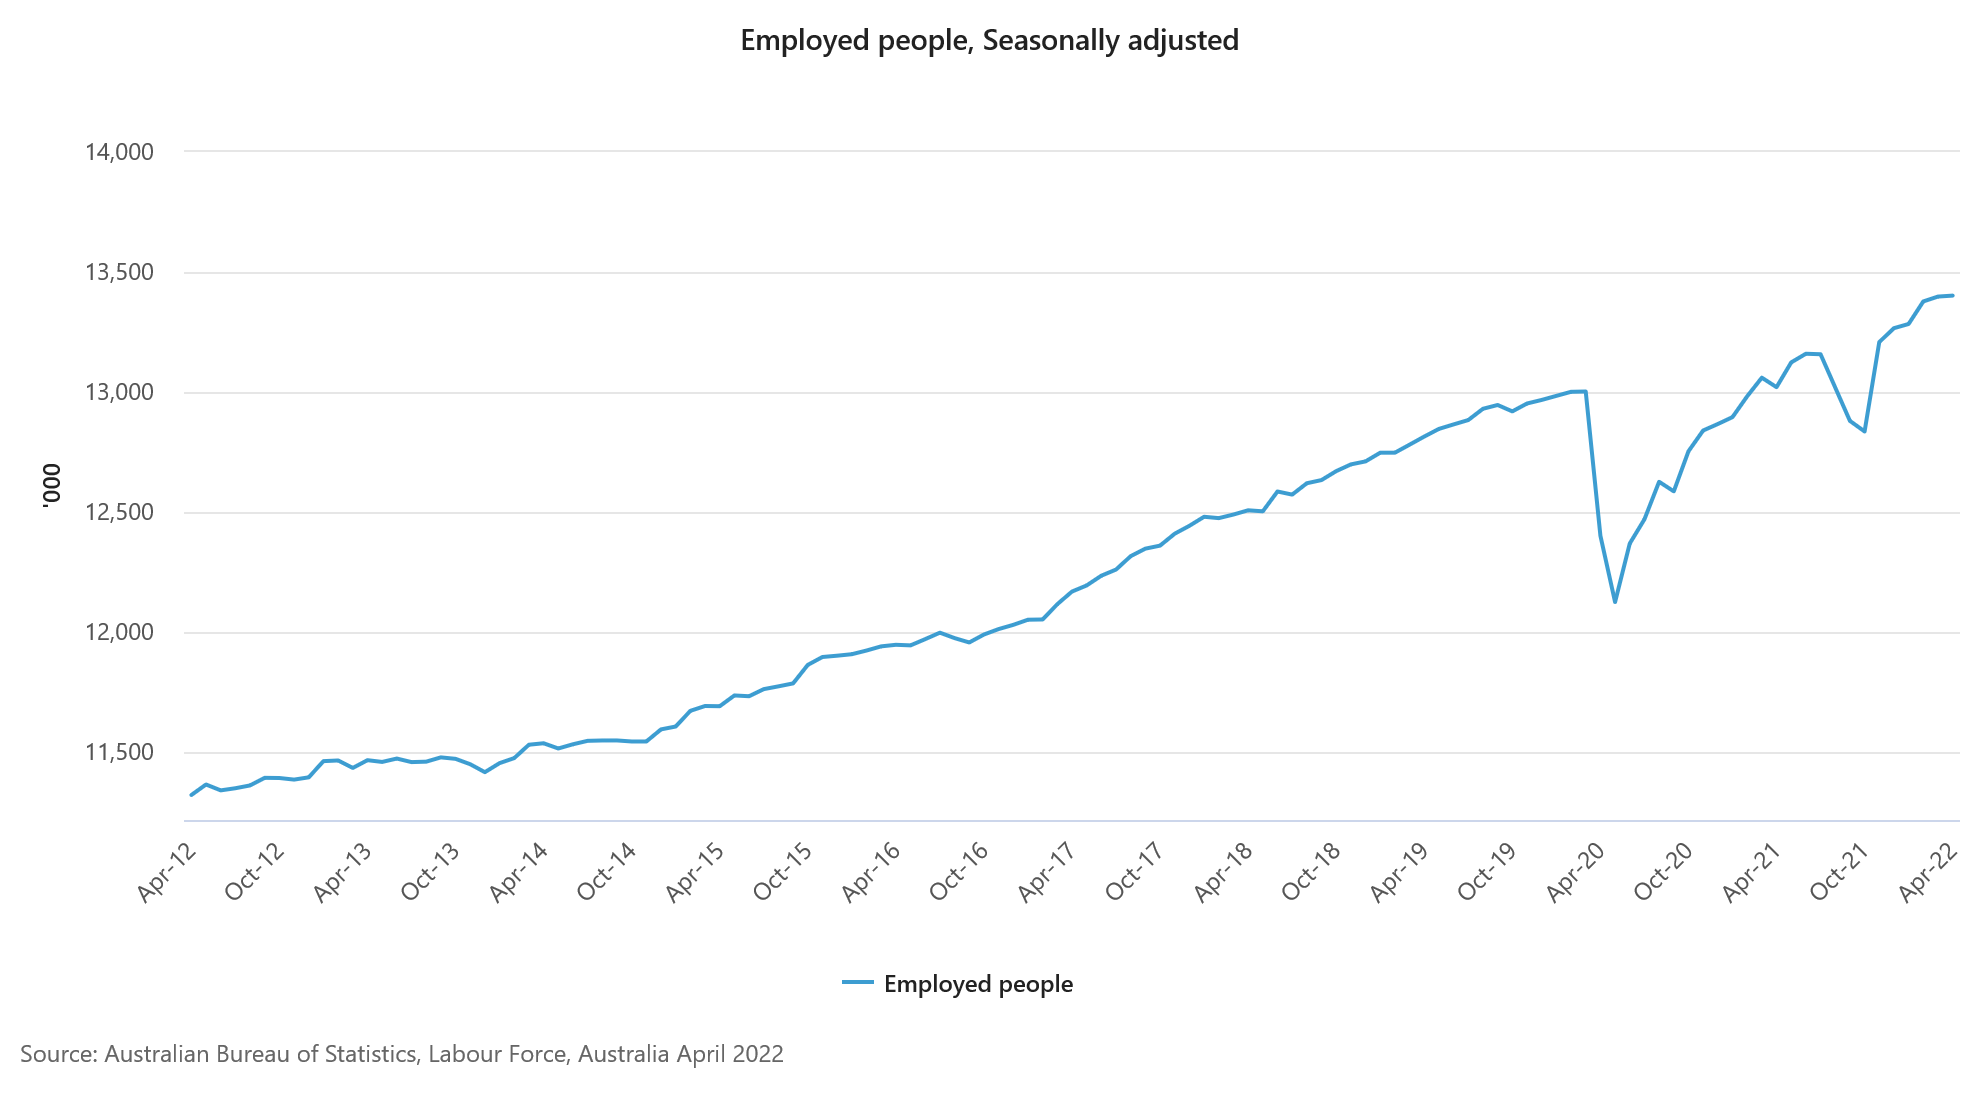
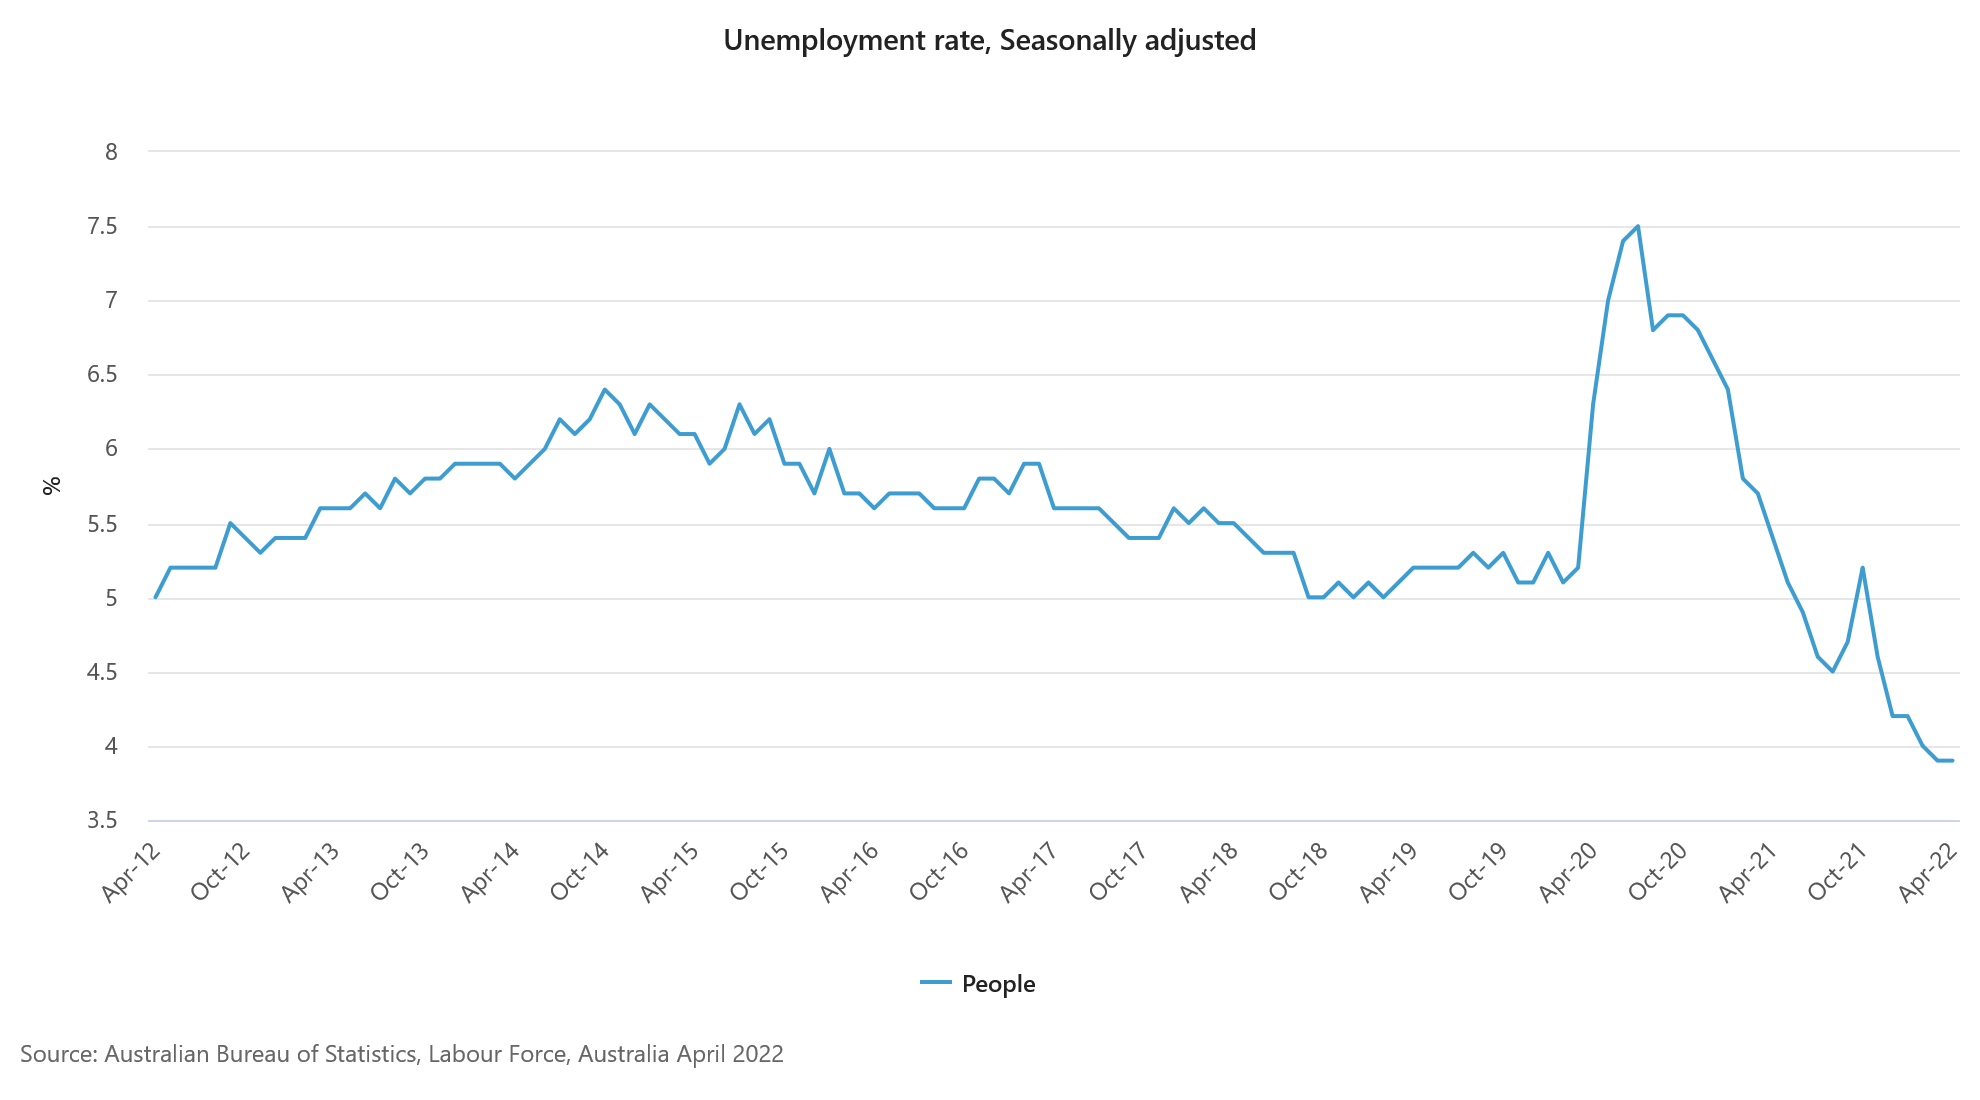
Australia employment rose just 4k in Apr, unemployment at record 3.9%
Australia employment rose just 4k in April, missing expectation of 30k growth. Full time jobs rose 92.4k while part-time jobs dropped -88.4k.
Unemployment rate was unchanged at 3.9%, matched expectations. Participation rate dropped -0.1% to 66.3%. Monthly hours worked rose 23m hours, or 1.3% mom.
Bjorn Jarvis, head of labour statistics at the ABS, said, "3.9 per cent is the lowest the unemployment rate has been in the monthly survey. The last time the unemployment rate was lower than this was in August 1974, when the survey was quarterly."
Japan exports rose 12.5% yoy in Apr, imports rose 28.2% yoy
Japan exports rose 12.5% yoy to JPY 8076B in April. Imports rose 28.2% yoy to JPY 8915B, a new record. Trade deficit came in at JPY 839B.
Trade with China shrank notably. China-bound shipments fell -5.9% yoy, the biggest drop since March 2020. Imports from China also fell -5.5% yoy, the most since September 2020. On the other hand, exports to the US jumped 17.8% yoy while imports rose 15.3% yoy.
In seasonally adjusted terms, exports rose 1.0% mom to JPY 7629B. Imports rose 7.9% mom to JPY 9248B. Trade deficit came in at JPY -1619B, larger than expectation of JPY -1520T.
Fed Harker: The economy can withstand a measured, methodical approach to tightening
Philadelphia Fed President Patrick Harker said yesterday, "I anticipate a sequence of increases in the funds rate at a measured pace until we are confident that inflation is moving toward the Committee's inflation target."
"I still am in the camp that we can have, if not a soft landing, a safe landing," he said. He expected the economy to grow between 2% and 3% this year, adding that "this economy can withstand a measured, methodical approach to tightening financial conditions."
Technical Outlook and Review
DXY:
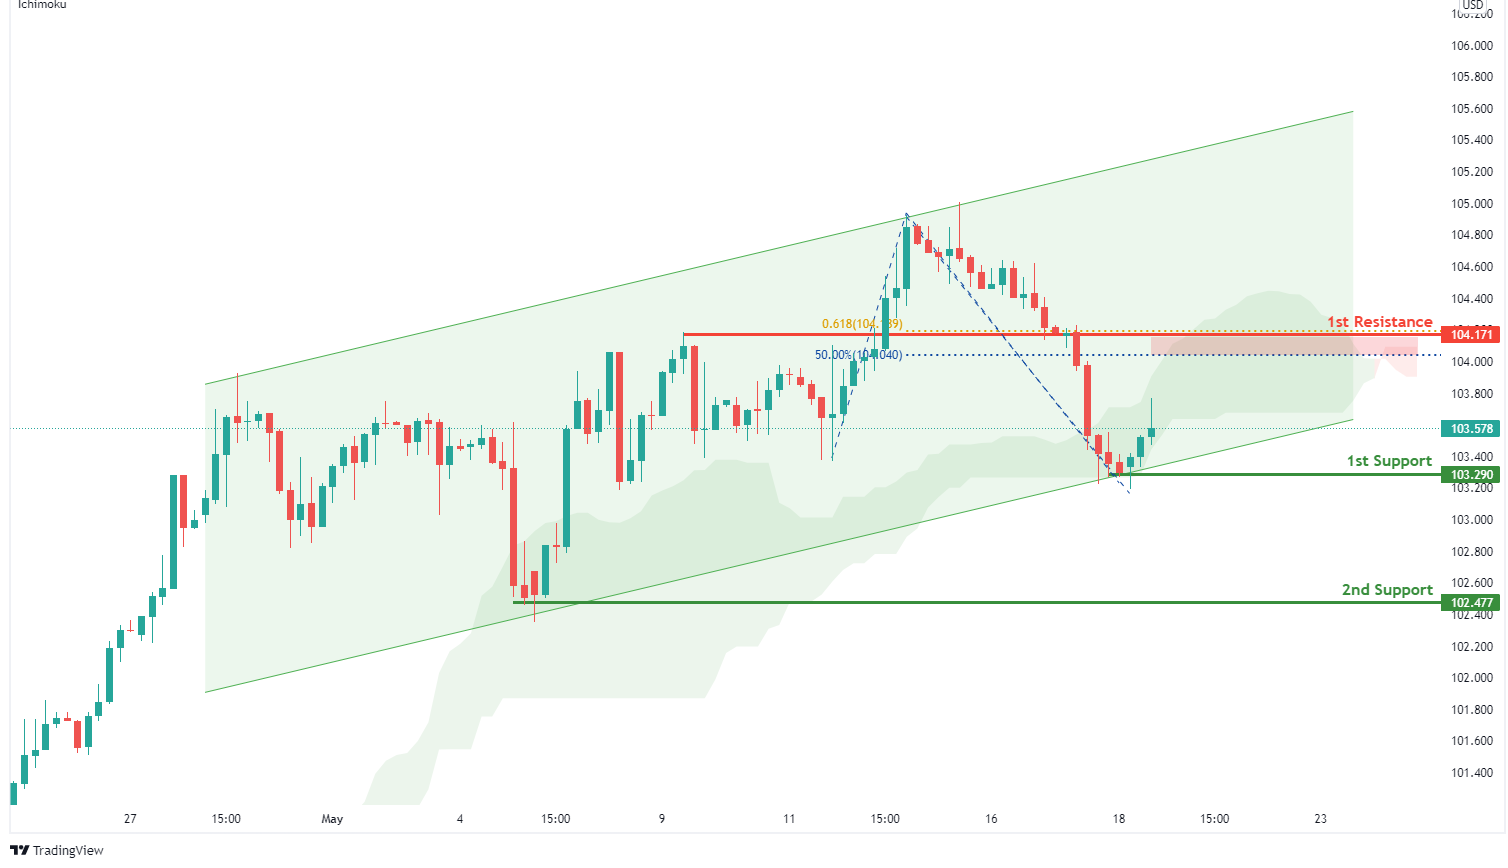
On the H4, with prices bouncing off the ichimoku support , we have a bullish bias that price will rise to our 1st resistance at 104.171 where the horizontal pullback resistance, 61.8% Fibonacci projection and 50% Fibonacci retracement is from our 1st support at 103.290 in line with the horizontal swing low support. Alternatively, price may break 1st support structure and head for 2nd support at 102.477 where the horizontal swing low support is.
Areas of consideration:
- H4 time frame, 1st resistance at 104.171
- H4 time frame, 1st support at 103.290
XAU/USD (GOLD):
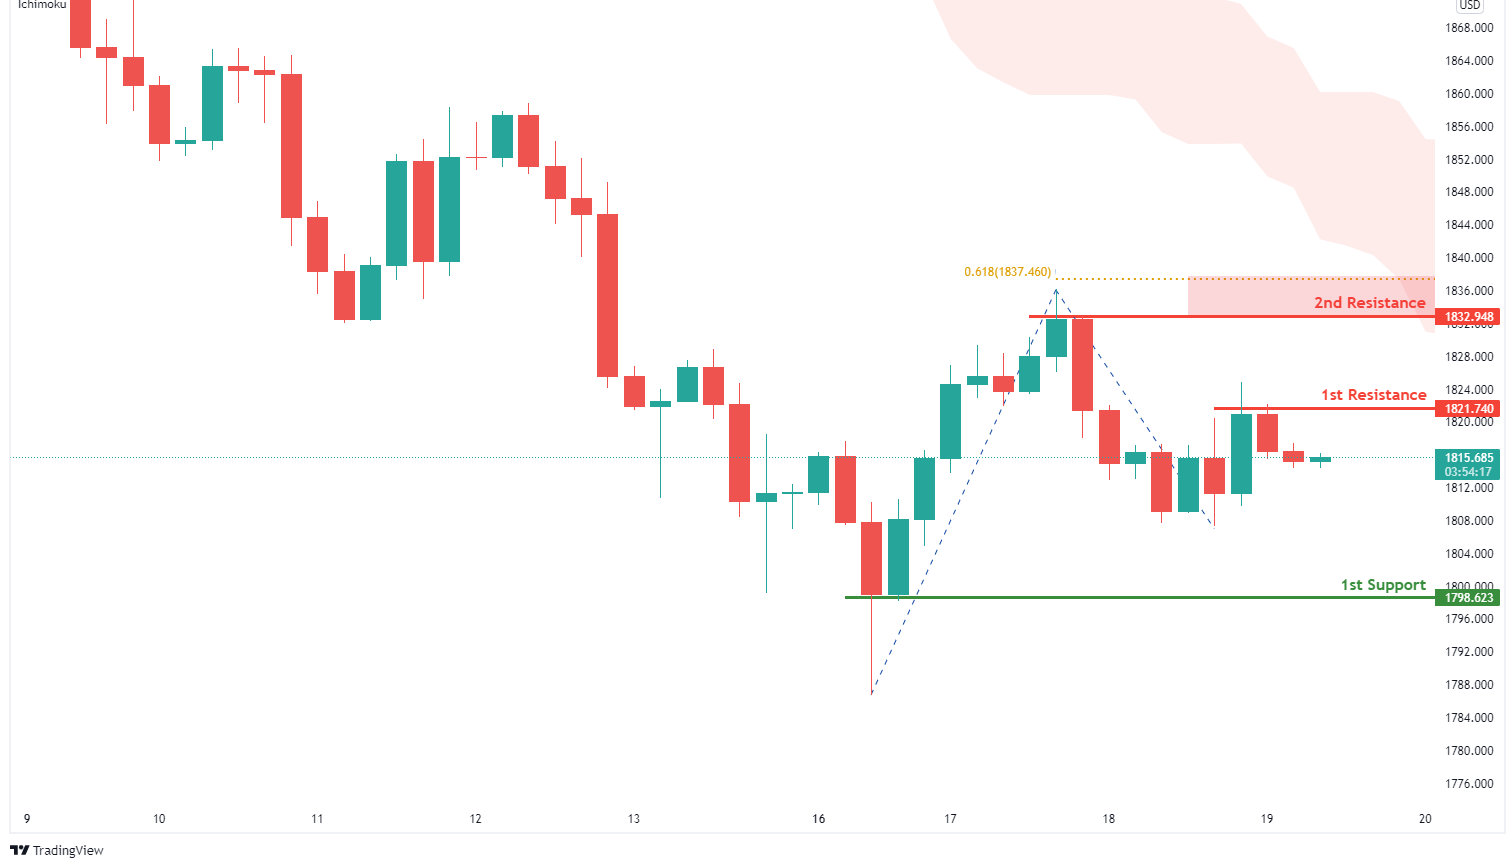
On the H4, with price moving below the ichimoku, we have a bearish bias that price will drop from our 1st resistance at 1821.740 where the horizontal swing high resistance is to our 1st support at 1798.623 in line with the horizontal swing low support. Alternatively, price may break 1st resistance structure and head for 2nd resistance at 1832.948 where the horizontal swing high resistance and 61.8% Fibonacci projection is.
Areas of consideration:
- H4 time frame, 1st Resistance at 1821.740
- H4 time frame, 1st Support at 1798.623
GBP/USD:
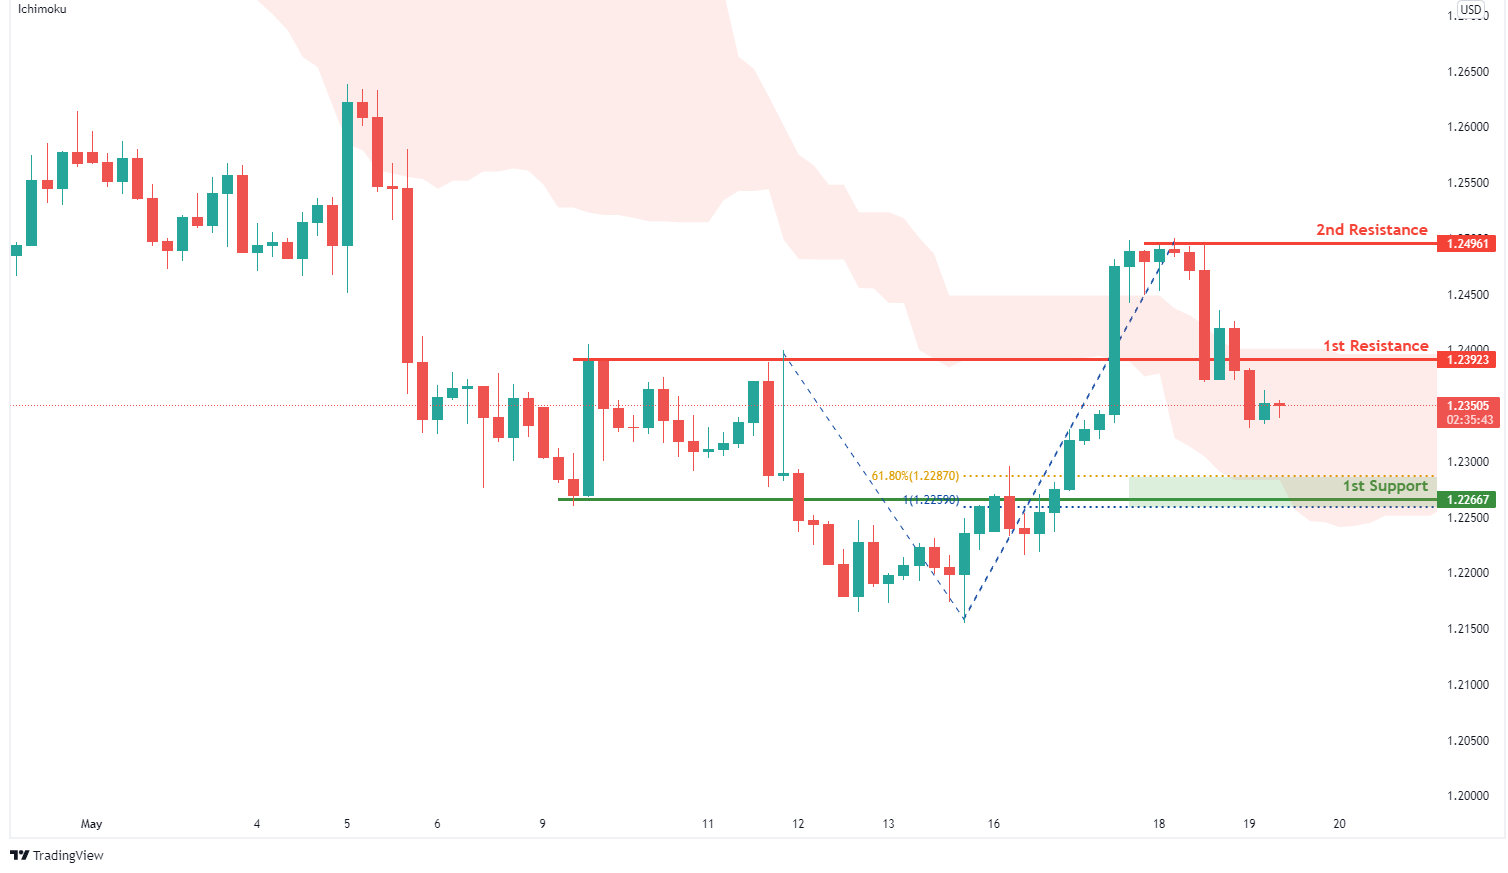
On the H4, with price reversing off the ichimoku indicator, we have a bearish bias that price will drop from our 1st resistance at 1.23923 where the horizontal overlap support is to our 1st support at 1.22667 in line with the horizontal pullback support, 100% Fibonacci projection and 61.8% Fibonacci retracement. Alternatively, price may break 1st resistance structure and head for 2nd resistance at 1.24961 where the horizontal swing high resistance is.
Areas of consideration:
- H4 1st resistance at 1.23923
- H4 1st support at 1.22667
USD/CHF:
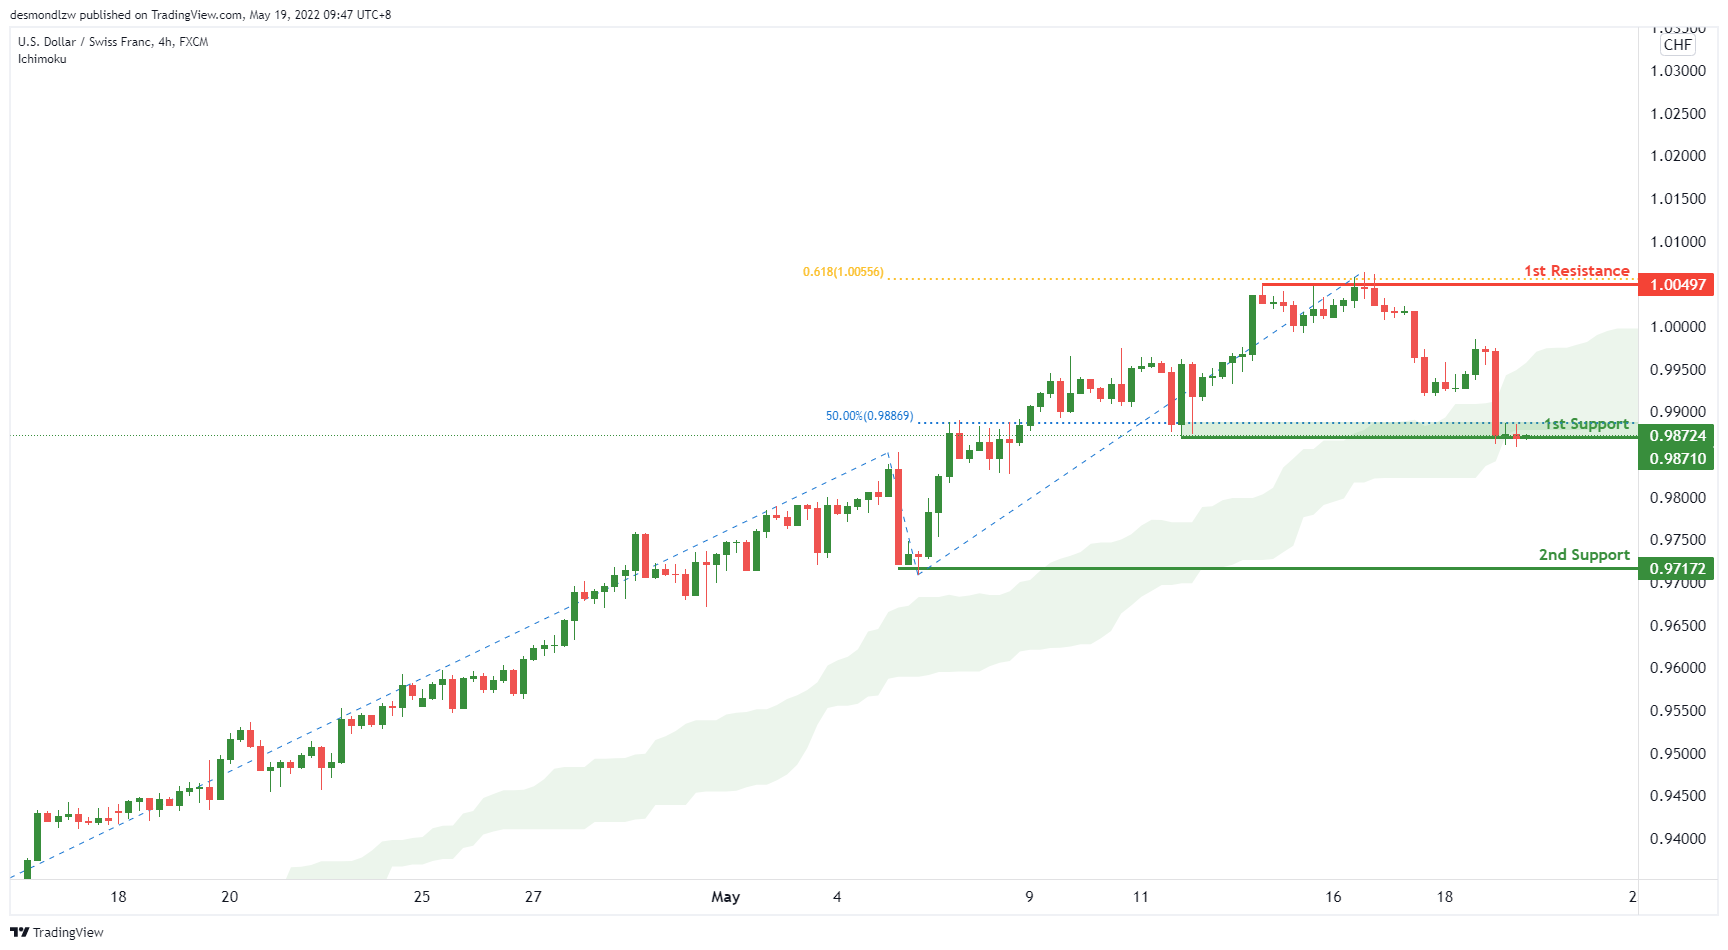
On the H4, with price expected to bounce off the ichimoku cloud, we have a bullish bias that price will rise to our 1st resistance at 1.00497 where the 61.8% Fibonacci projection and swing high resistance is from our 1st support at 0.98710 in line with the horizontal swing low support and 50% fibonacci retracement. Alternatively, price may break 1st support structure and head for 2nd support where the horizontal pullback resistance is.
Areas of consideration
- 1st support level at 0.98710
- 1st resistance level at 1.00497
EUR/USD :
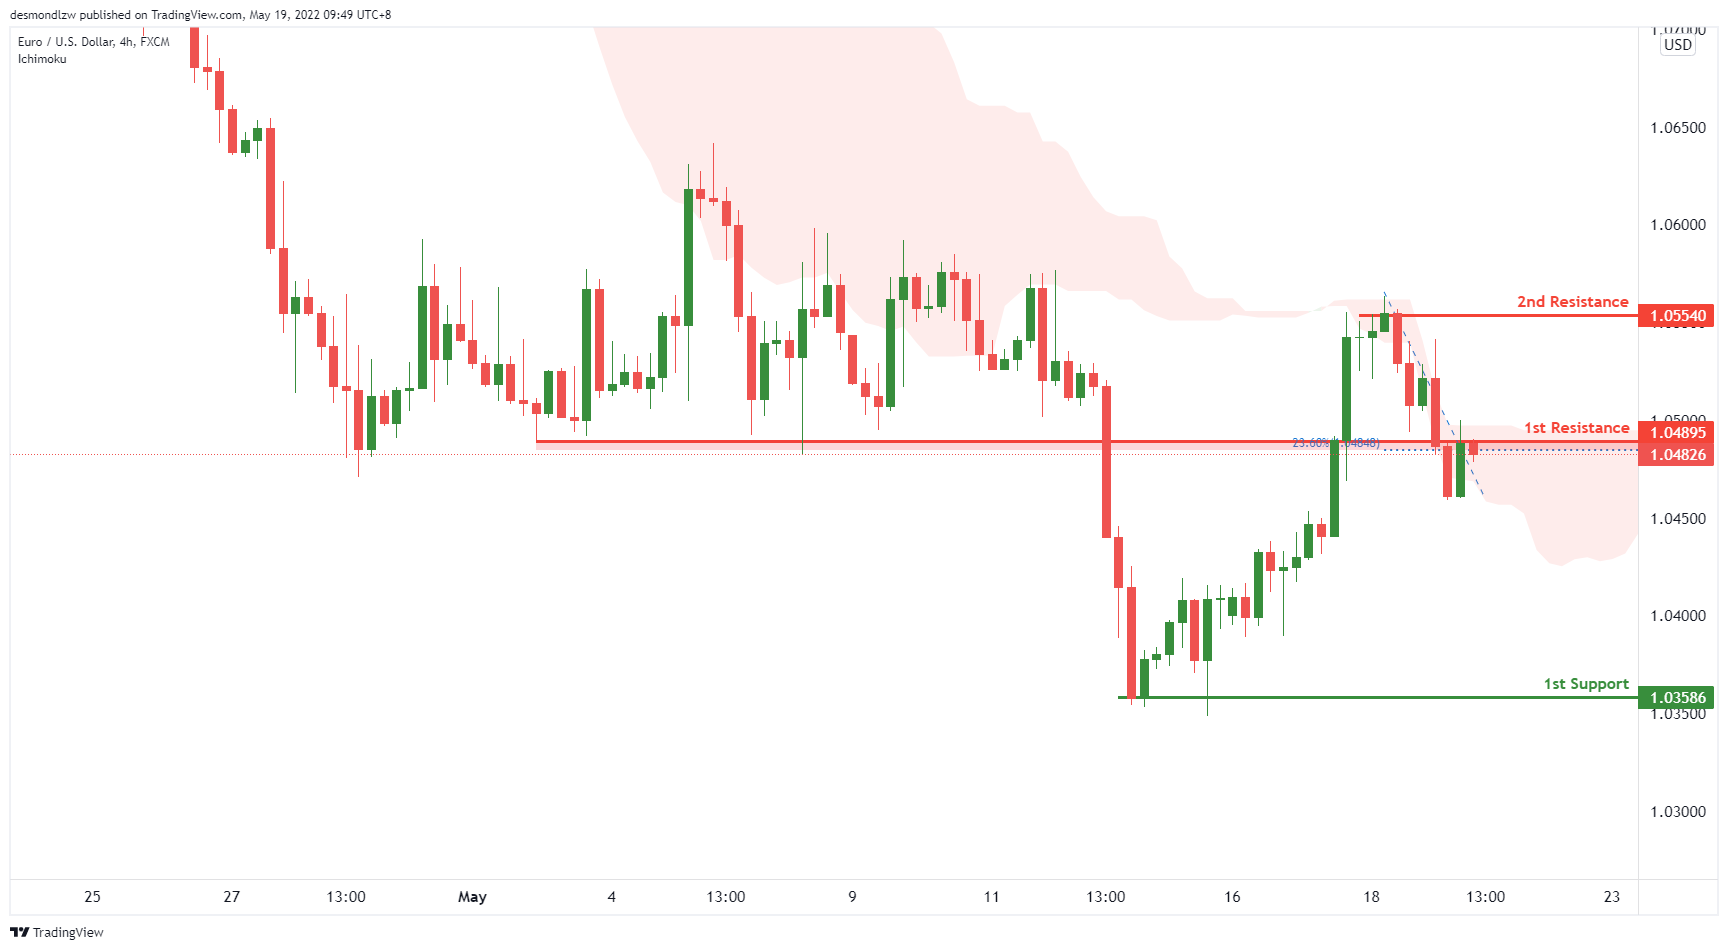
On the H4, with price expected to reverse off the ichimoku cloud resistance, we have a bearish bias that price will drop from our 1st resistance at 1.04826 where the 23.6% Fibonacci retracement is to our 1st support at 1.03586 in line with the horizontal swing low support. Alternatively, price may break 1st resistance structure and head for 2nd resistance where the horizontal swing high resistance is.
Areas of consideration :
- H4 1st resistance at 1.04826
- H4 1st support at 1.03586
USD/JPY:
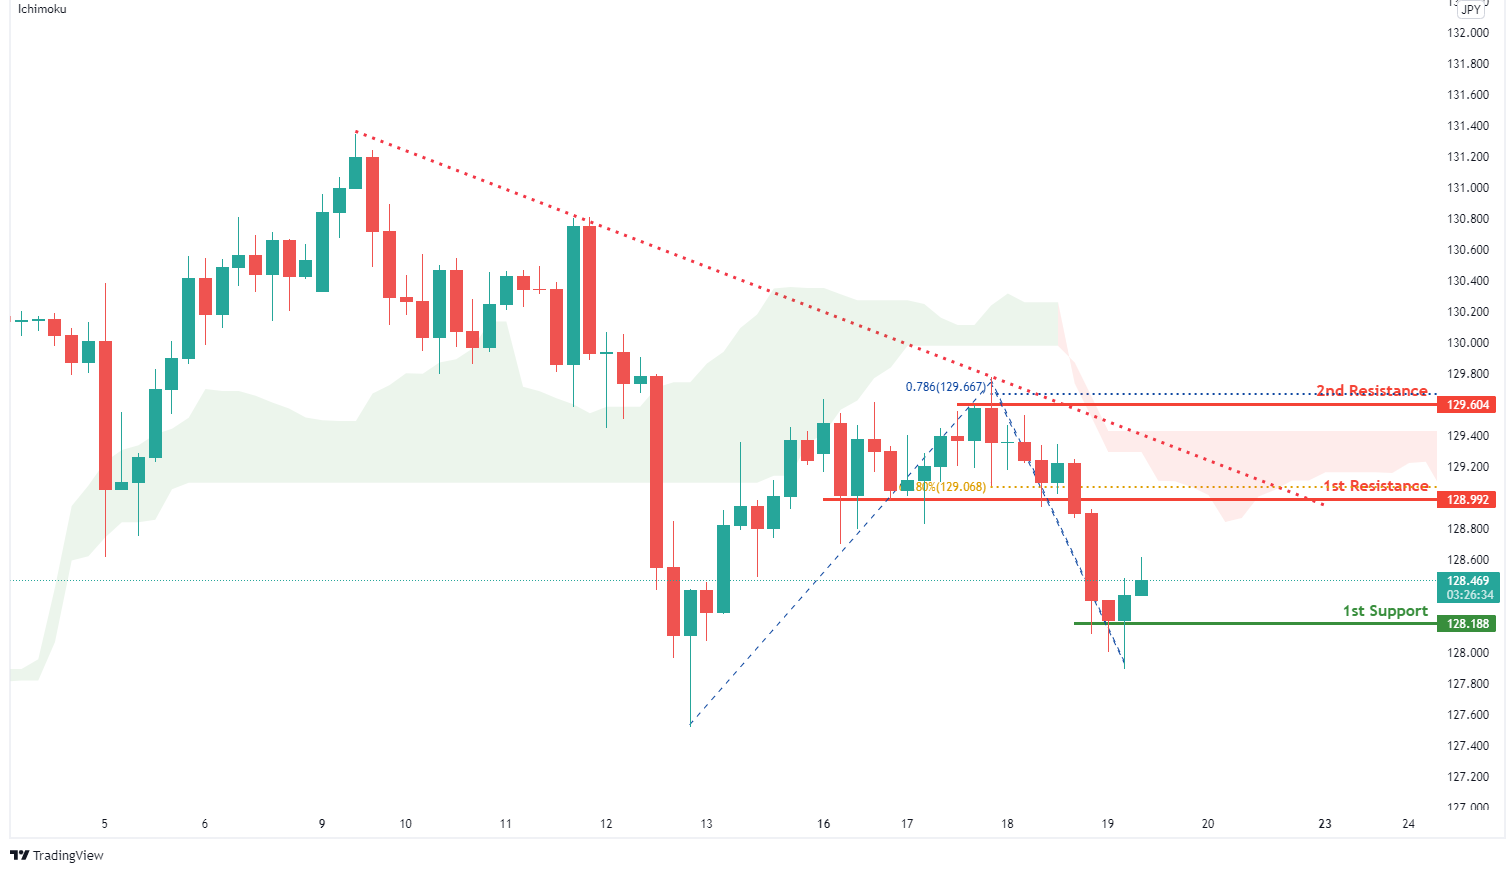
On the H4, with prices moving below the ichimoku indicator, we have a bearish bias that price will drop from our 1st resistance at 128.992 where the 61.8% Fibonacci retracement and horizontal overlap resistance is to our 1st support at 128.188 in line with the horizontal swing low support. Alternatively, price may break 1st resistance structure and head for 2nd resistance at 129.604 where the horizontal swing high resistance and 78.6% Fibonacci projection is.
Areas of consideration:
- H4 time frame, 1st resistance at 128.992
- H4 time frame, 1st support at 128.188
AUD/USD:
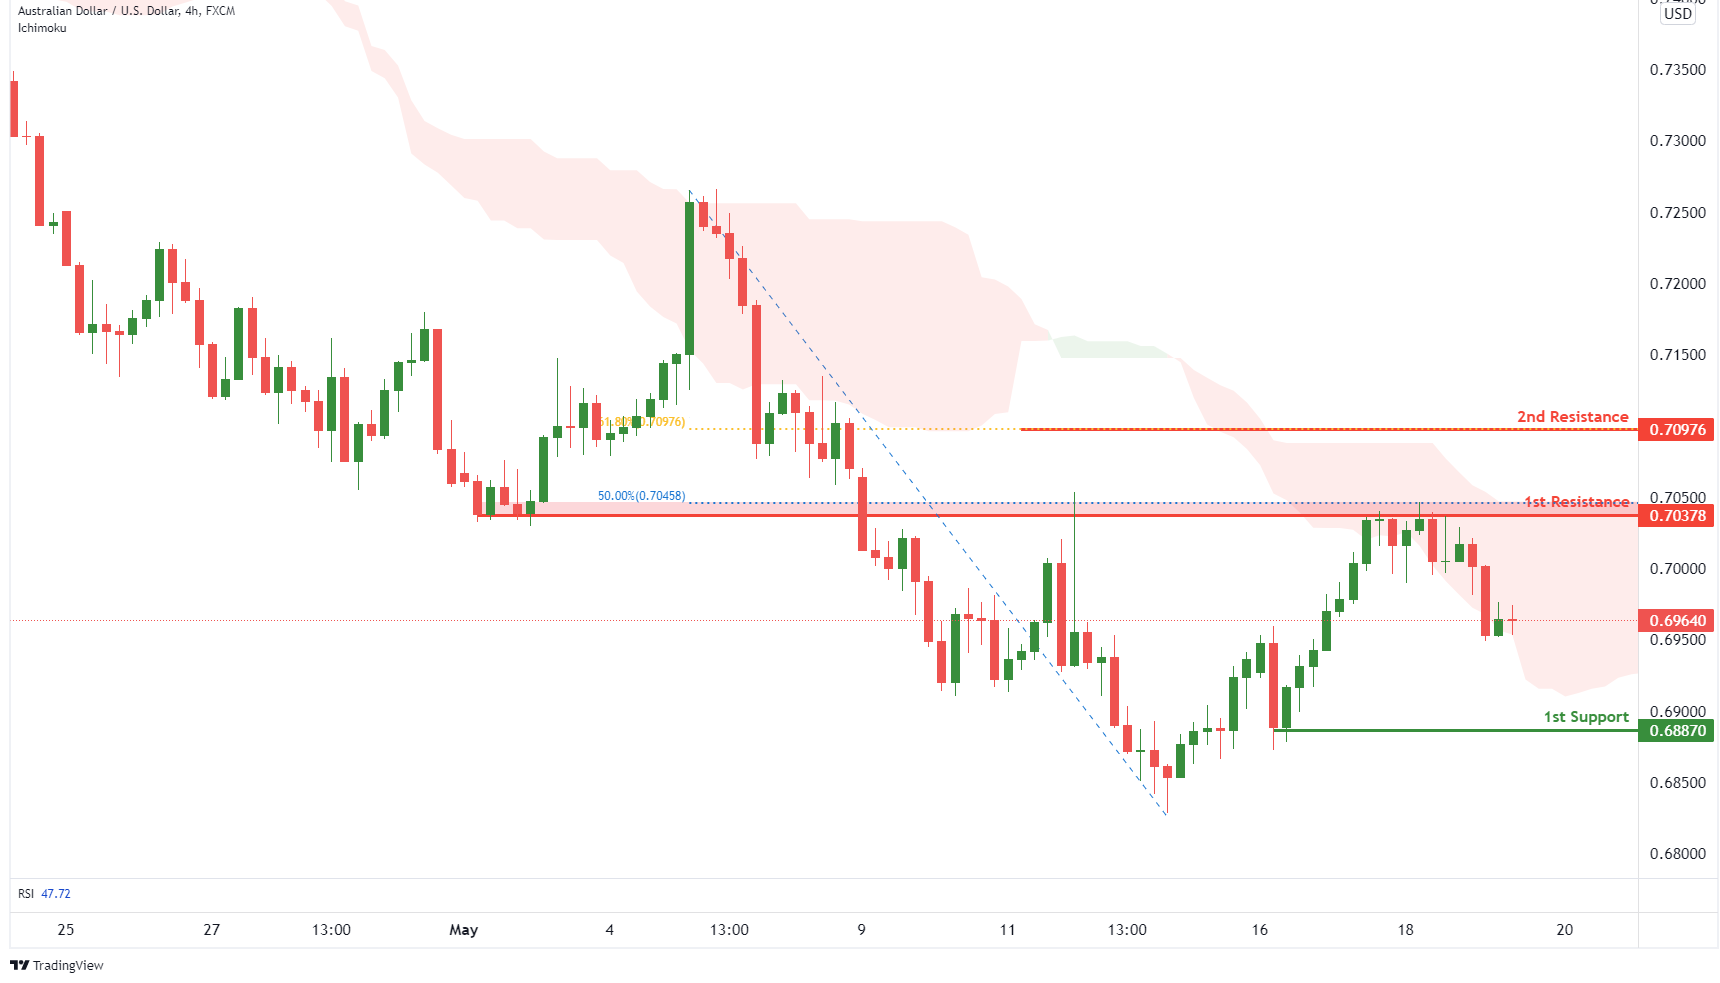
On the H4, with price expected to reverse off the ichimoku cloud resistance, we have a bearish bias that price will drop from our 1st resistance at 0.70378 where the overlap resistance and 50% Fibonacci retracement is to our 1st support at 0.68870 in line with the swing low support. Alternatively, price may break 1st resistance structure and head for 2nd resistance where the 61.8% Fibonacci retracement is.
Areas of consideration
- H4 1st resistance at 0.70378
- H4 1st support at 0.68870
NZD/USD:
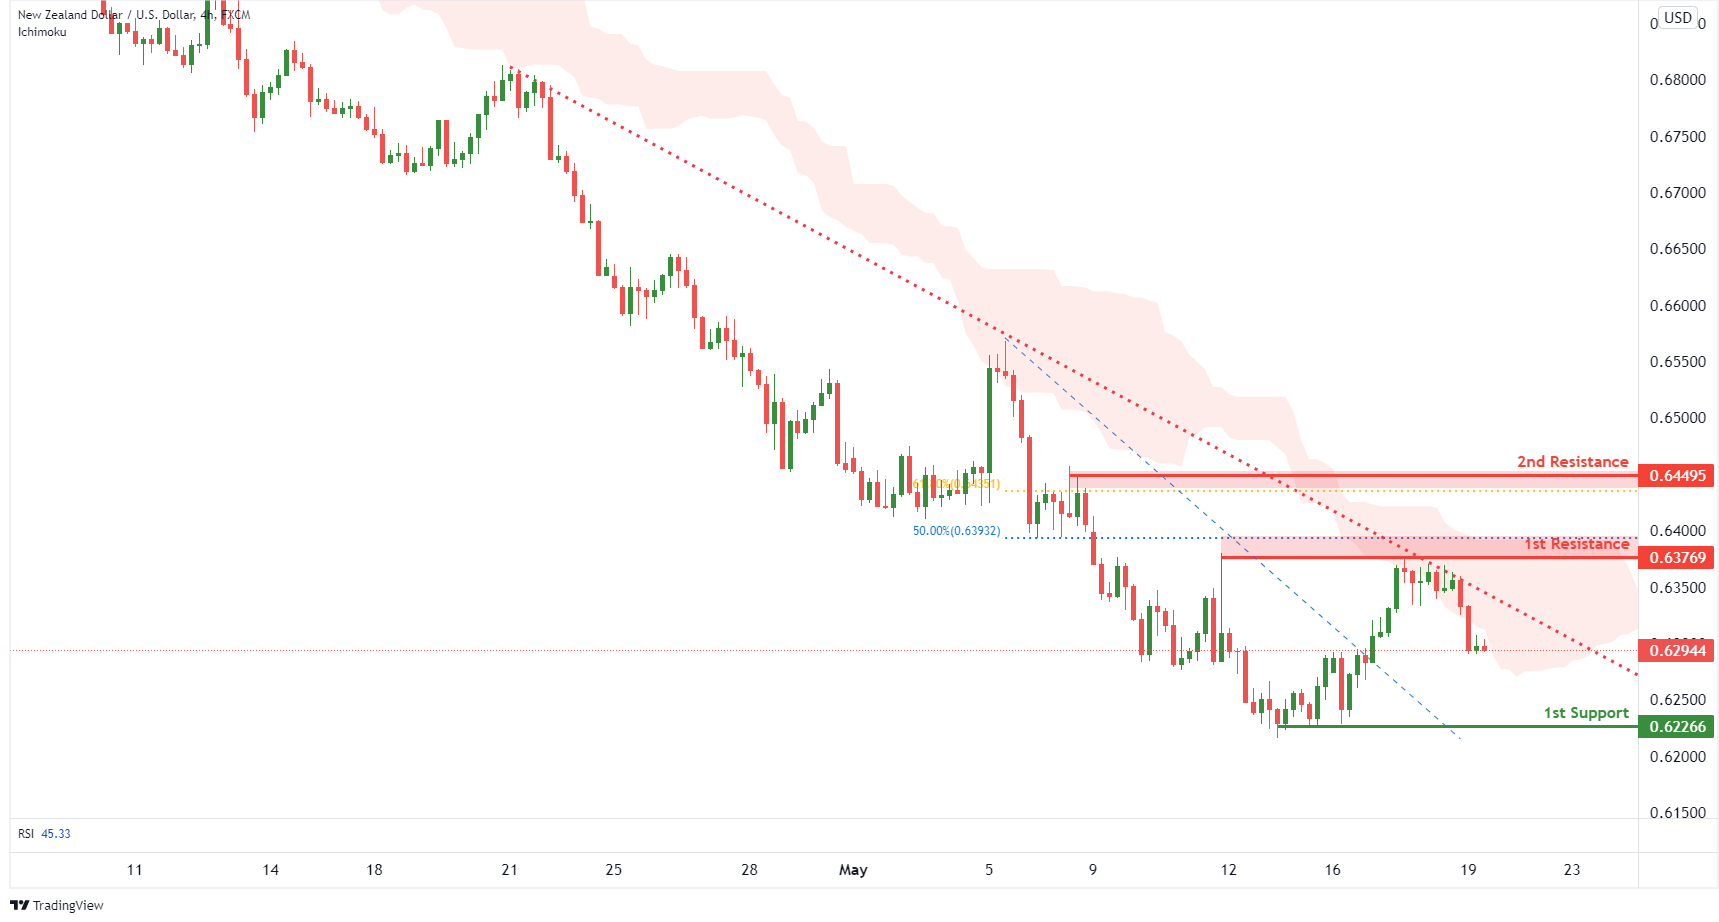
On the H4, with price moving below the ichimoku cloud, we have a bearish bias that price will drop from our 1st resistance at 0.63769 where the 50% Fibonacci retracement and horizontal pullback resistance is to our 1st support at 0.62276 in line with the horizontal swing low support. Alternatively, price may break 1st resistance structure and head for 2nd resistance at 0.64352 in line with 61.8% Fibonacci retracement.
Areas of consideration:
- H4 time frame, 1st support at 0.62276
- H4 time frame, 1st resistance at 0.63779
USD/CAD:
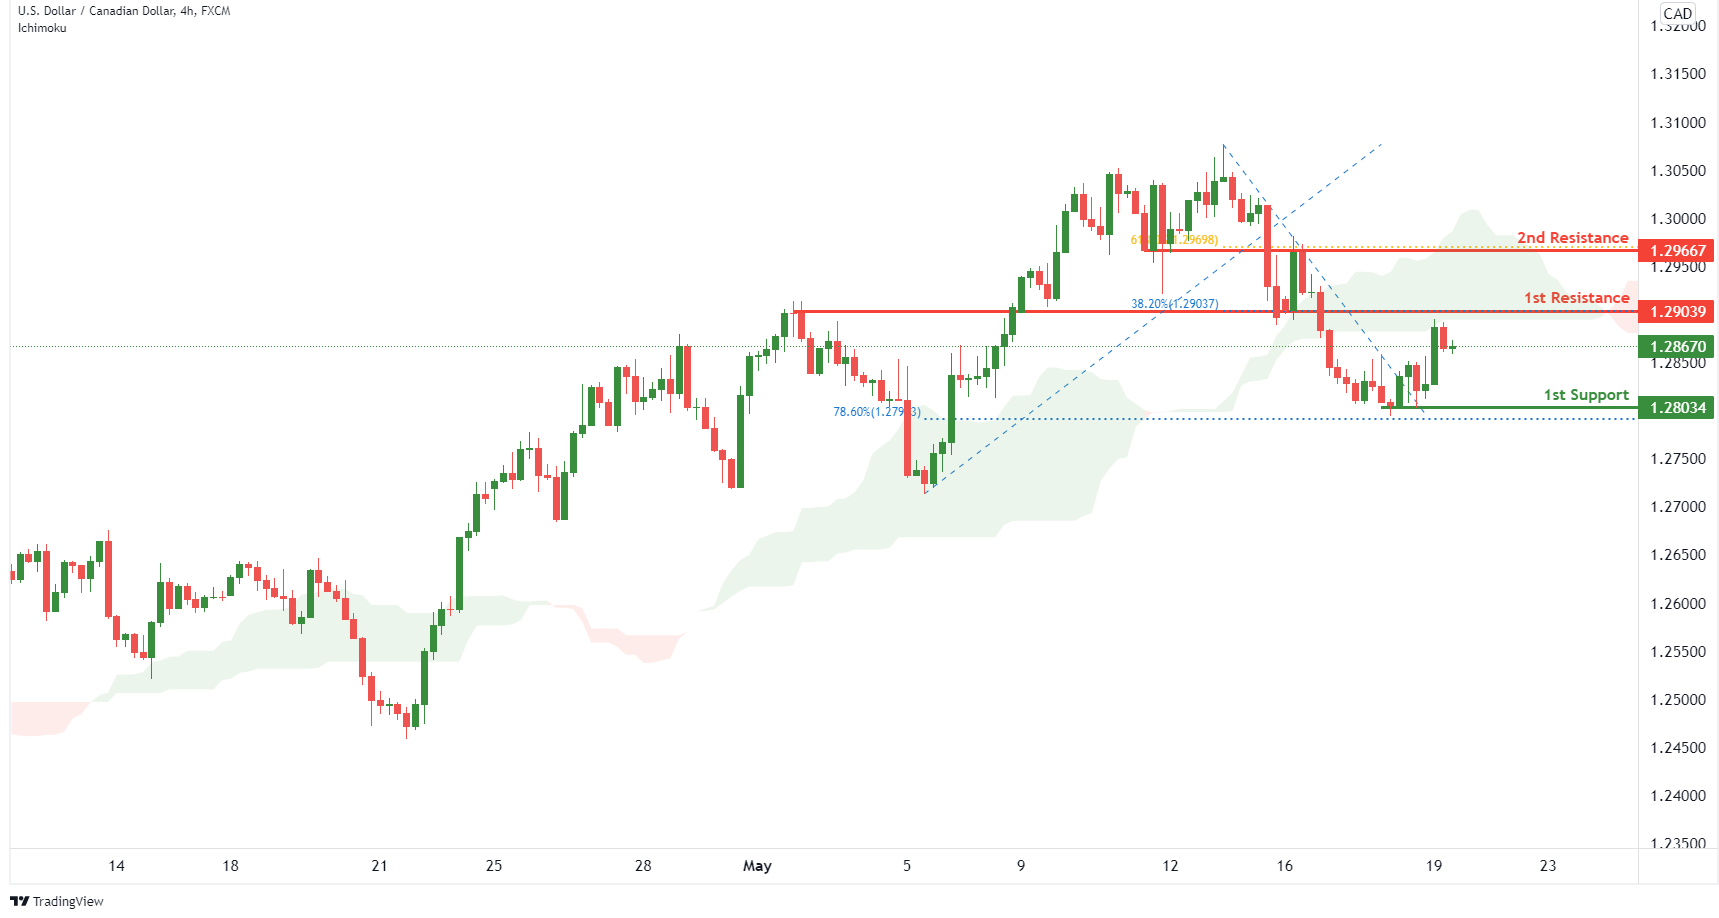
On the H4, with price moving below the ichimoku, we have a bearish bias that price will drop from our 1st resistance at 1.29039 where the horizontal pullback resistance is to our 1st support at 1.28034 in line with the swing low support. Alternatively, price may break 1st resistance structure and head for 2nd resistance where the horizontal swing high resistance is.
Areas of consideration:
- H4 time frame, 1st resistance at 1.29039
- H4 time frame, 1st support at 1.28034
OIL:
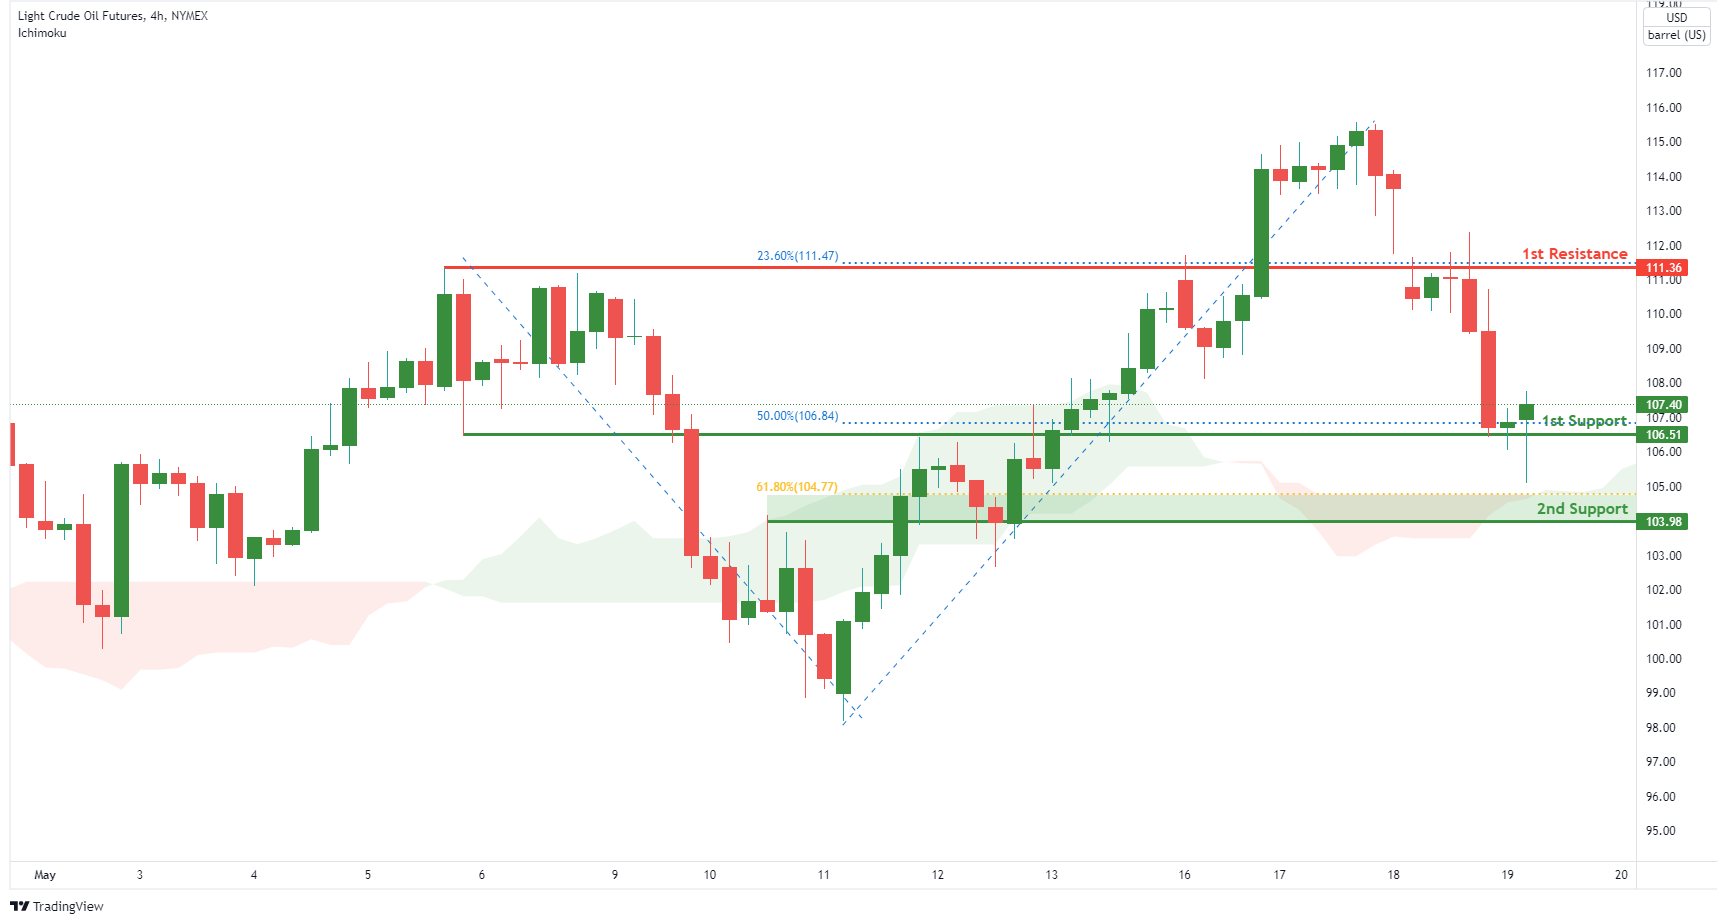
On the H4, with price expected to bounce off the ichimoku cloud, we have a bullish bias that price will rise to our 1st resistance at 111.36 where the 23.6% Fibonacci retracement from our 1st support at 106.51 in line with the horizontal overlap support and 50% fibonacci retracement. Alternatively, price may break 1st support structure and head for 2nd support where the horizontal pullback resistance is.
Areas of consideration:
- H4 time frame, 1st resistance of 111.36
- H4 time frame, 1st support of 106.51
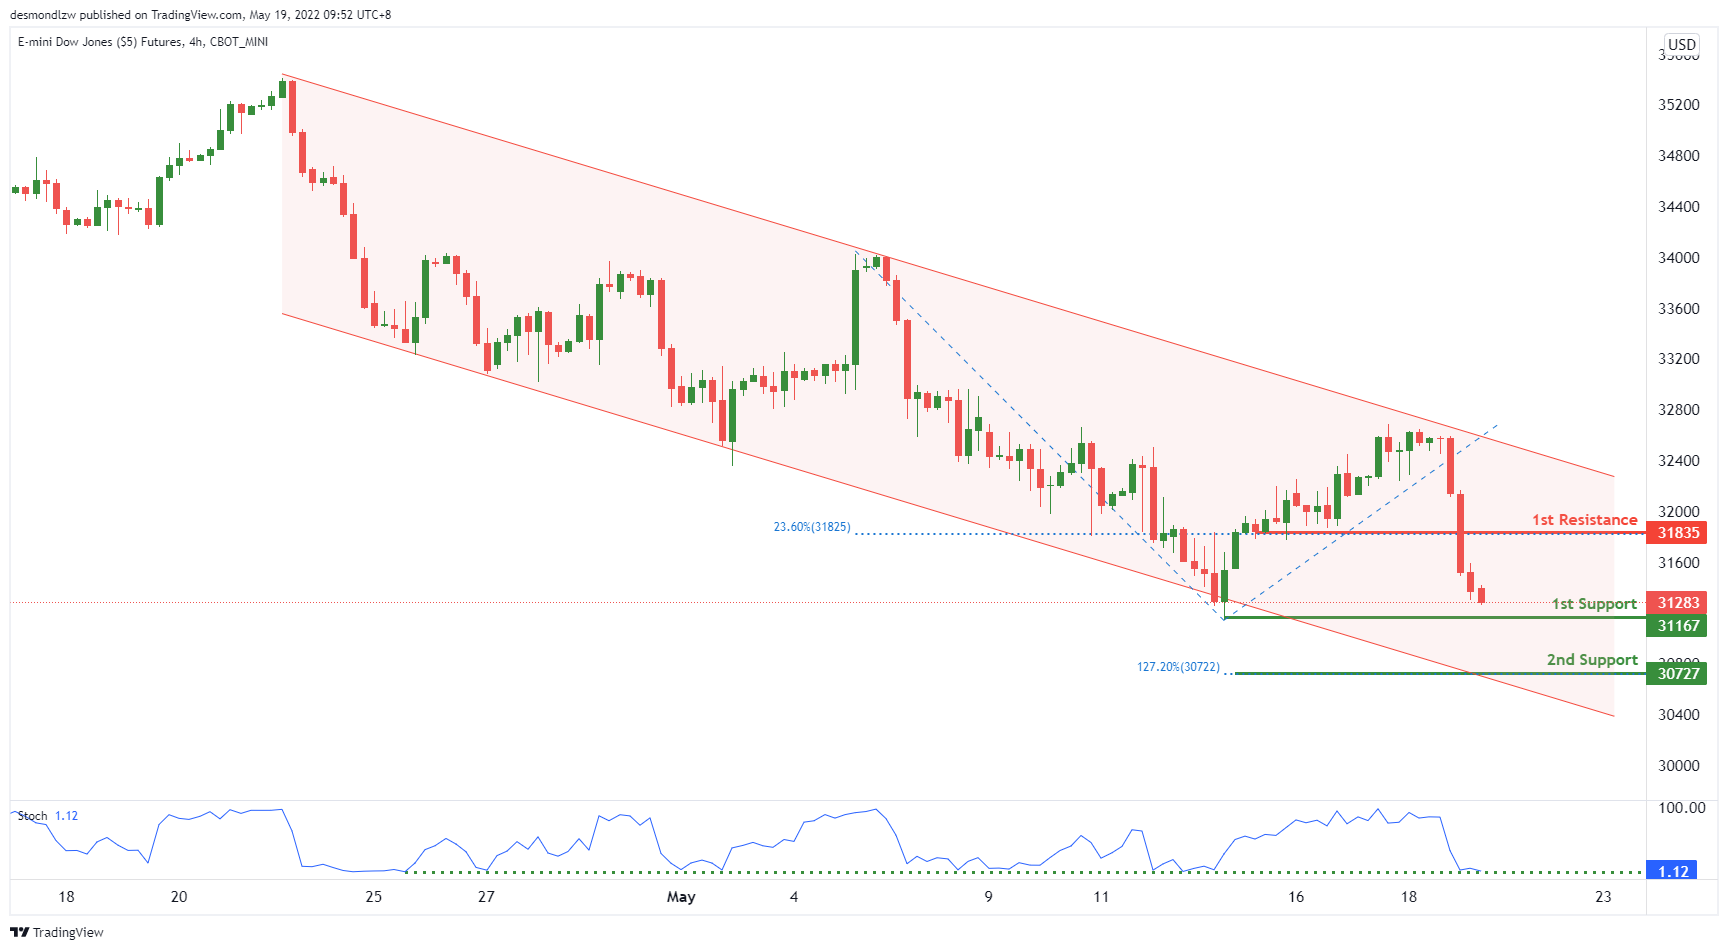
Dow Jones Industrial Average:
On the H4, with price moving below the ichimoku cloud, we have a bearish bias that price will drop from our 1st resistance at 32553 where the 50% Fibonacci retracement is to our 1st support at 31294 in line with the swing low support. Alternatively, price may break 1st resistance structure and head for 2nd resistance where the 78.6% Fibonacci retracement.
Areas of consideration :
- H4 time frame, 1st resistance at 32553
- H4 time frame, 1st support at 31294