

Sample Category Title
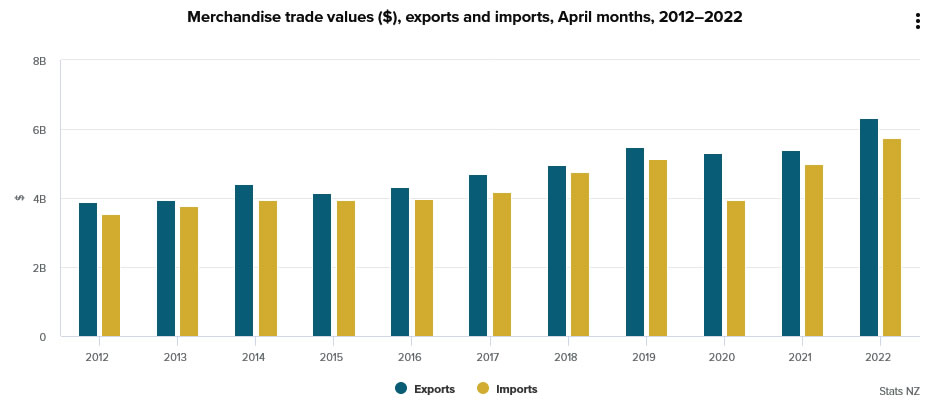
New Zealand export rose 17% yoy in Apr, imports rose 15% yoy
New Zealand goods exports rose 17% yoy to NZD 6.3B in April. Imports rose 15% yoy to NZD 5.7%B. Monthly trade surplus came in at NZD 584m, versus expectation of NZD -350m deficit.
Exports rose for all top destinations except China, which was down -1.8%. Exports to Australia was up 4.9%, US up 26%, EU up 26%, Japan up 58%.
Import from all top partners rose, including China (up 8.9%), EU (up 18%), Australia (up 44%), US (up 29%), Japan (up 0.5%).
Fed Kashkari: We have to get inflation down, achieve a soft landing
Minneapolis Fed President Neel Kashkari said yesterday, "we know we have to get inflation down; we are doing everything we can to achieve a 'soft landing,' but I'll be honest with you: I don't know the odds of us pulling that off."
On recent stock market rout, he said, "The wealth effect is a real thing...those who have stocks have higher 401Ks, they feel more confident, they go out and spend more, when those things come down, it may change their behavior... we do pay attention to that feedback."
Elliott Wave View: EURUSD Rallying in Zigzag
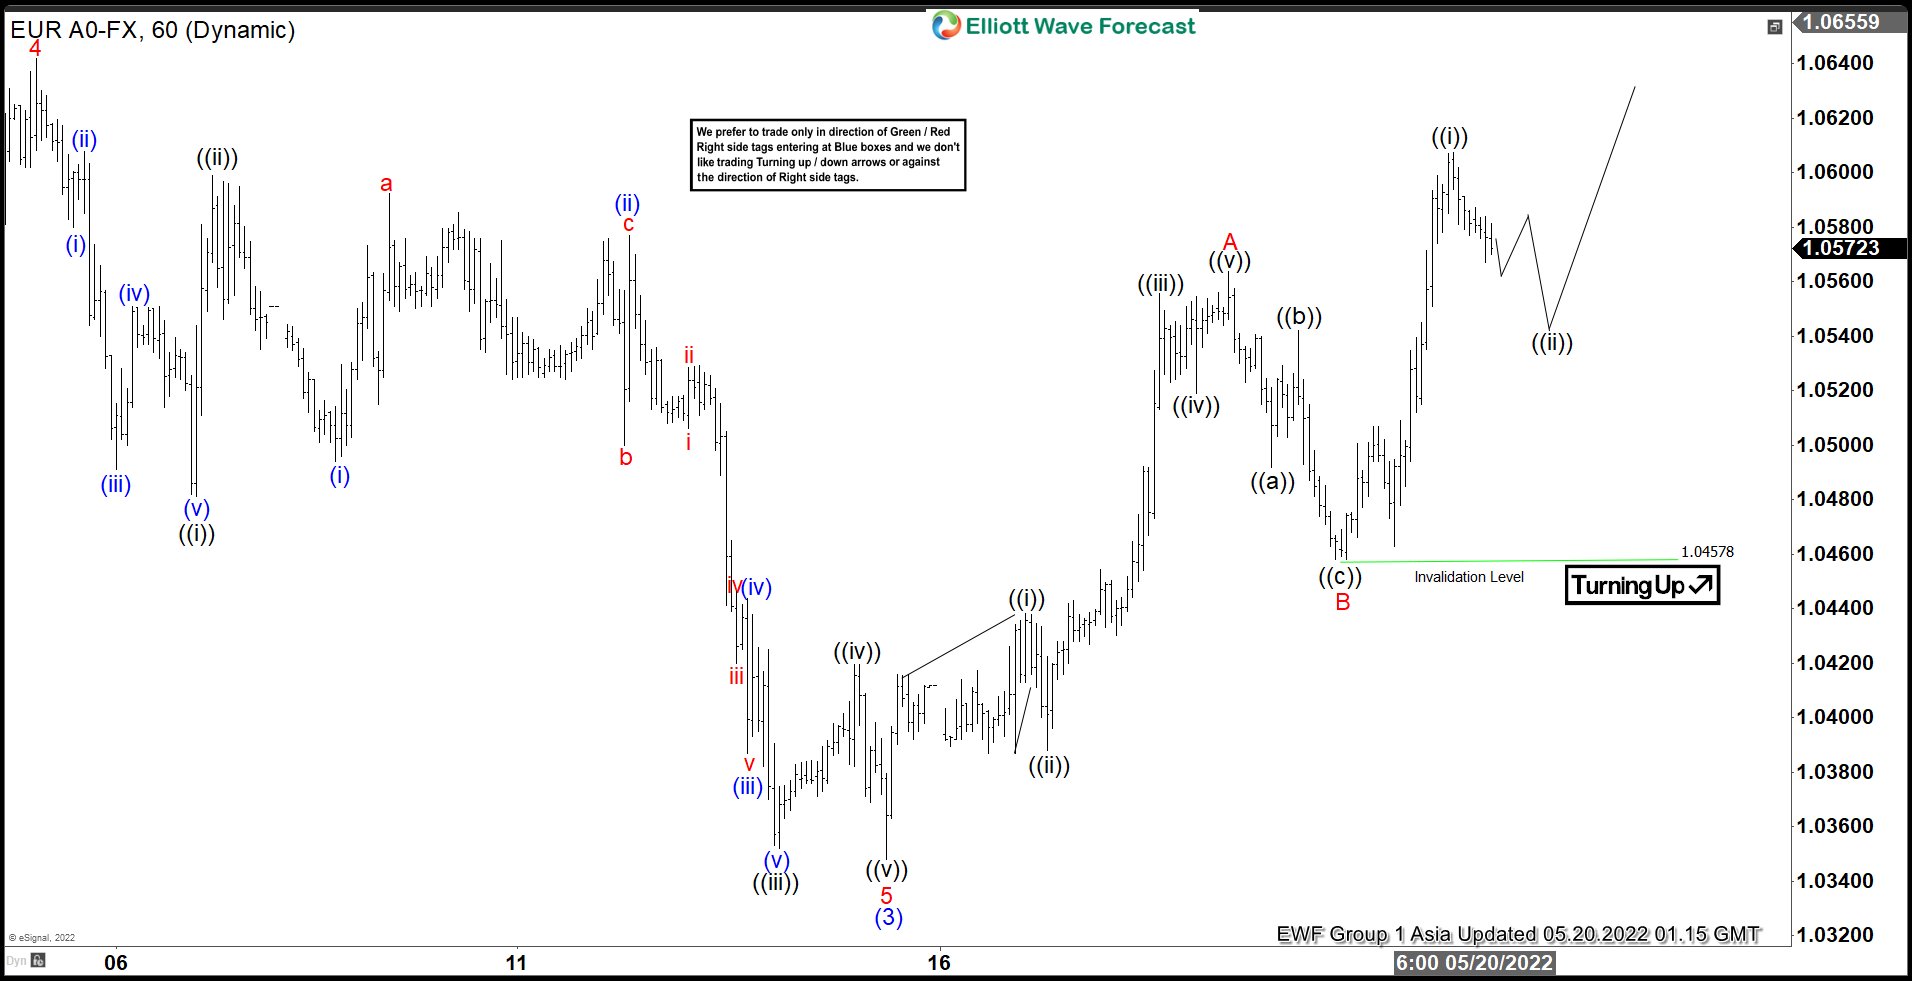
Short Term Elliott Wave View in EURUSD suggests the decline from February 10, 2022 peak is unfolding as a 5 waves impulse Elliott Wave structure. Down from February 10, wave (1) ended at 1.0806 and rally in wave (2) ended at 1.1185. Pair then resumes lower in wave (3) and ended at 1.0348. Wave (4) corrective rally is presently in progress with internal subdivision as a zigzag structure.
Up from wave (3) low on May 13, wave ((i)) ended at 1.04384 and dips in wave ((ii)) ended at 1.0388. Pair then extends higher in wave ((iii)) towards 1.0555, dips in wave ((iv)) ended at 1.0519 and final leg wave ((v)) ended at 1.0563 which completed wave A. Pullback in wave B ended at 1.0457. Pair has resumed higher in wave C with potential target at 100% – 161.8% Fibonacci extension of wave A at 1.067 – 1.08. Near term, as far as pivot at 1.0457 low stays intact, expect dips to find support in 3, 7, 11 swing for further upside.
EURUSD 1 Hour Elliott Wave Chart
GBP/USD: Don’t Get too Comfy with Recent Gains
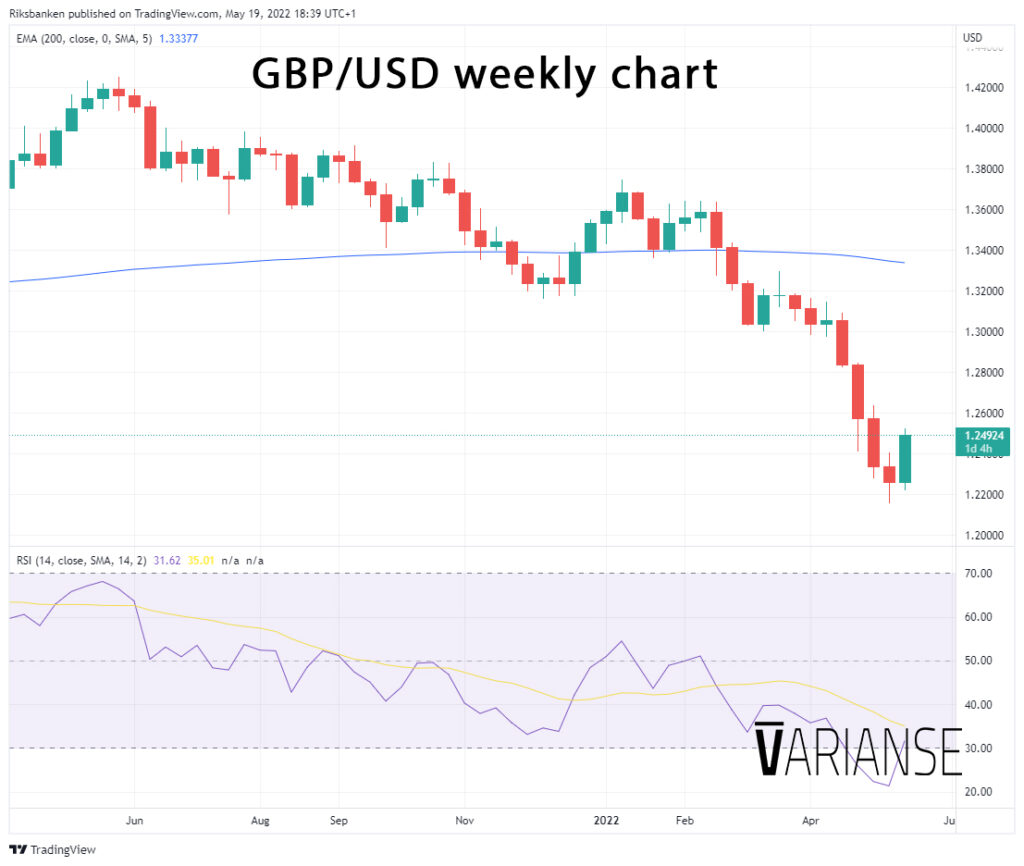
GBP/USD look headed for its first weekly gain in four weeks moving into late Thursday trading. At the time of writing, the pair was trading up by 2.03% at 1.25089, supported by a broadly weaker US dollar. But a stronger pound this week didn’t relate to any major positive news about the UK economy. On the contrary, economic data from the UK has been a relative disappointment. Traders, therefore, should be cautious reading too heavily into the positive price action in recent days.
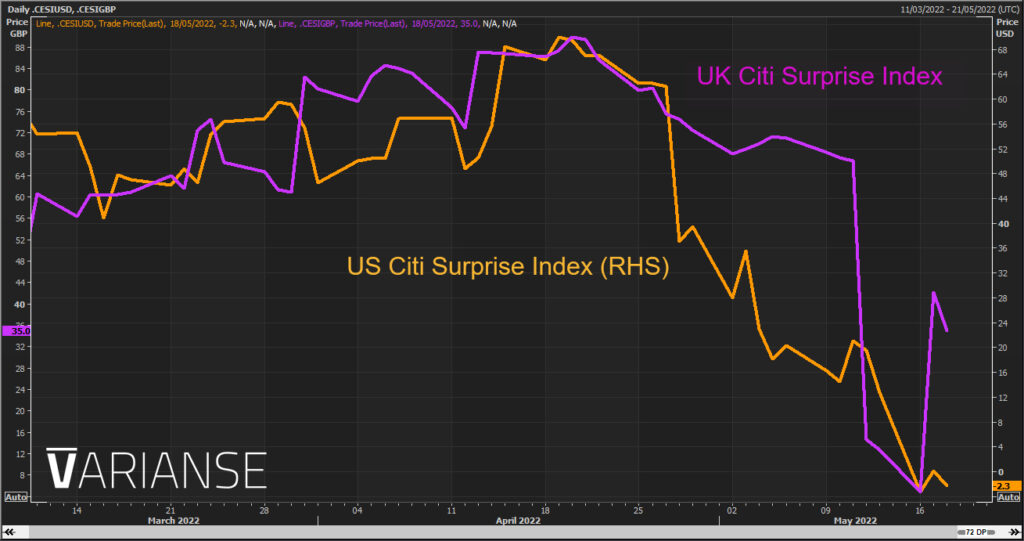
UK Q1 GDP data last week proved a real disappointment and March monthly GDP did by even more. Tuesday’s April CPI release didn’t prove to be all that much better. Granted, both headline and core inflation came one ppt lower than estimated, but at 9% y/y CPI – inflation in the UK is still running at a year high. The only real glimmer of sunshine was last weeks March labour market report, which revealed employment was holding up well for now. But wages were still well behind the pace of inflation.
Furthermore, the situation with the Northern Ireland protocol still hangs over the pound like the sword of Damocles. On Thursday, the UK government was setting out plans to re-write the legislation, setting off a potential row with the EU. Relations with EU in this regard could come under more strain in the coming days. If the recent moves higher in GBP/USD reflect anything, it is lower bond yields in the US driving down the relative returns between the two currencies.
Yields, however, are falling in part because of fears over global growth as much as they are over concerns about US growth conditions. If concerns about the global economy get too extreme, there is a risk the US dollar starts to take on its safe-haven attributes. As a result, the US dollar may rise even if US yields fall. At times like these, tight risk management and cautious position sizing can be more beneficial than having deep convictions that a major reversal is at hand.
GBPCHF Wave Analysis
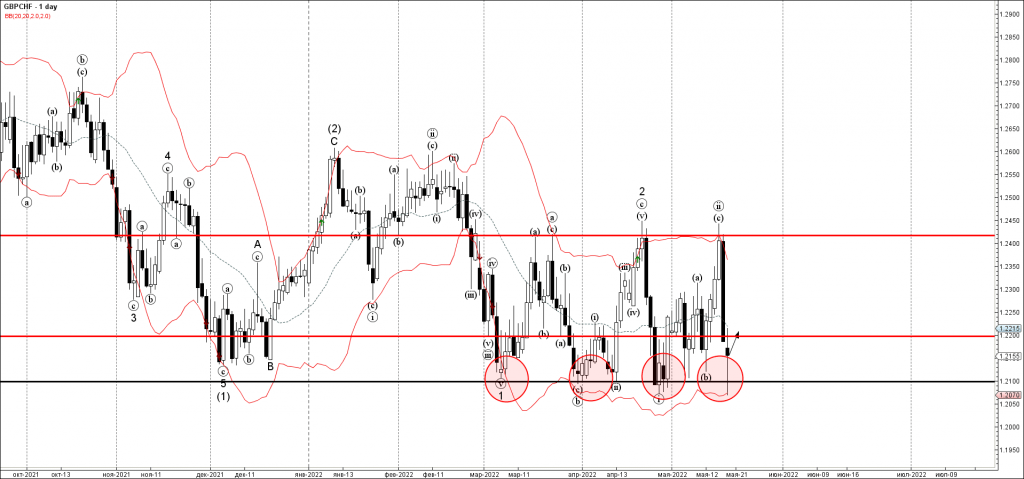
- GBPCHF reversed from key support level 1.2100
- Likely to rise to resistance level 1.2200
GBPCHF today reversed up with the daily Long-Legged Doji from the key support level 1.2100 (which has been steadily reversing the pair from the start of March).
The support zone near the support level 1.2100 was strengthened by the lower daily Bollinger Band.
Given the strength of the nearby support level 1.2100, GBPCHF can be expected to rise further toward the next resistance level 1.2200.
AUDCHF Wave Analysis
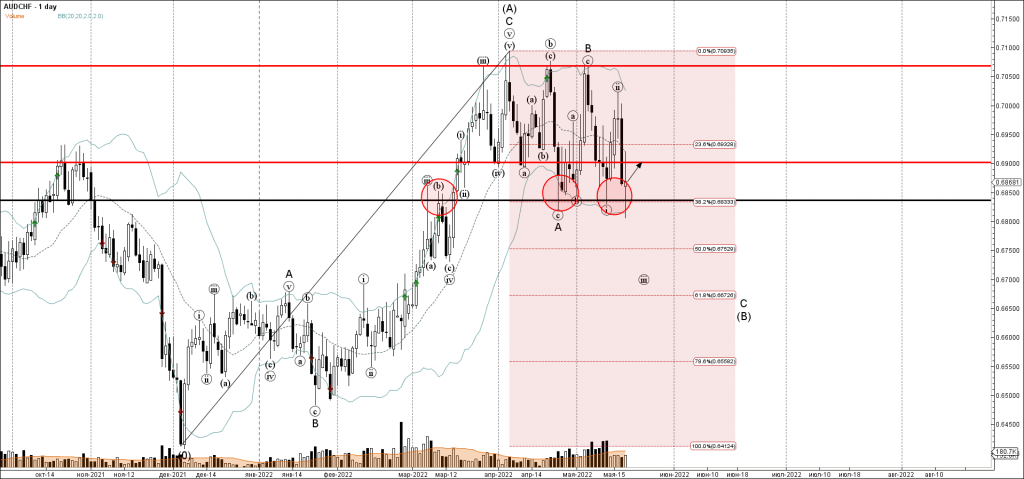
- AUDCHF reversed from support area
- Likely to rise to resistance level 0.6900
AUDCHF today reversed up from the support area lying at the intersection of the support level 0.6835 (former resistance from March, acting as support now) and the lower daily Bollinger Band.
This support area was further strengthened by the 38.2% Fibonacci correction of the upward impulse from December.
Given the clear daily uptrend, AUDCHF can be expected to rise further toward the next resistance level 0.6900.
EURUSD Buyers Target 1.06 Handle
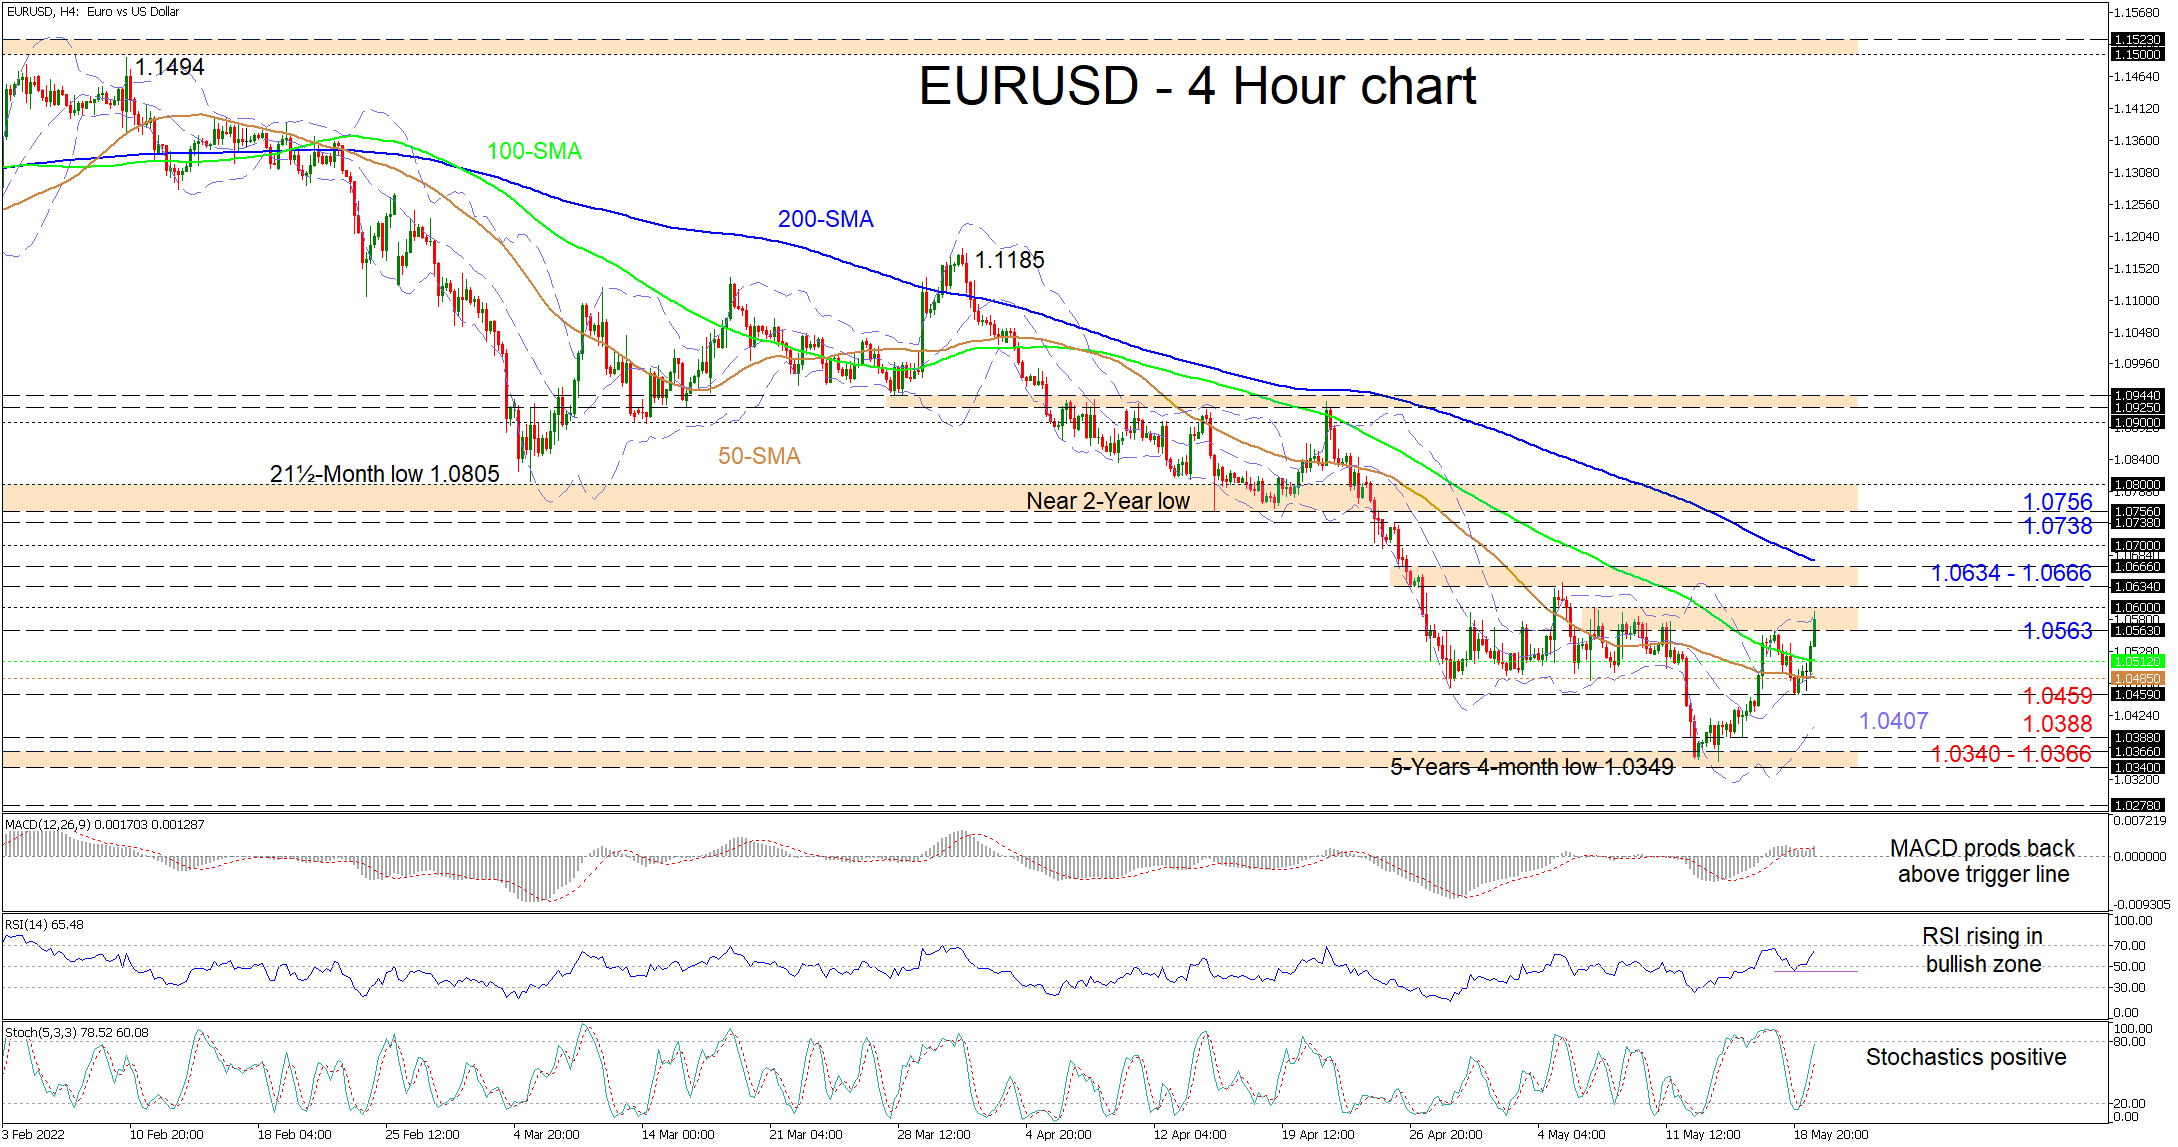
EURUSD’s fresh positive traction is struggling to surpass the upper Bollinger band residing within the 1.0563-1.0600 resistance region. Despite the pair’s newfound buoyancy extending beyond the sliding 50- and 100-period simple moving averages (SMAs), all the SMAs are promoting the bearish bearing.
The short-term oscillators have yet to reflect any clear weakness in the driving positive forces in the pair. The MACD, slightly north of the zero threshold, has lifted back above its red trigger line, while the improving RSI is heading for the 70 overbought barrier. Furthermore, the positively charged stochastic oscillator is implying that positive price action remains robust.
For the positive scenario to develop further, the bulls would need to initially climb beyond the 1.0563-1.0600 barricade, reinforced by multiple highs and the upper Bollinger band. Not much higher, the 1.0634-1.0666 obstacle and the approaching 200-period SMA overhead may try to test buyers’ efforts to overrun the 1.0700 and pilot for the 1.0738 high and the adjacent 1.0756-1.0800 resistance section that extends back to the May 2020 region of lows.
If buying pressures fade back below yesterday’s high of 1.0563, a support zone could transpire from the 100-period SMA at 1.0512 until the 50-period SMA at 1.0485. If selling interest intensifies and sinks the price past the 1.0459 border, the bears may then aim for the lower Bollinger band at 1.0407 and the 1.0388 low. Remaining heavy, the pair may revisit the 1.0340-1.0366 multi-year support region, moulded by troughs back in January 2017.
Summarizing, EURUSD downside risks continue to linger with the broader outlook advertising a sturdy bearish trend. Yet, buyers are pushing back and a climb in the price above the 1.0634-1.0666 barricade could reinforce a growing positive vibe in the pair.
Gold – Back in Favour?
Or just a blip?
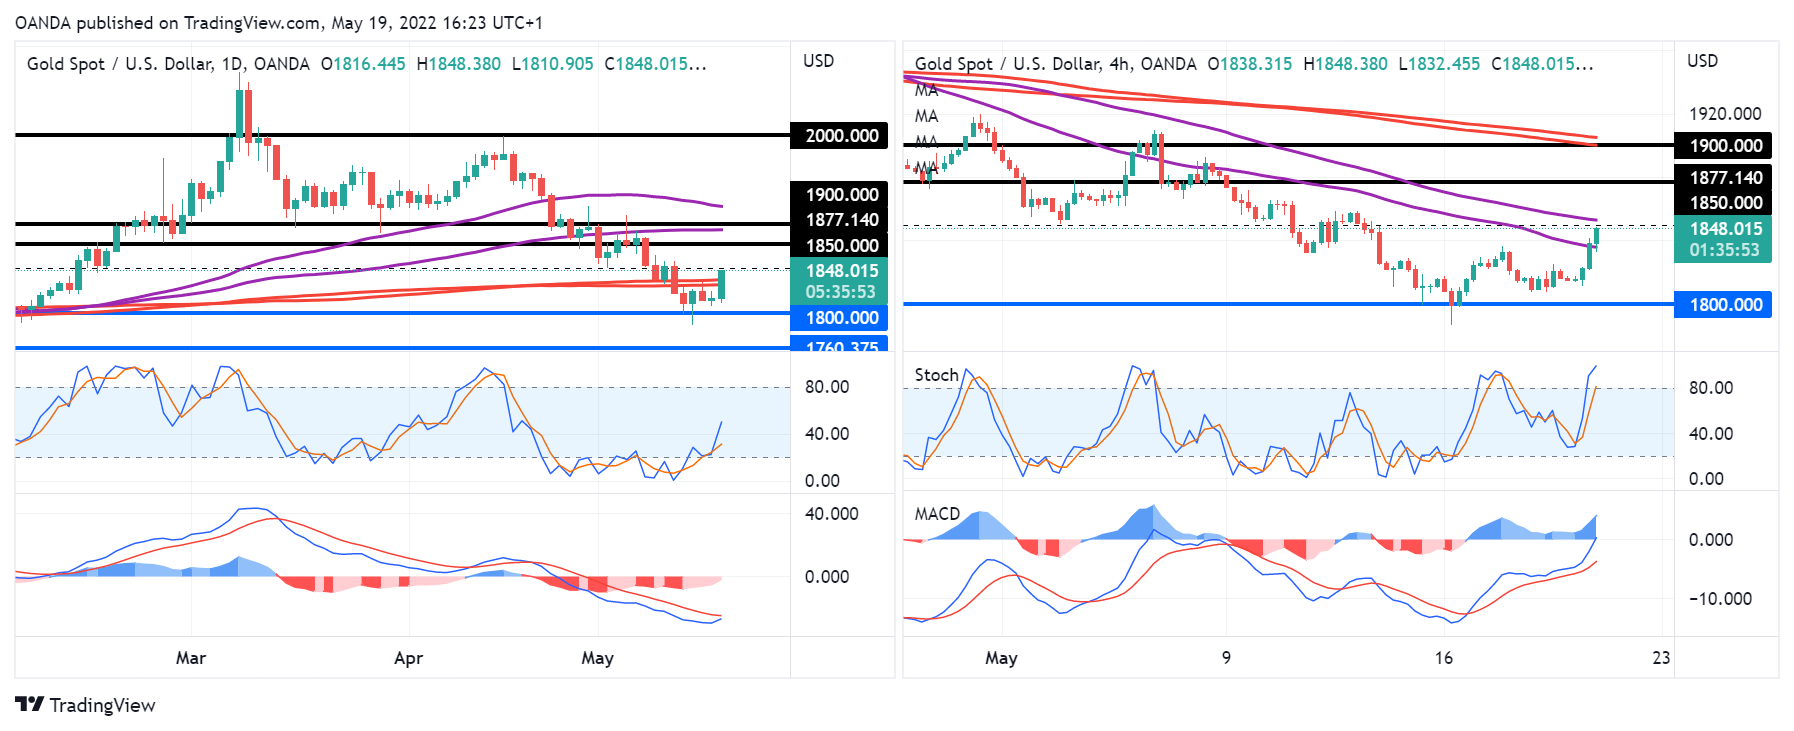
Gold has very much fallen out of favour over the last month as it fell 10% on the back of coming within a whisker of $2,000. But has something changed?
We’ve seen plenty of risk aversion in the markets over the last 24 hours, with stock markets falling heavily, and rather than being particularly supportive for the dollar, it’s gold that has performed well which hasn’t really been the case in recent weeks.
Perhaps that’s because higher inflation and therefore interest rate expectations have been behind all of the gloom in the markets, which is typically bullish for the dollar.
Whereas the last 24 hours seem to have seen a shift. Rather than interest rates, it’s economic fears that are driving the negativity in the markets. Higher inflation is squeezing margins which means higher prices. And the Fed has gone from anticipating a soft landing, to softish and now just a safe one. That shouldn’t fill anyone with confidence.
And maybe that’s why we’re seeing investors move back towards gold. Of course, we’ve seen plenty of big sentiment swings in the markets, especially this year, so that could change. But it’s possible that gold may be back in favour.
The first test of this comes around $1,850 which has been support and resistance in the past and coincides with the upper end of the 55/89-period SMA on the 4-hour chart.
This is followed by $1,875-1,900, a break of which would be a strong signal. A break back below $1,800 on the other hand would suggest quite the opposite unless accompanied by very positive economic news which seems unlikely at this point.
Fed George: We are good at 50 basis points right now
Kansas City Fed President Esther George told CNBC today that the real test on Fed's tightening is inflation data. "Where I am focused on when 'enough is enough' is looking at our inflation target. Right now inflation is too high and we will have to make a series of rate adjustments," she said.
Also, "we are good at 50 basis points right now and I would have to see something very different to say we need to go further than that," George said.