Sample Category Title
GBP/USD Mid-Day Outlook
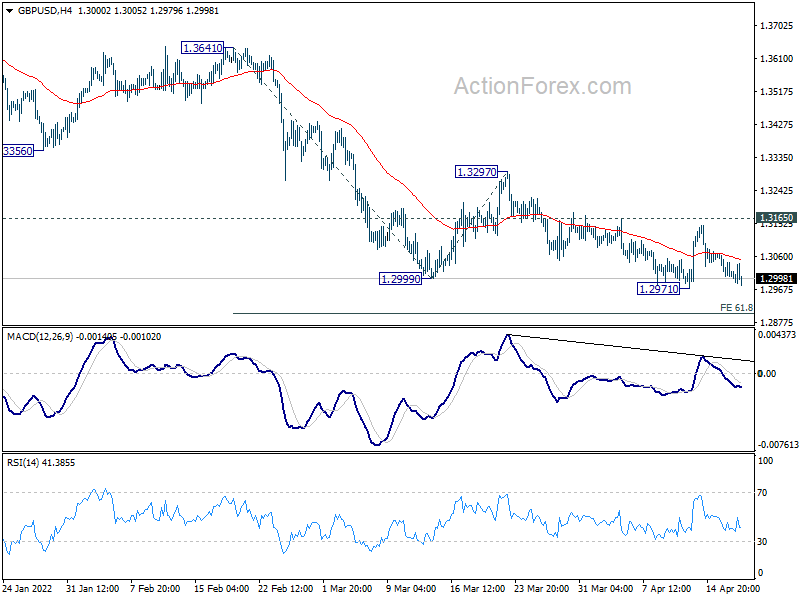
Daily Pivots: (S1) 1.2989; (P) 1.3027; (R1) 1.3049; More...
GBP/USD is still bounded in consolidation from 1.2971 and intraday bias remains neutral first. Further decline is expected with 1.3165 resistance intact. On the downside, break of will resume larger down trend from 1.4248. Next target is 61.8% projection of 1.3641 to 1.2999 from 1.3297 at 1.2900. On the upside, firm break of 1.3165 will confirm short term bottoming, and turn bias back to the upside for 1.3297 resistance and above.
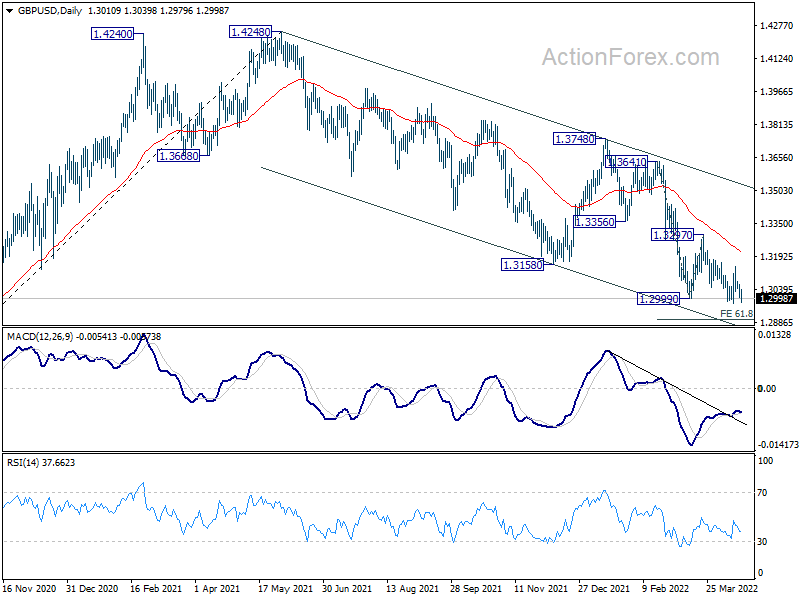
In the bigger picture, rise from 1.1409 (2020 low) has completed at 1.4248. Decline from 1.4248 could still be a corrective move, or it could be the start of a long term down trend. In either case, deeper decline would be seen back to 61.8% retracement of 2.1161 to 1.1409 at 1.2493. In any case, break of 1.3748 resistance is needed confirm completion of the fall from 1.4248, or outlook will stay bearish.
EUR/USD Mid-Day Outlook
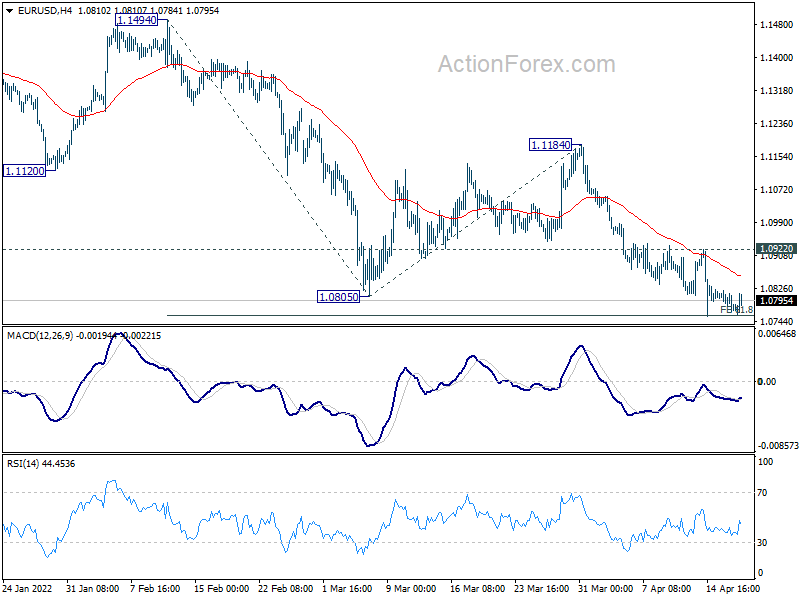
Daily Pivots: (S1) 1.0760; (P) 1.0791 (R1) 1.0812; More...
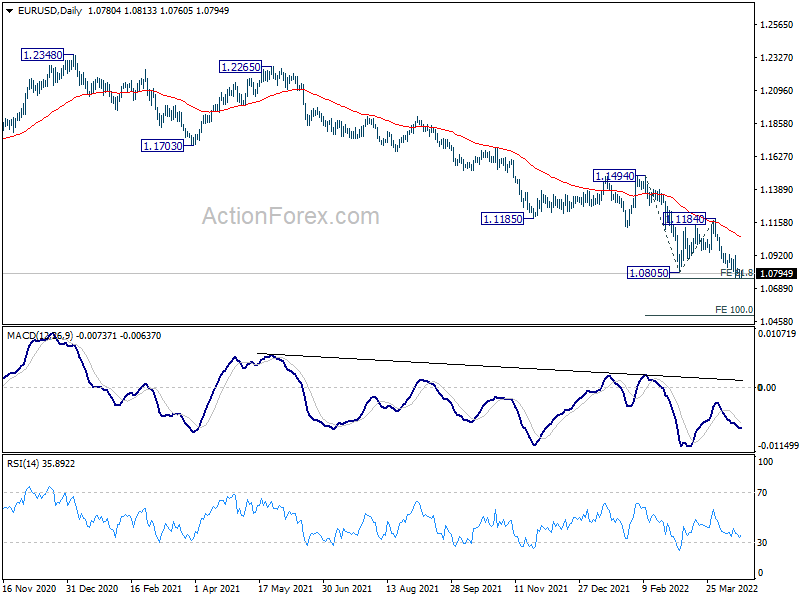
Intraday bias in EUR/USD is turned neutral as it recovers after hitting 61.8% projection of 1.1494 to 1.0805 from 1.1184. Further fall is expected as long as 1.0922 resistance holds. Firm break of 1.0758 will way to 100% projection at 1.0495. However, break of 1.0922 will turn bias back to the upside for stronger rebound towards 1.1184 resistance instead.
In the bigger picture, the decline from 1.2348 (2021 high) is expected to continue as long as 1.1494 resistance holds. Firm break of 1.0635 (2020 low) will raise the chance of long term down trend resumption and target a retest on 1.0339 (2017 low) next. Nevertheless, break of 1.1494 will maintain medium term neutral outlook, and extending term range trading first.
Yields Rise, Yen Falls, Euro Trying a Rebound
Yen's weakness remains the main theme today as selloff in major global treasuries continue. US 10-year yield breaches 2.9 handle while Germany 10-year yield breaches 0.94. UK 10-year Gilt yield is also heading towards 2% handle. Swiss Franc is following as second weakest together with Canadian Dollar. On the other hand, Aussie and leading the way up, followed by Euro, which is rebounding against Sterling and Franc. Dollar is mixed in between, awaiting the next guidance.
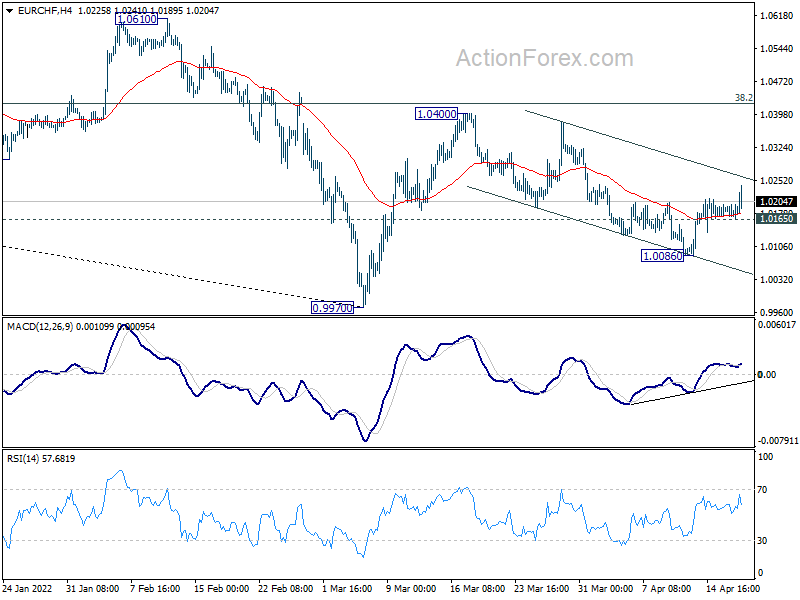
Technically, EUR/CHF's rebound from 1.0086 extended higher today but retreated just ahead of near term falling channel resistance. For now further rise is in favor as long as 1.0165 minor support intact. Break of the channel resistance will set up further rally for 1.0400 resistance. However, break of 1.0165 will indicate rejection by the channel resistance and bring retest of 1.0086. EUR/CHF's next move could be a hint on the sustainability of Euro's rebound.
In Europe, at the time of writing, FTSE is down -0.42%. DAX is down -0.66%. CAC is down -1.16%. Germany 10-year yield is up 0.105 at 0.946. Earlier in Asia, Nikkei rose 0.69%. Hong Kong HSI dropped -2.28%. China Shanghai SSE dropped -0.05%. Singapore Strait Times rose 0.12%. Japan 10-year JGB yield rose 0.0033 to 0.245.
AUD/JPY resumes up trend, NZD/JPY to follow?
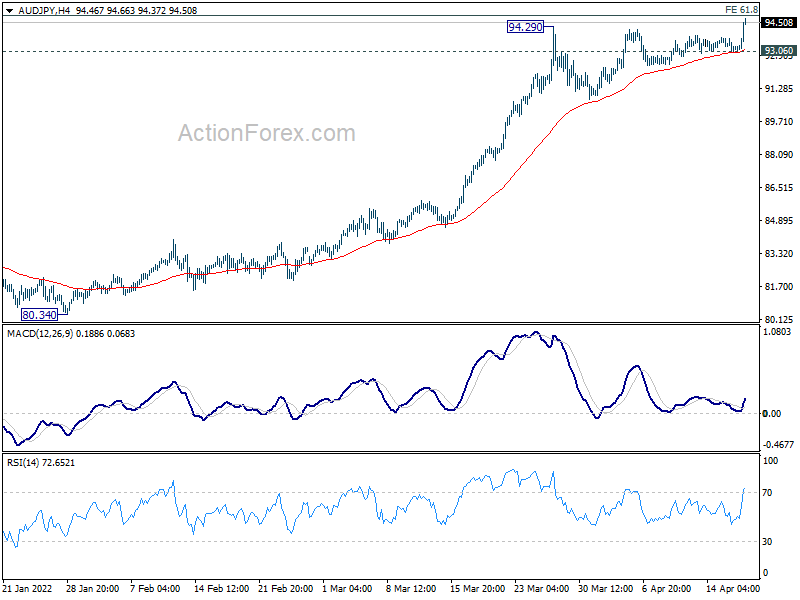
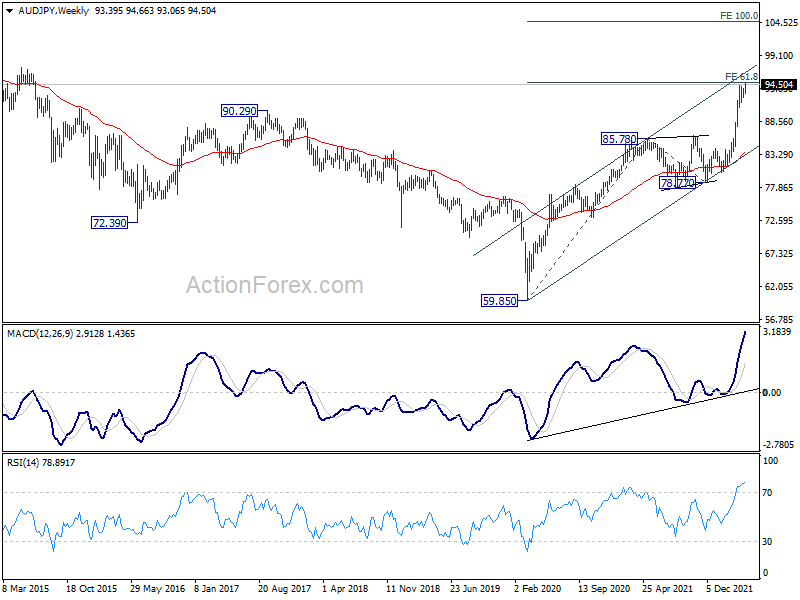
AUD/JPY's up trend finally resumes today by breaking 94.29 near term resistance. Immediate focus is now on 61.8% projection of 59.85 (2020 low) to 85.78 from 78.77 at 94.79. Sustained break there could prompt upside acceleration, for next medium term target at 100% projection at 104.70, which is close to 105.42 (2013 high). However, break of 93.06 support will suggest rejection by 94.79 and bring deeper correction, back towards 55 day EMA (now at 88.55).
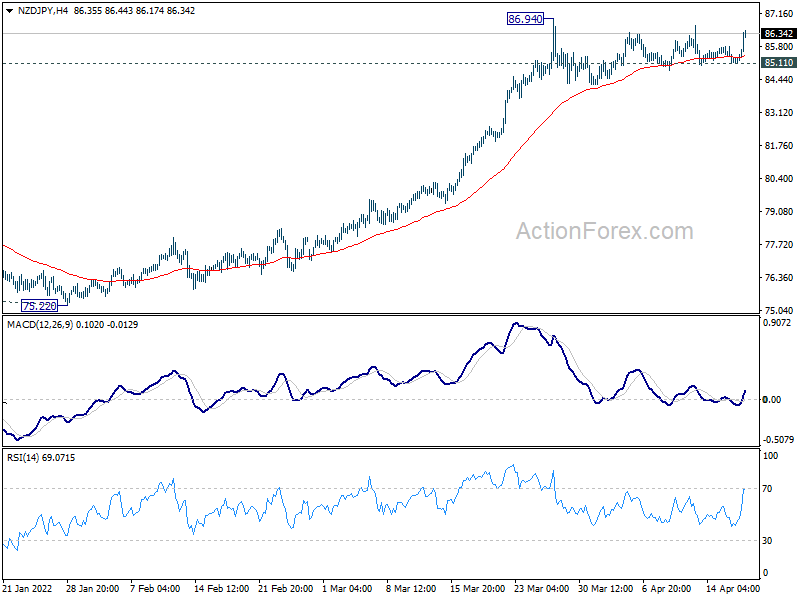
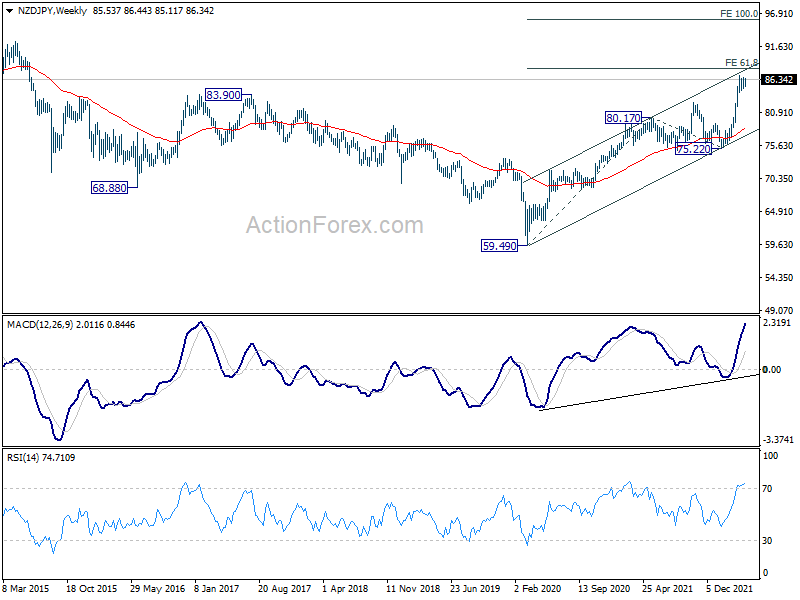
NZD/JPY is lagging behind and it's still staying below 86.94 resistance. The next move will probably need from help from AUD/JPY. Break of 86.94 in NZD/JPY (following break of 94.79 in AUD/JPY) will resume larger up trend through 61.8% projection of 59.49 to 80.17 from 75.22 at 88.00. However, break of 85.11 (following AUD/JPY's break of 93.06) will bring deeper pull back towards 55 day EMA (now at 82.09).
RBA minutes; Developments have brought forward liking timing of rate hike
In the minutes of April 5 meeting, RBA said, inflation in Australia had "picked up" and a "further increase was expected" with measures of underlying inflation in the March quarter expected to be above 3%. Wages growth had "picked up" too but "had been below rates likely to be consistent with inflation being sustainably at the target." These developments have "brought forward the likely timing of the first increase in interest rates. "
"Over coming months, important additional evidence will be available on both inflation and the evolution of labour costs. Consistent with its announced framework, the Board agreed that it would be appropriate to assess this evidence and other incoming information as it sets policy to support full employment in Australia and inflation outcomes consistent with the target."
RBNZ Orr: It's more about hiking sooner rather than more
RBNZ Governor Adrian Orr said in an IMF event, "we've been acting reasonably aggressively to tighten monetary conditions. We've provided strong forward guidance that we expect to be doing more rate rises over coming quarters."
But he also noted, "that was more about doing it sooner rather than believing we have to do more," he said. "It's just getting on with it so people can understand what we are about." Back in February, RBNZ projected that OCR would peak at 3.25% at the end of 2023.
Raising rates too high and "you really run the risk of having a sharper than needed slowdown in economic activity," he said. "On the other hand, if you go too slow its inflation expectations that will get away from us."
"At the moment, the balance of risks as far as the monetary policy committee is concerned is very much weighted to constraining those inflation expectations in the medium term," he said. "We know the long-term cost of letting inflation expectations get away."
EUR/USD Mid-Day Outlook
Daily Pivots: (S1) 1.0760; (P) 1.0791 (R1) 1.0812; More...
Intraday bias in EUR/USD is turned neutral as it recovers after hitting 61.8% projection of 1.1494 to 1.0805 from 1.1184. Further fall is expected as long as 1.0922 resistance holds. Firm break of 1.0758 will way to 100% projection at 1.0495. However, break of 1.0922 will turn bias back to the upside for stronger rebound towards 1.1184 resistance instead.
In the bigger picture, the decline from 1.2348 (2021 high) is expected to continue as long as 1.1494 resistance holds. Firm break of 1.0635 (2020 low) will raise the chance of long term down trend resumption and target a retest on 1.0339 (2017 low) next. Nevertheless, break of 1.1494 will maintain medium term neutral outlook, and extending term range trading first.
Economic Indicators Update
| GMT | Ccy | Events | Actual | Forecast | Previous | Revised |
|---|---|---|---|---|---|---|
| 22:30 | NZD | Business NZ PSI Mar | 51.6 | 48.6 | 48.9 | |
| 01:30 | AUD | RBA Meeting Minutes | ||||
| 04:30 | JPY | Industrial Production M/M Feb | 2.00% | 0.10% | 0.10% | |
| 12:15 | CAD | Housing Starts Y/Y Mar | 246K | 249K | 247K | 250K |
| 12:30 | USD | Building Permits Mar | 1.87M | 1.83M | 1.86M | |
| 12:30 | USD | Housing Starts Mar | 1.79M | 1.74M | 1.77M | |
| 12:30 | CAD | Foreign Securities Purchases (CAD) Feb | 7.44B | 15.23B | 13.49B |
Yen Slides to 128 Against Dollar
The Japanese yen’s downswing has continued full force this week, as the currency can’t find its footing. USD/JPY is trading at 128.40 in Europe, up 1.1% on the day.
Yen closing in on 130
The yen continues its nasty slide, with the currency having fallen for twelve successive sessions against the dollar. USD/JPY has jumped 5.39% in April and shows no signs of slowing down. The lofty 130 level, which has held as resistance since 1998, is likely to fall in the next few months or even earlier.
The driver behind the yen’s downswing is the US/Japan rate differential. US Treasury rates continue to rise, with the 10-year yield currently at 2.90%. Meanwhile, JGB yields aren’t going anywhere, as the BoJ recently demonstrated when it intervened to cap 10-year yields at 0.25%, which has become a line in the sand for the BoJ’s yield curve control.
The BoJ has sufficed, until now, with jawboning about the exchange rate. This was again the strategy today when Governor Kuroda said that the yen’s moves were “somewhat rapid”, while he repeated that a weak yen was beneficial for the Japanese economy. The BoJ is more concerned about boosting inflation and will press ahead with loose monetary policy. That means that the central bank is unlikely to intervene to prop up the ailing yen. That could change, however, if USD/JPY punches above the 130 level.
It’s the opposite story with the Federal Reserve, which is expected to increase rates by 0.50% at its meeting in early May. Fed policymakers have been telegraphing a hawkish stance in the light of spiralling inflation. On Monday, Fed member Bullard, a hawk, said that the Fed rate might need to rise to a “neutral” rate of 3.50% and suggested that a 0.75% hike was a possibility. True, this statement doesn’t reflect Fed policy, but the very suggestion of a 0.75% hike illustrates how sharp a pivot the Fed has taken in recent weeks.
USD/JPY Technical
- USD/JPY continues to climb and break above resistance lines. The pair has broken above resistance at 1.2837. Above, there is resistance at 130.05
- 126.32 is a monthly support line. Next, there is support at 1.2572

GBP/USD Outlook: Bears Continue to Struggle at 1.30 Support but Remain in Play
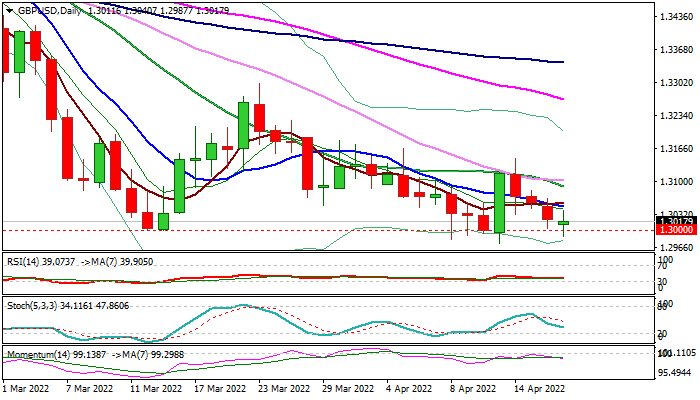
Cable remains biased lower, but bears continue to struggle at psychological 1.30 support and unable to clearly break lower for over one month.
Technical studies on daily and weekly charts show strong negative momentum, with bearish signals being reinforced by 5/200WMA death-cross and likely repeated monthly close below pivotal Fibo support at 1.3164 (38.2% of 1.1409/1.4249 rally).
However, the pair needs firm break of 1.30 pivot to signal continuation of larger downtrend from 1.4249 (June 2021 peak) and end a month-long sideways mode.
Upticks should stay capped under 1.3050 (10DMA) to keep bears intact and guard an upper pivots at 1.3100 zone (Fibo 38.2% of 1.3298/1.2972 bear-leg / 20/30 DMA’s) violation of which would sideline bears and open way for stronger rebound.
Res: 1.3050; 1.3089; 1.3100; 1.3135.
Sup: 1.3000; 1.2972; 1.2900; 1.2855.
EUR/USD outlook: Bears May Extend Towards 2020 Low as Environment Remains Very Negative for Euro
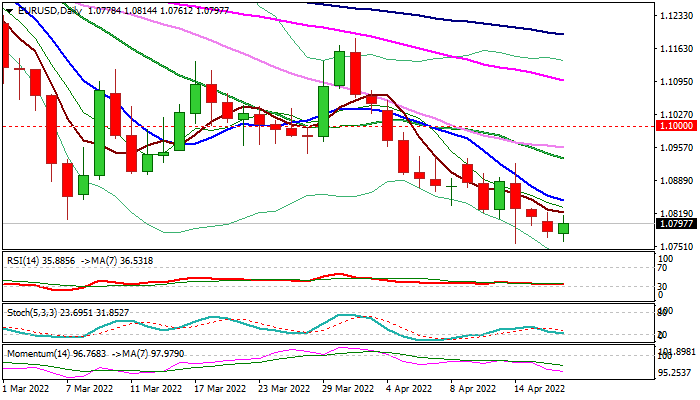
Bears are taking a brief breather on Tuesday, facing a headwinds from new two-year low (1.0757, posted on Apr 14) but remain fully in play and threatening of further losses.
Narrow consolidation is likely to precede push through 1.0757 and 1.0727 (Apr 2020 low) towards key longer-term support at 1.0635 (2020 low).
Dovish stance that the ECB presented in its last policy meeting, despite record inflation in the EU and growing fears of reverse impact of the sanctions imposed to Russia to the union’s economy, continue to strongly weaken the sentiment and prompting traders to sell the Euro.
Daily moving averages in strong bearish setup and rising negative momentum support the notion, with upticks expected to stay below falling 10 DMA (1.0846).
Res: 1.0821; 1.0846; 1.0858; 1.0900.
Sup: 1.0757; 1.0727; 1.0700; 1.0635.
Dollar is Only Halfway Through the ‘Hawkish Fed’ Rally
The dollar index passed 101, which we last saw for just over a week at the height of the lockdowns. But history suggests that this rally has roughly passed the halfway point.
Except for a brief period of stock market panic in March 2020, the last time the dollar was at this level against a basket of the six most popular currencies was in April 2017. The Dollar Index peaked in the 103-104 area in both cases and has not traded consistently higher for the past 20 years.
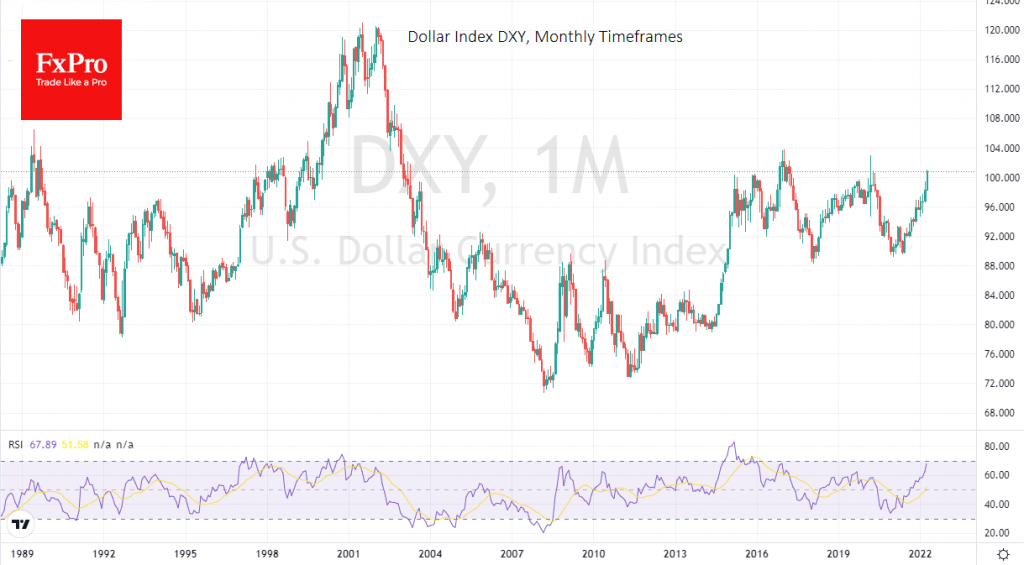
The past two times, the dollar’s rise has been halted by the Fed, easing its policy or tone of commentary, as we have seen stock and commodity markets crash along with the USD rally. That is not the case this time, so the DXY is unlikely to stop near 103-104 as it has done in the last six years.
We are now seeing a rise in the dollar, mainly on the Fed’s switch to monetary tightening mode. We saw that the last three such impulses of dollar growth, which started in 2014, 1998, and 1992 caused the DXY to appreciate by about 25%.
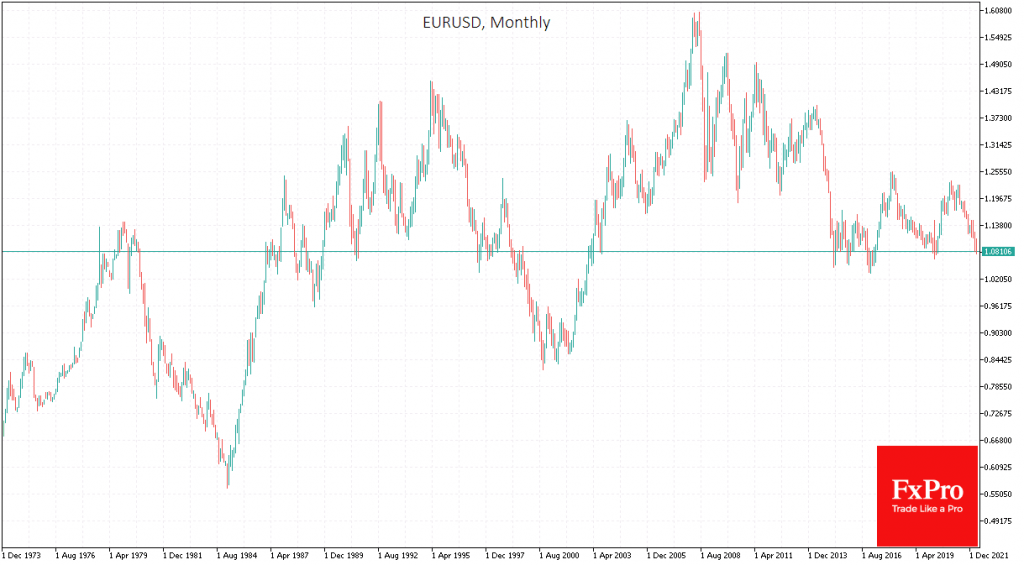
Applying this pattern to the current case, we get that the dollar has exhausted just over half of its upside potential and could strengthen as much as 110-112 on the DXY in the next few months.
For EURUSD, this scenario sets up a plunge towards parity, the lows of the last 20 years. For USDJPY, it could spike to 140, which has not been seen since 1998. And for GBPUSD, a return to 1.2000, the lows of the Brexit-fear era.
USD/JPY Outlook: Bulls Accelerate after Holiday Pause and Eye Psychological 130 Barrier
The USDJPY accelerated in Tuesday morning, as activities gain pace after traders returned from an Easter break.
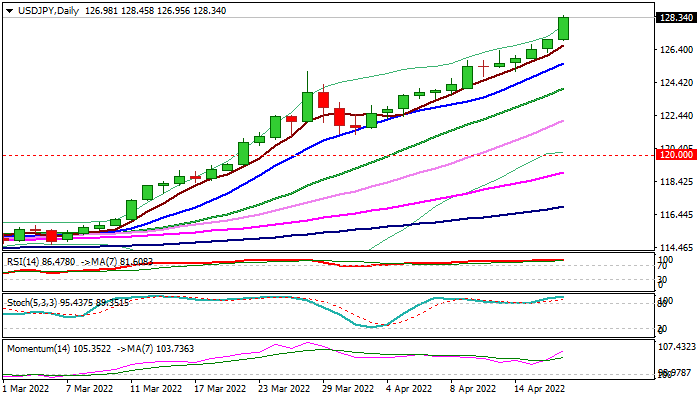
Fresh strength is exploring levels above 128 mark and trading at the highest in 20 years, with targets at 129.07 (May 2002 high) and 130 (psychological) being in focus.
The dollar remains well supported by policy divergence between the Fed and BOJ and ECB, while rising safe-haven demand on uncertainty over Ukraine crisis adds to greenback’s bullish sentiment.
The pair is on track for the second consecutive monthly rally (March advance was 5.8% and currently is over 5% in April), with signals that gains may extend further, as indicators on larger timeframes are in overbought territory but continuing to head north, keeping so far in play scenario of attacking 130 barrier. Some headwinds could be expected here, but dips in the current situation are likely to be shallow and offer better levels to re-enter strong bullish market.
Rising 10 DMA (125.60) and former top at 125.10 (Mar 28) offer solid supports which should contain extended dips and keep bulls intact.
Res: 128.45; 129.07; 130.00; 130.40.
Sup: 127.96; 127.24; 126.31; 125.96.
GBPUSD’s Bearish Bias Struggling at 1.30 Handle
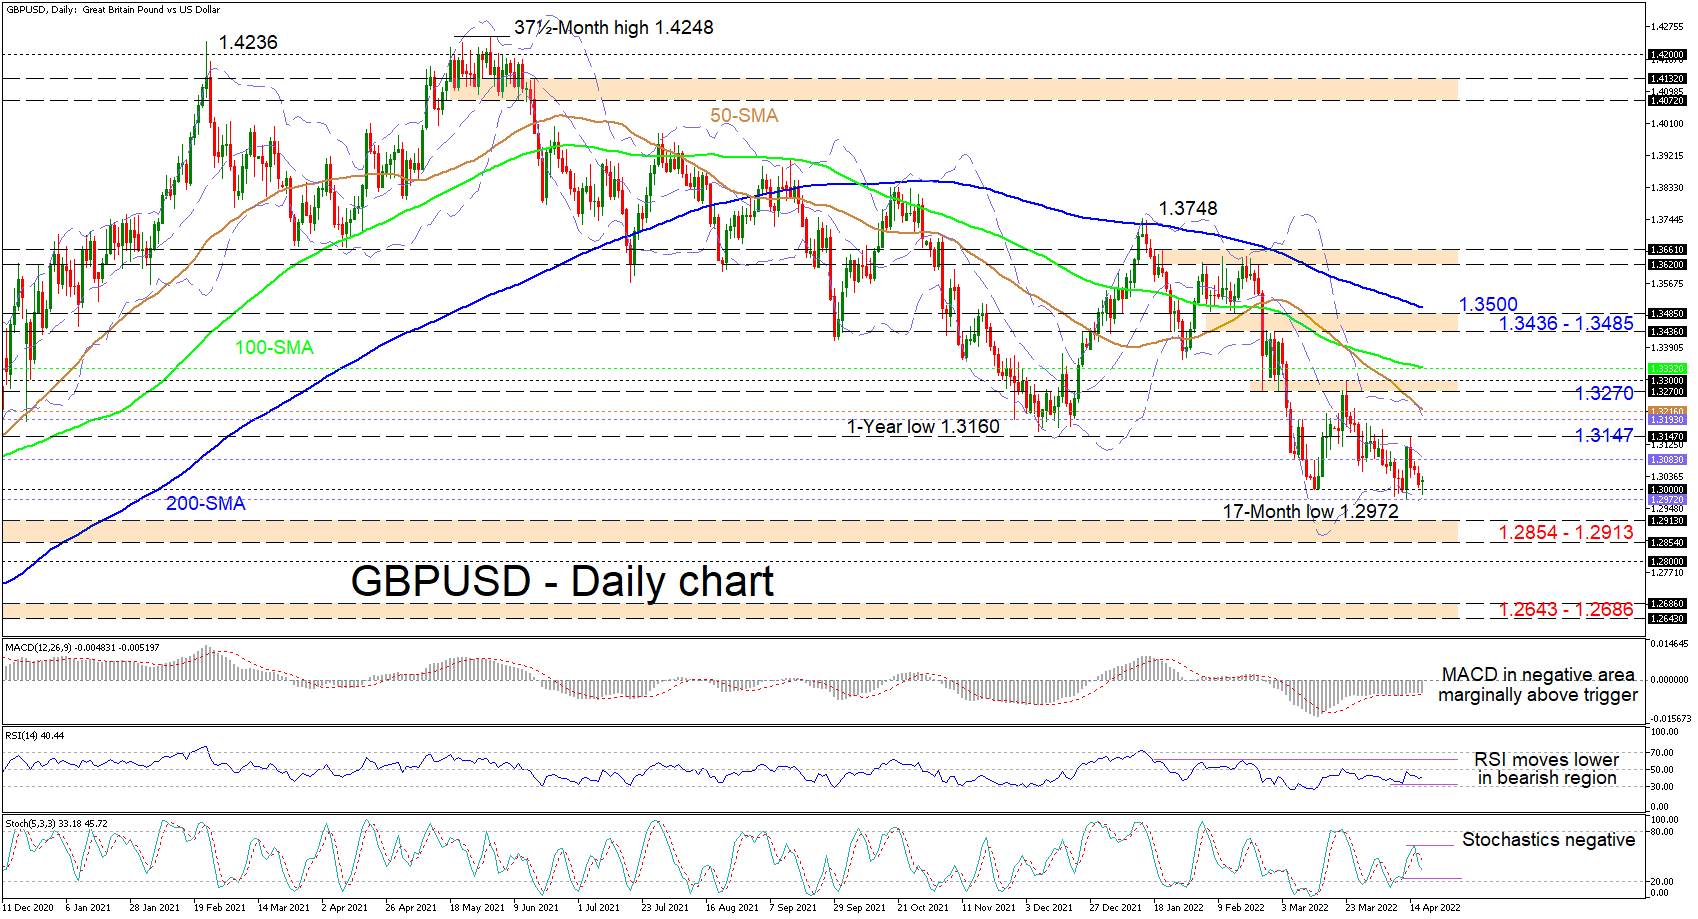
GBPUSD continues to tackle the 1.3000 barrier, which has proven to be more durable, holding strong since mid-March. That said, the falling simple moving averages (SMAs) are endorsing the descent, and appear to be reinforcing bearish defences, which are dampening bullish prospects in the pair.
Moreover, negative momentum has yet to show signs of significant waning, something also being reflected in the short-term oscillators, which are skewed to the downside. The uptick in the RSI, which is in the bearish region has yet to become convincing, while the stochastic oscillator is exhibiting a strong negative charge. The MACD, is in the negative region and a tad above its red trigger line but is showing no dwindling in bearish impetus.
For the descent to resume, sellers would need to drive the price below the 1.3000 mark as well as the 17-month low of 1.2972 and the adjoining lower Bollinger band in its vicinity. Subsequently, the bears could then meet the next downward limitations at the 1.2854-1.2913 support border, moulded by the troughs from October until early November 2020. Successfully diving past this too, the 1.2800 handle may try to delay a deeper drop aimed at the critical 1.2643-1.2686 support border, which extends back to mid-June 2020.
Alternatively, if sellers fail to overwhelm the 1.3000 level, upside impetus could face initial resistance at the mid-Bollinger band at 1.3083 ahead of the 1.3147 high. Another leg higher, the upper Bollinger band at 1.3193, coupled with the descending 50-day SMA at 1.3216, could prevent buyers from stretching towards the 1.3270-1.3300 resistance band. However, if buying interest endures and overpowers the neighbouring 100-day SMA at 1.3332, the bulls may then propel for the 1.3436-1.3485 boundary.
Summarizing, GBPUSD is sustaining a bearish bias below the SMAs and the 1.3270-1.3300 barrier. A dive in the price extending beyond the 1.2854-1.2913 support band could reinforce negative pressures. Yet, for significant optimism to return in the pair, the price would need to lift past the 1.3436-1.3485 obstacle.
Crude Oil and Natural Gas Prices Rally as Supply Concerns Remain
US stocks rose slightly on Monday as investors reflected on the ongoing earnings season. Results published on Monday were mixed. Bank of America, one of the US megabanks, said that its total revenue increased by 2% to $23.2 billion in the first quarter. This increase was helped by a 13% increase in net interest income as loans grew by 8%. These results were in line with what most analysts were expecting. Meanwhile, Schwab said that its net income declined by 6% to $1.4 billion while its adjusted earnings per share declined by 8% to 77 cents. The company attributed the weak results to a challenging environment. Last week, Citigroup and JP Morgan published weak results as well.
The US dollar index maintained its bullish trend even after the weak homebuilder confidence. According to the National Association of Home Builders, the housing market index declined by 2 points to 77 in April. The index sits slightly higher than where it was before the pandemic started. Most homebuilders complained about the rising mortgage rates, which recently hit 5%, the highest point in a decade. The ongoing supply chain issues have also dragged production costs in the past few months. The US dollar will react to the latest US building permits and housing starts data.
The price of crude oil rose on Monday and Tuesday morning even after mixed economic data from China. According to the National Bureau of Statistics (NBS), the country’s economy expanded by 1.3% on a quarter-on-quarter basis and by 4.8% in a year-on-year basis. These numbers were better than the median estimates of 0.6% and 4.4%. However, there are signs that the country’s Covid strategy was hurting growth. For example, retail sales declined by 3.5% in March. Therefore, investors expect that oil demand will slow in the coming months since China is the biggest consumer of oil.
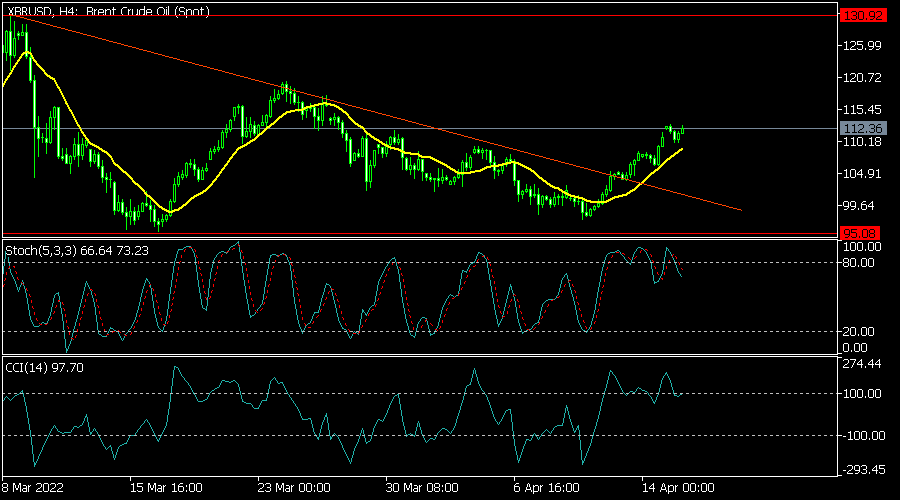
XBRUSD
The XBRUSD pair rose to a high of 112.27, which was the highest level since Friday. On the four-hour chart, the pair moved above the descending trendline shown in red. The pair has also invalidated the descending triangle pattern shown in red. It also moved slightly above the 25-day and 50-day moving averages while the Commodity Channel Index (CCI) has been rising. Therefore, there is a likelihood that the pair will keep rising as the EU considers banning Russian oil.
EURUSD
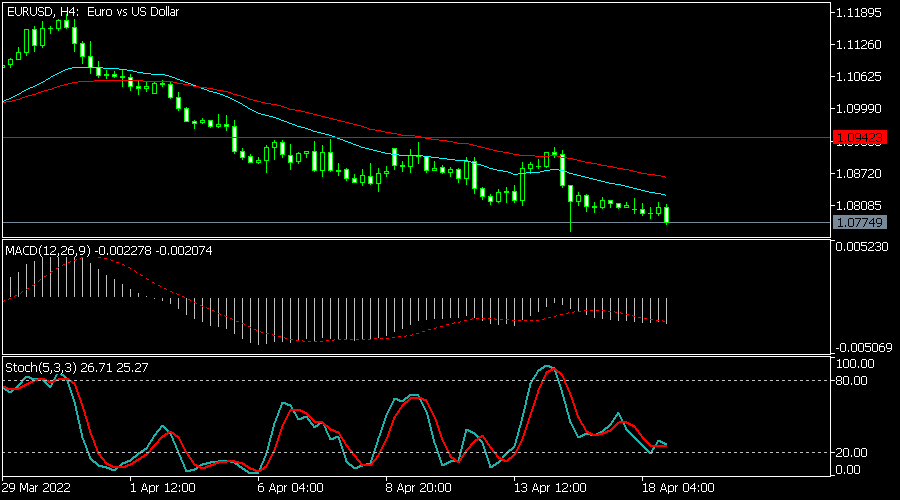
The EURUSD pair continued its bearish trend as the euro sell-off continued. The pair declined to a low of 1.0775, which was the lowest level since Thursday last week. It has moved slightly below the 25-day and 50-day moving averages while the MACD has moved below the neutral level. The Stochastic oscillator moved below the oversold level. Therefore, the pair will likely keep falling as bears target the support at 1.0700.
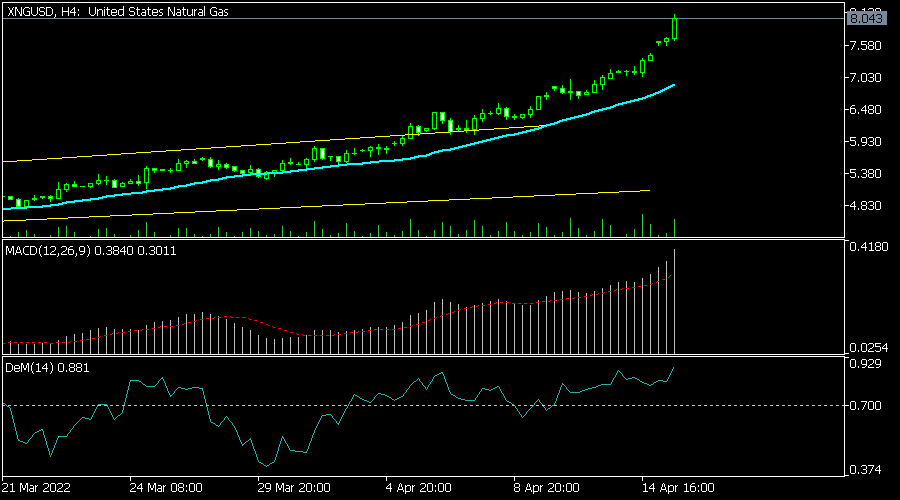
XNGUSD
The XNGUSD pair jumped to a high of 8.04, which was substantially higher than the lowest level this year. It has moved above the short and long-term moving averages while the DeMarker and MACD have kept rising. Therefore, the pair will likely keep rising as bulls target the resistance at 8.50.