Sample Category Title
Eurozone industrial production flat in Jan, EU rose 0.4% mom
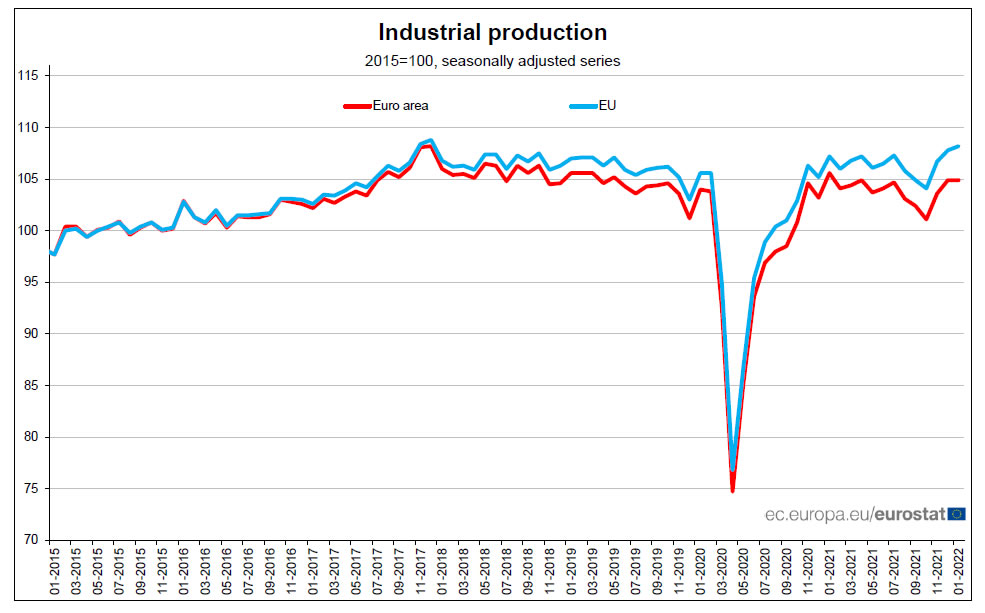
Eurozone industrial production rose 0.0% mom in January, below expectation of 0.4% mom. Production of non-durable consumer goods rose by 3.1%, while production of intermediate goods and energy both fell by -0.3%, durable consumer goods by -0.5% and capital goods by -2.4%.
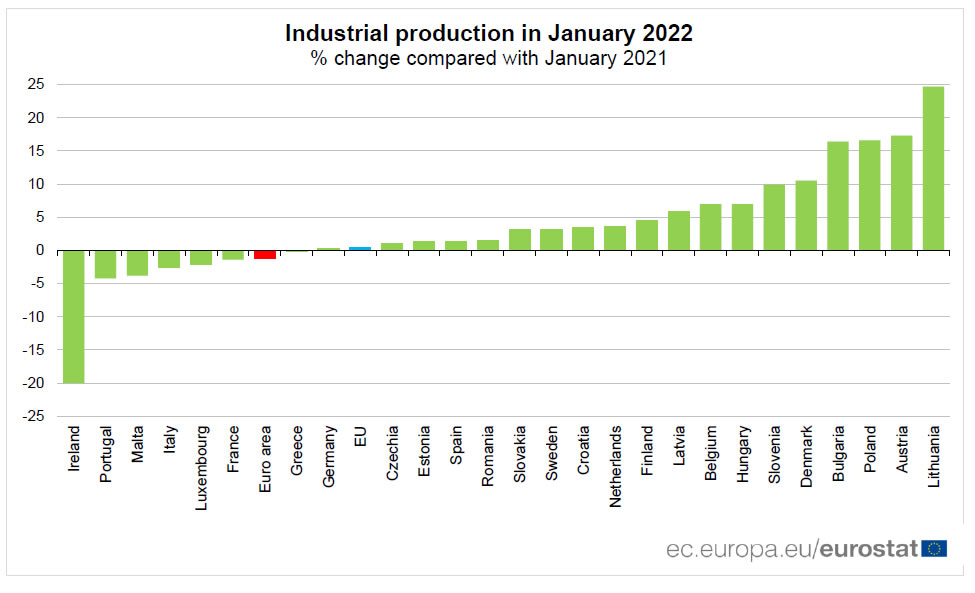
EU industrial production rose 0.4% mom. Among Member States for which data are available, the largest monthly increases were registered in Austria (+6.2%), Czechia (+3.1%) and Poland (+3.0%). The highest decreases were observed in Estonia (-6.1%), Portugal (-5.0%) and Greece (-4.1%).
Gold Extends Pullback on a Dash of Optimism Over Ukraine and Expected Fed Rate Hike
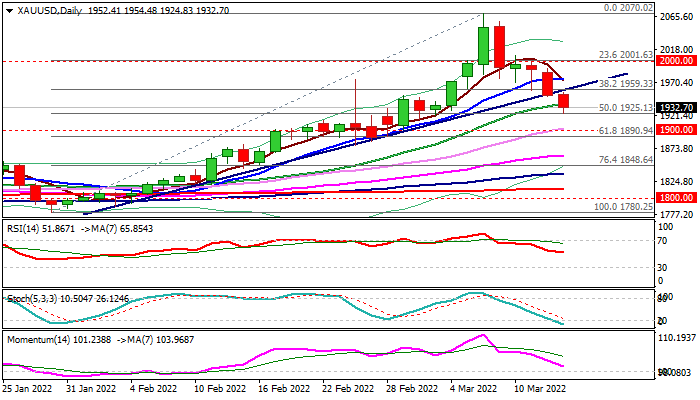
Spot gold continues to trend lower and extend pullback from last week’s high at $2070 to the lowest in nearly two weeks in early European session on Tuesday.
Fresh optimism about ceasefire talks in Ukraine, although the latest round of negotiations did not give expected results, offsets fears of further escalation of the conflict.
The yellow metal is also weighed down by expectations for Fed rate hike, as today the US central bank starts its two-day policy meeting.
Markets widely expect raise of interest rates by 0.25%, for the first time since pandemic, though the number of those who expect more aggressive action and 0.5% hike, continues to rise, with such scenario, expected to increase the headwinds to the yellow metal.
Technical studies on daily chart continue to weaken and support the notion of deeper pullback that would also confirm another false break above $2000 level, after the action in Aug 2020.
Monday’s close below pivotal Fibo support at $1959 (38.2% of $1780/$2070 upleg) generated bearish signal, with strong loss of bullish momentum, adding to negative outlook.
Bears cracked 50% retracement of $1780/$2070 ($1925) with break here to risk dip towards $1900 (round-figure) and $1890 (Fibo 61.8%).
Broken Fibo support at $1959 marks solid resistance, followed by 10 DMA ($1974) and repeated daily close below $1959 is needed to confirm negative signal and keep bears in play.
Res: 1954; 1959; 1974; 1990
Sup: 1925; 1914; 1900; 1890
Market Sentiment Sours Amid Ongoing Geopolitical Risks
Asian stocks were painted red on Tuesday morning as continuing geopolitical risks and surging Covid-19 cases in China dealt another blow to risk appetite. In the currency space, the dollar got off to a shaky start despite the rise in Treasury yields while gold extended losses, sinking closer to $1900. Also falling are WTI oil prices which fell below $100 as China imposed lockdowns in key cities. European futures are pointing to a negative open as hopes fade over a ceasefire in Ukraine, with risk-off sentiment potentially trickling back to Wall Street which ended mostly lower Monday.
A sense of caution continues to shroud financial markets due to ongoing geopolitical tensions, rising Covid-19 cases in China, inflation fears, and looming U.S monetary policy tightening. Earlier this morning, data from China exceeded market expectations but this failed to shake off the jitters and overall gloom. This could be the theme this week as the current themes overshadow economic data. With investors likely to maintain a defensive stance towards riskier assets ahead of the Federal Reserve meeting on Wednesday, equity markets could be in store for further punishment. The S&P500 remains under pressure and has shed over 4.5% this month. A solid daily close below 4150 could signal further downside, especially if risk-off remains the name of the game.
All eyes on the Federal Reserve Meeting
The main risk event this week will be the monetary policy decision from the Federal Reserve on Wednesday. Markets widely expect the central bank to raise interest rates by 25-basis points as Federal Reserve Chair Jerome Powell recently signaled. It would be the first hike by the Fed since 2018.
Given how the conflict in Ukraine has left investors fearful over the global growth outlook, the policy path beyond March may be clouded by the fog of war. Much attention will be directed towards the economic projections (“dot plot”) and press conference for fresh clarity on future rate hikes. With US inflation hitting a new 40-year high at 7.9% in February, the Fed remains entangled in a fierce battle against rising prices. It will be interesting to hear Powell’s thoughts on recent events and how the Fed plans to navigate through this current storm.
The dollar may appreciate if the Fed adopts an aggressive approach towards higher interest rates despite ongoing geopolitical risks. Should the central bank strike a more cautious tone and economic forecasts are downgraded, this could result in dollar weakness.
Oil prices extend selloff
Oil benchmarks were under pressure this morning with WTI dipping below $100 as investors evaluated demand risks from China’s imposed lockdowns and the Ukraine-Russia ceasefire talks.
The global commodity is likely to remain sensitive to geopolitical risks and supply-side factors, especially as Russia’s oil imports are banned further. It may be wise to keep a close eye on the Energy Information Administration (EIA) report published on Wednesday. Another weekly drawdown in crude inventories could limit downside losses for oil.
Commodity spotlight - Gold
Gold stumbled into Tuesday’s session under renewed pressure as Treasury yields rose ahead of an expected rate hike by the Federal Reserve.
While heightened geopolitical risks and overall uncertainty have recently accelerated the flight to safety, the prospect of the Federal Reserve raising interest rates could result in further losses. Given how prices have dropped almost $70 since last Friday, the path of least resistance points south in the short term.
Ultimately, where gold concludes this week will be heavily influenced by the outcome of the Fed meeting, movements in bond markets, and ongoing geopolitical tensions.
China Data Surprises, But Can’t Change Sentiment
China has just released an excellent set of tier-1 data points, with Industrial Production (+7.50%), Retail Sales (+6.70%), and Fixed Asset Investment (+12.20%), blowing market expectations out of the water. Although the data covered both January and February, the data is all the more impressive as the government had imposed quite vigorous movement restrictions over the Chinese New Year. Unsurprisingly, given the strength of the data, China left if 1-year medium-term lending facility (MLF) unchanged at 2.85% today, although after the rollover, there was a net injection of CNY 100 bio.
That hasn’t helped Chinese stock markets though, which are down sharply again today, after a rout yesterday. There are plenty of storms blowing through China right now, not least the lockdown of Shenzhen yesterday to limit omicron’s spread. Cases are still rising in China and Shanghai is also subject to tactical lockdowns within the city. Fears continue to dog stock markets that lockdowns could spread, which would severely impact China’s growth.
The tech sell-off continues unabated after the Nasdaq suffered disproportionately over, with China ADRs on their knees anyway over sanctions and delisting fears if China starts supporting Russia, either by sanction avoidance or military hardware sales. China’s quandary is weighing on sentiment. China is ideologically aligned with Russia from a geopolitical perspective but makes most of its money by selling goods to the west. It will be interesting to see which talks loudest.
Concerns around further shared prosperity clampdowns, fines and property sector leverage and credit worthiness persist. I have warned previously about trying to catch a falling knife on these fronts, so I won’t repeat myself. Although the data was positive, there does appear to be some concerns about the forward outlook from Beijing. That is most notably manifested in the recent countercyclical adjustments made to the PBOC USD/CNY fixing this week. The last three fixings (including today), have featured a much weaker than expected yuan, pushing USD/CNY up to 6.3750, and USD/CNH to 6.3925. The long bull market on yuan seems to be drawing to a close as China goes down the tried and tested route of making exports cheaper. That will not bode well for other Asian currencies, which also face a Federal Reserve rate hike this week.
Commodities slide on Ukraine hopes
On the Ukraine-Russia front, the continuation of talks has seen carnage in the commodity space as base metal prices and energy prices plunged. Platinum fell by over 15% overnight. Nickel trading reopens on the LME tomorrow I believe, and it will be interesting to see if the mother of all short squeezes abates there as well. Markets are desperately in search of good news and are pricing in that the talks will lead to a negotiated settlement. I really hope that is correct on a personal basis, but I have seen zero concrete progress from them, and Vladimir Putin’s handshake or signature on a document doesn’t inspire me confidence, and I defiantly would accept a cup of tea. If this is a false dawn, the reversal higher in commodity prices is going to be ugly, very ugly.
In the US, markets are suddenly waking up to the fact that the FOMC will hike this week, and likely signal a long series of hikes going forwards. US yields across the curve shifted higher in unison, notably in the long-dated tenors. The process has been aided by a reduction in haven flows as markets price in peak-Ukraine. Those reduced flows into US bonds likely reduced US dollar demand as well, explaining why it held mostly steady even as yields rose.
Stock markets saw a distinct rotation from value to growth, or to cut through the financial market-speak, they sold massively over-priced technology companies and bought companies that make tangible stuff people can touch. This is another reason why China markets, notably Hong Kong, are having a very bad day.
How far this rotation will go, or how far stocks still have to go, will be very dependent on how hawkish the FOMC is on Thursday (Asian time). But behind the FOMC and Ukraine hopes, other forces will remain at work, notably the stagflationary wave caused by the conflict. The Bank of Japan and Japan government officials are clearly saying they have no intention of changing loose monetary policy and are looking at a Ukraine-derived stimulus package. You can be sure that much of Asia will choose the same path, tolerating inflation to keep growth at least unchanged. The sharp divergence in monetary paths across the world signals Asian currency weakness ahead, especially if China has called time on the yuan rally. An environment of price input shocks and declining growth won’t be good for equities either, growth or value.
Nasdaq 100 Retreats, Dow Jones Rises as Sector Rotation Continues
American stocks were mixed on Monday as the crisis in Ukraine escalated, and the Fed decision neared. Dow Jones rose by more than 200 points while the S&P 500 index rose slightly. The tech-heavy Nasdaq 100 index dropped by more than 100 points. Analysts expect that companies will continue facing significant margin pressures in the coming months as the cost of raw materials and shipping continues to escalate. In a statement, Elon Musk said that Tesla and SpaceX have already started feeling the pain of rising prices.
The US dollar was relatively muted in the Asian session as investors waited for the upcoming producer price index (PPI). This is an important gauge of inflation among producers and a lagging indicator of future consumer prices. Economists expect the headline CPI dropped slightly from 1.0% to 0.9% in January. On a year-on-year basis, they see the PPI rising to about 9.7%. These numbers will come a few days after the Bureau of Labor Statistics published strong consumer inflation numbers. The Fed will start its March meeting later today.
There will be several important economic numbers scheduled later today. In the UK, the Office of National Statistics will publish the latest UK jobs data. Economists expect the numbers to reveal that the UK unemployment rate fell to about 4.0% in January. If they are accurate, it will be the lowest figure since the pandemic started. In Switzerland, the statistics agency will release the latest producer price index (PPI) data while the American Petroleum Institute will publish inventory data.
EURUSD
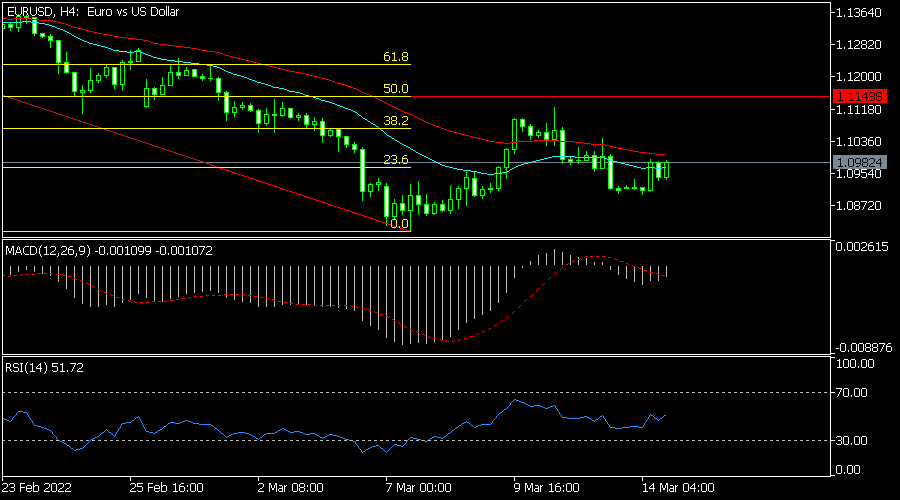
The EURUSD remained in a consolidation mode on Tuesday morning as focus remains on the Fed. It is trading at 1.0977, which was slightly above this week’s low of 1.0900. On the four-hour chart, the pair is slightly above the 23.6% Fibonacci retracement level. It is also oscillating around the 25-day and 50-day moving averages while the MACD and the RSI are at a neutral level. Therefore, the pair will likely remain in this range today.
USDCHF
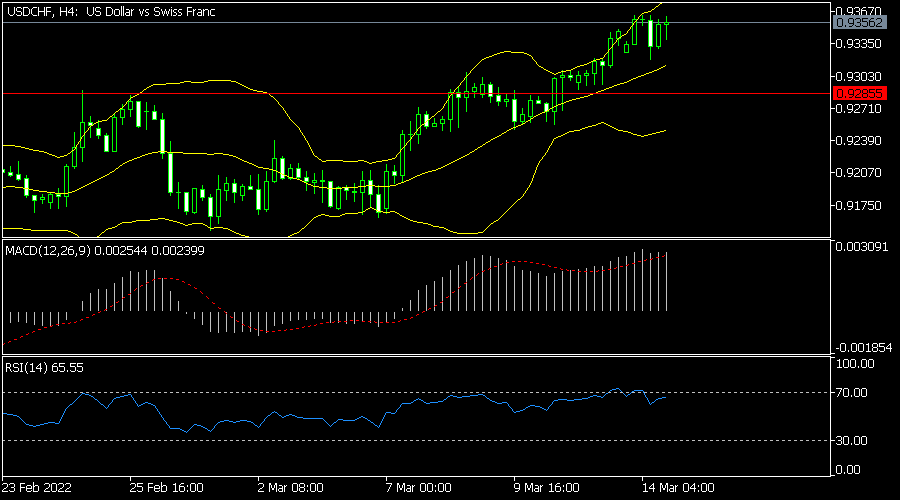
The USDCHF pair maintained its bullish trend ahead of the Swiss PPI data. It rose to a high of 0.9360, which was the highest point in months. It is along the upper side of the Bollinger Bands while the pair remains above the 25-day and 50-day moving averages. The RSI and MACD have been in an upward trend. Therefore, the pair will likely keep rising as bulls target the next important resistance at 0.9400.
EURJPY
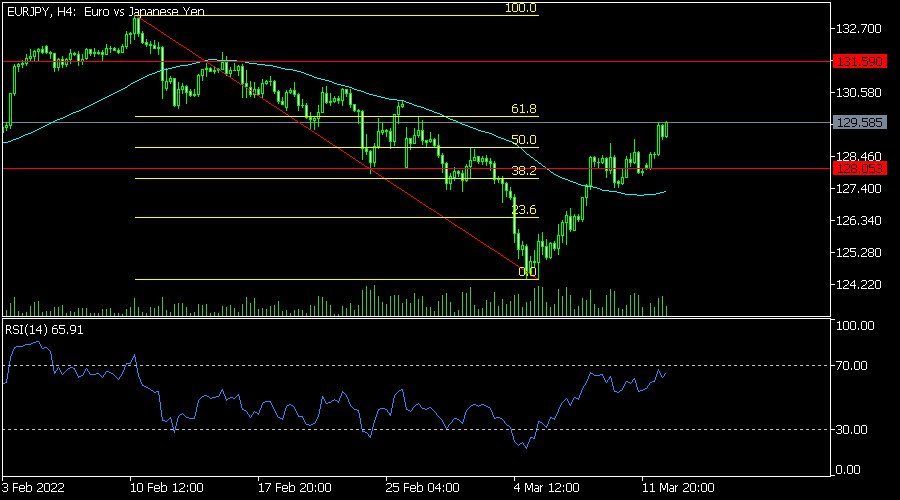
The EURJPY pair crashed hard last week after the hawkish ECB decision. It landed at a low of 124.31. The pair has rebounded and is currently trading at 129.57, which was the highest point since February 28. It has risen above the 25-day MA and is approaching the 61.8% Fibonacci retracement level. The Relative Strength Index (RSI) has moved close to its overbought level. Therefore, the pair will likely keep rising in the coming days.
GBPUSD Holds Near 16-Month Low of 1.3000
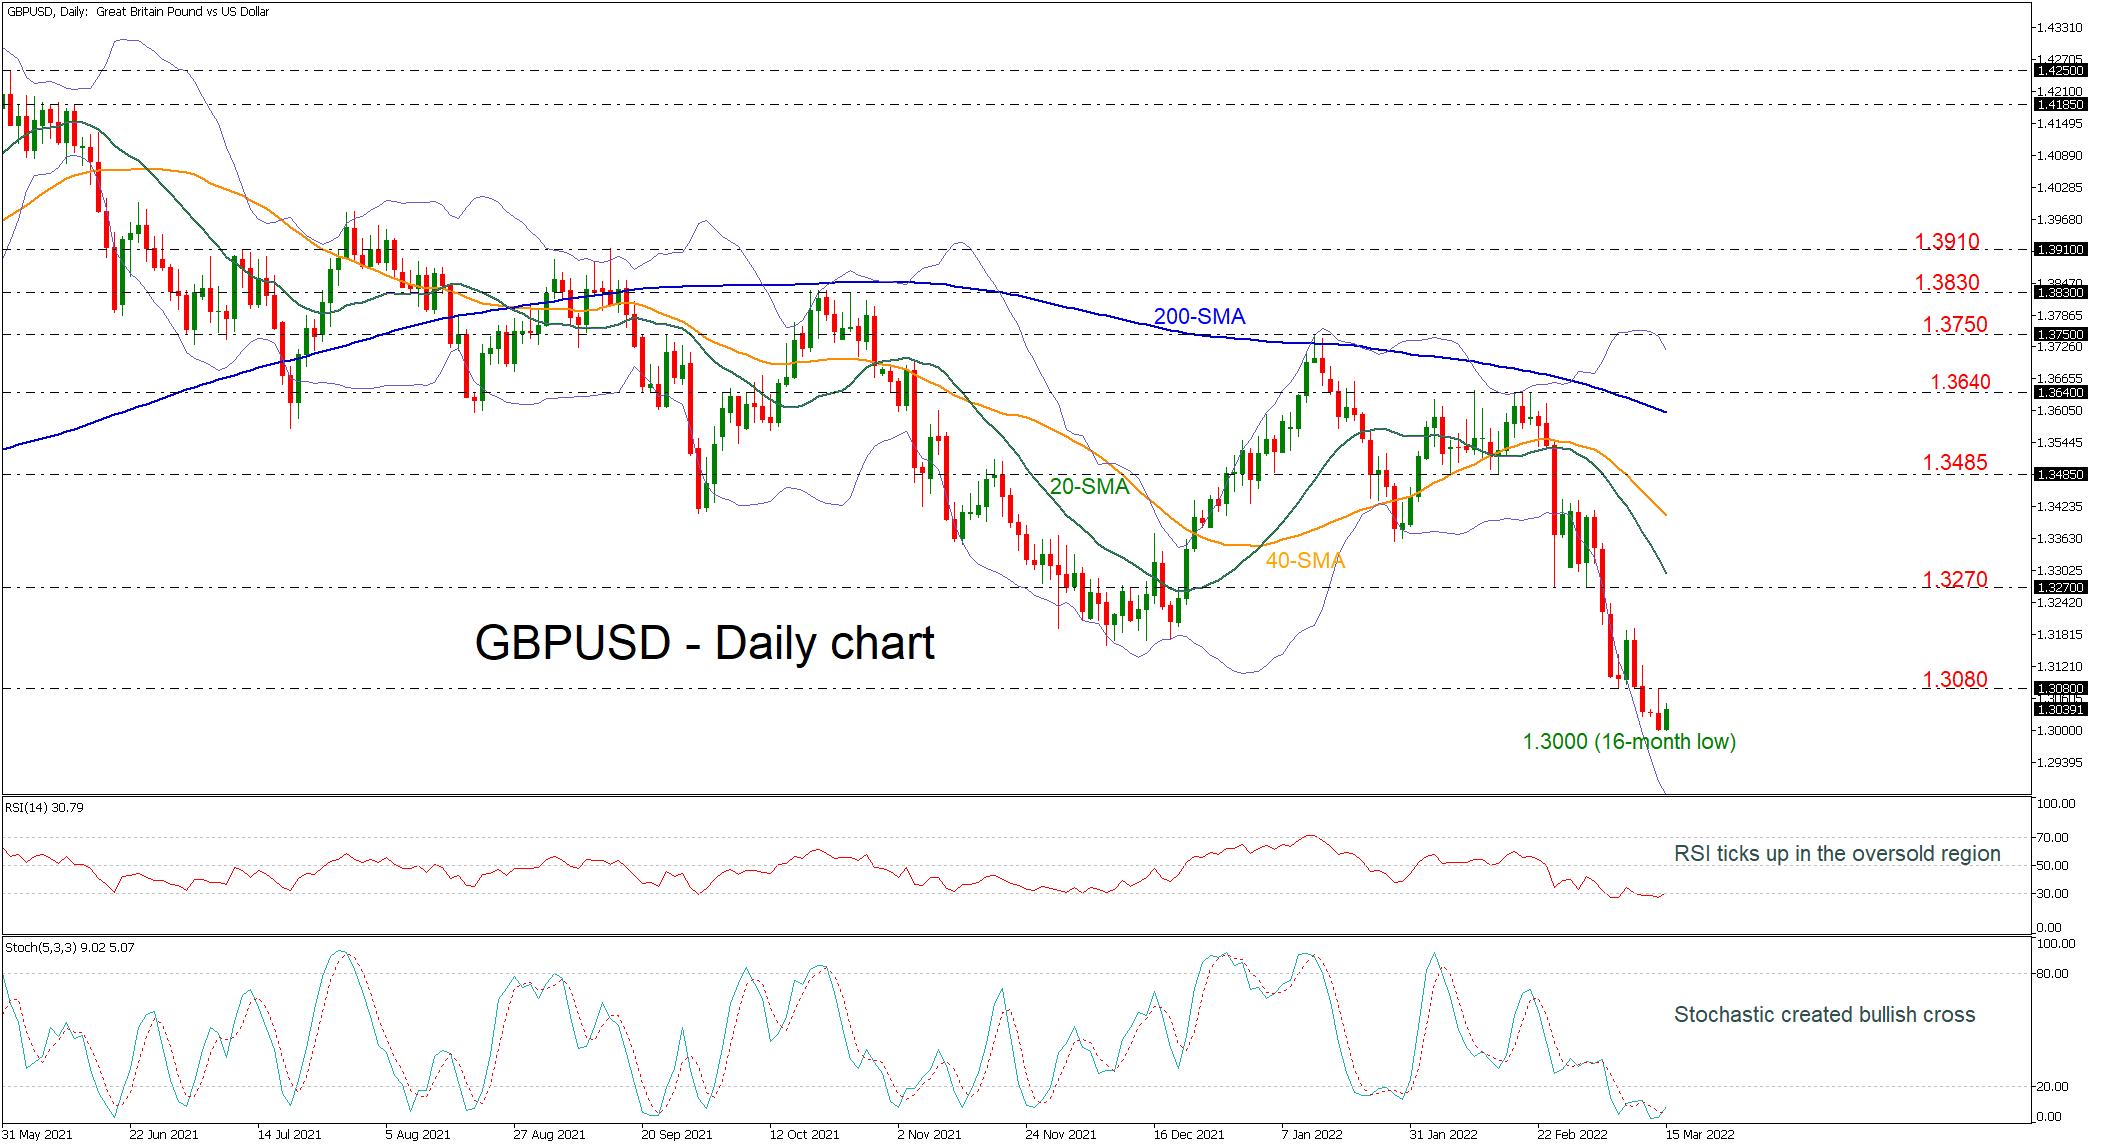
GBPUSD is posting a selling interest move, testing the 1.3000 psychological level, which is a fresh 16-month low. The RSI indicator is pointing upwards in the oversold zone, while the stochastic oscillator created a bullish crossover within its %K and %D lines below the 20 level. Both are suggesting that the bearish mode has come to an end and the next move may be to the upside.
If the price recovers and returns above the 1.3080 resistance, the next target could be the 1.3270 resistance and the 20-day simple moving average (SMA) at 1.3295. Surpassing these lines, the 40-day SMA at 1.3410 and the 1.3485 may act as crucial restrictive levels for the bulls.
If sellers take the upper hand again and declines below the 1.3000, the next support level could come from the 1.2850 hurdle, taken from the lows in November 2020. Even lower, the market could have a pause near 1.2670, registered in September 2020.
All in all, GBPUSD has been in a falling move since May 2021 but any advances beyond the 200-day SMA may switch this outlook to neutral.
Daily Technical Analysis
EUR/USD
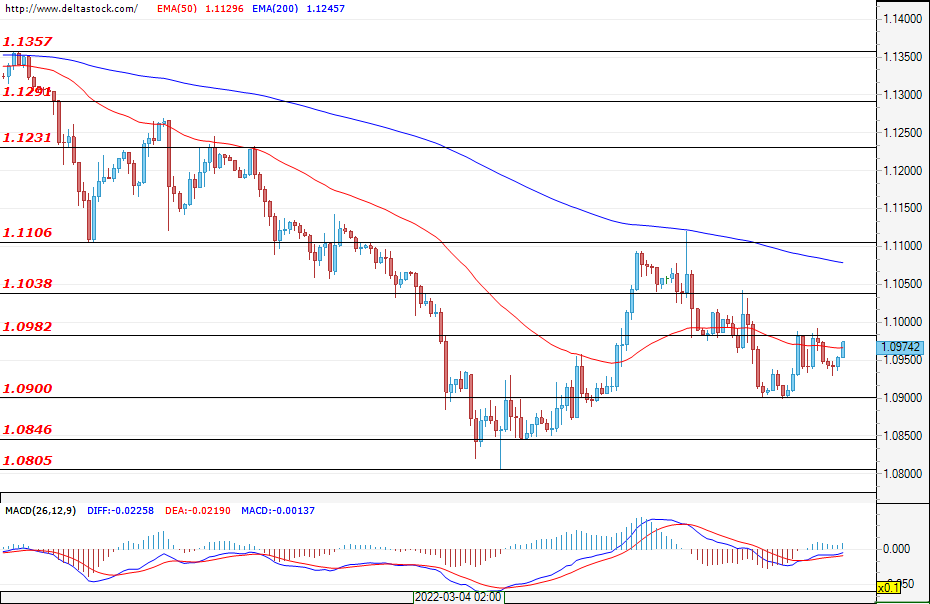
There is a slowdown in the downtrend as the bears failed to secure a lower bottom and the pair managed to stay above the support at 1.0900. The first resistance before the buyers is 1.0982, and after two unsuccessful attempts, it is about to be breached. In such a scenario, prices could rise towards 1.1038. Sentiment has not yet turned positive as for that to happen, prices would have to stay above the resistance at 1.1106. The bears can expect better attack levels around this area, and in case of new declines, a test and a breach of the support at 1.0846 is possible. In such a scenario, the euro could plunge towards levels of around 1.0640. Today, higher volatility can be expected around the publication of the ZEW data on economic expectations (10:00 GMT) and that of the U.S. PPI (12:30 GMT).
USD/JPY
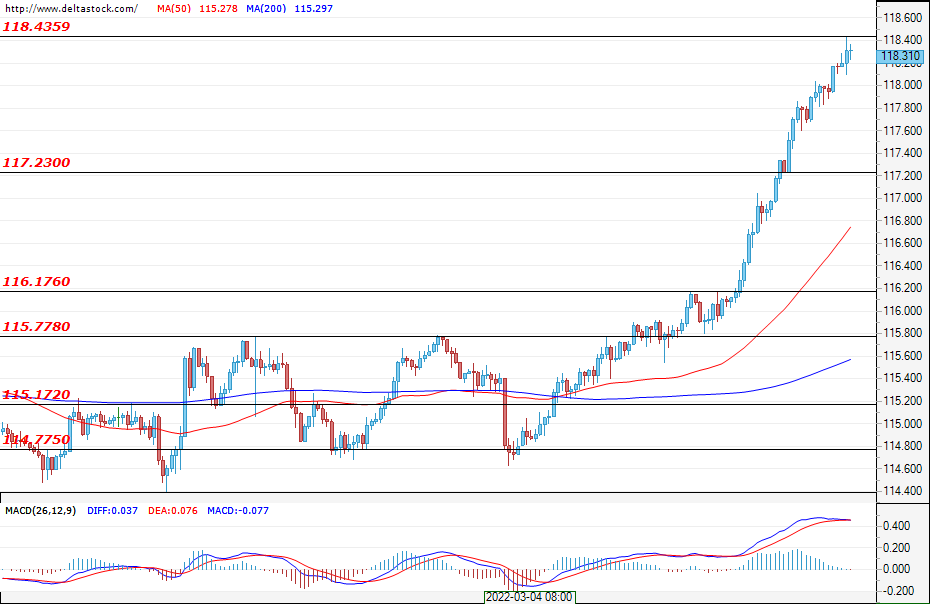
In the last few sessions, the pair has seen strong growth, overcoming several resistances along the way. The rally has not yet entered a corrective phase and the expectations are for it to continue. The first support is the area around the weekly opening at 117.23. The first resistance is yesterday's high at 118.43, with growth likely slowing due to market overcrowding. Looking at the highest time frames reveals that there is significant resistance around 118.60. The market is thus expected to enter a corrective phase when this level is reached.
USD/CHF
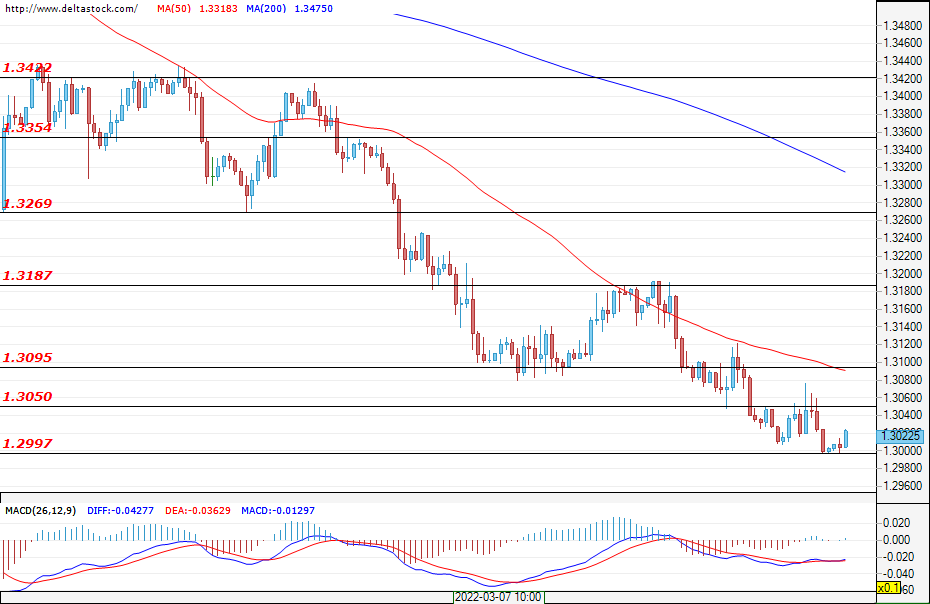
The Cable continues its downward trend, with any declines currently being limited by the support at 1.3000. Bearish attacks are becoming less frequent and it is possible that the market will enter a more complex correction or reverse the movement as a result. The first resistance for the bulls is the area at around 1.3050, and the next more serious obstacle is 1.3095. If this zone is breached and prices manage to stay above it, then a rally towards 1.3190 and even 1.3270 can be expected. A breach of 1.3190 would seriously increase the risk appetite of market participants, and depending on the fundamentals, the price movement may reverse its direction. If the bears still manage to breach 1.3000, then the declines could worsen towards 1.2860.
EUGERMANY40
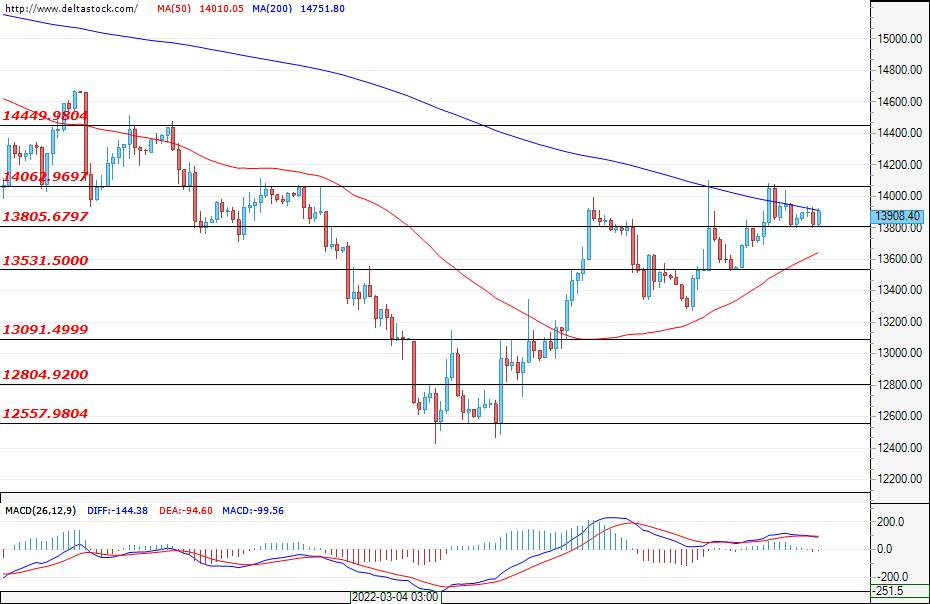
The German index started the week with gains and prices tested the resistance at around 14060. At the moment, the market is trading steadily over the local support of 13800 and has formed a range above this area, with the bulls possibly preparing for a new attack on 14060. If the attack is successful, then a rally towards 14450 can be expected. In the event of new market turmoil, however, the bears may plunge prices back towards 13530 or the area above 13090.
US30
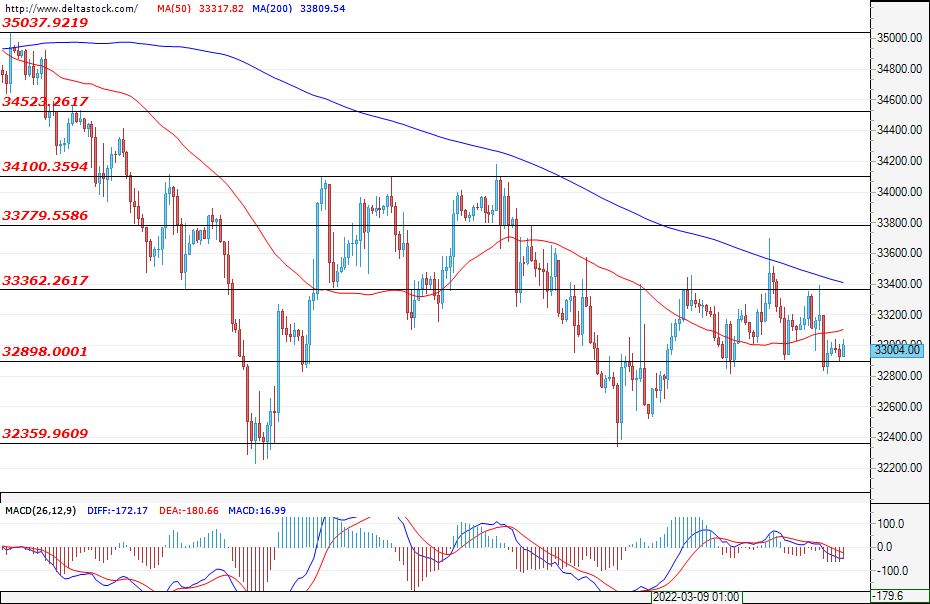
In recent days, the U.S. blue chips have traded in a range with 32900 as support and 33360 as resistance. The bulls are experiencing serious difficulties around this area and any rallies above it are being aggressively sold out. The index formed a double bottom at the 32360 support, but the desired response to this configuration is yet to be seen. It is possible that the market will remain without a clear direction in the coming days due to the upcoming FOMC meeting. Sentiment remains mixed, with the 32360 support and the 34100 resistance being critical areas for the market. A breach of one of these areas would signal the direction of another sustained move.
Investors Again Scaling Up Normalization/Tightening Bets
Markets
US stock markets again failed to cling to opening gains, ending up to 2% lower for Nasdaq. The S&P 500 follows the two other major indices in painting a technical “death cross” on the charts (200d moving average < 50d moving average), suggesting more downside. The tech giant Nasdaq now entered bear market territory as the index is now more than 20% below the all-time high in November 2021.
The (US) stock sell-off again went hand-in-hand with sales in US Treasuries. This correlation suggests that runaway inflation and global (monetary) policy normalization are firmly back in the driver’s seat as market theme. At the height of the Russian invasion, global core bonds briefly played their role as safe haven asset.
In the wake of last week’s ECB meeting and going into this week’s Fed and BoE gatherings, investors are again scaling up their normalization/tightening bets. US yields added 11.3 bps (2-yr) to 15 bps (7-yr) with the belly of the curve underperforming the wings. US yields reached multi-year highs at the 2-to-10 sector of the curve.
The German yield curve bear steepened with yields adding 6.5 bps (2-yr) to 12.3 bps (30-yr) higher. The German 10-yr yield set a new recovery high at 0.37%. Next technical resistance stands at 0.58%. Peripheral yield spreads remarkably kept stable.
The single currency slightly had the upper hand over the dollar and sterling. EUR/USD and EUR/GBP ended the day slightly firmer at respectively 1.0940 and 0.8415. Moves continue this morning. USD/JPY extends it’s race to the top with the pair closing above 118 for the first time since early 2017. Next high profile resistance at 118.66 is nearby. It’s the final big hurdle ahead of the 2015 top at 125.86. JPY is the stand-out loser in the normalization race, after being hit by the commodity rally at the height of the Russian war in Ukraine. EUR/CHF extends its rebound higher after briefly touching parity last week. EUR/CHF trades back above 1.03. CEE currencies enjoyed a huge relief rally.
Chinese assets remain in freefall this morning. Apart from new strict lockdowns and tougher regulation, they react disappointed as the PBOC refrained from easing monetary policy further (see below). The damage again remains confined to China.
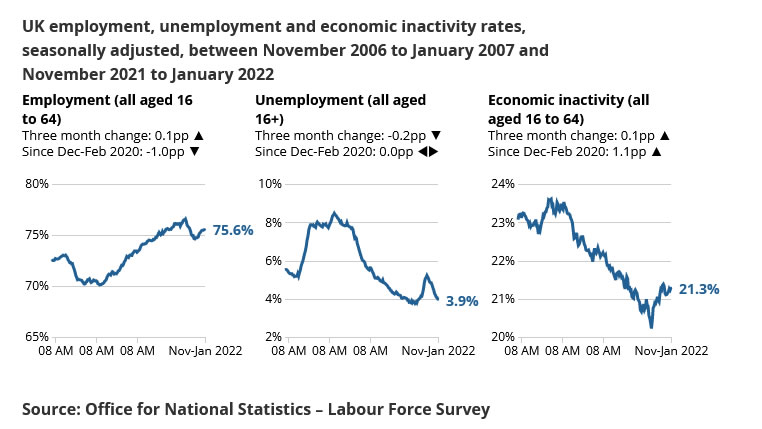
Today’s eco calendar contains US PPI data, empire manufacturing survey and EMU production figures. They won’t alter reigning trading dynamics ahead of the Fed meeting. UK labour market data printed strong this morning. Wage growth accelerated further with February payrolls suggesting renewed vigour for the labour market after some stabilization around the turn of the year. The unemployment rate slid further to 3.9% in the Nov-Jan period, the lowest since January 2020. The data strengthen the case for another BoE rate hike later this week.
News Headlines
The February Chinese economic update came in better than expected as government support started kicking in. Industrial production rose 7.5% vs 4% expected in the first two months of the year compared to the same period in 2021. Retail sales grew 6.7% YtD, beating the 3% consensus. Property investments defied expectations of a 7% decline to be up 3.7% and fixed assets investments jumped 12.2%. The strength of this month’s data may have been the reason for the PBOC to surprise markets and to not cut rates on the 1-yr lending facility this morning (2.85%). But downside risks loom large, ranging from the regulatory crackdown over the reintroduction of lockdowns to fall-out of the war (commodity prices). The data also highlight the ongoing housing market cooldown as residential property sales slump more than 22% YtD, adding to the economic risks. The Chinese yuan extends a recent losing streak to trade at the weakest level since the start of the year at USD/CNY 6.38.The EU agreed on a fourth package of sanctions against Russia after several days of heavy debating. Measures include banning the sale to Russia of luxury goods worth more than €300 and of luxury cars, boats and planes of more than €50 000, Bloomberg reported based on a draft. Purchases of many Russian steel and iron (finished) products will also be banned as well as new investments in Russian energy projects. There are exemptions included. For example, the new package does not target transactions needed for purchasing or transporting Russian fossil fuels nor are titanium, aluminum, copper, nickel, palladium and iron ore subject to the restrictions.
UK payrolled employees rose 275k in Feb, unemployment rate dropped to 3.9% in Jan
UK number of payrolled employees rose 275k in February. Comparing with prepandemic level in February 2020, number of payrolled employees was up 662k. Claimant count dropped -48.1k, versus expectation of 20.3k rise.
In the three months to January, unemployment rate dropped from 4.1% to 3.9% in the three months to January, better than expectation of 4.0%.
Average earnings including bonus rose 4.8% 3moy in January, above expectation of 4.6%. Average earnings excluding bonus rose 3.8% 3moy, also above expectation of 3.7%.
USDCAD Reacting Higher From The Blue Box Area
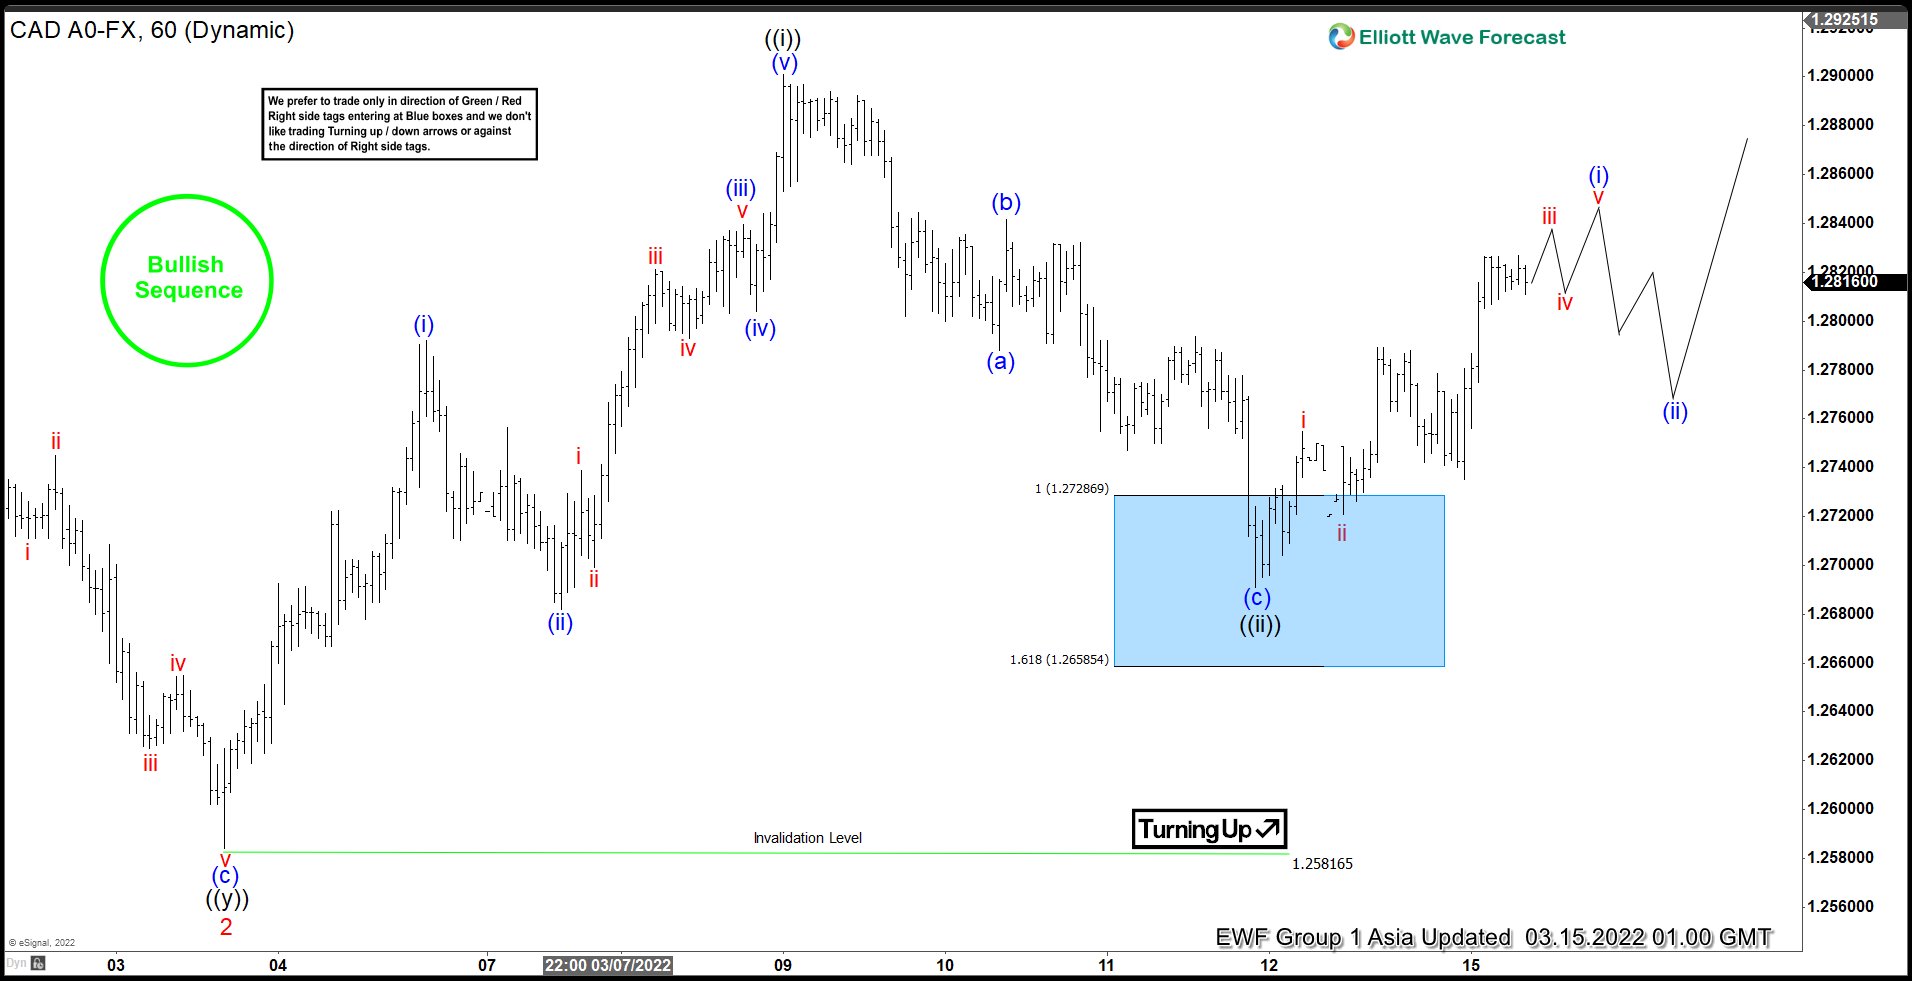
In this technical blog, we will look at the past performance of the 1-hour Elliott Wave Charts of USDCAD. In which, the rally from 03 March 2022 low unfolded as an impulse sequence and showed a higher high sequence with a bullish sequence stamp. Therefore, we knew that the structure in USDCAD is incomplete to the upside & should see more upside to complete the impulse sequence. So, we advised members not to sell the pair & buy the dips in 3, 7, or 11 swings at the blue box areas. We will explain the structure & forecast below:
USDCAD 1 Hour Elliott Wave Chart
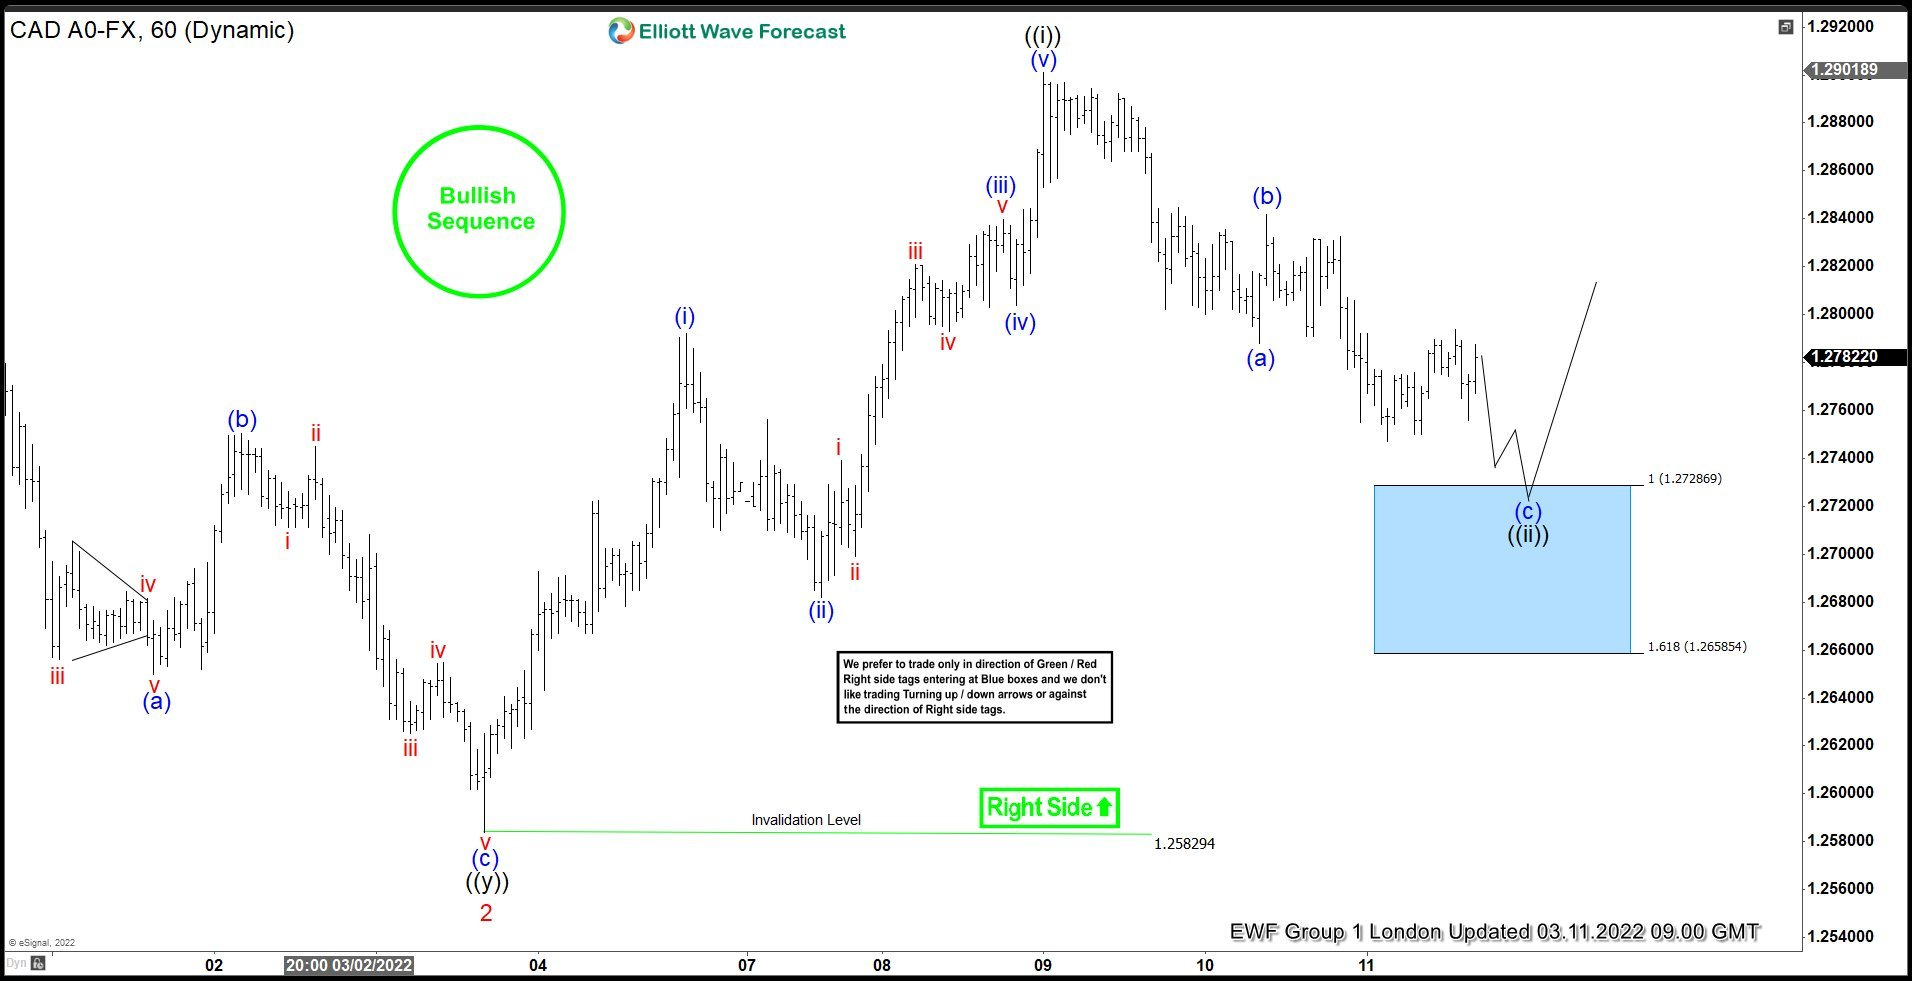
Here’s 1hr Elliott wave Chart from the 3/111/2022 London update. In which, the rally to $1.2901 high ended 5 waves from 3/03/2022 low in wave ((i)) & made a pullback in wave ((ii)). The internals of that pullback unfolded as Elliott wave zigzag correction where wave (a) ended at $1.2788 low. Then a bounce to $1.2841 high ended wave (b) & started the next leg lower in wave (c) towards $1.2728- $1.2658 blue box area. From there, buyers were expected to appear looking for new highs ideally or for a 3 wave bounce minimum.
USDCAD Latest 1 Hour Elliott Wave Chart