Sample Category Title
GBP/USD Daily Outlook
Daily Pivots: (S1) 1.2998; (P) 1.3044; (R1) 1.3087; More...
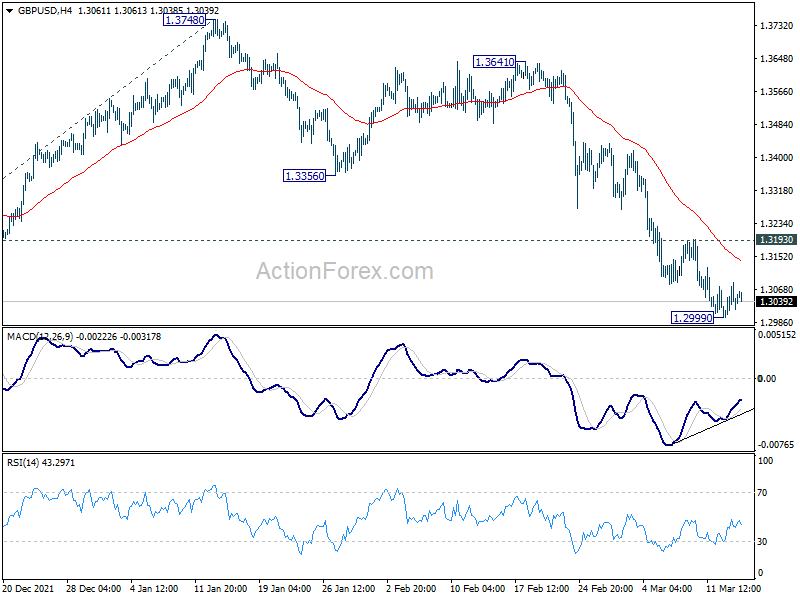
Intraday bias in GBP/USD remains neutral for consolidation above 1.2999 temporary low. Further decline is expected as long as 1.3193 resistance holds. On the downside, below 1.2999 will target 100% projection of 1.4248 to 1.3158 from 1.3748 at 1.2658 next. However, firm break of 1.3193 will indicate short term bottoming, and turn bias back to the upside for stronger rebound.
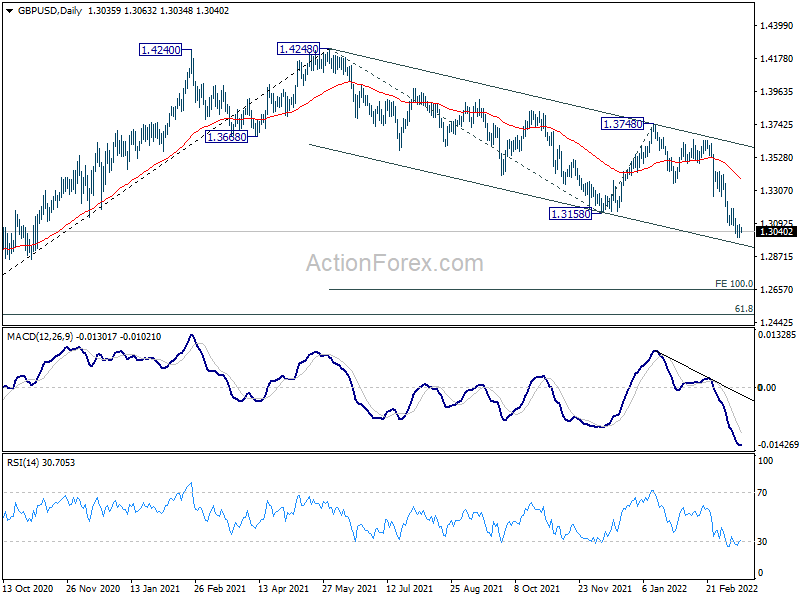
In the bigger picture, current development suggests that the up trend from 1.1409 (2020 low) has completed at 1.4248. Decline from 1.4248 could still be a corrective move, or it could be the start of a long term down trend. In either case, deeper decline would be seen back to 61.8% retracement of 2.1161 to 1.1409 at 1.2493. In any case, break of 1.3748 resistance is needed to indicate medium term bottoming, or outlook will stay bearish.
EUR/USD Daily Outlook
Daily Pivots: (S1) 1.0914; (P) 1.0967; (R1) 1.1008; More...
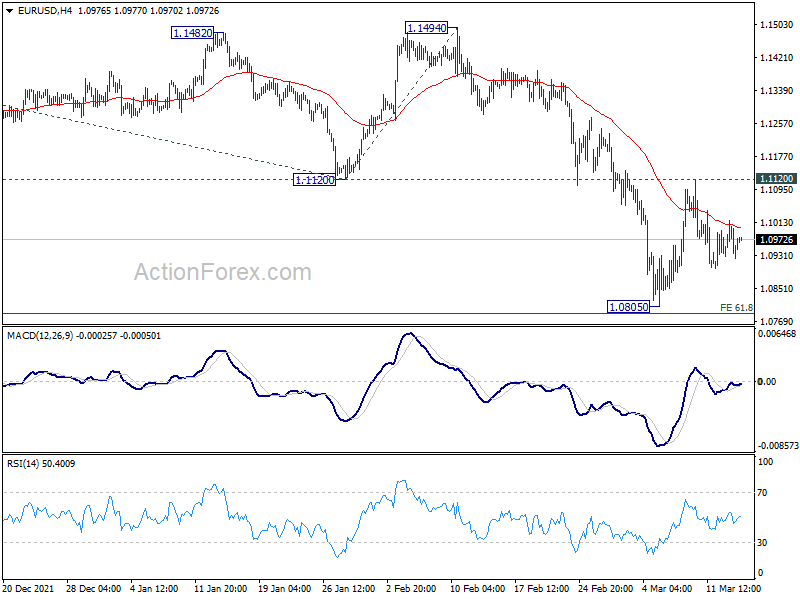
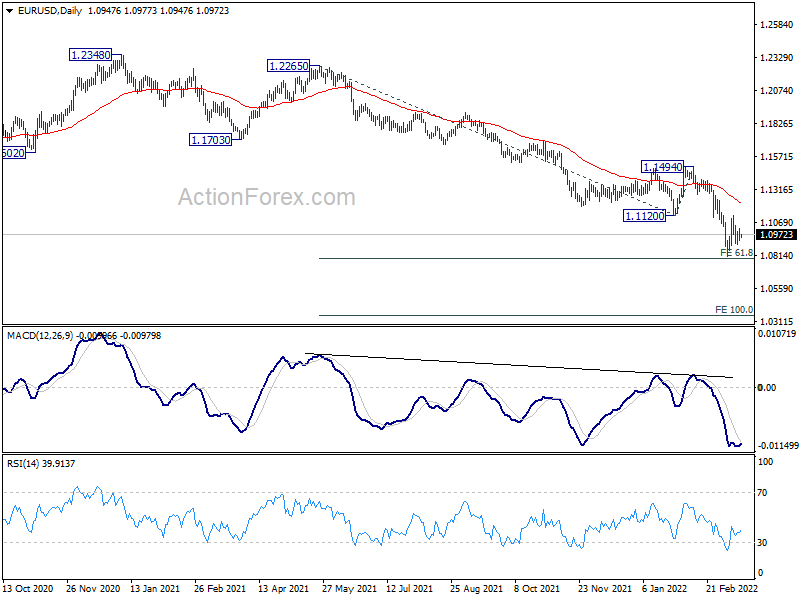
EUR/USD is still bounded in range of 1.0805/1120 and intraday bias remains neutral first. Further decline is still expected with 1.1120 support turned resistance intact. On the downside, firm break of 61.8% projection of 1.2265 to 1.1120 from 1.1494 at 1.0786 will pave they way to 100% projection at 1.0349 next. However, strong break of 1.1120 will confirm short term bottoming, at least, and bring stronger rebound back towards 1.1494 structural resistance instead.
In the bigger picture, the decline from 1.2348 (2021 high) is expected to continue as long as 1.1494 resistance holds. Firm break of 1.0635 (2020 low) will raise the chance of long term down trend resumption and target a retest on 1.0339 (2017 low) next. Nevertheless, break of 1.1494 will maintain medium term neutral outlook, and extend range trading first.
Dollar Consolidates as Markets Await FOMC Rate Hike and Projections
Dollar is digesting some of this week's gain as markets are awaiting FOMC rate hike and economic projections. There are a lot questions to be answered given the uncertainty over inflation and the economic impact of Russia invasion of Ukraine. As for today, Aussie and Euro are the stronger ones while Dollar and Yen are soft. But the picture could flip in any direction depending on the FOMC outcome.
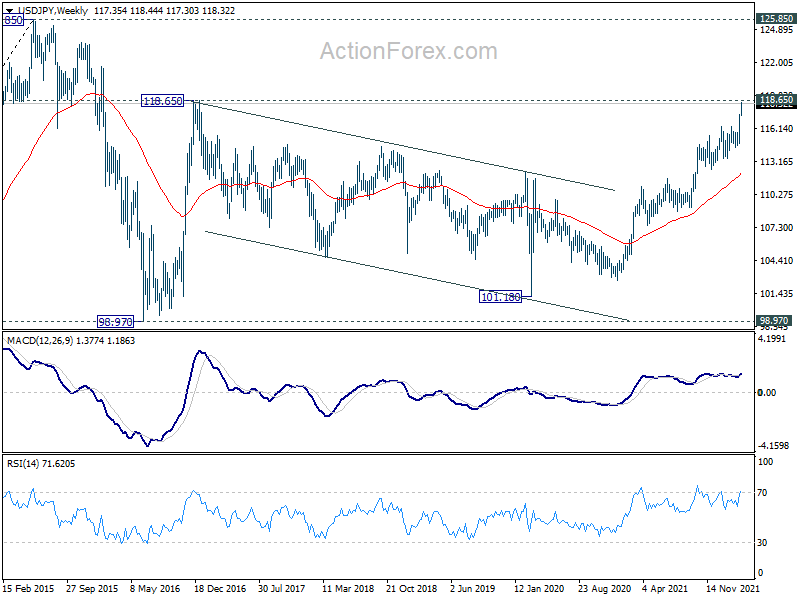
Technically, if Dollar is to show its muscle today, the first move should be a strong break of 118.65 long term resistance (2016 high) in USD/JPY. The second should be a decisive break of 1.0805 near term bottom in EUR/USD. We'll see if the greenback could do that to confirm it's strength.
In Asia, Nikkei closed up 1.64%. Hong Kong HSI is up 7.81%. China Shanghai SSE is up 3.41%. Singapore Strait Times is up 1.42%. Japan 10-year JGB yield is down -0.0053 at 0.205. Overnight, DOW rose 1.82%. S&P 500 rose 2.14%. NASDAQ rose 2.92%. 10-year yield rose 0.020 to 2.160.
ECB Lagarde: Russia-Ukraine war lowers and raises inflation
ECB President Christine Lagarde said in a speech that the Russia-Ukraine war would "lower growth and raise inflation through higher energy and commodity prices, the disruption of international trade and weaker confidence". But the baseline scenario is still for the economy to "grow robustly in 2022".
However, "uncertainty surrounding the outlook had increased significantly", policy makers are looking at two alternative scenarios that " growth could be dampened significantly and inflation could be considerably higher in the near term". Still, "in all scenarios, inflation is still expected to decrease progressively and settle at levels around our two per cent inflation target in 2024."
Lagarde added that if data support the expectation that medium-term inflation outlook will not weaken even after the end of net asset purchases, ECB will "conclude net purchases in the third quarter". Any adjustments to interest rates will "take place some time after the end of our net purchases and will be gradual."
Japan imports surged 34% yoy in Feb on Yen depreciation and higher energy prices
Japan exports rose 19.1% yoy to JPY 7190B in February. That's the 12th straight month of growth. Auto exports increased 8.3% yoy, rebounding from January's -1.0% yoy decline. Exports to the US rose 16.0% yoy to JPY 1.3T. Exports to China rose 25.8% yoy to JPY 1.5T.
Imports rose 34.0% yoy to 7858B. That's the 13th consecutive month of growth. Crude oil imports surged a massive 93.2% yoy to JPY 08.6B, up for the 11th straight months, on the back of Yen's depreciation and higher oil prices. Trade deficit came in at JPY -668B.
In seasonally adjusted terms, exports dropped -0.5% mom to JPY 7432B. Imports rose 2.7% mom to JPY 8463B. Trade deficit widened to JPY -1031B.
Australia Westpac leading index improved slightly in Feb
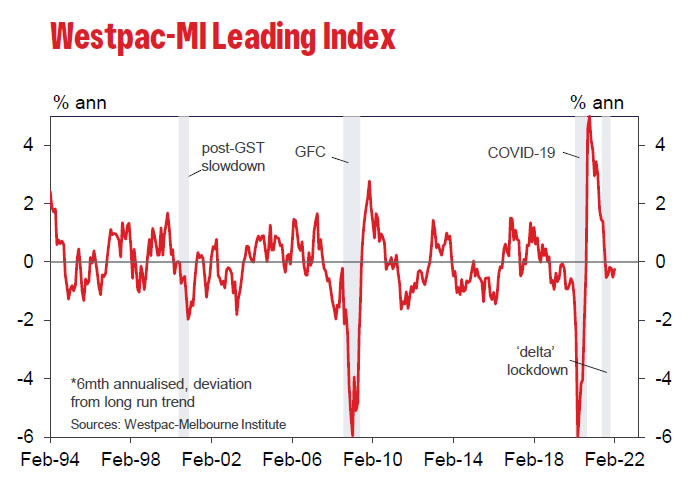
Australia Westpac-MI leading index improved slightly from -0.50% to -0.25% in February. But Westpac is expecting "strong above trend growth in 2022", largely due to the aftermath of the extraordinary emergency policy measures from both the fiscal and monetary authorities during 2020 and 2021.
Westpac expects RBA to stand pat in April meeting with its "patience" stance. But after Q1 inflation data and further progress on wages growth, RBA would moving to a tightening bias over June and July, prior to raising the cash rate in August.
FOMC rate hike and projections awaited, 10-year yield pressing key resistance
Fed is widely expected to raise interest rate for the first time since 2018, lifting the federal funds rate target by just 25bps to 0.25-0.50%. It's nonetheless the start of a tightening cycle to combat persistently high inflation.
The new economic projections would be the main market moving factor. Given the development since December, it's likely that FOMC members are now penciling more than just three 25bps rate hike this year. There are three questions to answer. Firstly, where would interest be by the end of the year? Secondly, is FOMC going to "front-load" some of the rate hikes? And thirdly, will the estimated longer run federal funds rate be lifted from the current 2.50%?
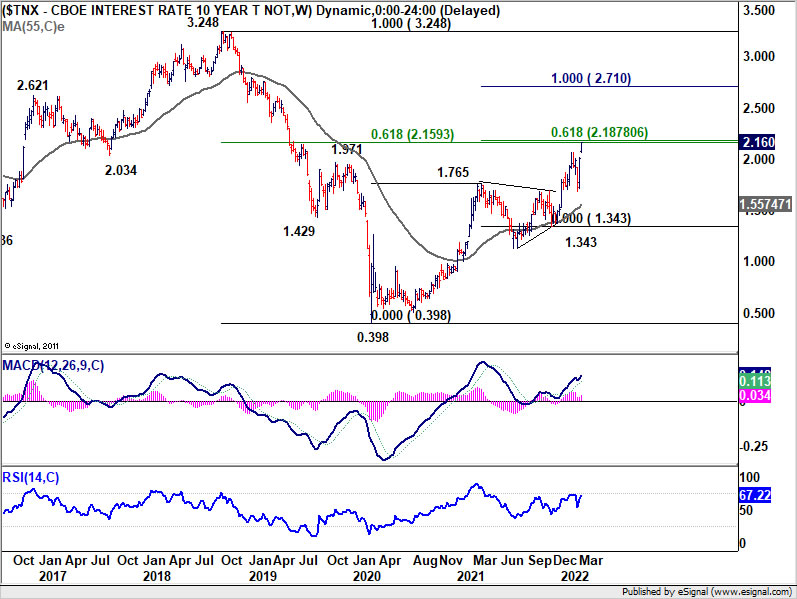
US 10-year yield is extending recent up trend this week, and it's now pressing a important long term resistance zone at 2.159/2.187 (61.8% retracement of 3.248 to 0.398 at 2.159, 61.8% projection of 0.398 to 1.765 to 1.343 at 2.187). This level is expected to hold for a while.
Nevertheless, a strong break there could clear the way to 100% projection at 2.710, probably with some medium term up side acceleration. That, if happens, would be very supportive to USD/JPY and set up further rally back to 125, the level reached only back in 2015.
Next target is cluster resistance level at 2.159/2.187 (61.8% retracement of 3.248 to 0.398 at 2.159, 61.8% projection of 0.398 to 1.765 to 1.343 at 2.187). Current upside momentum doesn't warrant a strong break of this cluster level yet. This, strong resistance will likely be seen there to set the top of the range of a medium term consolidation.
However, strong break of 2.159/2.187 will suggest some dramatic underlying development. In such case, coupled with extending risk aversion, the greenback could be given a strong, sustainable boost.
On the data front
Canada CPI and wholesale sales will be released. US retail sales import price, business inventories, NAHB housing index will also be featured.
EUR/USD Daily Outlook
Daily Pivots: (S1) 1.0914; (P) 1.0967; (R1) 1.1008; More...
EUR/USD is still bounded in range of 1.0805/1120 and intraday bias remains neutral first. Further decline is still expected with 1.1120 support turned resistance intact. On the downside, firm break of 61.8% projection of 1.2265 to 1.1120 from 1.1494 at 1.0786 will pave they way to 100% projection at 1.0349 next. However, strong break of 1.1120 will confirm short term bottoming, at least, and bring stronger rebound back towards 1.1494 structural resistance instead.
In the bigger picture, the decline from 1.2348 (2021 high) is expected to continue as long as 1.1494 resistance holds. Firm break of 1.0635 (2020 low) will raise the chance of long term down trend resumption and target a retest on 1.0339 (2017 low) next. Nevertheless, break of 1.1494 will maintain medium term neutral outlook, and extend range trading first.
Economic Indicators Update
| GMT | Ccy | Events | Actual | Forecast | Previous | Revised |
|---|---|---|---|---|---|---|
| 21:45 | NZD | Current Account (NZD) Q4 | -7.26B | -6.49B | -8.30B | -8.25B |
| 23:30 | AUD | Westpac Leading Index M/M Feb | -0.20% | 0.10% | ||
| 23:50 | JPY | Trade Balance (JPY) Feb | -1.03T | -0.39T | -0.93T | -0.78T |
| 04:30 | JPY | Industrial Production M/M Jan F | -0.80% | -1.30% | -1.30% | |
| 12:30 | CAD | Wholesale Sales M/M Jan | 4.00% | 0.60% | ||
| 12:30 | CAD | CPI M/M Feb | 0.90% | 0.90% | ||
| 12:30 | CAD | CPI Y/Y Feb | 5.50% | 5.10% | ||
| 12:30 | CAD | CPI Common Y/Y Feb | 2.40% | 2.30% | ||
| 12:30 | CAD | CPI Median Y/Y Fed | 3.50% | 3.30% | ||
| 12:30 | CAD | CPI Trimmed Y/Y Fed | 4.20% | 4.00% | ||
| 12:30 | USD | Retail Sales M/M Feb | 0.60% | 3.80% | ||
| 12:30 | USD | Retail Sales ex Autos M/M Feb | 0.90% | 3.30% | ||
| 12:30 | USD | Export Price Index Y/Y Feb | 12.60% | 15.10% | ||
| 12:30 | USD | Import Price Index M/M Feb | 1.60% | 2.00% | ||
| 14:00 | USD | Business Inventories Jan | 1.10% | 2.10% | ||
| 14:00 | USD | NAHB Housing Market Index Mar | 81 | 82 | ||
| 15:30 | USD | Crude Oil Inventories | -1.8M | -1.9M | ||
| 18:00 | USD | Fed Interest Rate Decision | 0.50% | 0.25% | ||
| 18:30 | USD | FOMC Press Conference |
FOMC rate hike and projections awaited, 10-year yield pressing key resistance
Fed is widely expected to raise interest rate for the first time since 2018, lifting the federal funds rate target by just 25bps to 0.25-0.50%. It's nonetheless the start of a tightening cycle to combat persistently high inflation.
The new economic projections would be the main market moving factor. Given the development since December, it's likely that FOMC members are now penciling more than just three 25bps rate hike this year. There are three questions to answer. Firstly, where would interest be by the end of the year? Secondly, is FOMC going to "front-load" some of the rate hikes? And thirdly, will the estimated longer run federal funds rate be lifted from the current 2.50%?
US 10-year yield is extending recent up trend this week, and it's now pressing a important long term resistance zone at 2.159/2.187 (61.8% retracement of 3.248 to 0.398 at 2.159, 61.8% projection of 0.398 to 1.765 to 1.343 at 2.187). This level is expected to hold for a while.
Nevertheless, a strong break there could clear the way to 100% projection at 2.710, probably with some medium term up side acceleration. That, if happens, would be very supportive to USD/JPY and set up further rally back to 125, the level reached only back in 2015.
Japan imports surged 34% yoy in Feb on Yen depreciation and higher energy prices
Japan exports rose 19.1% yoy to JPY 7190B in February. That's the 12th straight month of growth. Auto exports increased 8.3% yoy, rebounding from January's -1.0% yoy decline. Exports to the US rose 16.0% yoy to JPY 1.3T. Exports to China rose 25.8% yoy to JPY 1.5T.
Imports rose 34.0% yoy to 7858B. That's the 13th consecutive month of growth. Crude oil imports surged a massive 93.2% yoy to JPY 08.6B, up for the 11th straight months, on the back of Yen's depreciation and higher oil prices. Trade deficit came in at JPY -668B.
In seasonally adjusted terms, exports dropped -0.5% mom to JPY 7432B. Imports rose 2.7% mom to JPY 8463B. Trade deficit widened to JPY -1031B.
Australia Westpac leading index improved slightly in Feb
Australia Westpac-MI leading index improved slightly from -0.50% to -0.25% in February. But Westpac is expecting "strong above trend growth in 2022", largely due to the aftermath of the extraordinary emergency policy measures from both the fiscal and monetary authorities during 2020 and 2021.
Westpac expects RBA to stand pat in April meeting with its "patience" stance. But after Q1 inflation data and further progress on wages growth, RBA would moving to a tightening bias over June and July, prior to raising the cash rate in August.
ECB Lagarde: Russia-Ukraine war lowers and raises inflation
ECB President Christine Lagarde said in a speech that the Russia-Ukraine war would "lower growth and raise inflation through higher energy and commodity prices, the disruption of international trade and weaker confidence". But the baseline scenario is still for the economy to "grow robustly in 2022".
However, "uncertainty surrounding the outlook had increased significantly", policy makers are looking at two alternative scenarios that " growth could be dampened significantly and inflation could be considerably higher in the near term". Still, "in all scenarios, inflation is still expected to decrease progressively and settle at levels around our two per cent inflation target in 2024."
Lagarde added that if data support the expectation that medium-term inflation outlook will not weaken even after the end of net asset purchases, ECB will "conclude net purchases in the third quarter". Any adjustments to interest rates will "take place some time after the end of our net purchases and will be gradual."
USD/CHF Gains Bullish Momentum, Fed Decision Next
Key Highlights
- USD/CHF started a major increase after it broke the 0.9250 resistance.
- It is up over 150 pips and broke many hurdles on the 4-hours chart.
- EUR/USD is still struggling below 1.1080, and GBP/USD is consolidating above 1.3000.
- The Fed Interest Rate Decision is scheduled today (forecast 0.50%, versus 0.25% previous).
USD/CHF Technical Analysis
The US Dollar formed a support base above 0.9200 against the Swiss Franc. USD/CHF started a strong increase and broke many hurdles near 0.9250.
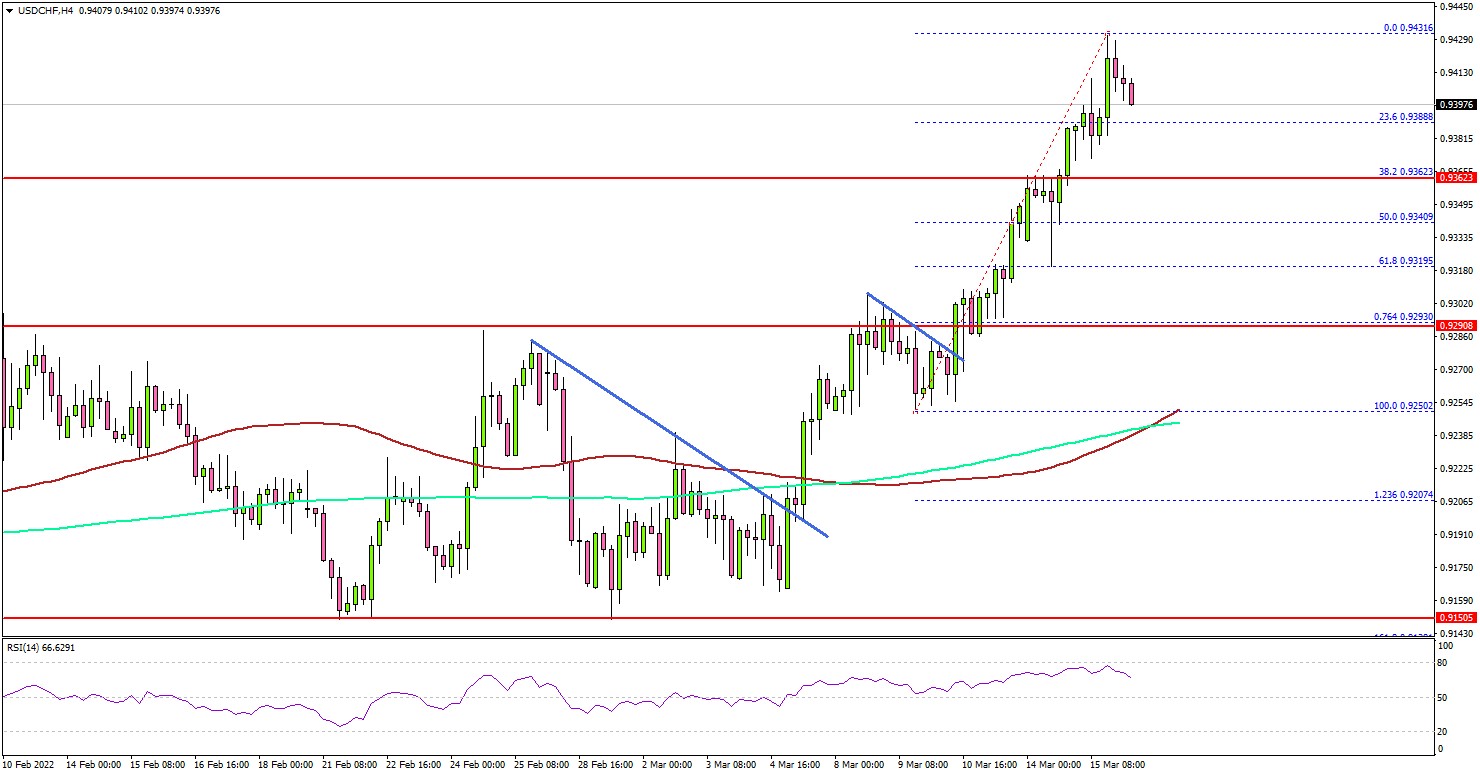
Looking at the 4-hours chart, the pair gained bullish momentum above the 0.9300 resistance. The pair even settled above the 0.9350 level, the 100 simple moving average (red, 4-hours), and the 200 simple moving average (green, 4-hours).
During the increase, there was a clear move above a few key bearish trend lines. Finally, the pair spiked above 0.9400 and is currently consolidating gains.
An immediate resistance on the upside is near the 0.9420 level. The next major resistance is near the 0.9440 level. Any more gains might send USD/CHF towards the 0.9500 resistance.
If there is no upside break above 0.9420, the pair could start a downside correction. An initial support is near the 0.9360 level. The first major support is near the 0.9330 level. The main support is near the 0.9300 zone.
A successful break below the 0.9300 support could start a major decline. In the stated case, USD/CHF may perhaps revisit the 0.9250 support.
Looking at EUR/USD, the pair is still struggling to surpass the 1.1080 resistance zone. Besides, GBP/USD is attempting a recovery wave from the 1.3000 zone.
Economic Releases
- US Retail Sales for Feb 2022 (MoM) – Forecast +0.4%, versus +3.8% previous.
- Fed Interest Rate Decision - Forecast 0.50%, versus 0.25% previous.
- Canadian Consumer Price Index for Feb 2022 (MoM) – Forecast +0.9%, versus +0.9% previous.
- Canadian Consumer Price Index for Feb 2022 (YoY) – Forecast +5.5%, versus +5.1% previous.
Bitcoin Pinned Around $39,000 as Ukraine War Proves a Blessing and a Curse
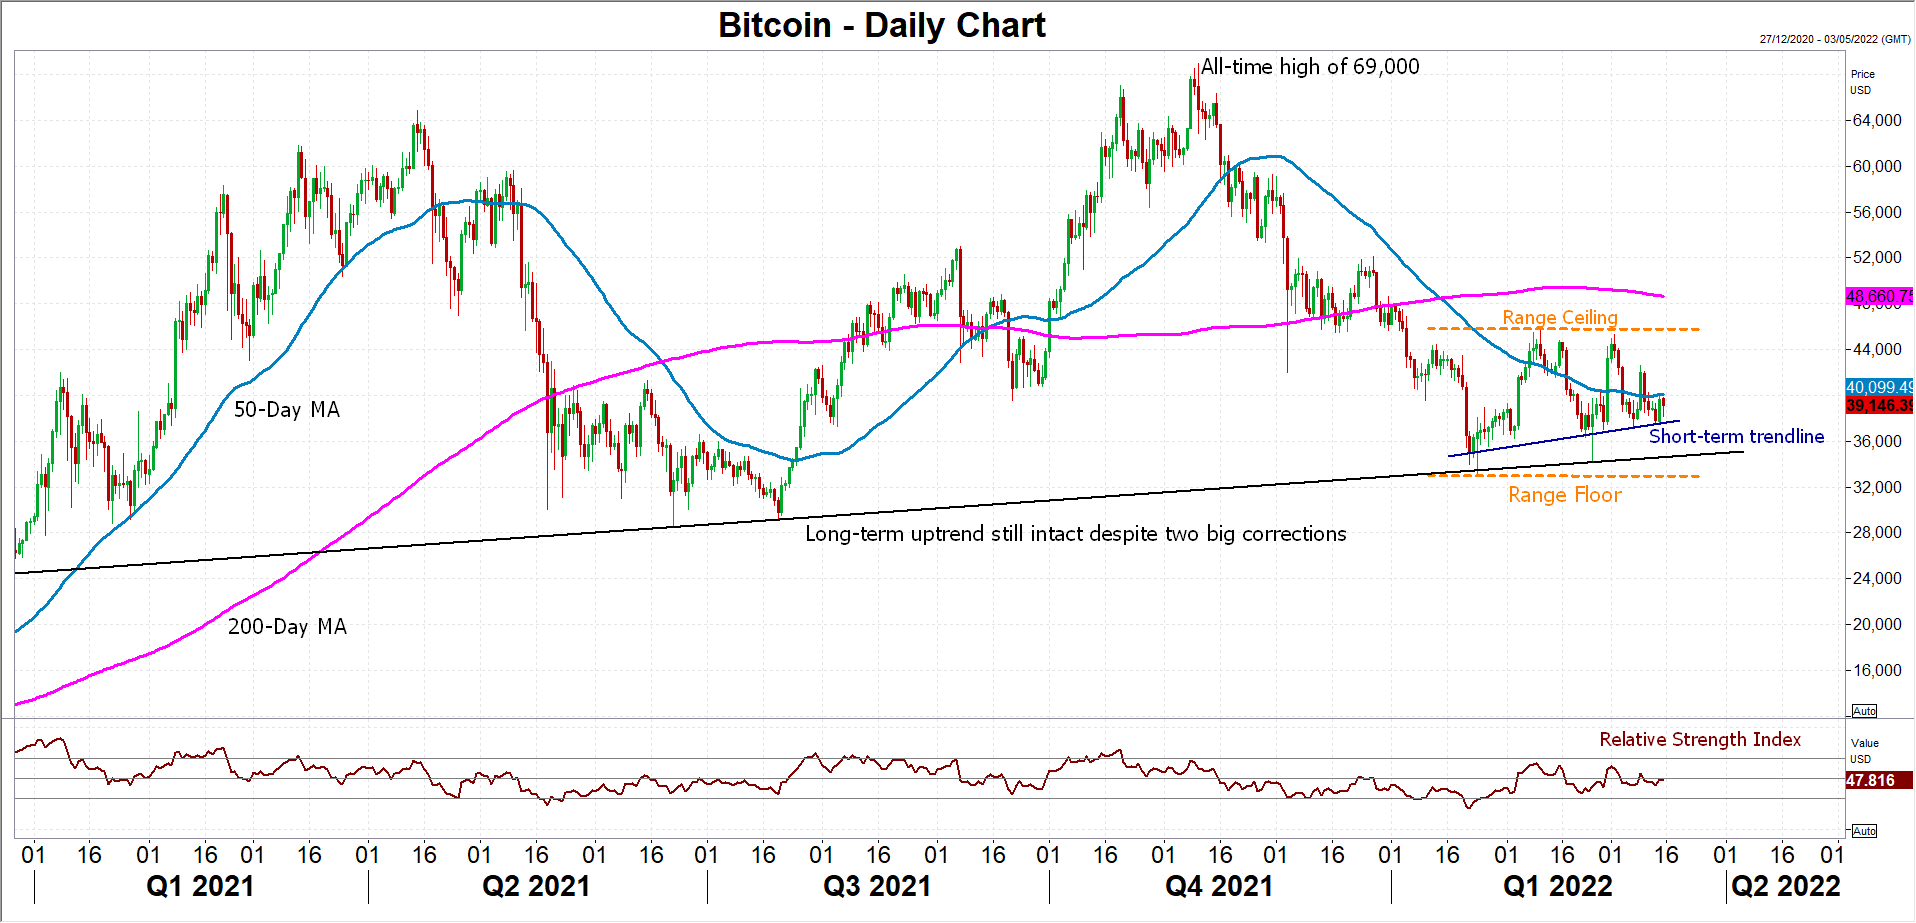
Bitcoin has been trading in a range since late January when fears about sky-high inflation took hold over the markets and tensions between Russia and Ukraine first started to escalate. The sideways pattern isn’t showing any signs of breaking up, so why is the price so unusually disciplined at such a tumultuous period for financial markets?
The halving effect
The price of Bitcoin – still the largest cryptocurrency by market cap – exploded higher in 2020 and 2021. Whilst the rising popularity of Bitcoin, both as an asset class as well as its use as a payment method, undoubtedly magnified this spectacular growth, the main driving force behind this rally was likely the halving that takes place every four years, and which last happened in May 2020.
In previous such occasions in 2012 and 2016, the price also rallied, though, with a slightly longer lag from the date of halving, which was then followed by a steep correction. Within this context, Bitcoin’s downfall from its all-time high of $69,000 set in November 2021 is to have been expected. Nonetheless it’s still very puzzling why Bitcoin and the other major cryptocurrencies have been consolidating for so long when volatility has been extremely elevated in the broader markets.
Not much of a safe haven
The price bottomed at a six-month low of $32,950.72 on January 24, halting a two-month slide. But despite some very choppy trading since then amidst the geopolitical storm with Ukraine, it has been unable to rise further than $45,850 or even brush new lows, instead fluctuating around $39,000.
Many market pundits were hoping that Bitcoin would shine as a safe haven from the war. But although cryptocurrencies have come under the spotlight, with the Ukrainian government encouraging donations in cryptos and many Russians using them to evade sanctions, the latter may also be having the opposite effect. Some wealthy Russians are reportedly liquidating their digital coins as they find themselves frozen out of their other assets due to Western sanctions.
Bitcoin’s increasing adoption by institutional investors may also be working against it as the fact that it has not proven to be a good inflation hedge nor a ‘digital gold’ during this torrid time for the markets suggests portfolio managers see it mostly as a speculative trade than anything else.
Regulatory worries have eased lately
On the positive side, both the European Union and United States seem to be only taking baby steps as far as regulating cryptocurrencies is concerned. All the indications are that most governments don’t want to stifle innovation in the field of digital currencies and blockchain technology despite ongoing concerns about fraud and money laundering. This bodes well for Bitcoin, at least in the medium term.
When factoring in all these different forces, it appears that they are negating each other. But what could also be keeping the floor and ceiling of the range in place is dip buyers stepping in to take advantage of the discounted price, while those that entered the market when Bitcoin was near record highs are possibly selling it at every opportunity that the price spikes higher to minimize their losses.
Is the price getting ready for an upside break?
It is encouraging to note, however, that during this consolidation phase, not only is the long-term ascending trendline still in place, but a short-term uptrend has also been forming. With momentum indicators like the Relative Strength Index (RSI) looking fairly neutral, an upward push seems more likely than a downward one, assuming of course that the 50-day moving average doesn’t get in the way.
How Many Fed Rate Hikes the USD Will Like?
The Federal Reserve is expected to raise the interest rate by 25 basis points during the upcoming meeting on Wednesday, at 20:00 GMT+2. As inflation keeps surging, this will be the first small attempt to curb it. What does it mean for the US dollar? Let’s find out.
What Led To Rate Hikes
The rise of inflation is undoubtedly a huge problem for the United States right now. The annual inflation rate reached 7.9% in February 2022, the highest level since January 1982. At the same time, the economy is expanding at an ultra-fast pace. For example, the US unemployment rate dropped to 3.8% - a new post-pandemic low. Another factor that triggers Fed to act sooner rather than later is the Russia-Ukraine military conflict. The US sanctions against Russia and the ban of Russia's oil export boosted commodity prices and left no doubt about upcoming rate hikes.
How Many Rate Hikes to Expect
In addition to the Fed Interest Rate Decision, the regulator will release a so-called dot-plot. This is a report, where the Fed members post their expectations of rate hikes. The economists surveyed by Bloomberg see 5 rate increases with the rate reaching 1.25% this year. However, some analysts see an even more hawkish Fed with seven interest rate changes.
The US dollar will likely react to the actual data in these projections. If the Fed turns out to be more hawkish than the market expects it to be (with more than seven rate hikes or half-point rate hike) the USD will soar.
The USD ahead of the Event
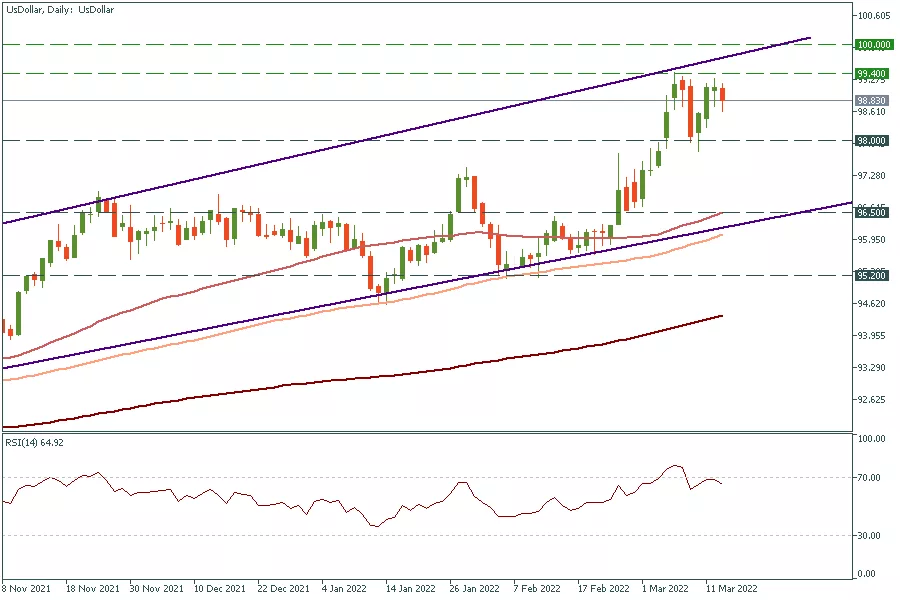
If you look at the chart of the US Dollar Index, which tracks the performance of the American currency, you can notice that the decision has already been priced into the market. As a result, the USD has reached the 99.40 level. Thus we can expect a sharp reversal after the meeting unless the Fed surprises. In that case, the US Dollar index can plunge to 98 and even lower to 96.50. Keep in mind that the Federal Reserve may express cautiousness amid the ongoing tensions in Eastern Europe and the possible slowdown of economic growth.
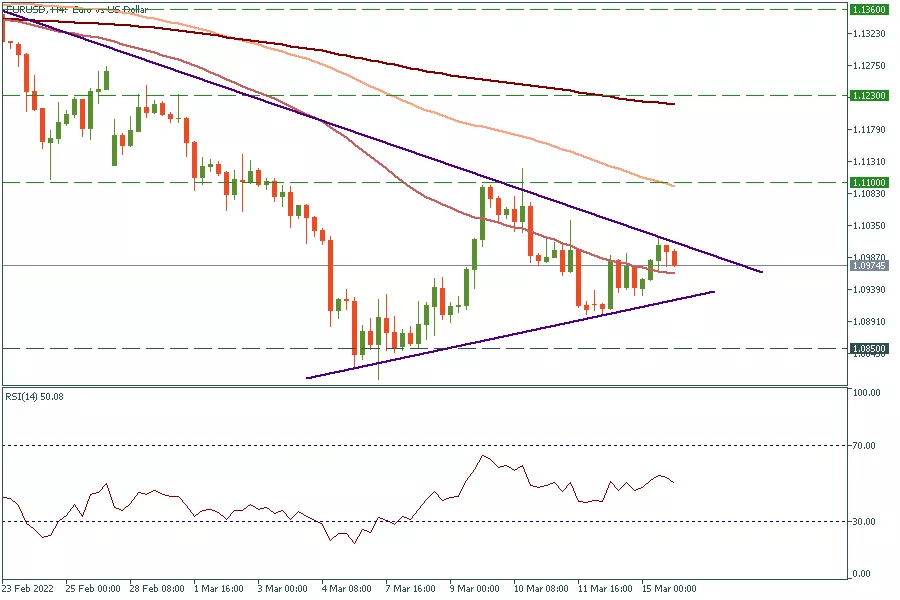
EURUSD has been trading within a symmetrical triangle. That is, after a downtrend, we may see a continuation of the downtrend and reach the support levels at 1.0900 and 1.0850. However, if the Fed fails to surprise the market, the upside momentum to the resistance of 1.1100 (50-period MA) on H4 will be in focus.