

Sample Category Title
AUD/USD Daily Report
Daily Pivots: (S1) 0.7278; (P) 0.7307; (R1) 0.7351; More...
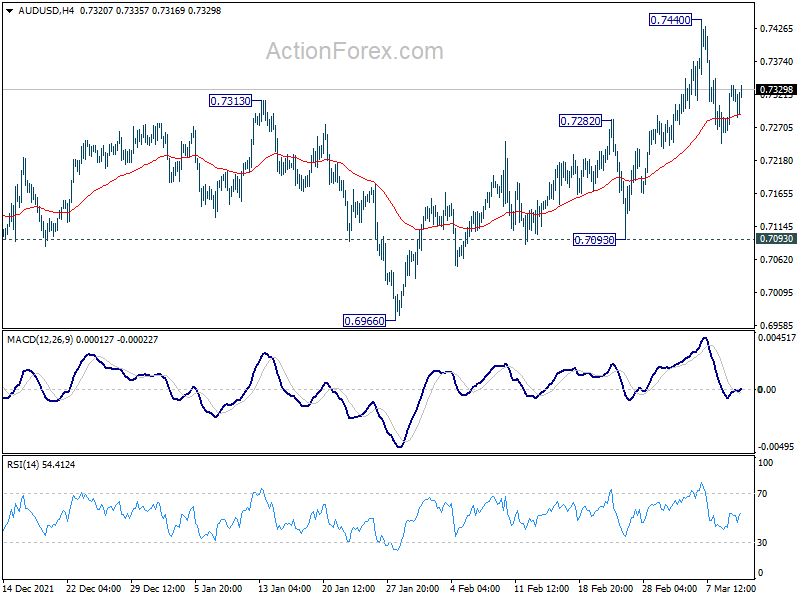
Intraday bias in AUD/USD remains neutral and more corrective trading could be seen below 0.7440. But overall, further rally will remain in favor as long as 0.7093 support holds. As noted before, larger decline from 0.8006 might have completed at 0.6966 already. Above 0.7440 will resume the rise from 0.6966 for 0.7555 resistance next.
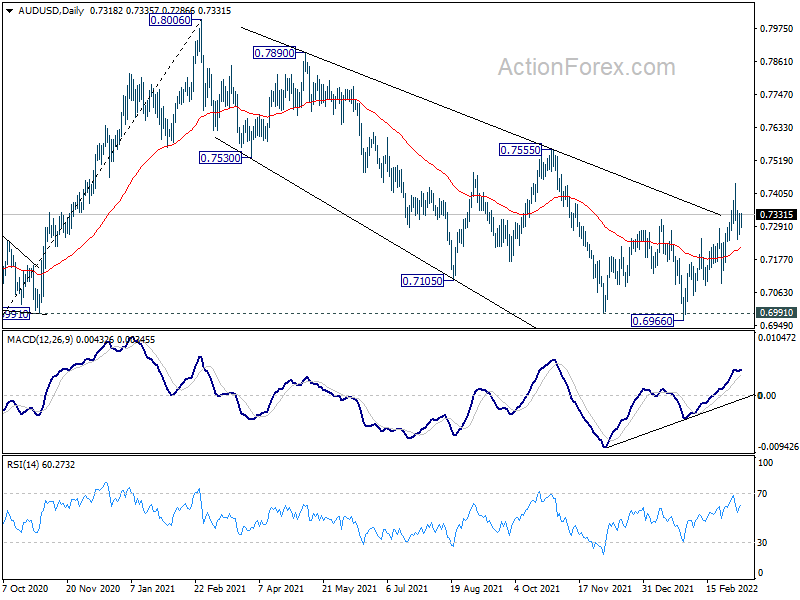
In the bigger picture, focus remains on 0.6991 key structural support. Sustained break there will argue that the whole up trend from 0.5506 might be finished at 0.8006, after rejection by 0.8135 long term resistance. Deeper decline would then be seen back to 61.8% retracement of 0.5506 to 0.8006 at 0.6461. Meanwhile, strong rebound from 0.6991 will retain medium term bullishness. That is, whole up trend from 0.5506 is still in progress for another rise through 0.8006 at a later stage.
USD/JPY Daily Outlook
Daily Pivots: (S1) 115.36; (P) 115.58; (R1) 115.88; More...
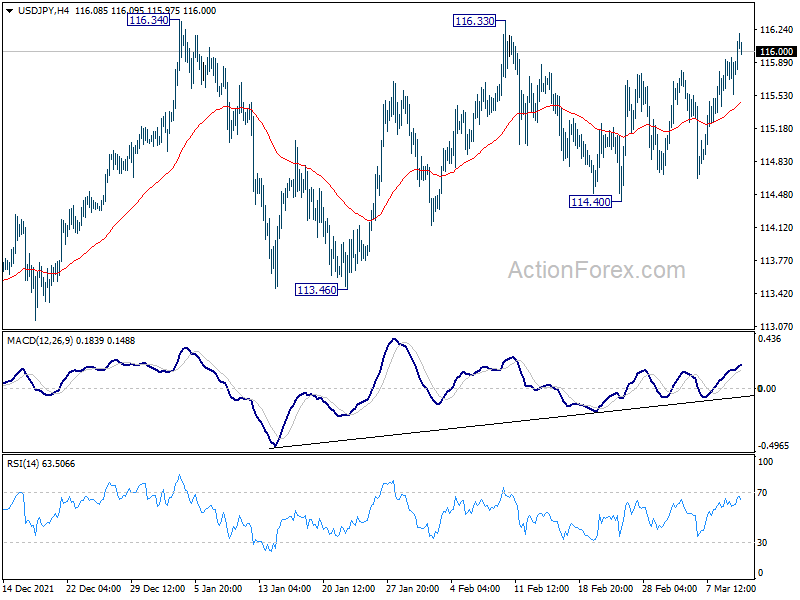
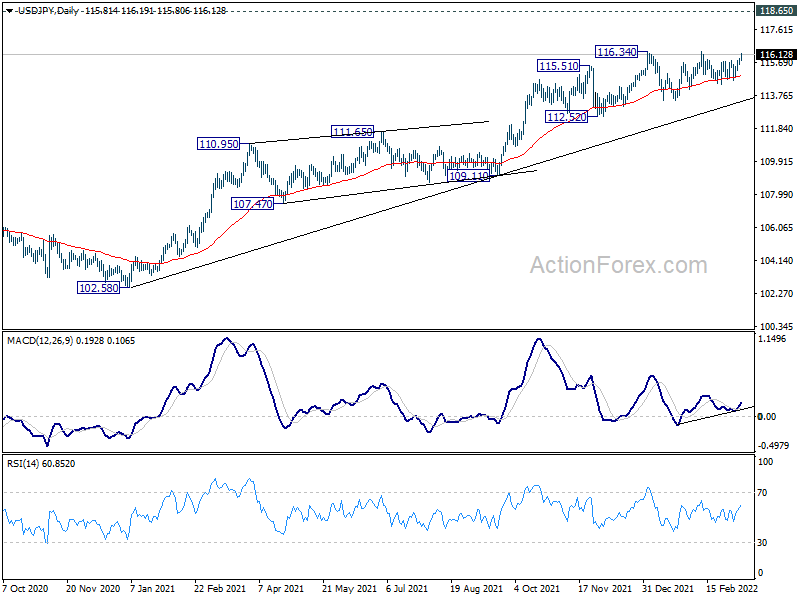
Intraday bias in USD/JPY remains neutral as sideway trading from 116.34 is still extending. Range trading continues in USD/JPY and intraday bias remains neutral. On the upside, firm break of 116.34 will resume larger up trend from 102.58 to 118.65 long term resistance next. On the downside, though, break of 114.40 will continue the corrective pattern from 116.34 with another fall to 113.46 support.
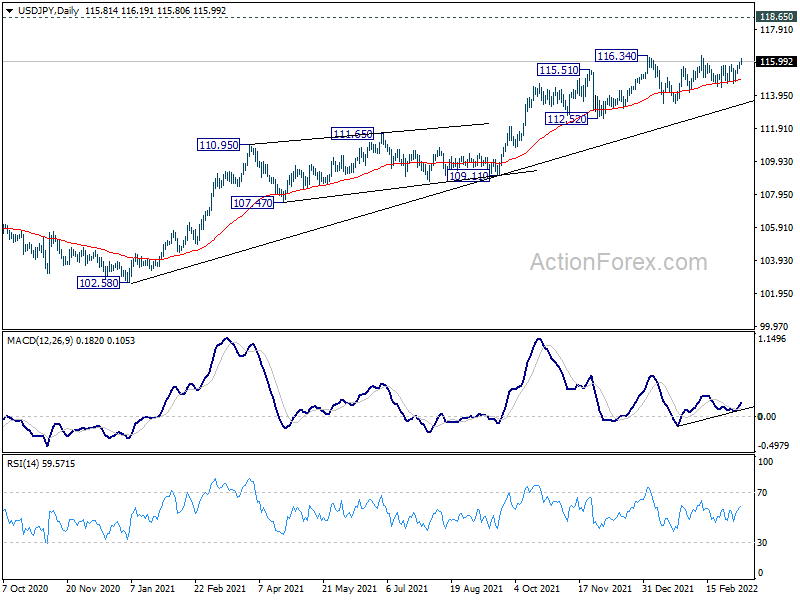
In the bigger picture, no change in the view that rise from 102.58 is the third leg of the up trend from 101.18 (2020 low). Such rally should target a test on 118.65 (2016 high). Sustained break there will pave the way to 120.85 (2015 high) and raise the chance of long term up trend resumption. This will remain the favored case as long as 55 week EMA (now at 111.64) holds.
USD/CHF Daily Outlook
Daily Pivots: (S1) 0.9243; (P) 0.9273; (R1) 0.9296; More....
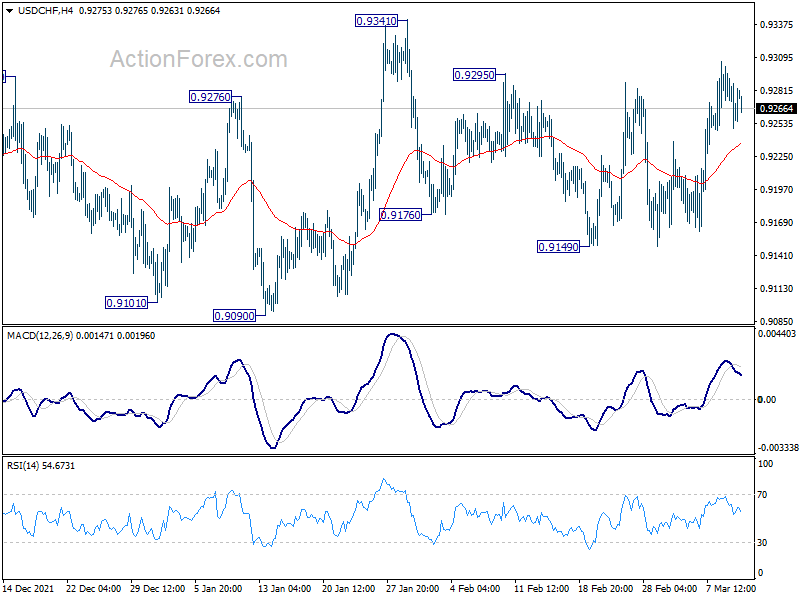
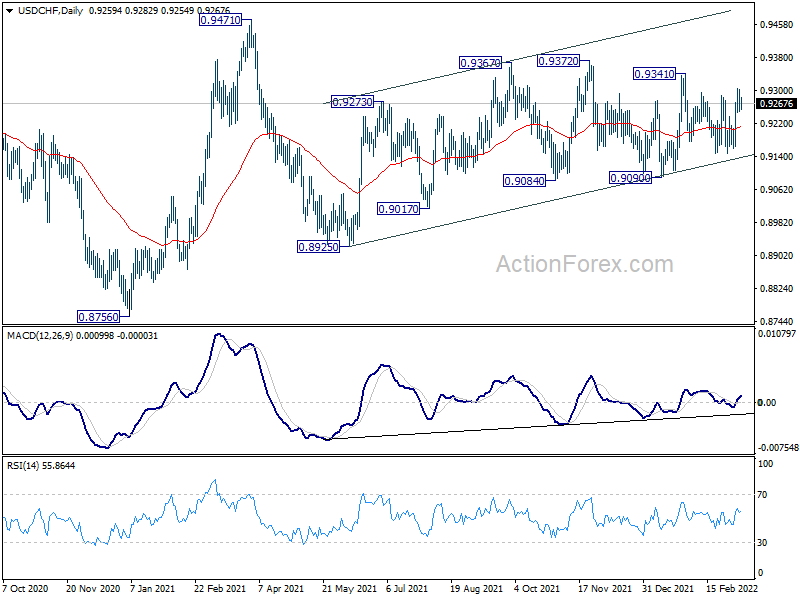
Intraday bias in USD/CHF remains neutral at this point and sideway trading could continue. Choppy rise from 0.8925 would still be in favor to extend higher as long as 0.9090 support holds. Break of 0.9341 will target 0.9372 resistance and then 0.9471. On the downside, however, break of 0.9090 will bring deeper fall back to 0.8925 support.
In the bigger picture, medium term outlook will be neutral at best as long as 0.9471 resistance holds. Larger down trend could still extend through 0.8756 (2021 low). However, firm break of 0.9471 will argue that the trend has already reversed and rebound the rally from 0.8756 with another impulsive move.
GBP/USD Daily Outlook
Daily Pivots: (S1) 1.3118; (P) 1.3154; (R1) 1.3219; More...
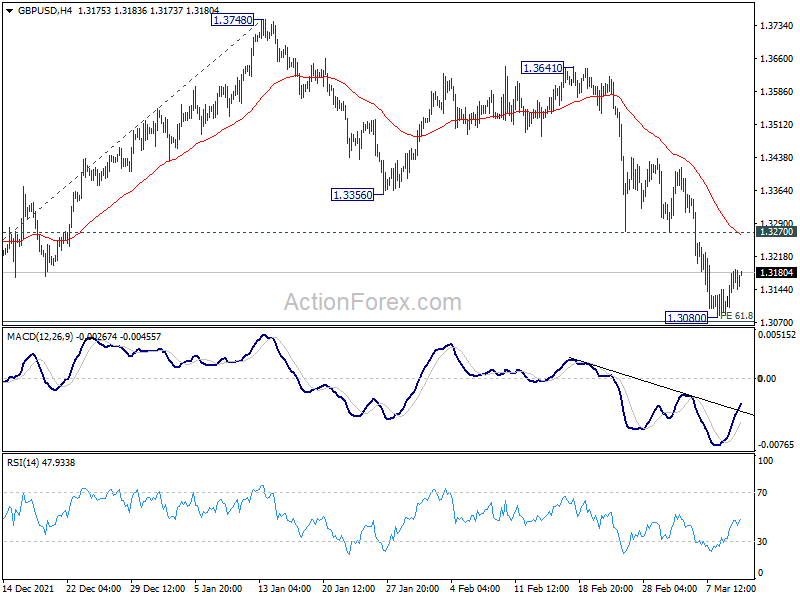
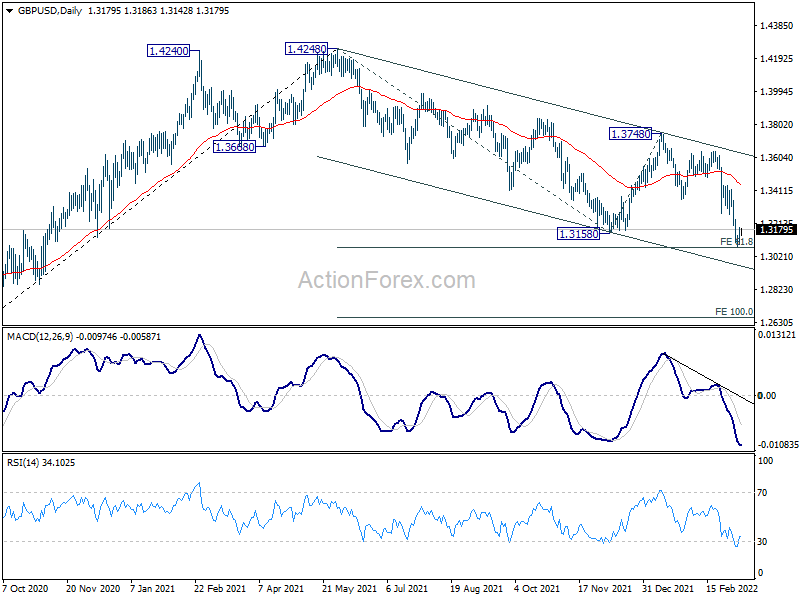
Intraday bias in GBP/USD stays neutral for consolidation above 1.3080 temporary low. Upside of recovery should be limited by 1.3270 support turned resistance. On the downside, sustained break of 61.8% projection of 1.4248 to 1.3158 from 1.3748 at 1.3074 will extend the down trend from 1.4248 to 100% projection at 1.2658. However, strong break of 1.3270 should indicate short term bottoming and bring stronger rebound.
In the bigger picture, current development suggests that the up trend from 1.1409 (2020 low) has completed at 1.4248. Decline from 1.4248 could still be a corrective move, or it could be the start of a long term down trend. In either case, deeper decline would now be seen back to 61.8% retracement of 2.1161 to 1.1409 at 1.2493. In case, break of 1.3748 resistance is needed to indicate medium term bottoming, or outlook will stay bearish.
EUR/USD Daily Outlook
Daily Pivots: (S1) 1.0944; (P) 1.1019; (R1) 1.1149; More...
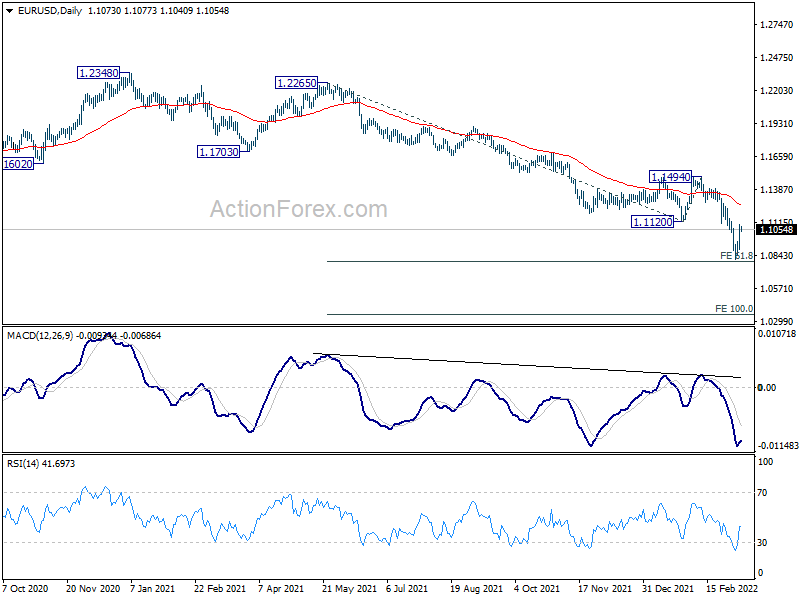
Intraday bias in EUR/USD remains neutral first despite the strong rebound from 1.0805, and outlook as unchanged. As long as 1.1120 support turned resistance holds, larger down trend from 1.1494 is still expected to continue. On the downside, firm break of 61.8% projection of 1.2265 to 1.1120 from 1.1494 at 1.0786 will pave they way to 100% projection at 1.0349 next. However, strong break of 1.1120 will confirm short term bottoming, at least, and bring stronger rebound back towards 1.1494 structural resistance instead.
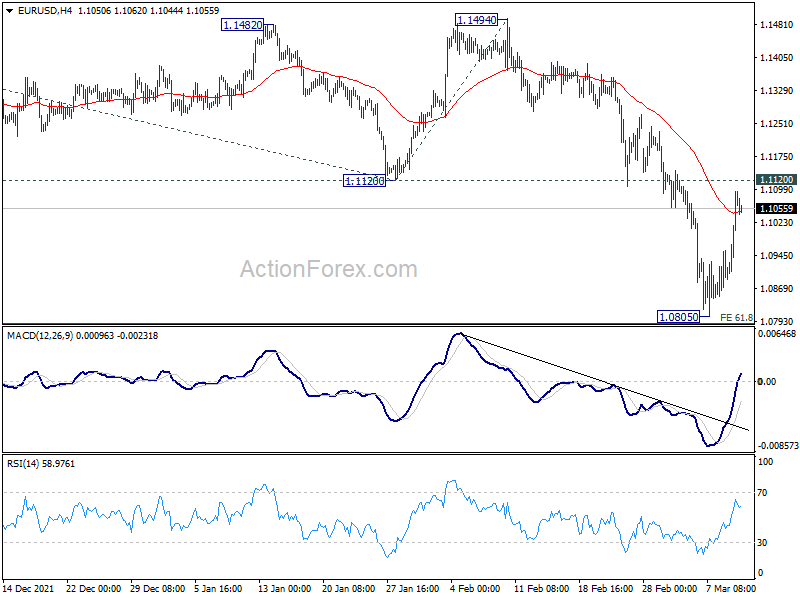
In the bigger picture, the decline from 1.2348 (2021 high) is expected to continue as long as 1.1494 resistance holds. Firm break of 1.0635 (2020 low) will raise the chance of long term down trend resumption and target a retest on 1.0339 (2017 low) next. Nevertheless, break of 1.1494 will maintain medium term neutral outlook, and extend range trading first.
Euro Staying in Rebound ahead of ECB, Dollar Awaits CPI
Yen and Swiss Franc are both under selling pressure following the strong rebound in global stock markets. While it's too early to conclude that risk appetite has returned from the shadow of Russia invasion of Ukraine, at least, the initial shock seemed to be digested well already. Euro is staging a strong rebound as traders would temporarily turn their eyes to ECB meeting today. Meanwhile, Dollar will look into today's CPI data for guidance.
Technically, with repeated support from 55 day EMA, it's now getting much more likely that price actions from 116.34 are mere a near term consolidation pattern. Considering the structure, an upside breakout could be imminent and break of 116.34 will resume larger up trend towards long term resistance level at 118.65. That would be a focus for today.
In Asia, at the time of writing, Nikkei is up 3.96%. Hong Kong HSI is up 1.26%. China Shanghai SSE is up 1.91%. Singapore Strait Times is up 1.34%. Japan 10-year JGB yield is up 0.0150 at 0.182. Overnight, DOW rose 2.00%. S&P 500 rose 2.57%. NASDAQ rose 3.59%. 10-year yield rose 0.076 to 1.948.
Some previews on ECB, a look at EUR/CHF
A tremendous amount of uncertainty was added to ECB outlook from Russia's invasion of Ukraine. There were expectations that ECB could announce an earlier end to its asset purchase program at today's meeting, paving the way for a rate hike later this year. But now, it's more likely for the central bank to keep options open for the moment.
Nevertheless, facing increasing risk of prolonged high inflation, hawks in the councils could push for at least a move to a "neutral" guidance. That could come in form of dropping the reference to a rate cut in the guidance. ECB might also remove the stipulation that rate hike would come "shortly" after end of net asset purchases.
The new economic projections would also be scrutinized while President Christine Lagarde would be asked for her views on risk of stagflation in Eurozone.
Here are some previews for today's ECB meeting:
- ECB meeting: No right choices for the euro
- ECB Preview: A Tough Balancing Act Just Got Harder
- ECB Preview – Inflation Forces the Normalisation Process to Continue
Euro is staging a strong rebound since yesterday, while gold and oil prices are in deep retreat. The situation came as markets are exiting the phase of initial shock of Russia invasion. But clearly, the clouds are still there. Today's ECB announce might give Euro some temporary volatility, but the next move will still very much depend on the development in Ukraine.
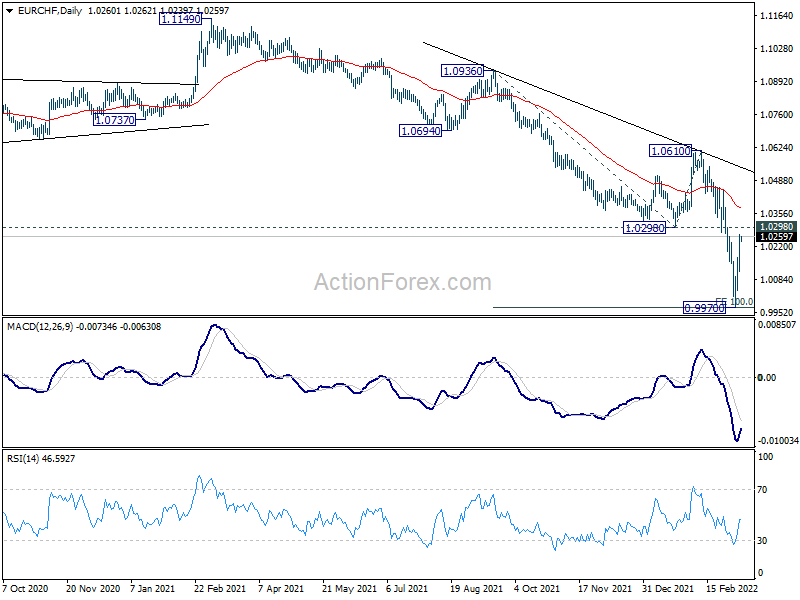
Technically, for EUR/CHF, 0.9970 is theoretically a good place to bottom. It's not unreasonable to say that the down trend from 1.1149 has ended as a five-wave move, just hitting, 100% projection of 1.0936 to 1.0298 from 1.0610 at 0.9972. Parity can also provide additional psychological support. Yet, firm break of 1.0298 support turned resistance is still needed to be the first sign of major bottoming. Otherwise, risk will remain heavily on the downside.
Japan PPI rose record 9.3% yoy in Feb, led by energy and commodities
Japan corporate goods price index rose 9.3% yoy in February, above expectation of 8.7% yoy. At 110.7, the index hit the highest level marked since 1985. That's also the highest rise on record, as led by skyrocketing energy prices. Coal and petroleum prices jumped 34.2% yoy. Electricity, city gas and water prices also surged 27.5% yoy.
Commodity prices also surged with iron and steel up 24.5% yoy. Nonferrous metal rose 24.9% yoy. Lumber and wood products rose 58.0% yoy.
Import prices rose 34.0% yoy while export prices rose 12.7% yoy.
Elsewhere
Australia consumer inflation expectations rose to 4.9% in March. UK RICS house price balance rose to 79 in February, above expectation of 73. In addition to ECB meeting, US CPI will also be closely watched while jobless claims will also be featured.
EUR/USD Daily Outlook
Daily Pivots: (S1) 1.0944; (P) 1.1019; (R1) 1.1149; More...
Intraday bias in EUR/USD remains neutral first despite the strong rebound from 1.0805, and outlook as unchanged. As long as 1.1120 support turned resistance holds, larger down trend from 1.1494 is still expected to continue. On the downside, firm break of 61.8% projection of 1.2265 to 1.1120 from 1.1494 at 1.0786 will pave they way to 100% projection at 1.0349 next. However, strong break of 1.1120 will confirm short term bottoming, at least, and bring stronger rebound back towards 1.1494 structural resistance instead.
In the bigger picture, the decline from 1.2348 (2021 high) is expected to continue as long as 1.1494 resistance holds. Firm break of 1.0635 (2020 low) will raise the chance of long term down trend resumption and target a retest on 1.0339 (2017 low) next. Nevertheless, break of 1.1494 will maintain medium term neutral outlook, and extend range trading first.
Economic Indicators Update
| GMT | Ccy | Events | Actual | Forecast | Previous | Revised |
|---|---|---|---|---|---|---|
| 23:50 | JPY | PPI Y/Y Feb | 9.30% | 8.70% | 8.60% | 8.90% |
| 00:00 | AUD | Consumer Inflation Expectations Mar | 4.90% | 4.60% | ||
| 00:01 | GBP | RICS Housing Price Balance Feb | 79% | 73% | 74% | |
| 12:45 | EUR | ECB Interest Rate Decision | 0.00% | 0.00% | ||
| 13:30 | EUR | ECB Press Conference | ||||
| 13:30 | USD | Initial Jobless Claims (Mar 4) | 205K | 215K | ||
| 13:30 | USD | CPI M/M Feb | 0.80% | 0.60% | ||
| 13:30 | USD | CPI Y/Y Feb | 7.90% | 7.50% | ||
| 13:30 | USD | CPI Core M/M Feb | 0.50% | 0.60% | ||
| 13:30 | USD | CPI Core Y/Y Feb | 6.40% | 6.00% | ||
| 15:30 | USD | Natural Gas Storage | -139B |
Some previews on ECB, a look at EUR/CHF
A tremendous amount of uncertainty was added to ECB outlook from Russia's invasion of Ukraine. There were expectations that ECB could announce an earlier end to its asset purchase program at today's meeting, paving the way for a rate hike later this year. But now, it's more likely for the central bank to keep options open for the moment.
Nevertheless, facing increasing risk of prolonged high inflation, hawks in the councils could push for at least a move to a "neutral" guidance. That could come in form of dropping the reference to a rate cut in the guidance. ECB might also remove the stipulation that rate hike would come "shortly" after end of net asset purchases.
The new economic projections would also be scrutinized while President Christine Lagarde would be asked for her views on risk of stagflation in Eurozone.
Here are some previews for today's ECB meeting:
- ECB meeting: No right choices for the euro
- ECB Preview: A Tough Balancing Act Just Got Harder
- ECB Preview – Inflation Forces the Normalisation Process to Continue
Euro is staging a strong rebound since yesterday, while gold and oil prices are in deep retreat. The situation came as markets are exiting the phase of initial shock of Russia invasion. But clearly, the clouds are still there. Today's ECB announce might give Euro some temporary volatility, but the next move will still very much depend on the development in Ukraine.
Technically, for EUR/CHF, 0.9970 is theoretically a good place to bottom. It's not unreasonable to say that the down trend from 1.1149 has ended as a five-wave move, just hitting, 100% projection of 1.0936 to 1.0298 from 1.0610 at 0.9972. Parity can also provide additional psychological support. Yet, firm break of 1.0298 support turned resistance is still needed to be the first sign of major bottoming. Otherwise, risk will remain heavily on the downside.
Japan PPI rose record 9.3% yoy in Feb, led by energy and commodities
Japan corporate goods price index rose 9.3% yoy in February, above expectation of 8.7% yoy. At 110.7, the index hit the highest level marked since 1985. That's also the highest rise on record, as led by skyrocketing energy prices. Coal and petroleum prices jumped 34.2% yoy. Electricity, city gas and water prices also surged 27.5% yoy.
Commodity prices also surged with iron and steel up 24.5% yoy. Nonferrous metal rose 24.9% yoy. Lumber and wood products rose 58.0% yoy.
Import prices rose 34.0% yoy while export prices rose 12.7% yoy.
Technical Outlook and Review
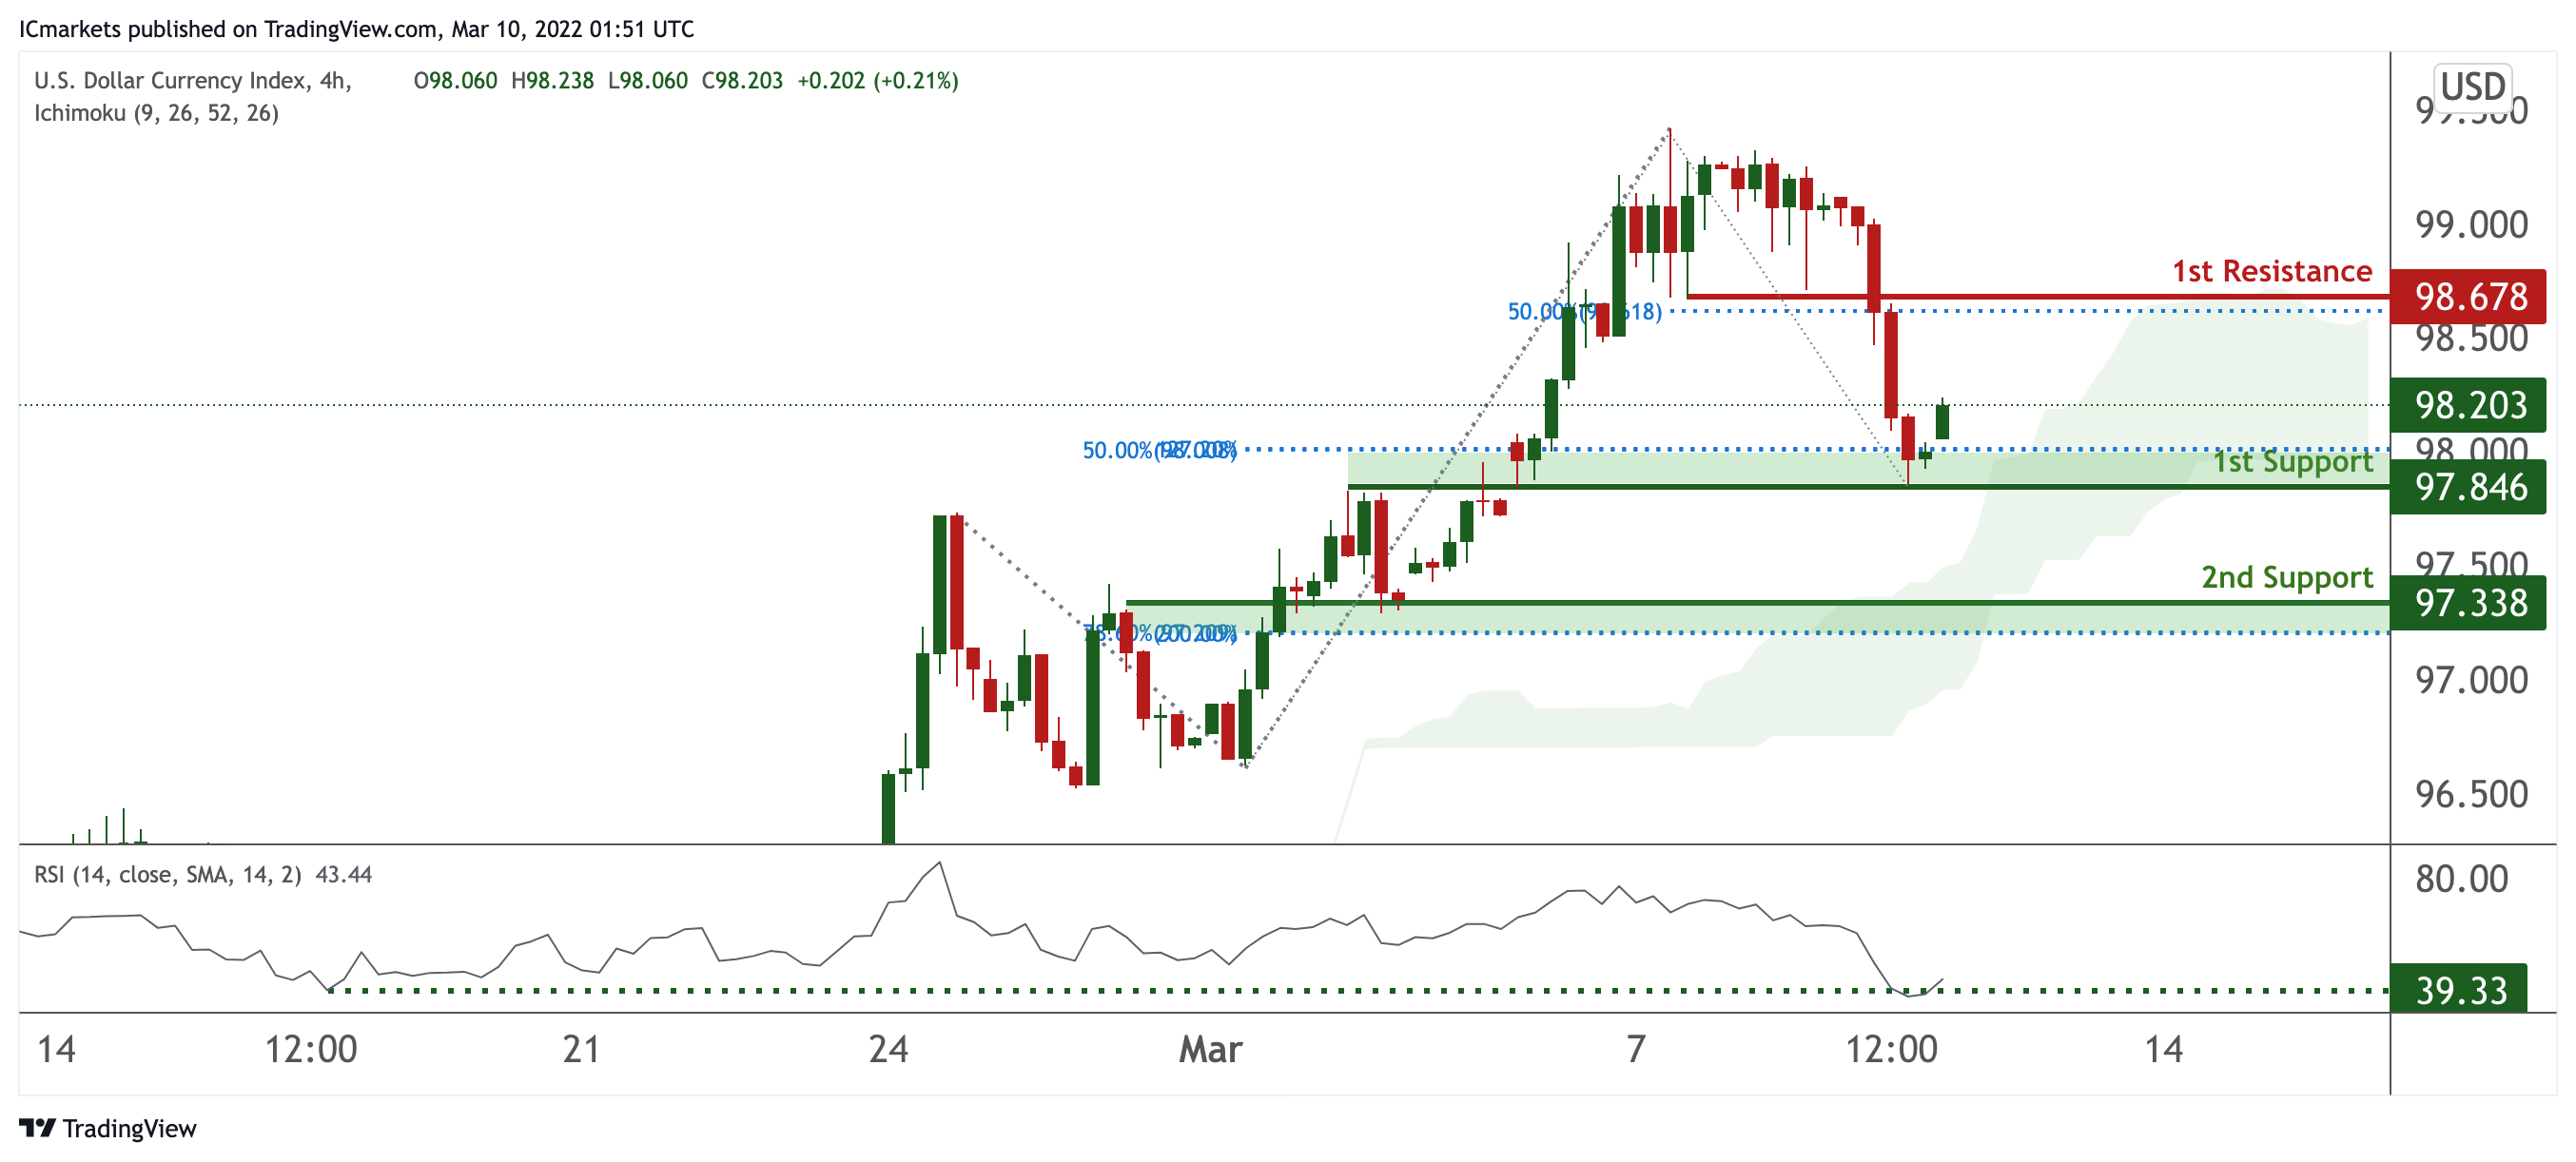
DXY:
On the H4 timeframe, prices are resting on a strong support. We see the potential for further bullish continuation from our 1st support at 97.846 in line with 50% Fibonacci retracement and 127.2% Fibonacci projection towards our 1st resistance at 98.678 in line with 50% Fibonacci retracement. RSI is at levels where bounces previously occurred.
Areas of consideration:
- H4 time frame, 1st resistance at 98.678
- H4 time frame, 1st support at 97.846
XAU/USD (GOLD):
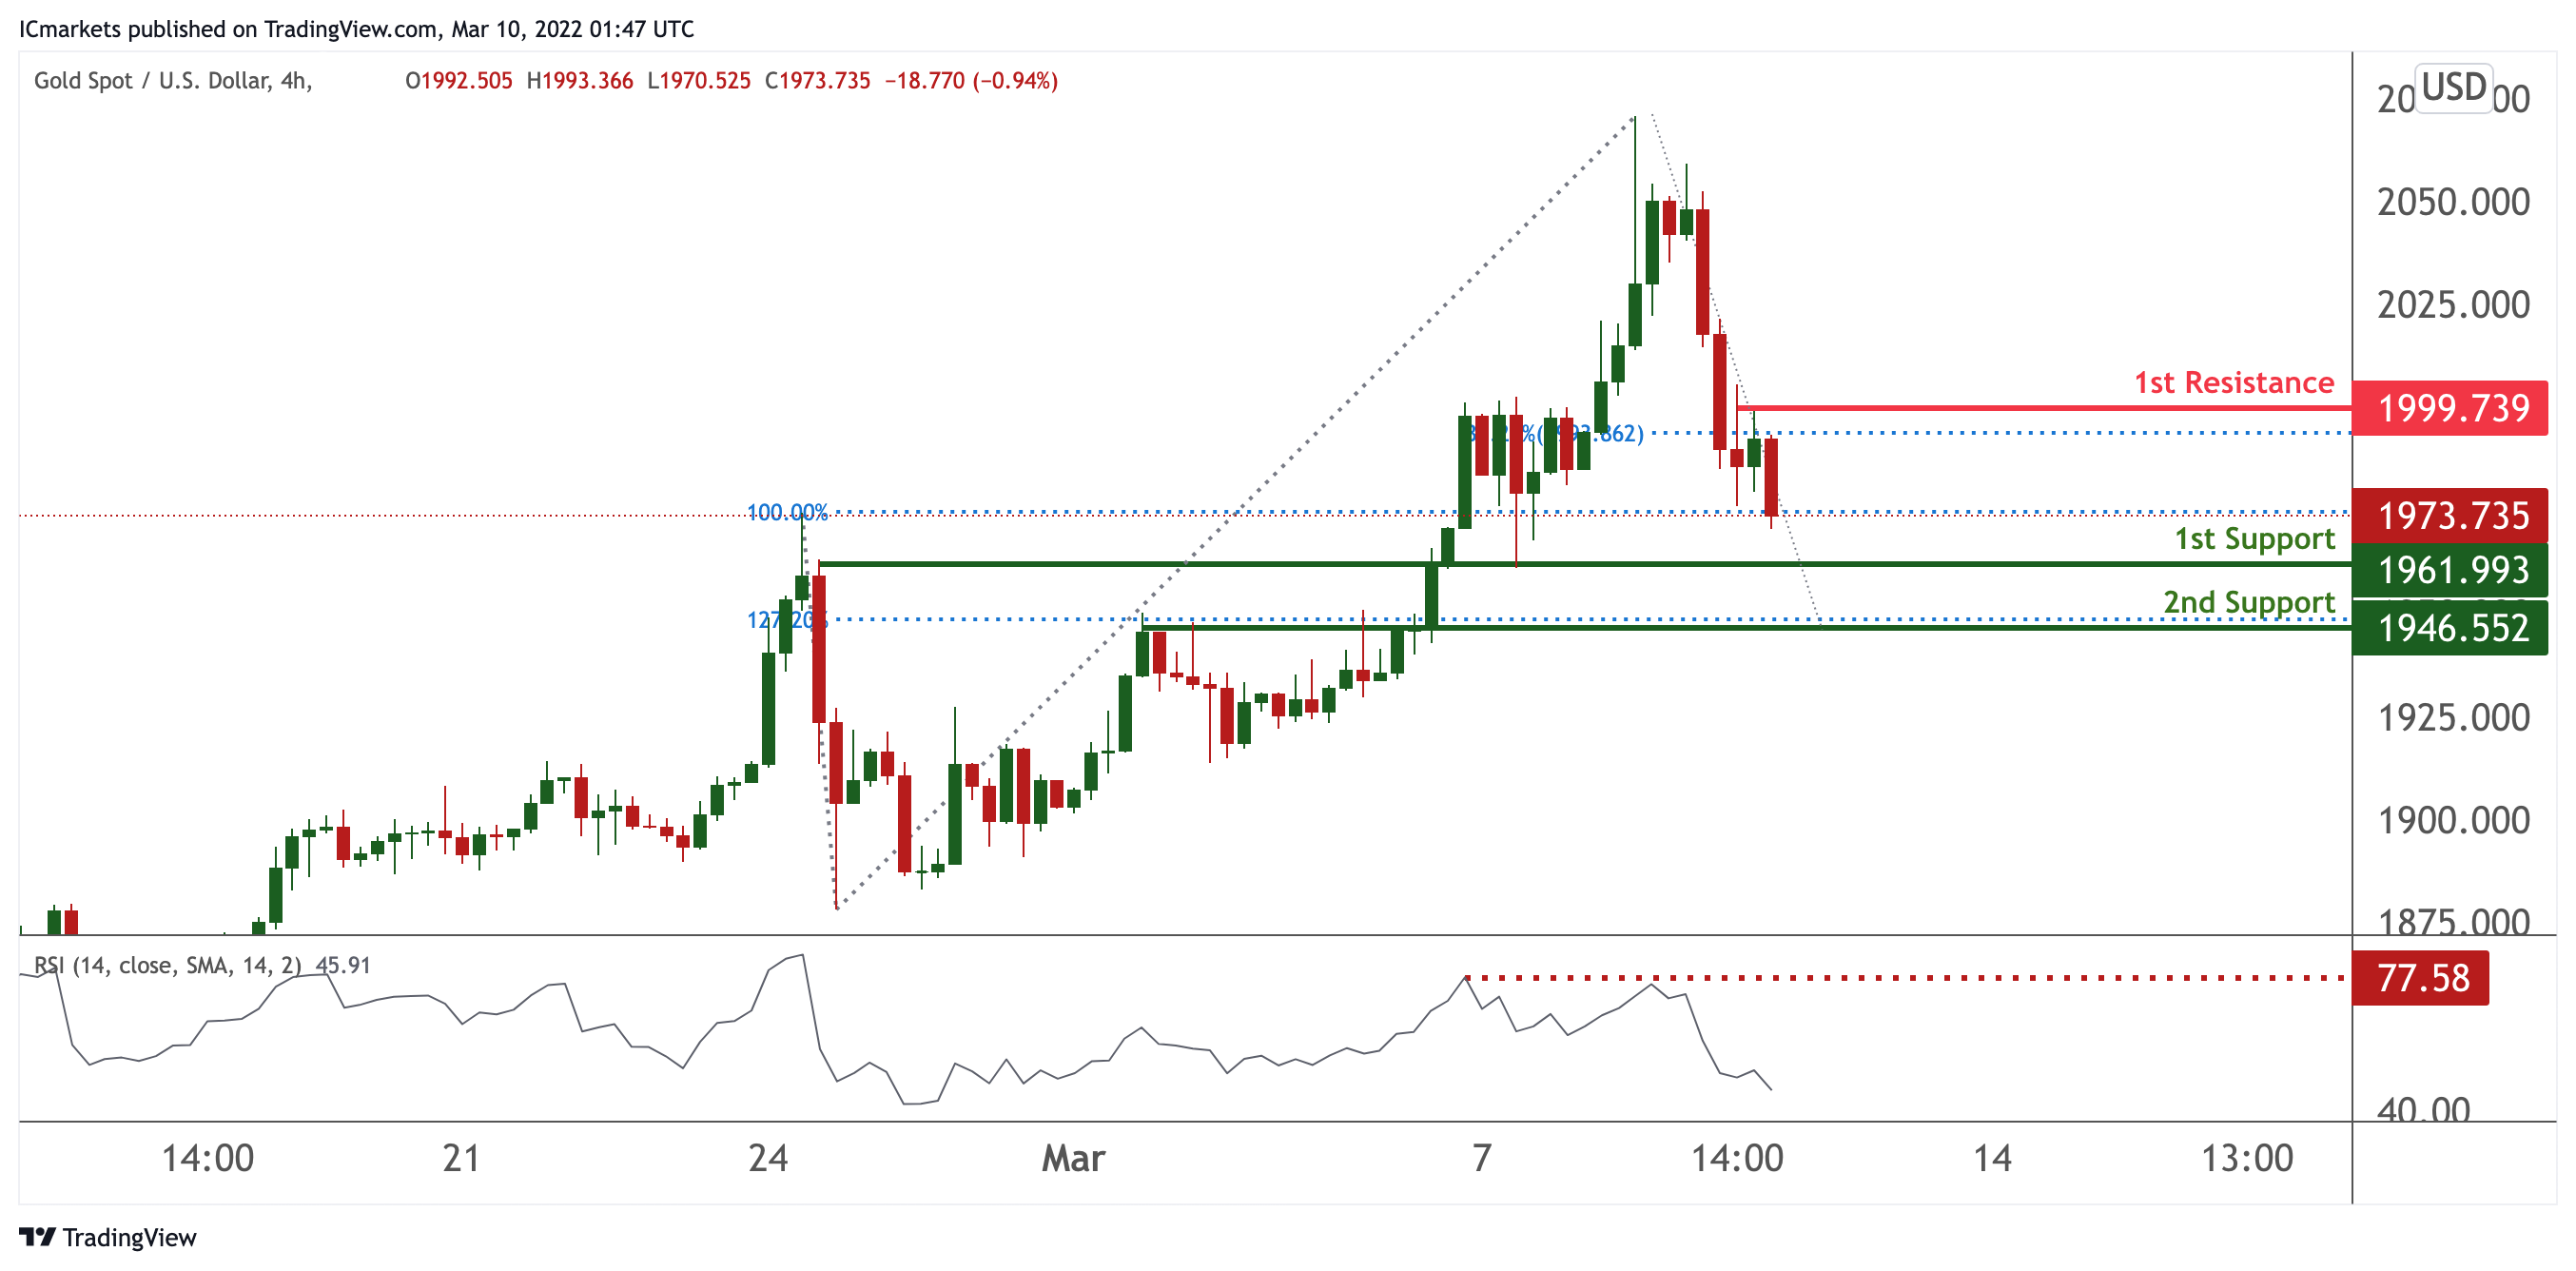
On the H4 chart, prices have recently experienced a strong reversal. We see potential for further bearish continuation from our 1st resistance at 1999.739 in line with 50% Fibonacci retracement towards our 1st support at 1961.993 in line with 100% Fibonacci extension. Divergence is spotted on RSI, further supporting our bearish bias.
Areas of consideration:
- 4h 1st support at 1961.993
- 4h 1st resistance at 1999.739
GBP/USD
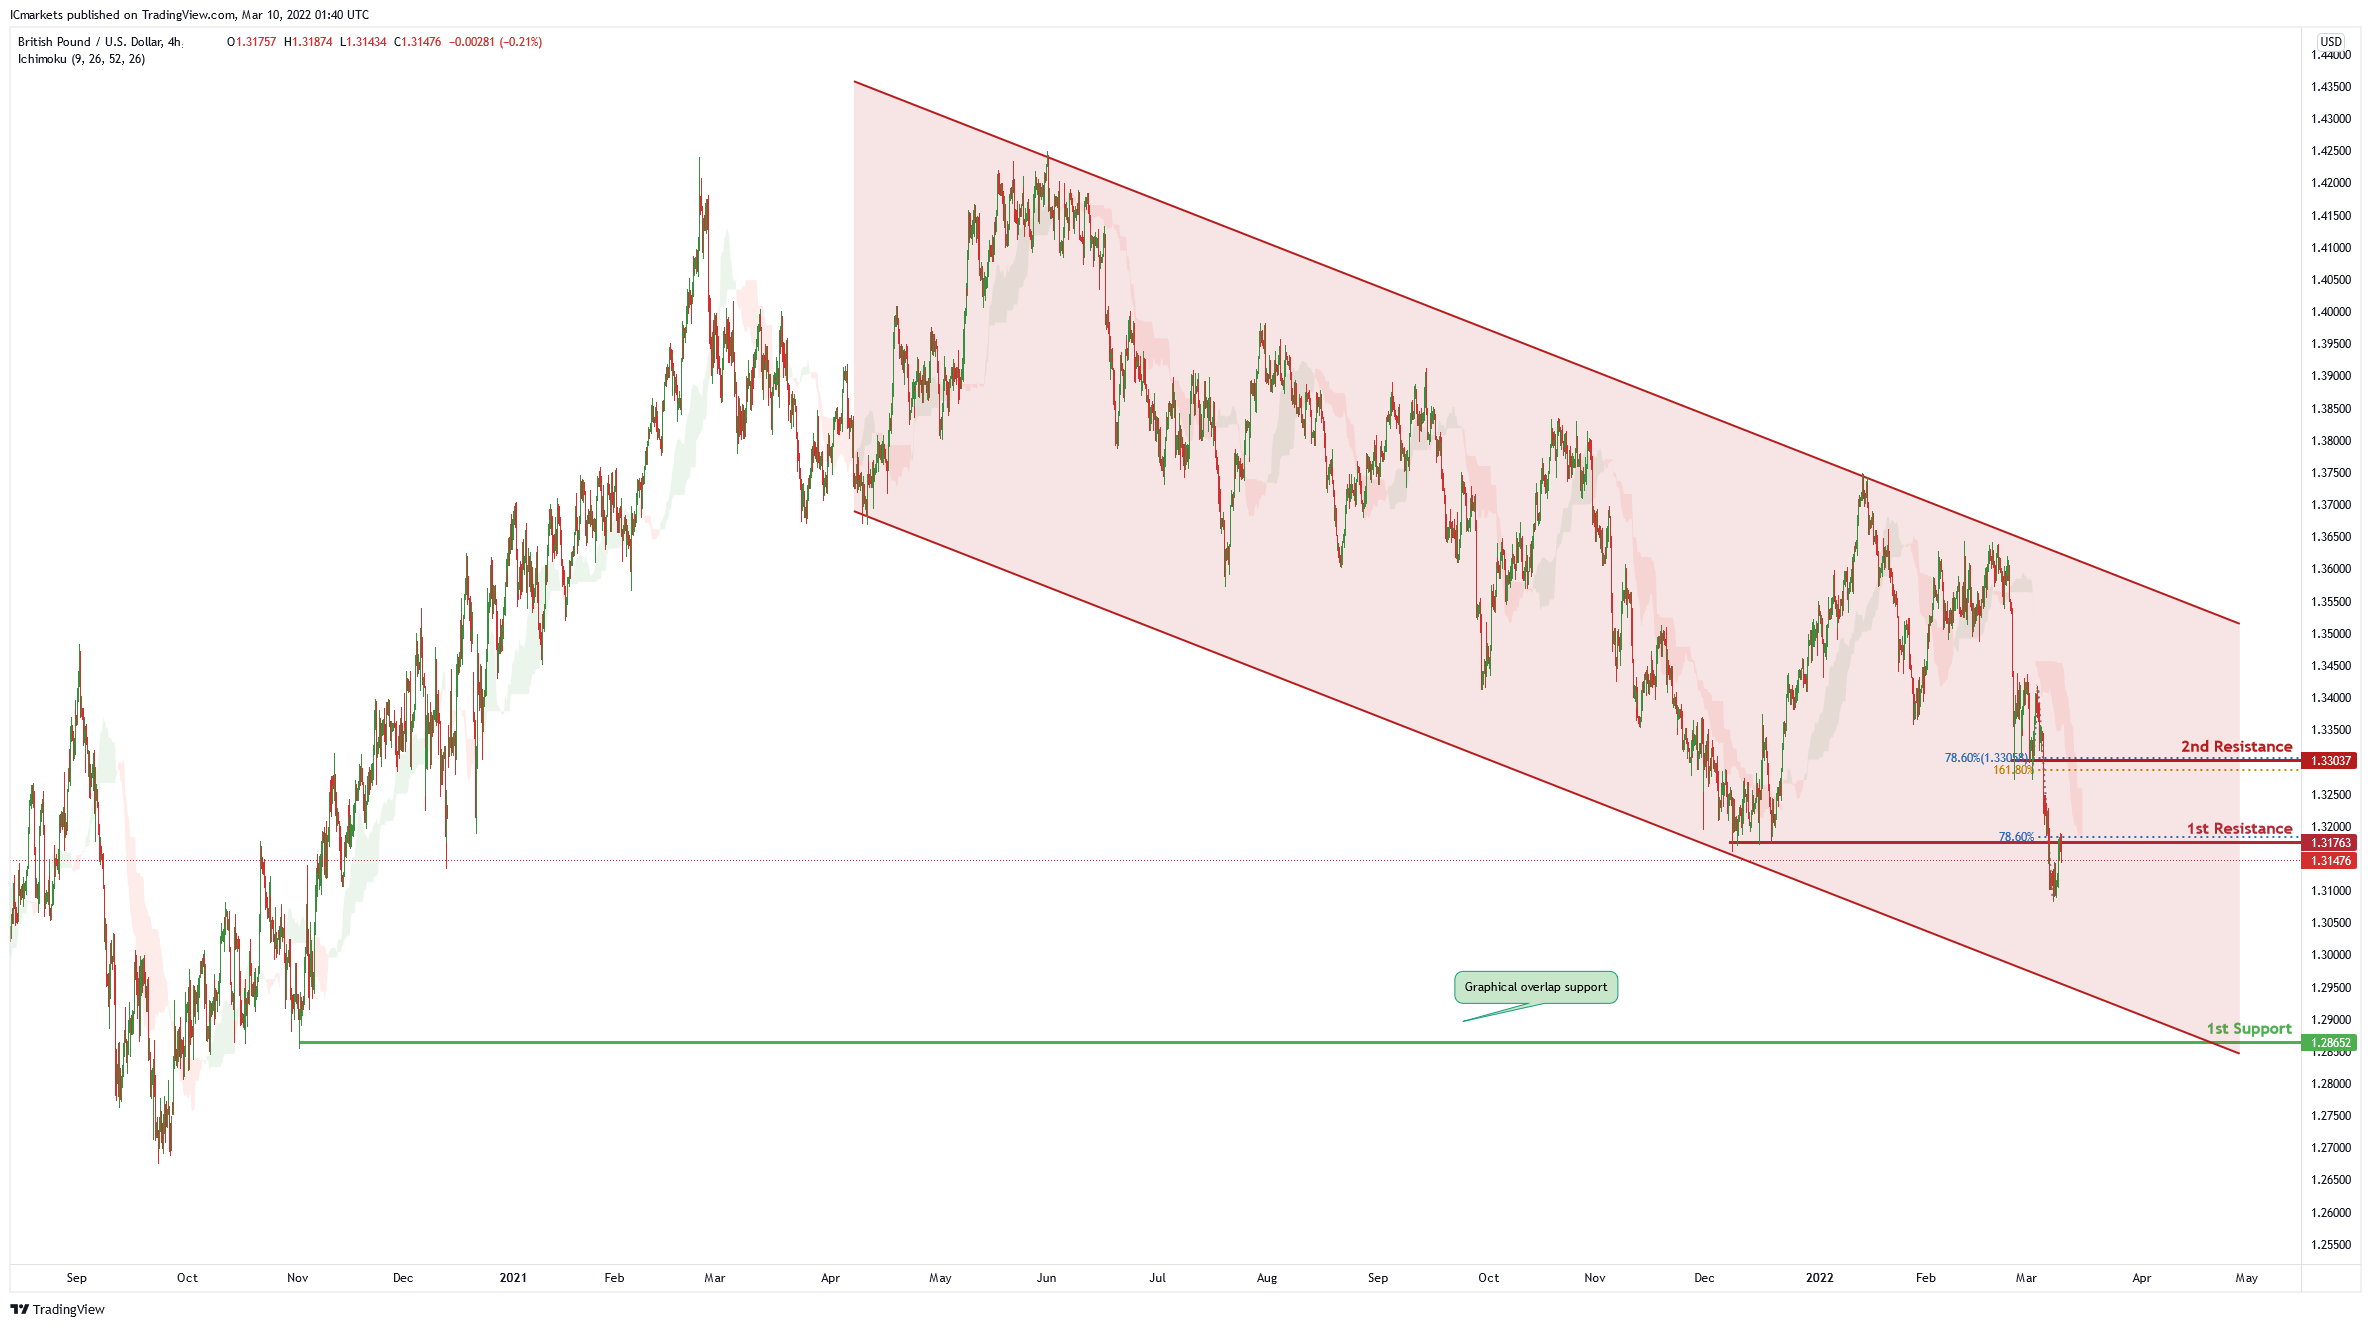
On the H4 chart price is trading in a descending channel and has recently broken the 1st resistance level of 1.31763 in line with 78.6% Fibonacci retracement. Price can potentially dip to the 1st support level of 1.28652 in line which is also the graphical overlap support. Our bearish bias is supported by the ichimoku cloud indicator as price is trading under it.
Areas of consideration
- H4 1st resistance at 1.31763
- H4 1st support at 1.28652
USD/CHF:
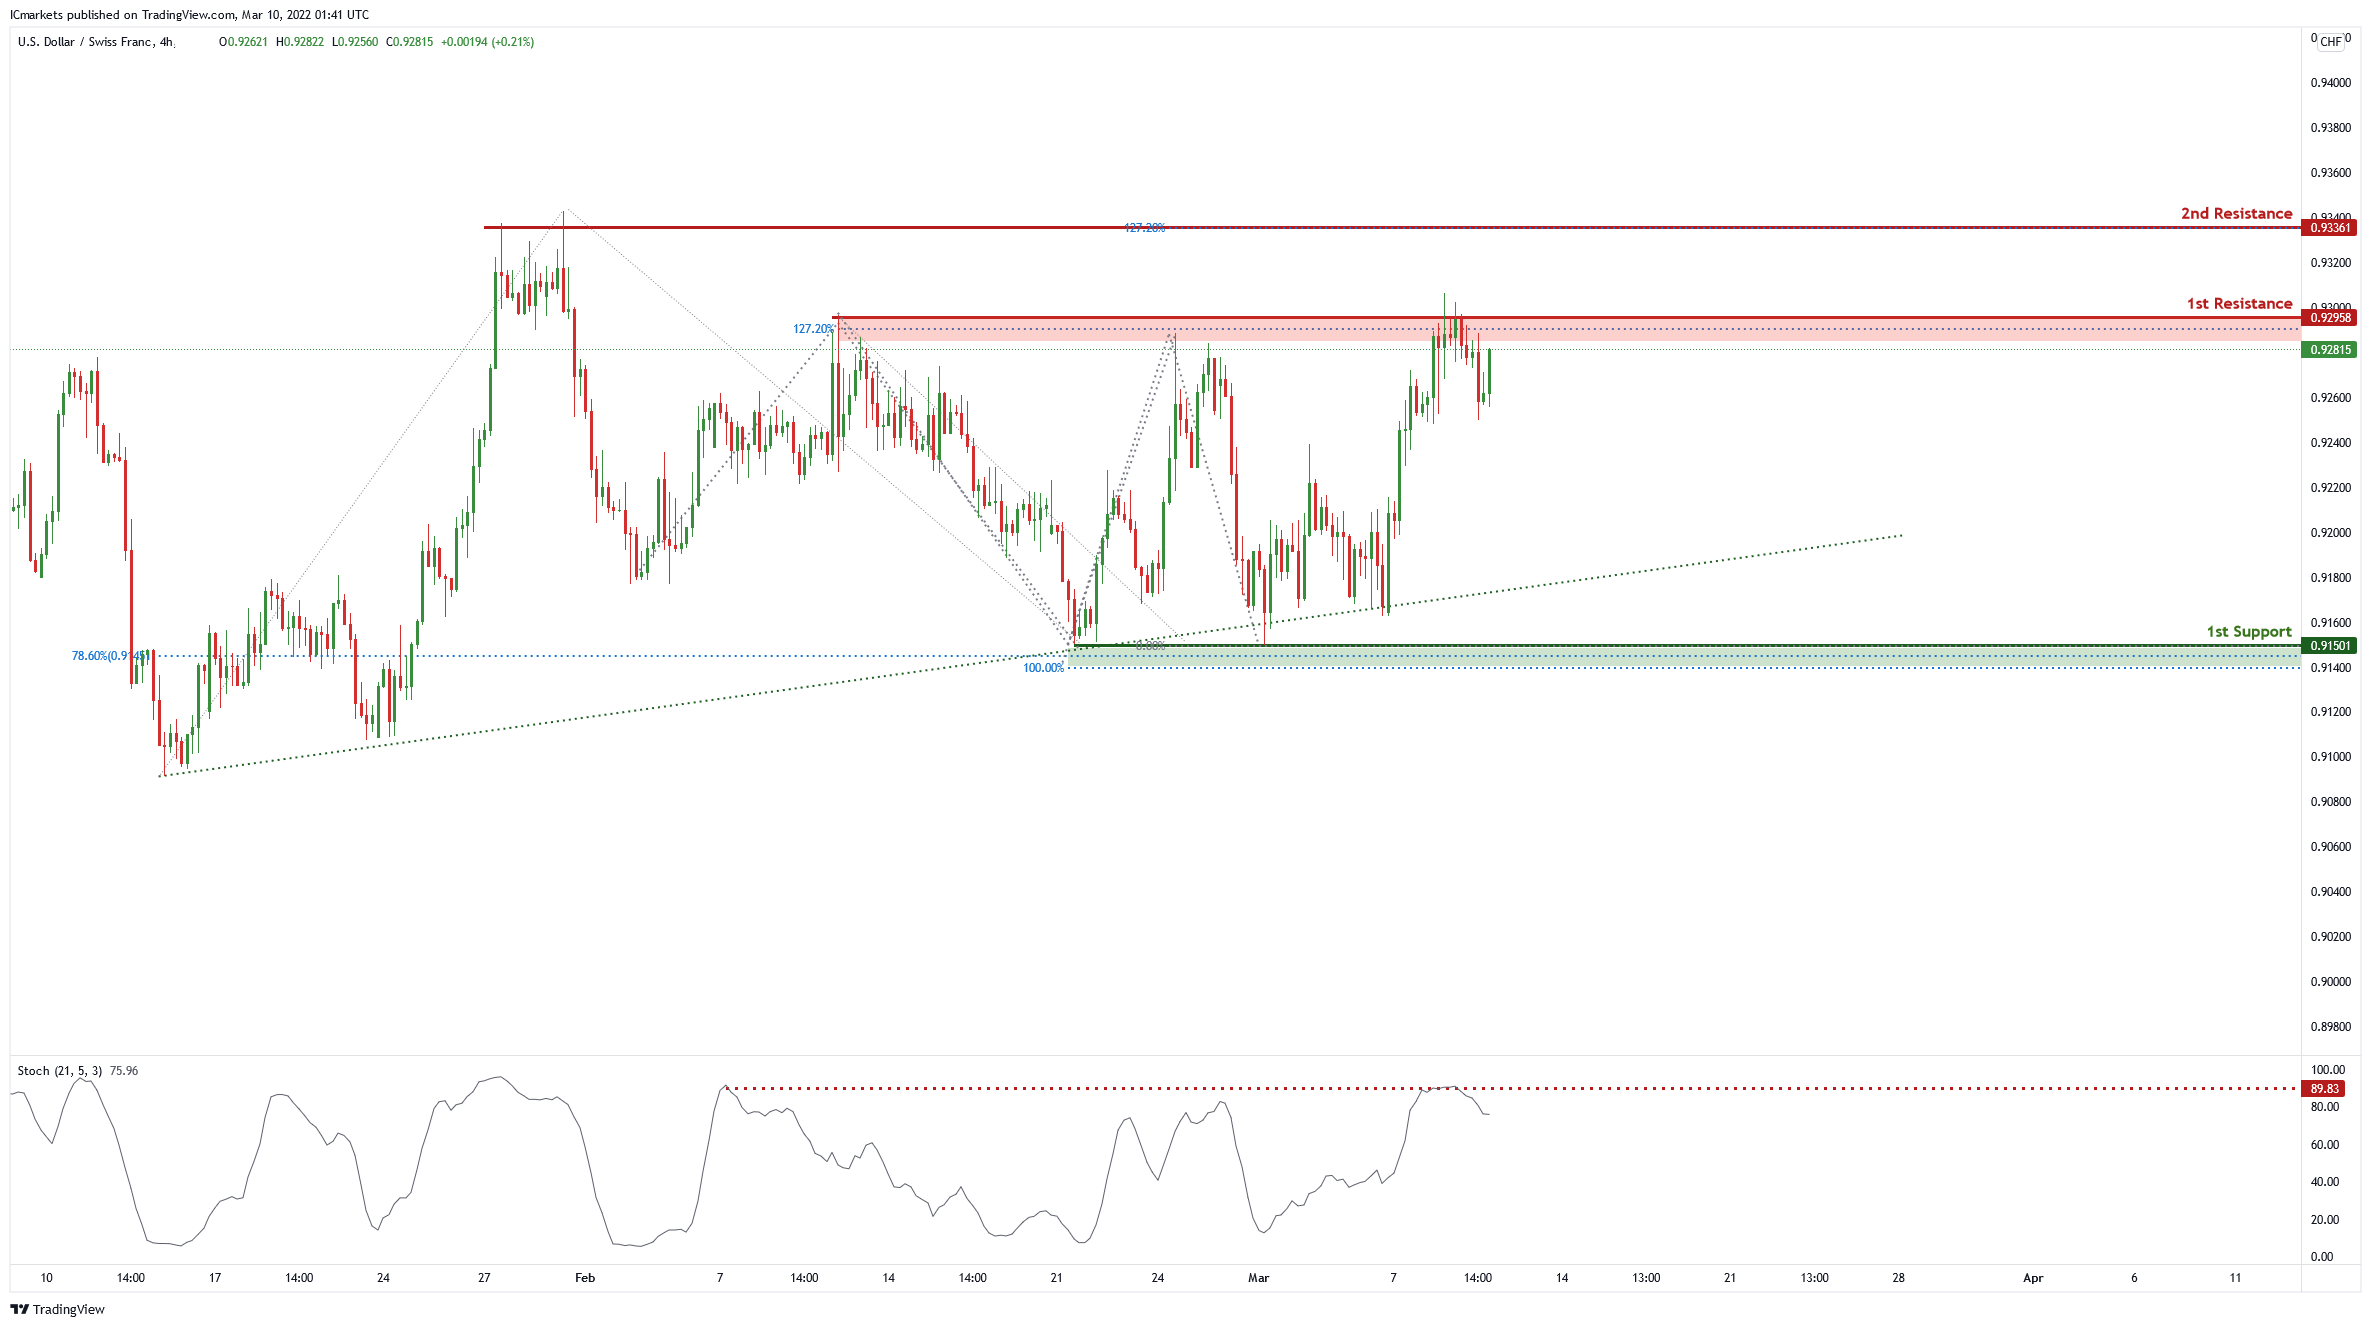
On the H4, price is abiding by an ascending trendline and near 1st resistance level of 0.92833 in line with 127.2% Fibonacci projection . Price can potentially dip to the 1st support level of 0.91501 in line with 100% Fibonacci projection and 78.6% Fibonacci retracement. Our bearish bias is supported by a stochastic indicator as it is near the resistance level.
Areas of consideration
- 1st resistance level at 0.92833
- 1st support level at 0.91501
EUR/USD :
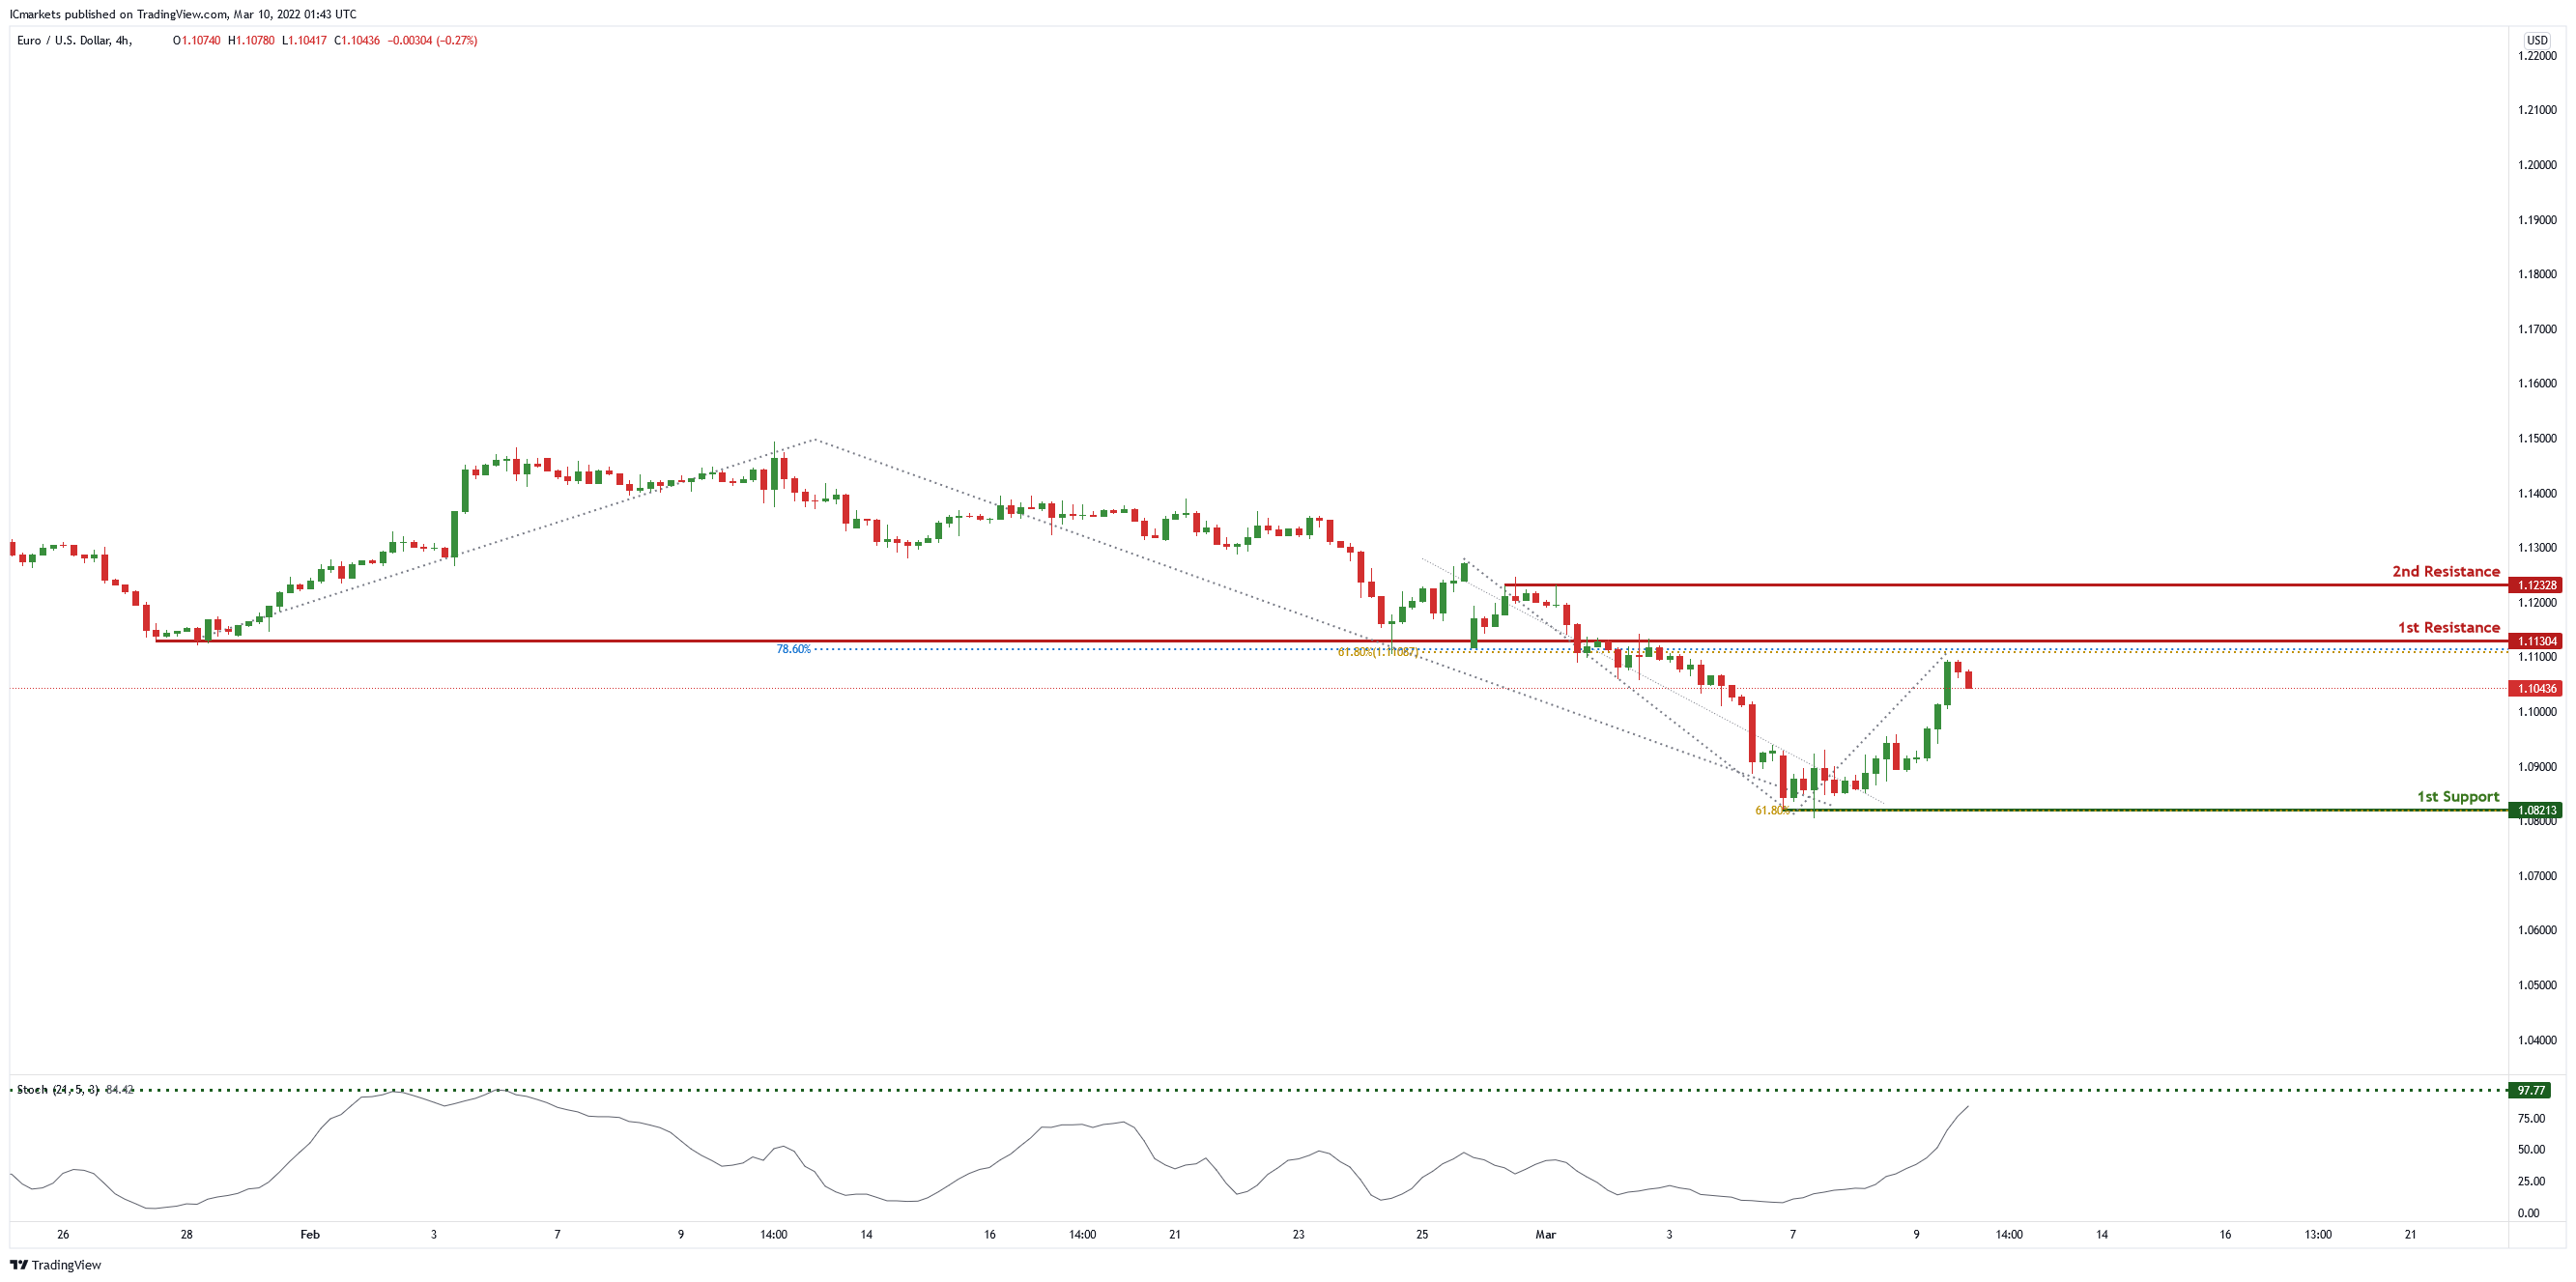
On the H4 price is near 1st resistance level of 1.11304 in line with 78.6% Fibonacci projection and 61.8% Fibonacci retracement. Price can potentially dip to the 1st support level which is the graphical swing low and 61.8% Fibonacci projection. Our bearish bias is supported by the stochastic indicator as it is the graphical swing low and 61.8% Fibonacci projection
Areas of consideration :
- H4 1st resistance at 1.11304
- H4 1st support at 1.08213
USD/JPY:
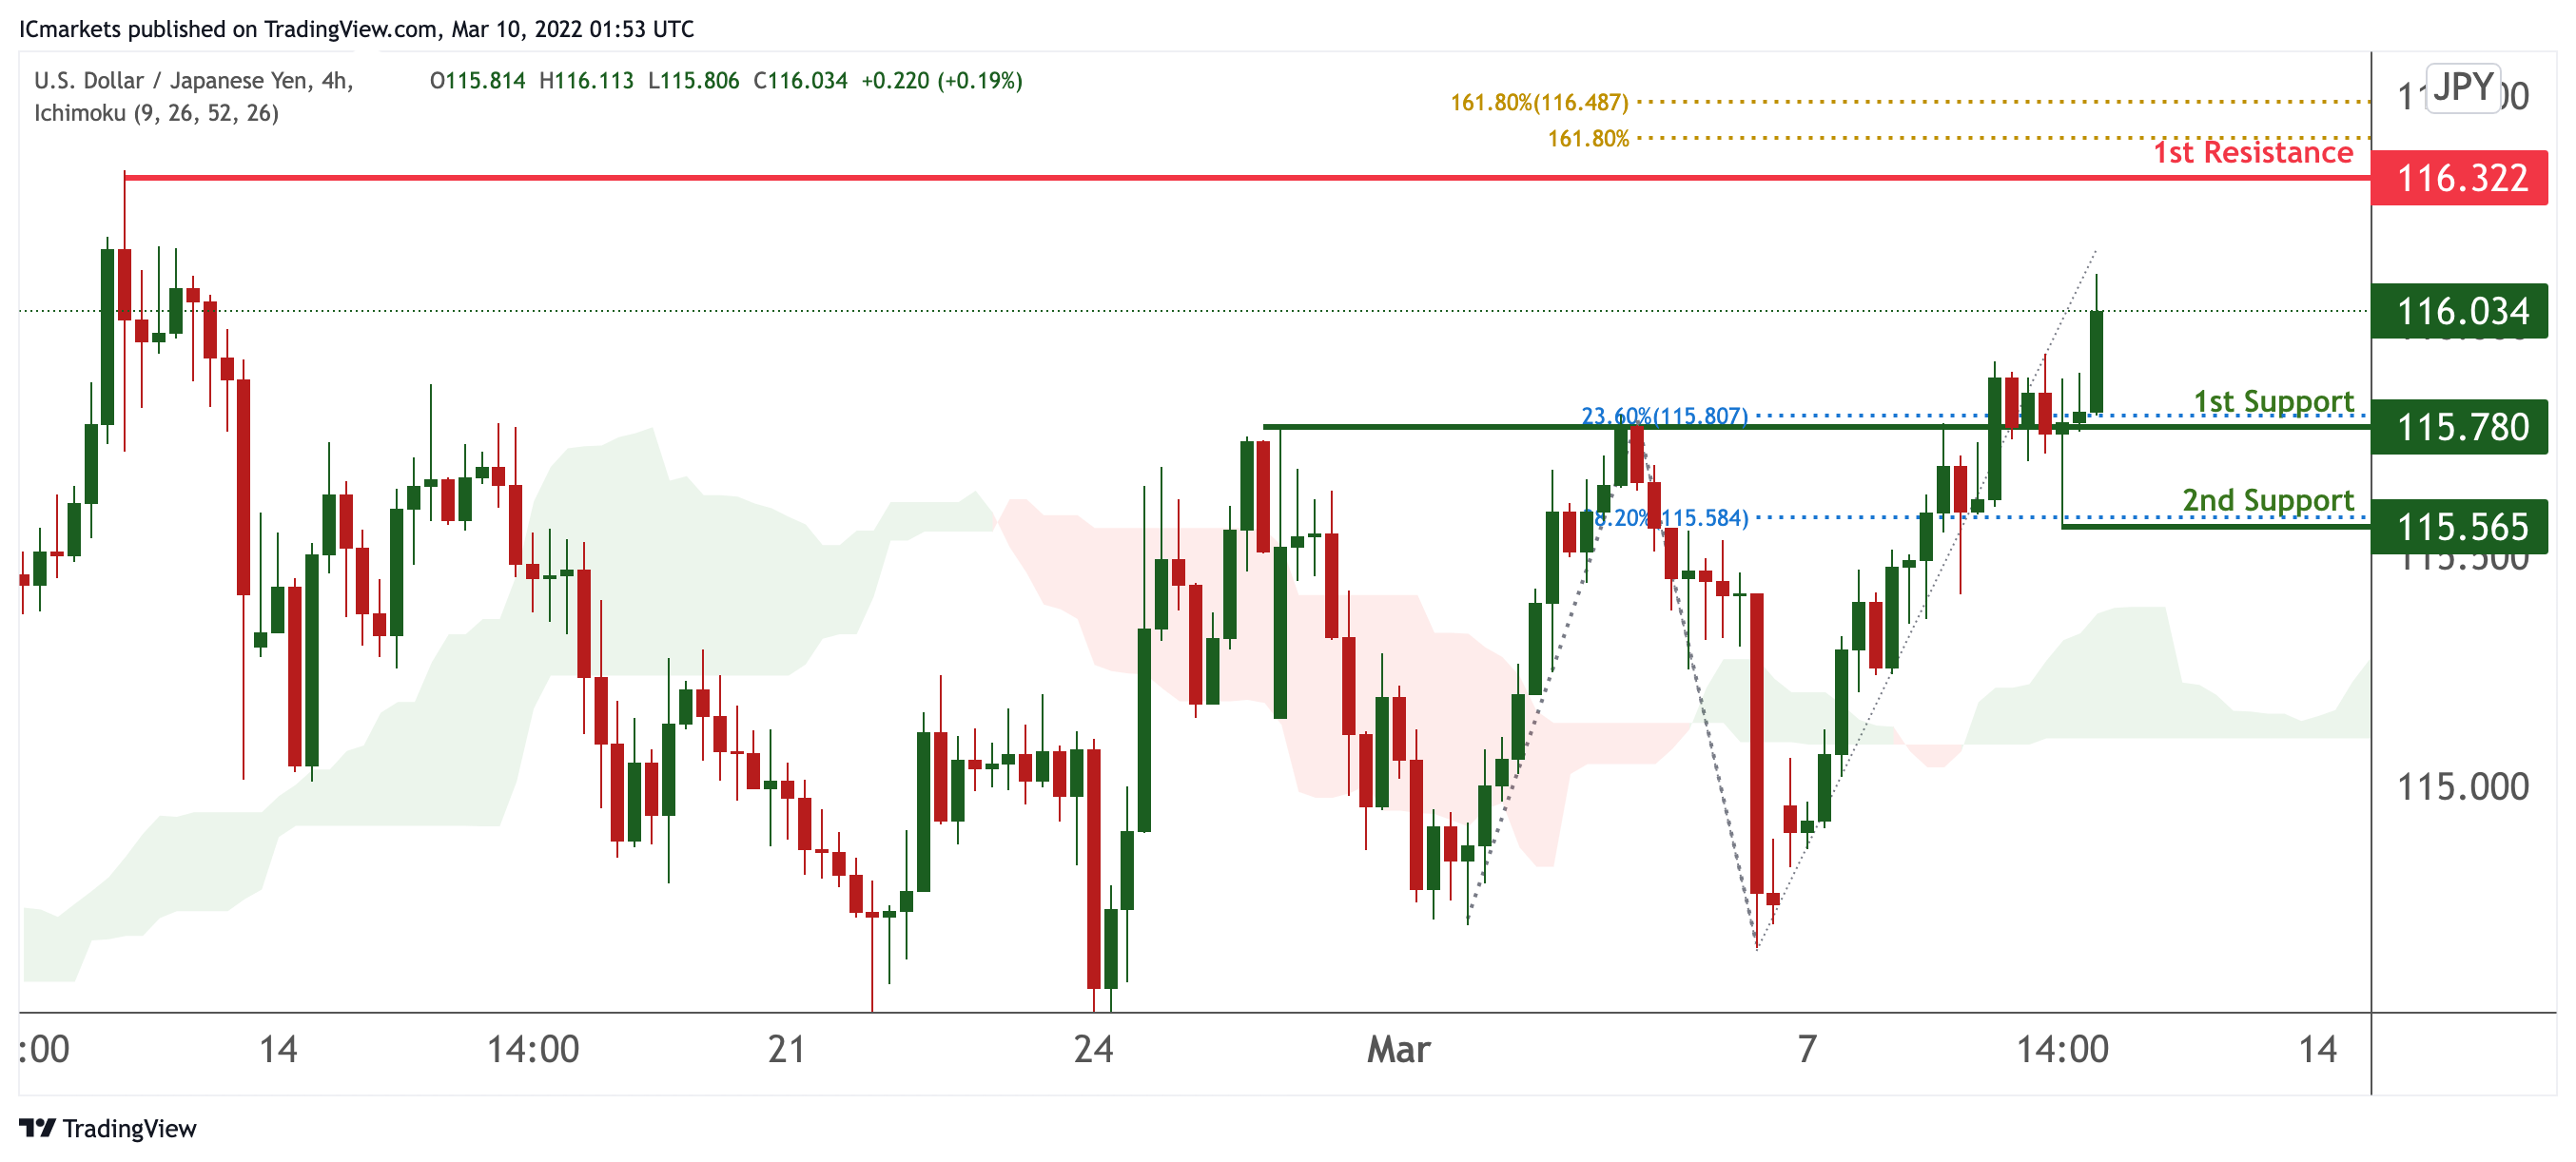
On the H4 timeframe, prices are on bullish momentum. We see the potential for further bullish momentum from our 1st support at 115.780 in line with 23.6% Fibonacci retracement and 100% Fibonacci extension towards our 1st resistance at 116.322 in line with 161.8% Fibonacci extension and 161.8% Fibonacci Projection. Our bullish bias is further supported by prices trading above our ichimoku cloud support. Alternatively, prices may dip towards our 2nd support at 115.565 in line with 38.2% Fibonacci retracement.
Areas of consideration:
- H4 time frame, 1st resistance at 116.322
- H4 time frame, 1st support at 115.780
AUD/USD:
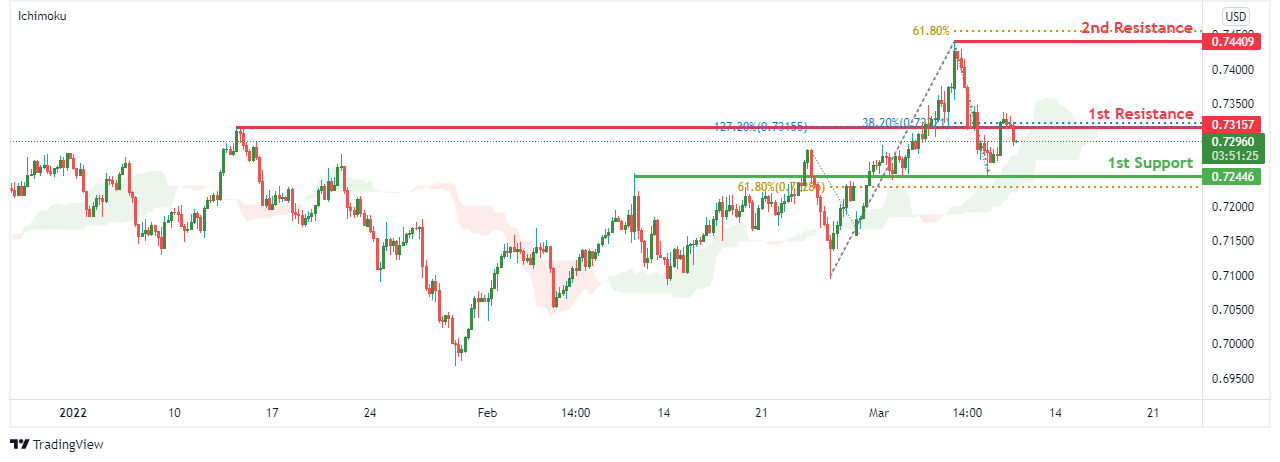
On the H4 timeframe, price is abiding by an ascending trendline. We see the potential for further bullish momentum from our 1st resistance at 0.73157 in line with 38.2% Fibonacci retracement and 127.2% Fibonacci extension towards our 2nd resistance at 0.74409 which is in line with 61.8% Fibonacci projection. Our bullish bias is further supported by prices trading above the Ichimoku cloud. Alternatively, prices from 1st resistance might dip to 1st support at 0.72446 with a 61.8% Fibonacci retracement.
Areas of consideration :
- H4 1st support at 0.72446
- H4 1st resistance at 0.73157
NZD/USD:
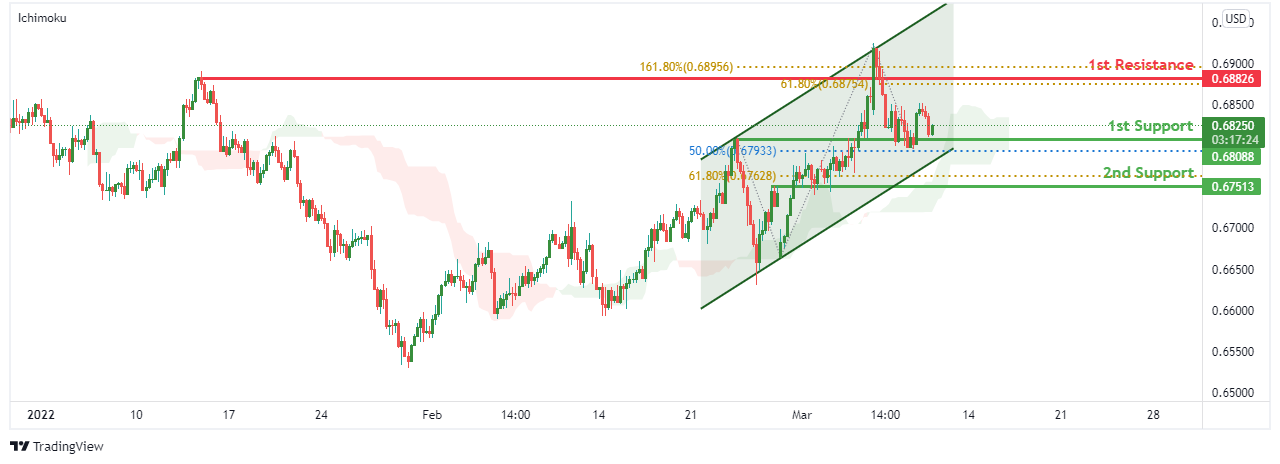
On the H4 chart, prices are abiding by the ascending channel. We see the potential for further bullish momentum from our 1st support at 0.68250 in line with 50% Fibonacci retracement towards our 1st resistance at 0.68826 with 61.8% Fibonacci retracement and 161.8% Fibonacci extension. Our bullish bias is further supported by prices trading above our ichimoku cloud support. Alternatively, prices may dip towards our 2nd support at 0.67513 in line with 61.8% Fibonacci retracement.
Areas of consideration:
- H4 time frame, 1st resistance at 0.68826
- H4 time frame, 1st support at 0.68250
USD/CAD:
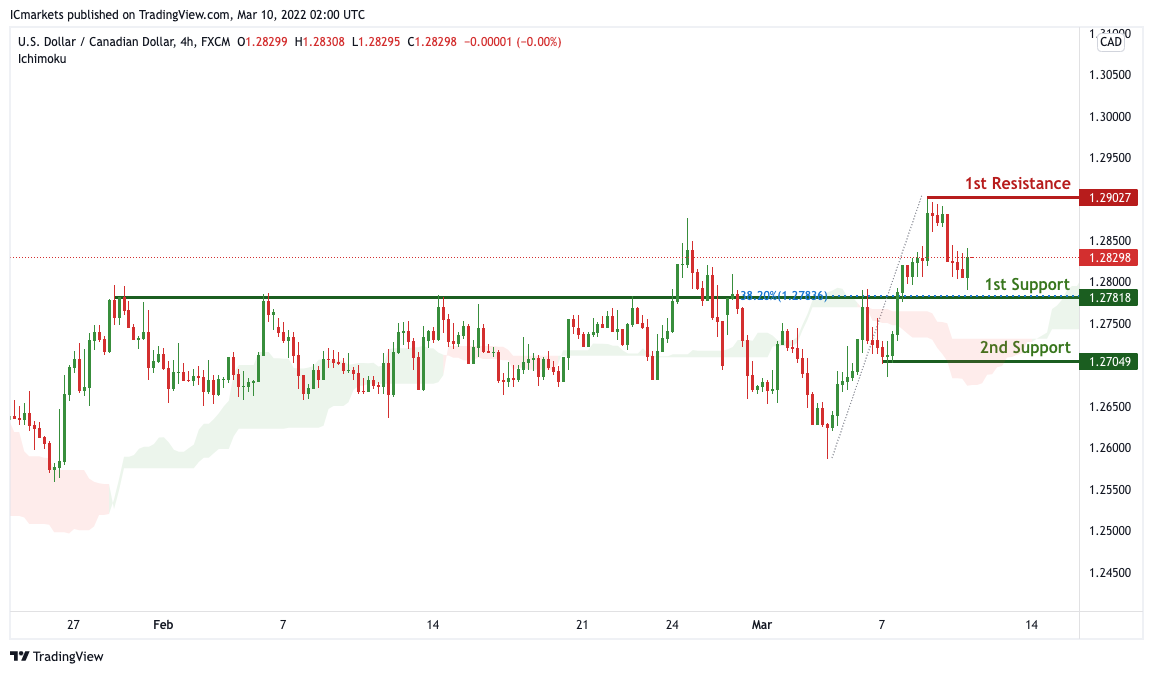
On the H4 timeframe, price is near 1st support level of 1.27818 in line with horizontal overlap support and 38.2% Fibonacci retracement. Price can potentially rise to the 1st resistance level of 1.29027 in line with the swing high resistanc. Alternatively, price may break 1st support and head for 2nd support at 1.27049 where the swing low support. Our bullsh bias is supported by how price is moving above the ichimoku cloud.
Areas of consideration:
- H4 time frame, 1st support at 1.27818
- H4 time frame, 1st resistance at 1.29027
OIL:
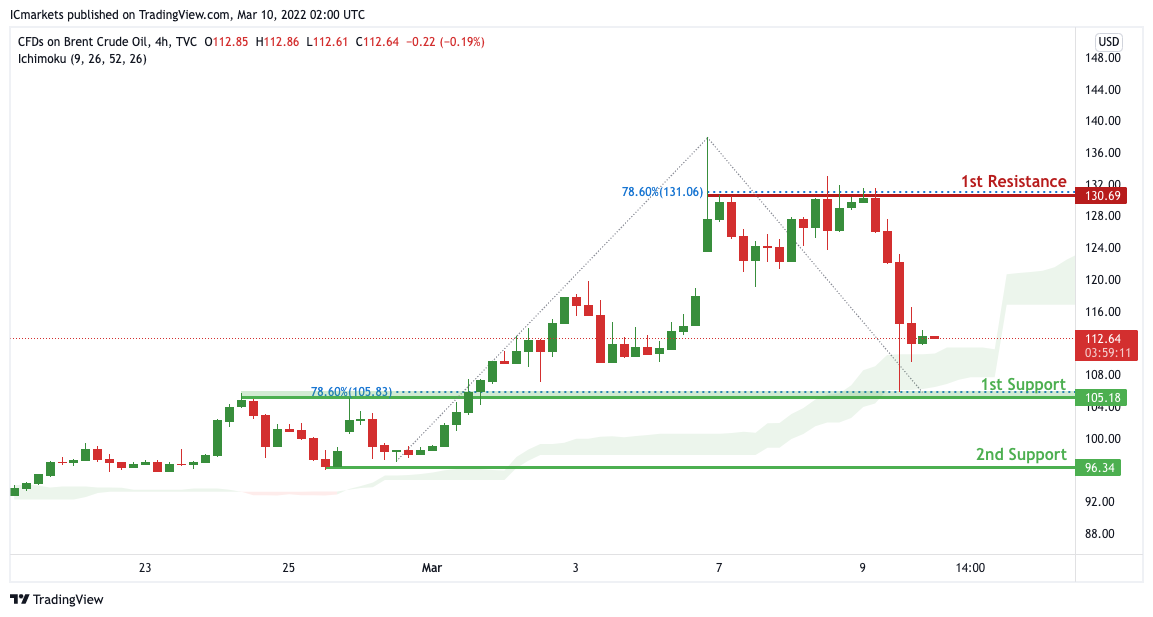
On the H4 timeframe, price is near 1st support level of 105.18 in line with horizontal overlap support and 78.6% Fibonacci retracement. Price can potentially rise to the 1st resistance level of 130.69 in line with the swing high resistance and 78.6% Fibonacci retracement. Alternatively, price may break 1st support and head for 2nd support at 96.34 where the swing low support. Our bullish bias is supported by how price is moving above the ichimoku cloud.
Areas of consideration:
- H4 time frame, 1st resistance of 130.69
- H4 time frame, 1st support of 105.18
Dow Jones Industrial Average:
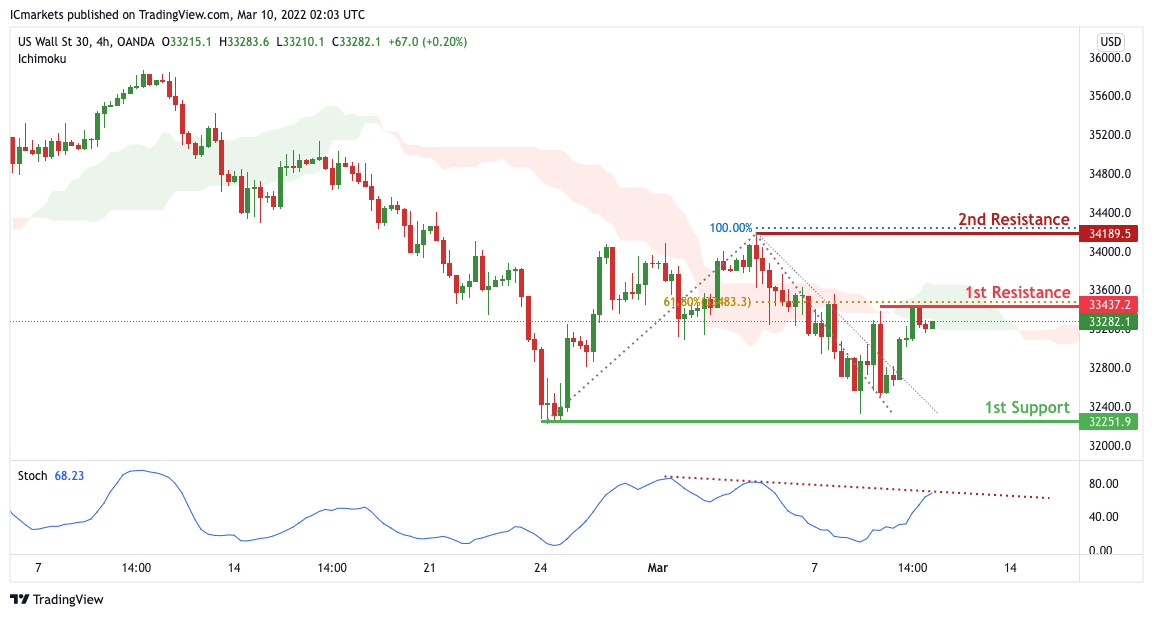
On the H4 timeframe, with price at the resistance of the ichimoku cloud, we have a bearish bias that price will drop from 1st resistance at 33437 in line with the 61.8% Fibonacci retracement to 1st support at 32251 in line with the swing low support .Alternatively, price may break pivot structure and head for 2nd support in line with the 100% Fibonacci projection. Our bearish bias is supported by how price is expected to reverse off the stochastics indicator.
Areas of consideration :
- H4 1st support at 32251
- H4 1st resistance at 33437
Can UK Data Provide Some Relief to Battered Sterling?
The pound has fallen victim to the market turmoil sparked by the Ukraine conflict, plunging more than 3.5% since late February when tensions with Russia started to rapidly escalate. Investors still expect that the Bank of England will go ahead with most of its planned rate hikes this year, but that’s likely to come at the expense of growth. Can the raft of economic indicators out of the UK on Friday (07:00 GMT) cast some positive light over the outlook?
Going from crisis to crisis
Having only just fully recovered from the pandemic-induced slump, the British economy is facing another crisis. The war in Ukraine has worsened Europe’s energy crunch, fuelling the surge in oil and gas prices. But unfortunately, the ripple effects go beyond the energy sector as raw material prices of everything from food to base metals are soaring as Western sanctions on commodity-rich Russia begin to bite on the rest of the world.
Although Britain is nowhere near as reliant on Russia for its energy needs as several Eurozone nations are, UK fuel prices are expected to skyrocket soon, exacerbating the squeeze on consumers, who will additionally be hit by higher national insurance contributions as of April. So far neither the government nor the Bank of England have indicated they are about to change their policy courses.
Is hawkish BoE adding to pound’s woes?
This could be why sterling has nosedived so much as investors think the BoE is headed for a policy mistake by tightening at a time when the growth outlook is fast deteriorating. Unlike the European Central Bank, which has signalled it is willing to overlook the jump in energy prices that are being driven by factors that are out of its control, the BoE will probably only pause its rate hike cycle once growth starts to significantly slow down.
While it’s true that the UK economy is a little more robust than the Eurozone’s at the moment, it’s unlikely to be as resilient as America’s during this crisis. Nevertheless, the latest economic pointers due on Friday might help ease some of the concerns if they show that 2022 got off to a solid start.
Modest GDP rebound anticipated for January
GDP is projected to have bounced back by 0.2% month-on-month in January after contracting by the same amount in December when Omicron restrictions were introduced. Such a figure would push up annual growth to 9.3% from 6.0%.
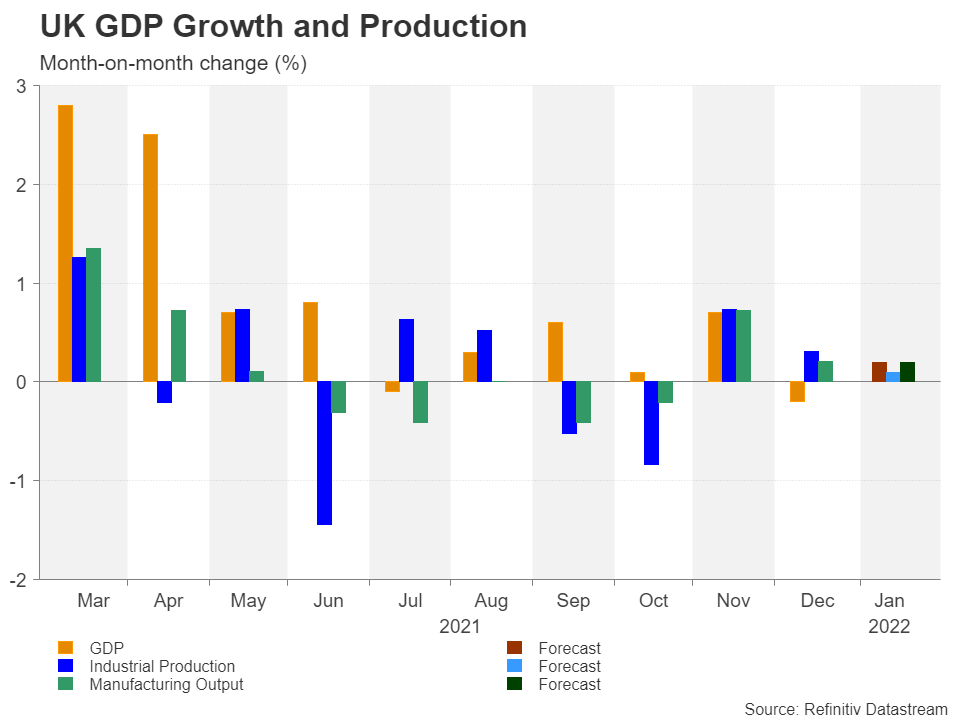
Industrial output on the other hand is expected to have grown by a paltry 0.1% m/m in January, driven mainly by the manufacturing sector, which is forecast to have expanded by 0.2%.
Other figures to be released will include the trade balance and construction output for the same period.
Pound’s fate tied to Ukraine war
It’s hard to see the data having much of an impact on cable while tensions over Ukraine remain so heightened. At best, stronger-than-expected numbers might provide some much-needed support. In which case, the 123.6% Fibonacci extension of the December-January upleg could act as a crucial defence for halting further declines just above the $1.30 level at $1.3027.
If this support were to fail, the 138.2% and 161.8% Fibonacci extensions at $1.2942 and $1.2805, respectively, would next come into focus.
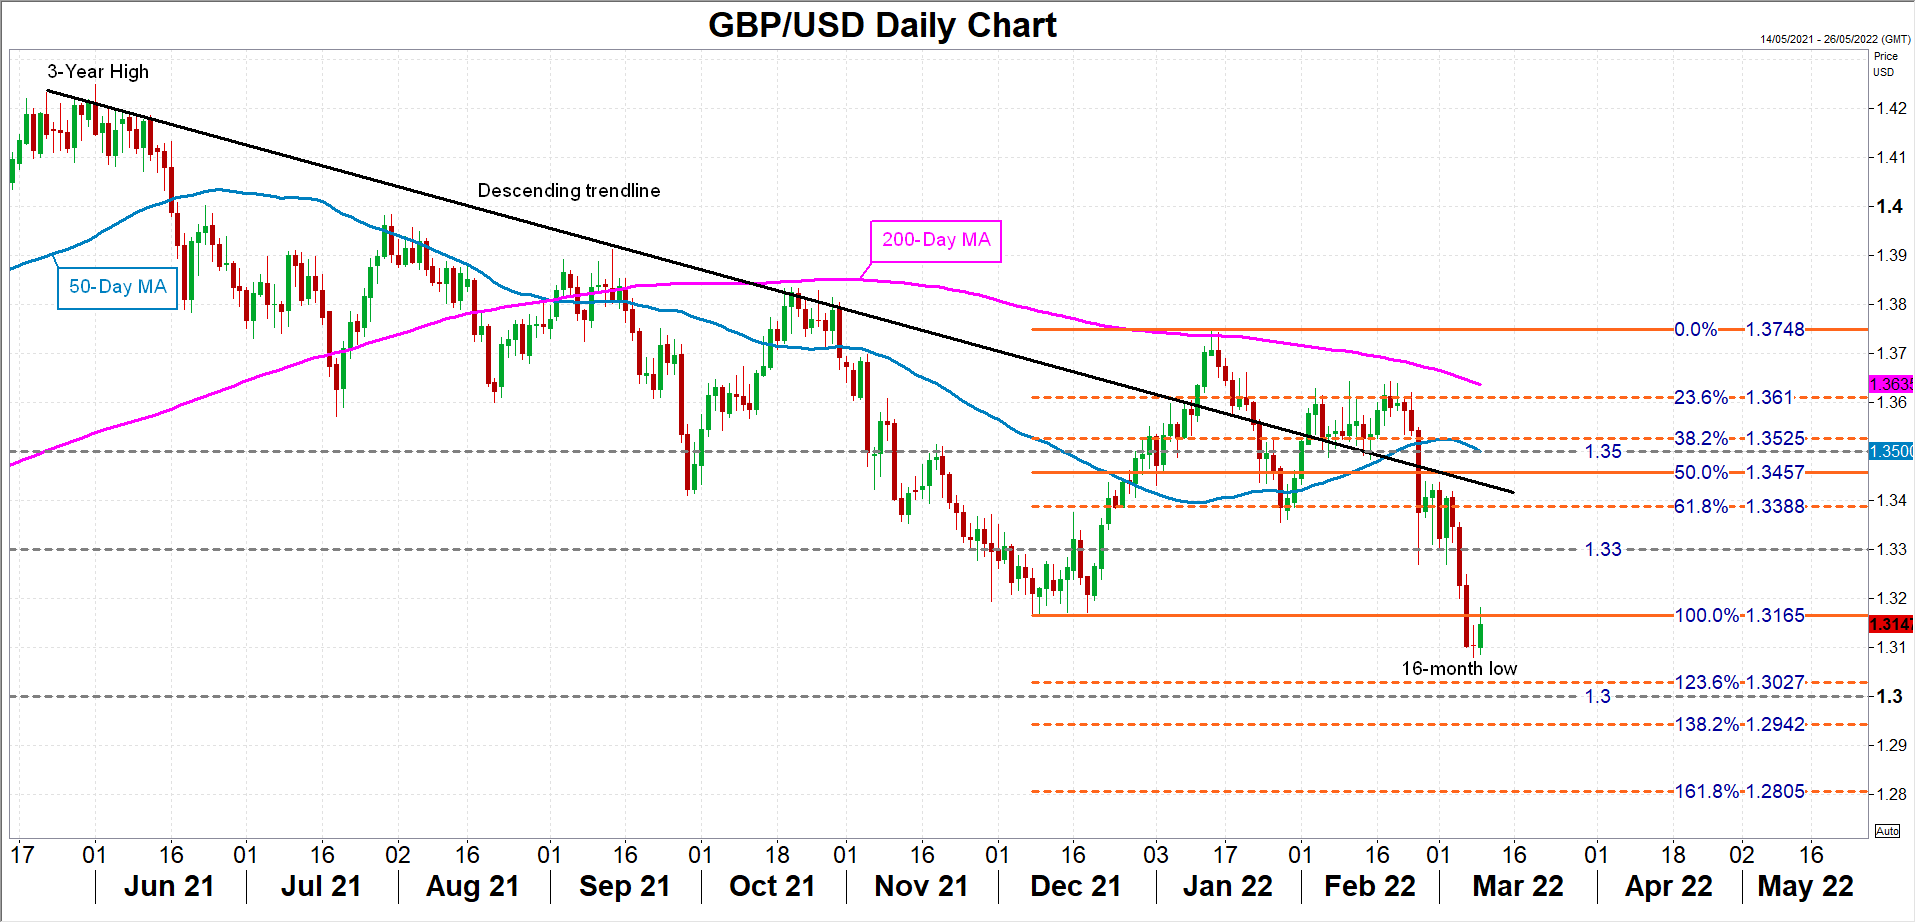
However, in the event that there is progress in the upcoming talks between the Ukrainian and Russian foreign ministers on Thursday, the pound would be poised for a decent rebound, potentially recovering towards the $1.3165 area initially, before testing the $1.33 handle.
In the bigger picture, though, sterling is likely to remain bearish as long as it’s trading below its long-term descending trendline, with not even BoE rate hikes expected to alter this outlook as long as war is raging in Eastern Europe.