Sample Category Title
ECB de Guindos: We will readjust asset purchases if needed
ECB Vice President Luis de Guindos said asset purchases need to be completed before interest rates can rise. However, "we will look at the data, the projections and then we will readjust asset purchases if needed and will see when an interest rate hike can take place."
Governing Council member Bostjan Vasle said the Eurofi Magazine, "The time seems right for our monetary policy to move out of crisis mode and start the process of gradual normalisation."
"With the return of economic activity to the pre-crisis level, looming labour shortages and in part structural pressures on energy prices, our monetary policy needs to start rebuilding its space to be ready to respond to the next business cycle," Vasle added.
NZD Flies as Risk Appetite Returns
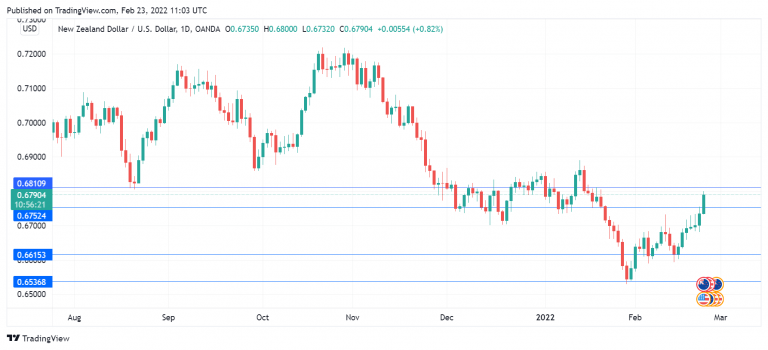
The New Zealand dollar has accelerated its rally, and is up 0.86% on the day, as NZD/USD trades just shy of the 0.68 level.
Sanctions softer than expected
The US and other western nations have slapped further sanctions on Russia, after Moscow sent troops to two breakaway regions in eastern Ukraine. Still, the financial markets breathed a sigh of relief as the sanctions were less severe than expected. Perhaps the most notable response was from Germany, which has suspended the Nord Stream 2 pipeline, which is intended to deliver Russian natural gas to Europe.
The US has canceled a meeting between the US Secretary of State and the Russian Foreign Minister, and a Biden-Putin summit will not take place, given the volatile situation in Ukraine. Nonetheless, the US response leaves Putin with a possibility of climbing down the tree and risk appetite has improved, at least for now. That has boosted risk-sensitive currencies such as the New Zealand dollar, which has climbed to a 1-month high.
Closer to home, the RBNZ raised rates today as was widely expected. This marks a third straight hike of 0.25%, bringing the cash rate to 1.00%. The central bank is committed to lowering inflation, which has been buoyed by surging energy prices and a red-hot housing market. The rate statement was hawkish, with the RBNZ stating it would start quantitative tightening by reducing its balance sheet. This is another step in the normalization of monetary policy by the RBNZ.
How far will the RBNZ go with its tightening cycle? There is a divergence of opinion from economists as to what will be the peak of the cash rate, with a range of 2.50%-3%. The RBNZ will be the first to admit that inflation and the tightness in the labor market have surprised to the upside. Inflation has hit 5.9%, almost double the upper limit of the bank’s inflation target of 3%. The outlook does not appear favorable for inflation easing anytime soon, with oil poised to break the USD 100 barrier and a weak New Zealand dollar. This means we can expect the central bank to be aggressive in its rate policy this year and in 2023.
NZD/USD Technical
- NZD/USD is testing resistance at 0.6752 and closing in on resistance at 0.6810. Above, there is resistance at 0.6889
- 0.6615 is providing support, followed by 0.6536
Aussie Rises to One-Month High on Fresh Risk Mode, Solid Australian Data
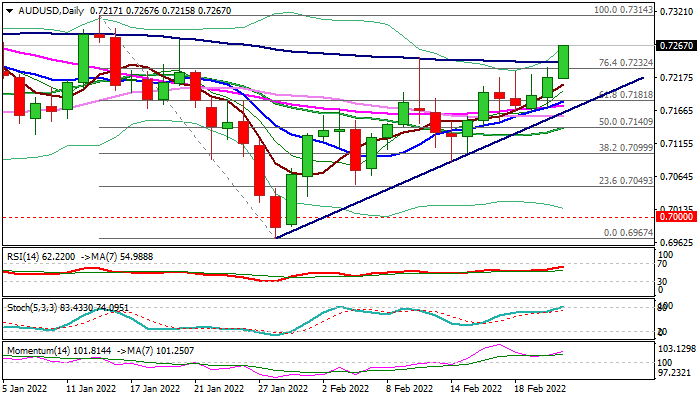
The Australian dollar surges to one-month high on Wednesday, lifted by fresh risk demand and growth of Australian wages in Q4.
The pair extends advance into third consecutive day, with today’s break of pivotal barriers at 0.7232 (Fibo 76.4% of 0.7314/0.6967) and 0.7240 (100DMA) generating strong bullish signal.
Close above these levels will confirm signal and open way for final push towards key resistances at 0.7314/39 (2022 high of Jan 13 / falling 200DMA).
Fresh positive momentum on daily chart and multiple moving averages’ bull-crosses underpin the action.
Solid supports at 0.7248/40/34 (Feb 10 spike high / broken 100DMA / broken Fibo 76.4%) should ideally contain and keep the downside protected.
Res: 0.7276; 0.7293; 0.7314; 0.7339
Sup: 0.7240; 0.7215; 0.7180; 0.7165
Gold Eases Below 20-Period SMA, Creating Bearish Correction
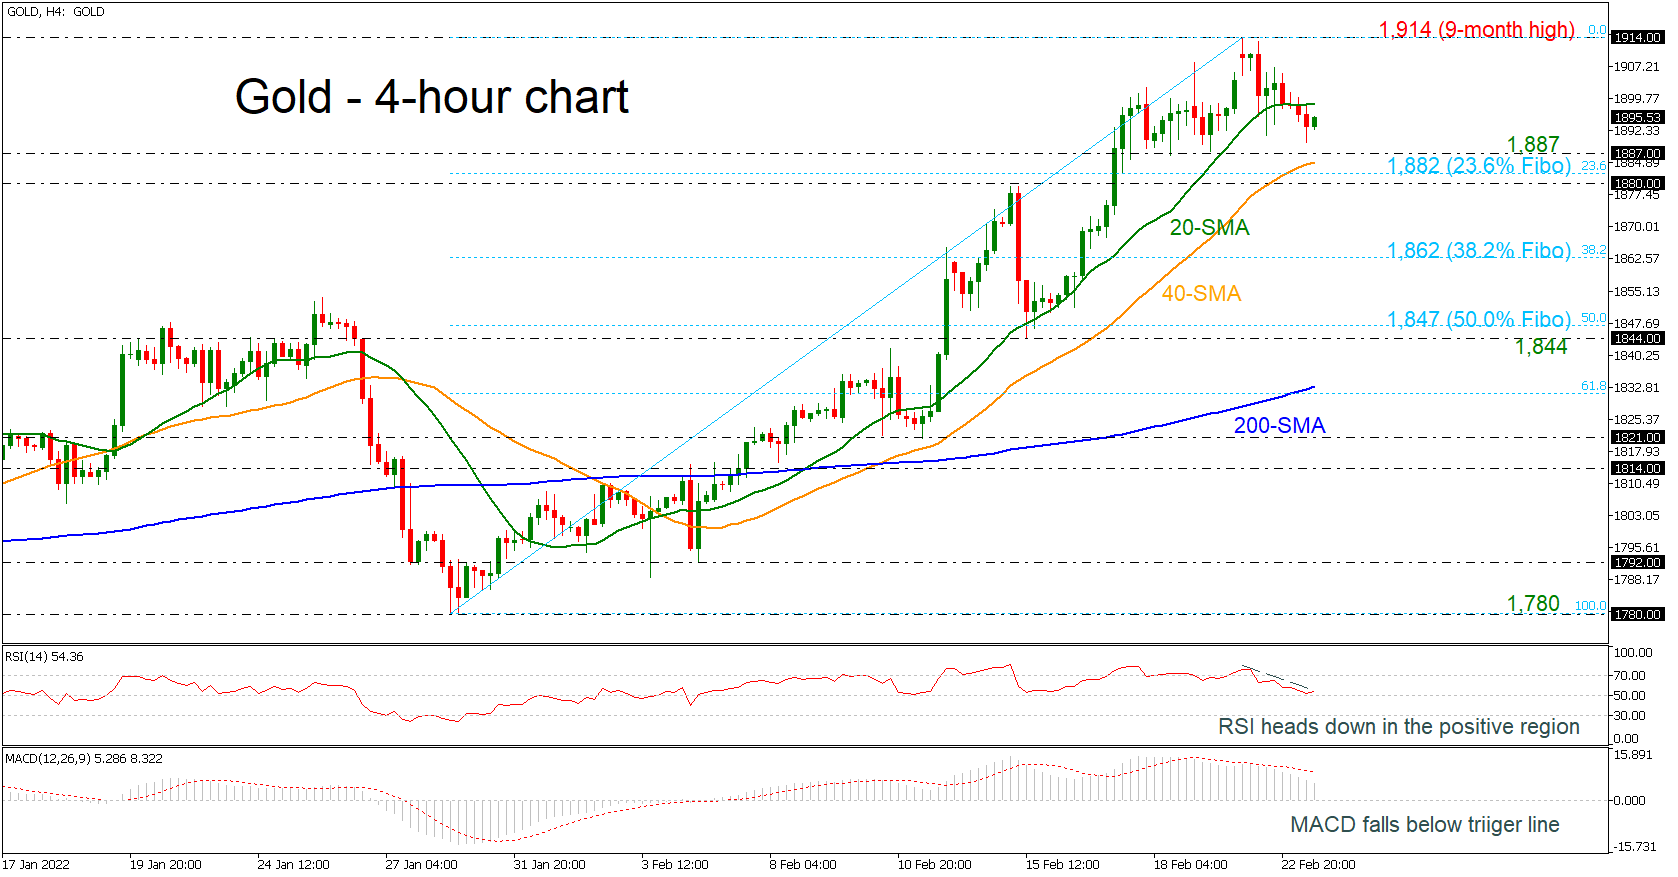
Gold prices are in a declining mode after the bounce off the nine-month high of 1,914. The price fell beneath the 20-period simple moving average (SMA) with the technical indicators suggesting a bearish correction. The RSI is holding below a descending line in the positive region, while the MACD oscillator is losing momentum below its trigger line in the bullish area.
A reversal to the downside could stall at the 1,887 support ahead of the 40-period simple moving average (SMA) at 1,884 and the 23.6% Fibonacci retracement level of the upward wave from 1,780 to 1,914 at 1,882. Slightly lower the 1,880 inside swing high from February 15 may halt bearish actions. Further below, the 38.2% Fibonacci of 1,862 could also provide support.
Alternatively, a successful climb above the 20-period SMA could add some optimism for a retest of the nine-month high of 1,914. Even higher, the 1,965 resistance taken from the peak on November 2020 may come into spotlight.
All in all, the yellow metal is printing a negative correction in the very short-term but in the broader outlook is strongly positive.
BoE Bailey sees very clear risk of high inflation coming through second-round effects
In the UK parliament's Treasury Committee hearing, BoE Governor Andrew Bailey said, there was "very clearly an upside risk" inflation that "comes through from the second-round effects".
"The second-round effects are a real concern. If we get the second-round effects... of course we would need to react to that with higher interest rates... ," he warned. "And the consequence of that... is that it would of course slow activity in the economy and it would increase unemployment"
On off-loading the balance sheet, Bailey said, "what we said last August was that if and when Bank Rate reaches 1%, and the words are important here, we will begin to consider active sales. It's not the same sort of quasi automatic process that we had with the ceasing reinvestment. So the 1% is a necessary but not sufficient thing. We would want to conduct QT at times when its impact on monetary policy was least."
Modest Sanctions Help Soothe Fears about Ukraine Fallout
- S&P 500 enters corrections territory as sanctions on Russia mount
- But nerves later steady as market impact seen limited, oil and gold slip
- Kiwi jumps on hawkish RBNZ, aussie outperforms too as dollar stays soft
Markets wary but less worried about Ukraine conflict
The market mood steadied on Wednesday, having wavered on Tuesday as the Ukraine crisis unfolded, with the United States and its allies slapping sanctions on Russia for ordering troops into Ukraine’s separatist regions.
Washington has made it more difficult for the Russian government to issue new debt as it welcomed Germany’s decision to suspend the certification of the Nord Stream 2 gas pipeline project. However, the measures taken by other countries were less punitive as they mostly involved a ban on Russian individuals and entities.
Although these are likely to be just the first of several waves of sanctions that the West will impose on Moscow should Russian forces enter the Ukrainian government-controlled territory, there was some relief that a tougher response was saved for future escalation.
As far as President Biden is concerned, there is no doubt that an invasion has started, and even though the proposed summit with his Russian counterpart Vladimir Putin has been called off, investors have not completely given up on a diplomatic solution. Either that or they think the US and Europe will back off from opting for sanctions that could inflict substantial pain on their own economies.
Stocks rebound as investors reassess Ukraine risks
The notion that even if a war in Ukraine is inevitable the broader economic fallout might not be so devastating after all might slowly be creeping into the markets, thus lifting sentiment slightly today. US stock futures are edging higher following another awful trading day on Wall Street on Tuesday.
The S&P 500 fell into correction territory for the first time in two years after slumping to one-month lows, while the Nasdaq Composite and Dow Jones both logged losses of more than 1%.
But global equity markets are backing the turnaround in risk appetite today, with Asian stocks closing mostly higher and European shares getting off to a solid start.
Oil rally pauses for breath, gold tests $1,890
The somewhat more positive tone weighed on save havens such as gold, the Japanese yen and Swiss franc. The precious metal eased to around the $1,890/oz level and oil prices were lower too.
Brent crude futures stepped back from the brink of hitting $100 a barrel on Tuesday, settling near the $96 handle today. WTI futures were last quoted at $91.39 a barrel.
Apart from ebbing fears about Russian energy exports getting caught in the Ukraine crossfire, the possibility that Iranian supply could soon enter the oil market is also weighing on prices as negotiators are reportedly inching closer to renewing the Iran nuclear agreement.
Nevertheless, the pullback in oil is negligible as demand is expected to continue to outstrip supply over the coming months.
Dollar stuck in a tight range
The US dollar remained on the backfoot as the combined easing in risk aversion and doubts about how hawkish the Fed will be kept the currency’s index against a basket of rivals confined within a narrow trading range.
Fed policymakers have in recent days appeared undecided about the need for a big rate hike in March. Though, the fact that it’s not being ruled out and the data generally supports it, means some traders may be underestimating the risk of a 50-basis point move.
On today’s Fed roster are the San Francisco Fed’s Daly and Governor Waller.
Kiwi shines after RBNZ’s hawkish surprise, pound lags
Stealing the FX limelight on Wednesday were the commodity-linked currencies. The aussie gained 0.6% despite only a modest pick up in wage growth in Australia in Q4. The loonie was up about 0.5% but the New Zealand dollar surged by 1% following the RBNZ’s decision to raise interest rates for a third straight meeting earlier today.
The RBNZ’s announcement was already fully baked in by the markets but the minutes revealed that it was a close call between 25 and 50 basis points. Moreover, policymakers now expect the official cash rate to reach 3.35% as opposed to the previous projection of 2.6%.
The sharply more hawkish tone caught investors off-guard, propelling the kiwi to just under the $0.68 mark.
The euro also benefited from the improvement in risk sentiment, climbing above $1.1355, but sterling lagged its peers somewhat as it struggled to reclaim the $1.36 level.
As the RBNZ ponders a 50-bps hike, the Bank of England seems to be backing away from an immediate aggressive move. Speaking before lawmakers today, BoE Governor Andrew Bailey pointed to the risk of second-round effects from high inflation but gave no clear indication that a shift to increments of larger than 25 bps was on the cards soon.
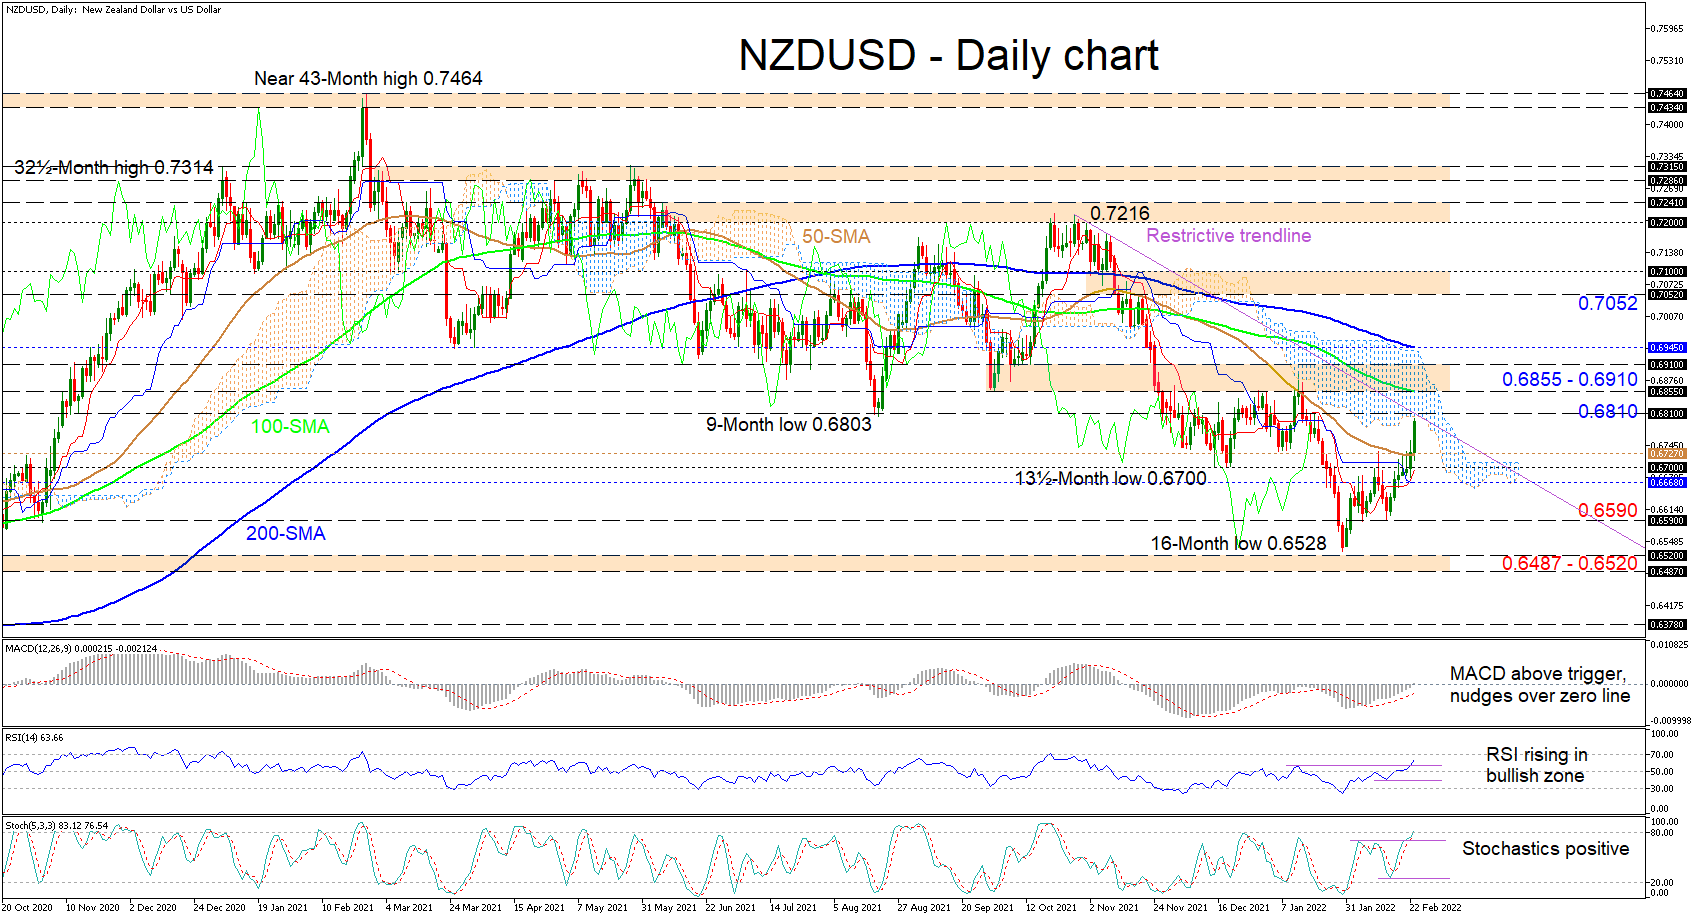
NZDUSD’s Fresh Bullish Impetus Put Under the Microscope
NZDUSD is set to confront the Ichimoku cloud’s lower band, which intersects with a potential restrictive trend line pulled from the 0.7216 high, putting the durability of the progressive price bounce from the 16-month low of 0.6528 to the test. The longer-term 100- and 200-day simple moving averages (SMAs) are defending a more than three-month decline, while the calmer downward slope of the 50-day SMA is reflecting buyers’ recent efforts to oppose the negative picture.
The red Tenkan-sen line is indicating the latest increase in positive forces, while the blue Kijun-sen line has yet to show that downward pressures have fully abated. The short-term oscillators suggest bullish momentum is growing. The MACD, which continues to climb north of its red trigger line, has pushed beyond the zero threshold, while the RSI is heading for the 70 overbought level. Moreover, the positively charged stochastic oscillator is implying additional gains in the pair.
As mentioned in the beginning of the article, initial upside limitations could transpire from the cloud’s floor around the 0.6810 barrier, which is overlapped by the diagonal resistance drawn from the 0.7216 high. If the three-week climb from the 0.6528 trough pushes higher into the cloud, the 0.6855-0.6910 fortified resistance border could try to impede additional advances from challenging the descending 200-day SMA at 0.6945. That said, a successful jump beyond the 200-day SMA may cheer buyers to aim for the 0.7052-0.7100 next resistance obstacle.
Alternatively, if gains are capped by the cloud and the 0.6810 barrier, support could commence between the 50-period SMA at 0.6727 and the 0.6700 hurdle. If a more profound retreat unfolds beneath the neighbouring Ichimoku lines, the bears may then target the 0.6590 low before pursuing the 0.6528 trough and adjacent 0.6487-0.6520 base, which extends back to mid-July 2020.
Summarizing, NZDUSD’s bearish bias is being contested by buyers who have managed, in the last three-weeks, to pilot towards the Ichimoku cloud. The bulls could significantly revive upside momentum with a climb north of the cloud, while failing to do so, may prolong dominance of bearish pressures.
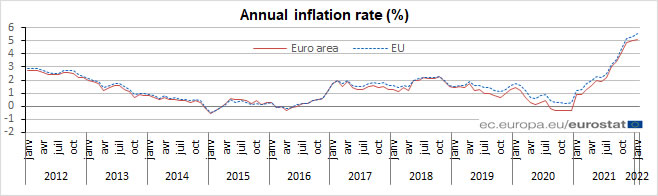
Eurozone CPI finalized at 5.1% yoy in Jan, EU at 5.6% yoy
Eurozone CPI was finalized at 5.1% yoy in January, up from December's 5.0% yoy. The highest contribution to the annual euro area inflation rate came from energy (+2.80%), followed by services (+0.98%), food, alcohol & tobacco (+0.77%) and non-energy industrial goods (+0.56%).
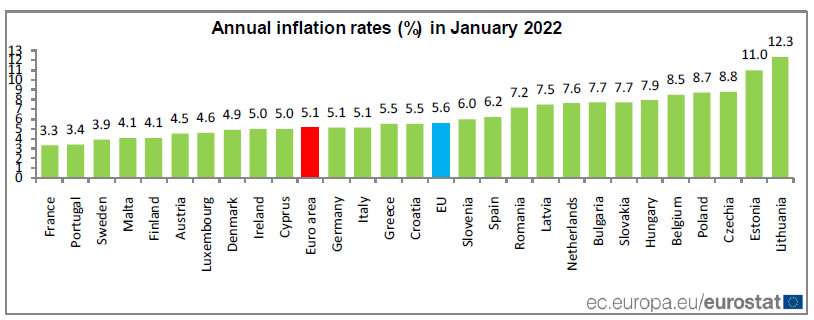
EU CPI was finalized at 5.6% yoy, up from December's 5.3% yoy. The lowest annual rates were registered in France (3.3%), Portugal (3.4%) and Sweden (3.9%). The highest annual rates were recorded in Lithuania (12.3%), Estonia (11.0%) and Czechia (8.8%). Compared with December, annual inflation fell in eight Member States and rose in nineteen.
Has Bitcoin Hit Bottom?
The rebound of bitcoin began along with the growth of European stock indices at the beginning of the day. They corrected up after three days of decline on the crisis around Ukraine. Futures for the S&P 500 and Nasdaq, with which BTC has been highly correlated lately, also showed gains on Tuesday.
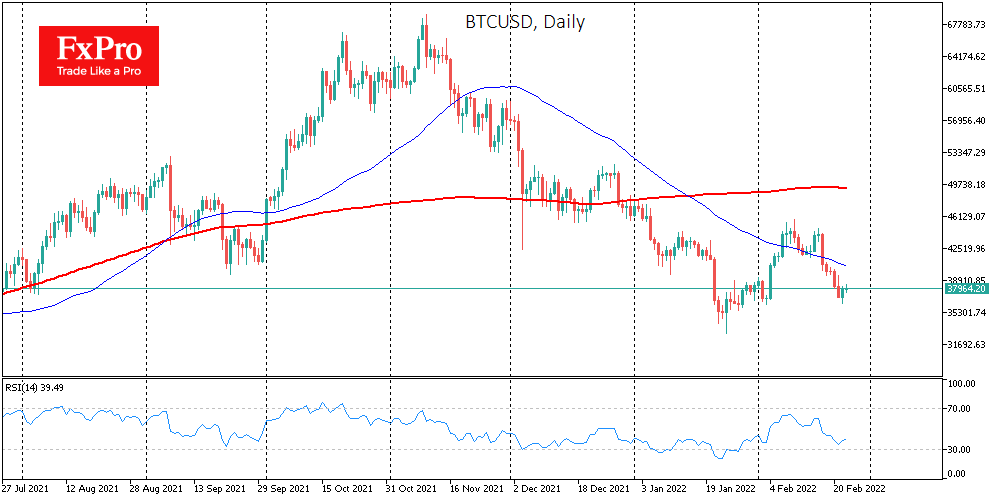
So far, the rebound of risky assets, which includes cryptocurrencies, can be considered as a movement within a downtrend. Bitcoin has been trying to correct from levels close to the lows of February, but this is probably not the bottom yet.
Expectations of a rate hike by the US Federal Reserve and rising geopolitical tensions are putting pressure on all risky assets. Despite the rather low levels of the Cryptocurrency Fear Index, the history of the indicator suggests that the best moments to enter were periods of falling into the 10 area.
Meanwhile, Ricardo Salinas Pliego, one of the richest Mexican billionaires, called for not selling bitcoin during the fall. In his opinion, BTC will rise in the long term.
Overall, Bitcoin is up 3.6% over the past day to $38,100, closing Tuesday higher after five days of decline. Ethereum gained 6.1% over the same time period, while other leading altcoins from the top ten showed mixed dynamics: from 4% growth in XRP to 13% in Terra.
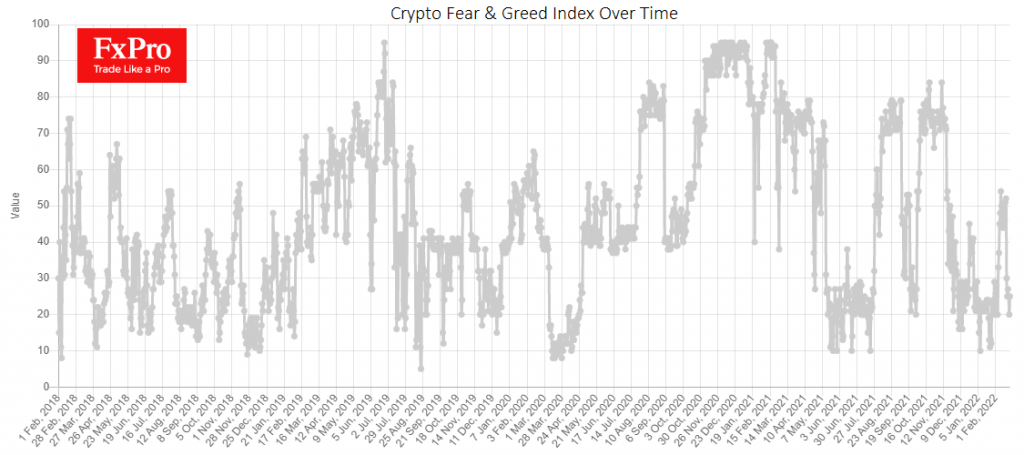
The total capitalization of the crypto market, according to CoinGecko, decreased by 1.5% over the day to $1.79 trillion. Altcoins grew worse than the first cryptocurrency, which led to an increase in the Bitcoin dominance index by 0.4%, to 40.3%.
The index of fear and greed turned back again, losing 5 points to 25 and remaining in a state of “extreme fear”.
EURGBP Downtrend Continues as Bearish Forces Linger
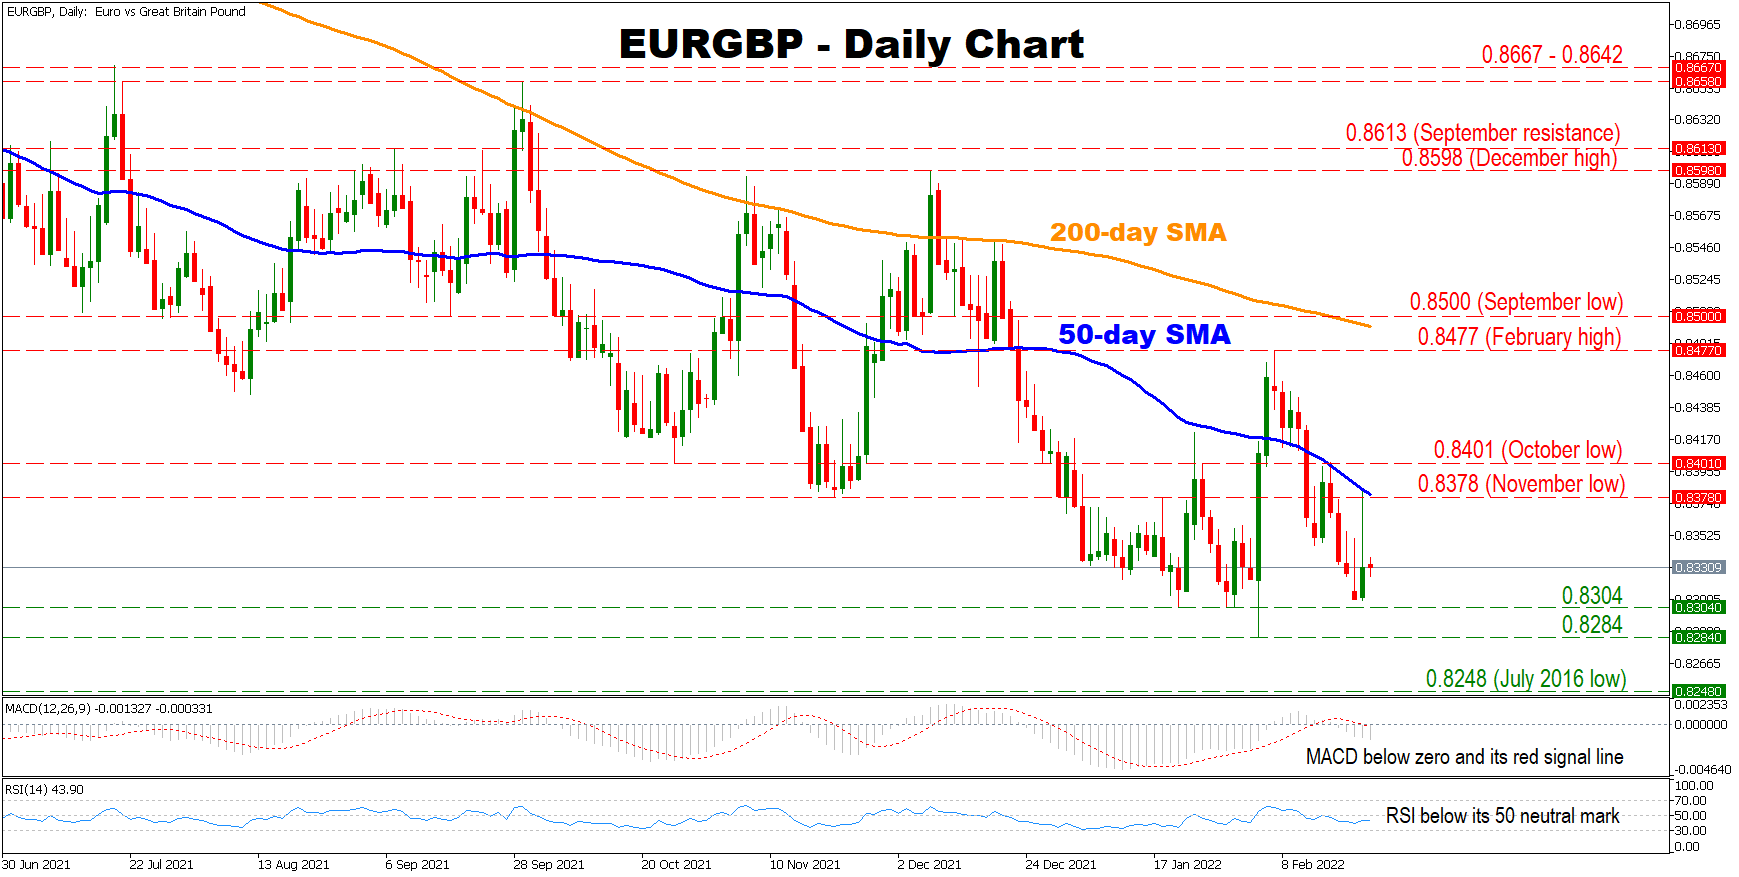
EURGBP continues its descending trend and has yet to break its series of successive lower lows as negative forces linger. Moreover, the pair is trading well below the 50- and 200-day simple moving averages (SMAs), maintaining an overall bearish outlook.
Short-term momentum indicators are reflecting a negative bias as the RSI is located below its 50 neutral mark. In addition, the MACD is found below zero and its red signal line, which indicate that the negative momentum might be gaining further ground.
Should the bears maintain control, initial resistance might be found at the 0.8304 obstacle, before sellers shift their attention towards the 0.8284 hurdle. Crossing below the latter could intensify selling pressures, opening the door towards the July 2016 low at 0.8248.
On the flip side, if buyers resurface, their first target might be the region which includes the 0.8378 level and the 50-day SMA, before eyeing the October low at 0.8401. A decisive move above this point could increase positive momentum, sending the price to test the February high at 0.8477, before taking aim at the region which encapsulates the 200-day SMA currently at 0.8493 and the 0.8500 hurdle.
In brief, the overall outlook for the pair is bearish . For sentiment to change, buyers would need to break above the 200-day SMA.