Sample Category Title
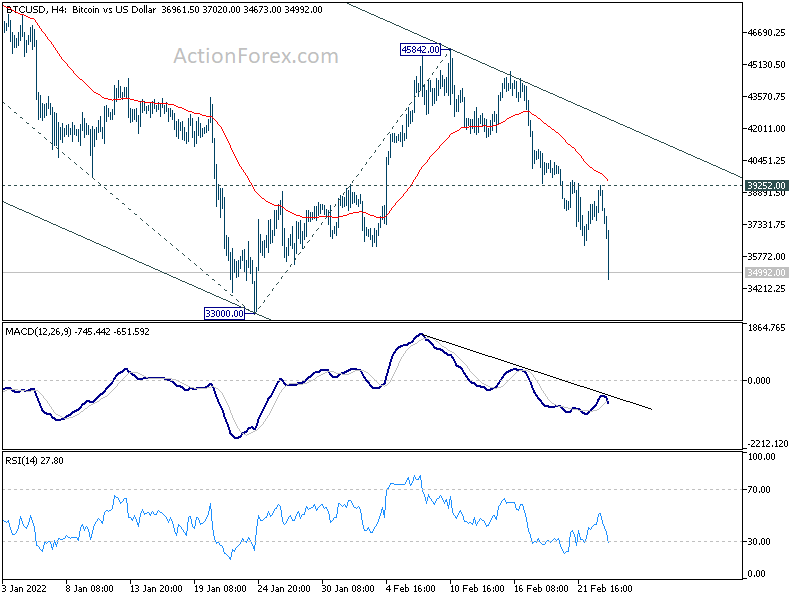
Bitcoin ready to break through 33k low to resume down trend
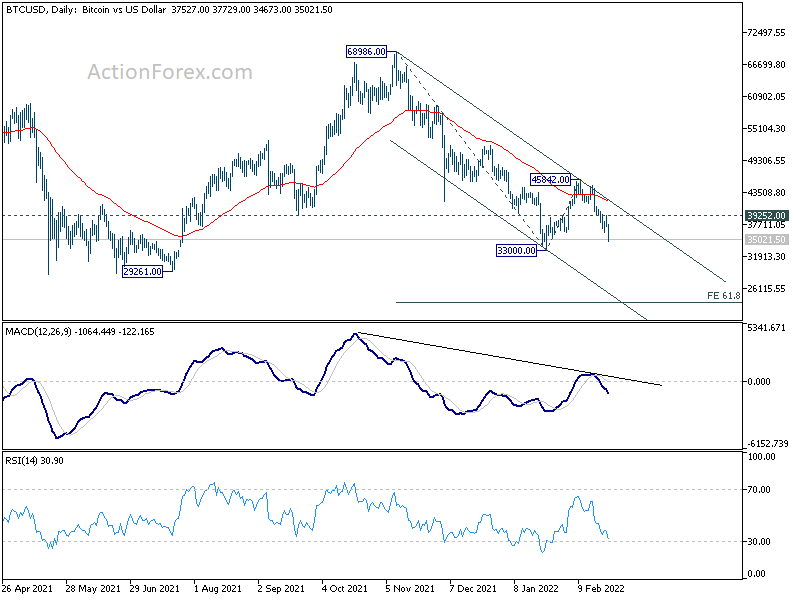
Bitcoin's steep decline today affirms that case that corrective rebound from 33000 has completed at 45842, after failing to sustain above 55 day EMA. The development also argues that down trend from 68986 is ready to resume. Further decline is now expected as long as 39252 resistance holds.
First target will be 33000 low. Decisive break there will confirm this bearish case. It's a bit early to say whether the downside momentum warrants a firm break of 30k handle. But, we'd tentatively put 61.8% projection of 68986 to 33000 from 45852 at 23602 as the next target. Let's see.
Gold resumes rally, targets 1946 next
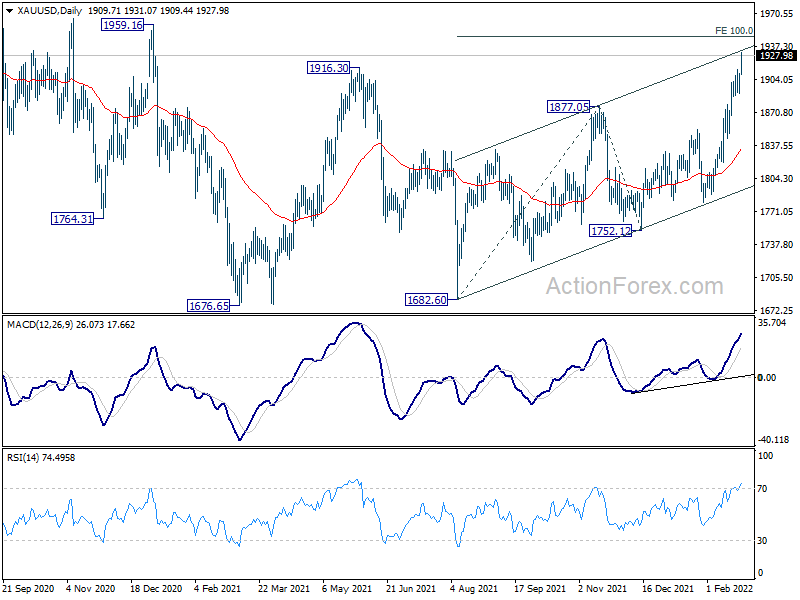
Gold's rally resumed after brief consolidation and hits as high as 1931.07 so far. In any case, outlook will stay bullish as long as 1889.42 support holds. Next target is 100% projection of 1682.60 to 1877.05 from 1752.12 at 1946.57. Sustained break there, as well as the channel resistance, could prompt some strong upside acceleration ahead.
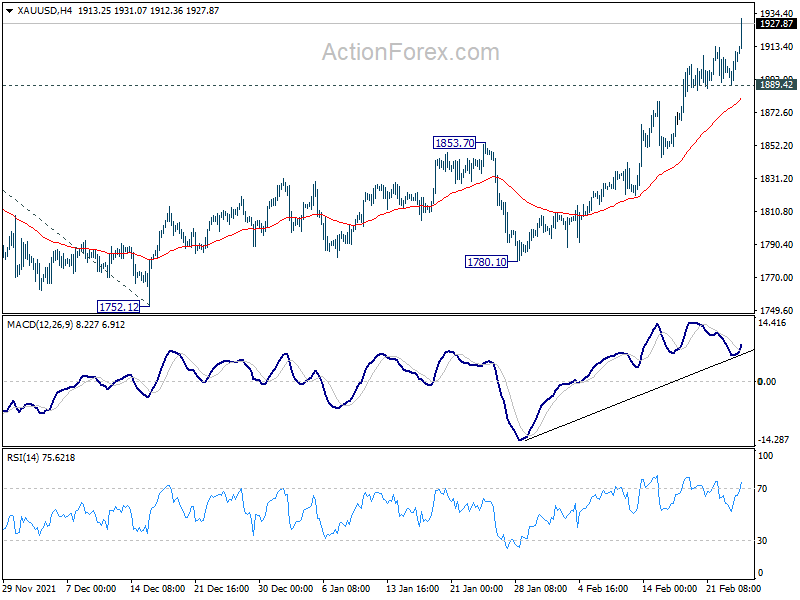
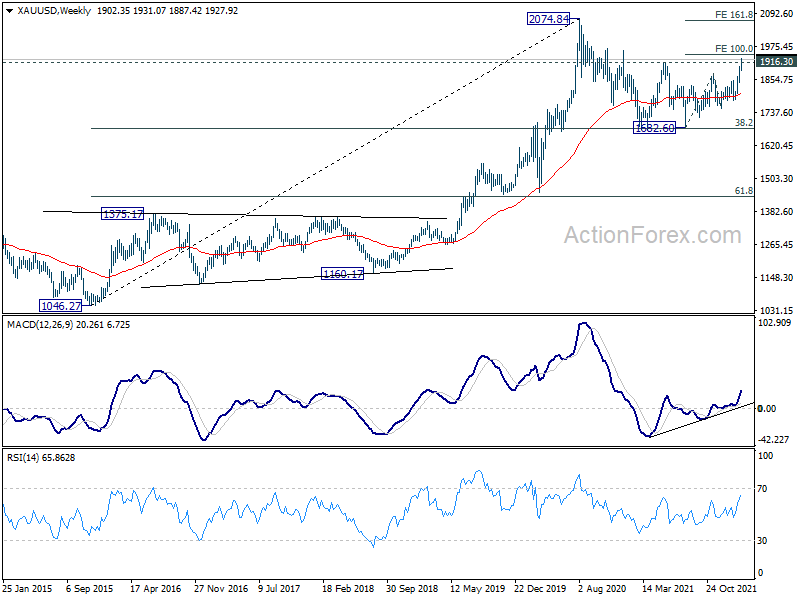
It should also be noted again that sustained break of 1916.30 should confirm that whole correction from 2074.84 (2020 high) has completed at 1682.60, after defending 38.2% retracement of 1046.27 to 2074.84. Further decisive break of 1946.57 would quickly shot Gold up to 161.8% projection at 2066.74, which is close to 2074.84 high.
BoJ Kuroda: No immediate plans to scale back stimulus
BoJ Governor Haruhiko Kuroda told the parliament, "unlike Western countries, we have no immediate plans to scale back our monetary stimulus." But the central bank will continue to look at inflation expectations. "We will look not just at price indicators, but also surveys showing how the public feels about price moves," he added.
On exchange rate, Kuroda said, "if the yen weakens further, that could push up import costs. But the recent rise in import costs is driven mostly by an increase in dollar-denominated raw material prices, rather than a weak yen."
"It's desirable for currency rates to move stably reflecting economic fundamentals. I think recent (yen) moves are in line with this trend," Kuroda added.
ECB Lane hints at earlier end to asset purchases
ECB Chief Economist Philip Lane said in an interview, "if inflation rates are moving towards our target in the medium term, which is now looking more likely – instead of being well below two per cent as before the pandemic – we will adjust monetary policy". That's because, "we would then, for example, no longer need to make asset purchases to stabilise inflation at our target over the medium term."
"It was different in December, when surveys still showed the expectation that we would need to maintain asset purchases until the middle of next year, but the timeline may be shorter than what people expected then," he added.
Lane also reiterated the "sequencing" of policy normalization. That is, "our net assets purchases will first be scaled down, then ended. Then, the key policy rates will only increase above their current levels if the conditions consistent with our medium-term inflation target are met. So before we talk about potential rate decisions, we need to end net asset purchases. And we need to prepare the market for the eventual end of these purchases.
NZD/USD Extend Rally, US GDP Report Next
Key Highlights
- NZD/USD gained bullish momentum above the 0.6750 resistance.
- A key bullish trend line is forming with support near 0.6740 on the 4-hours chart.
- EUR/USD is still well below 1.1400, and GBP/USD is stable above 1.3550.
- The US GDP could increase 7% in Q4 2021 (Preliminary).
NZD/USD Technical Analysis
The New Zealand Dollar started a major increase from 0.6600 against the US Dollar. NZD/USD gained bullish momentum and surpassed the 0.6700 resistance zone.
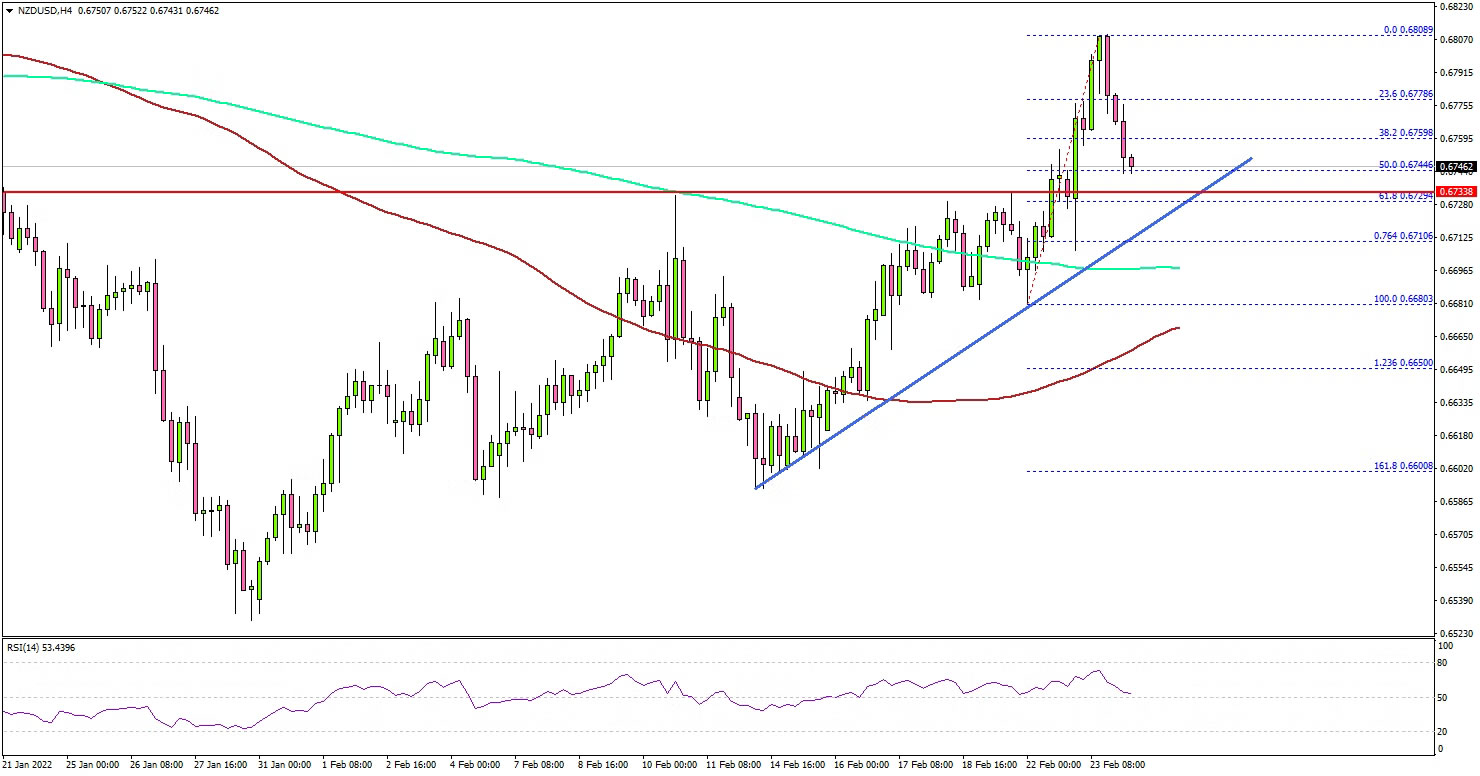
Looking at the 4-hours chart, the pair even broke the 0.6750 resistance level. Finally, the pair even cleared the 0.6800 level, and settled above the 100 simple moving average (red, 4-hours) and the 200 simple moving average (green, 4-hours).
It seems like the pair could rise further above 0.6820. The next major resistance is near the 0.6840 level. Any more gains might send the pair towards the 0.6900 level.
If there is a downside correction, the pair could decline below the 0.6750 level. The next key support is near 0.6740. There is also a key bullish trend line forming with support near 0.6740 on the same chart.
If there is a downside break, the pair could decline towards the 0.6650 level the 100 simple moving average (red, 4-hours). An intermediate support might be 0.6695 and the 200 simple moving average (green, 4-hours).
Looking at EUR/USD, the pair is still struggling to clear the 1.1400 resistance level. Similarly, GBP/USD must settle above 1.3640 to continue higher in the near term.
Economic Releases
- US Gross Domestic Product for Q4 2021 (Preliminary) – Forecast 7.0% versus previous 6.9%.
- US New Home Sales for Jan 2022 (MoM) – Forecast 5.5% versus 11.9% previous.
- US Initial Jobless Claims - Forecast 235K, versus 248K previous.
Silver Confronts 200-MA and Upper Bollinger Band
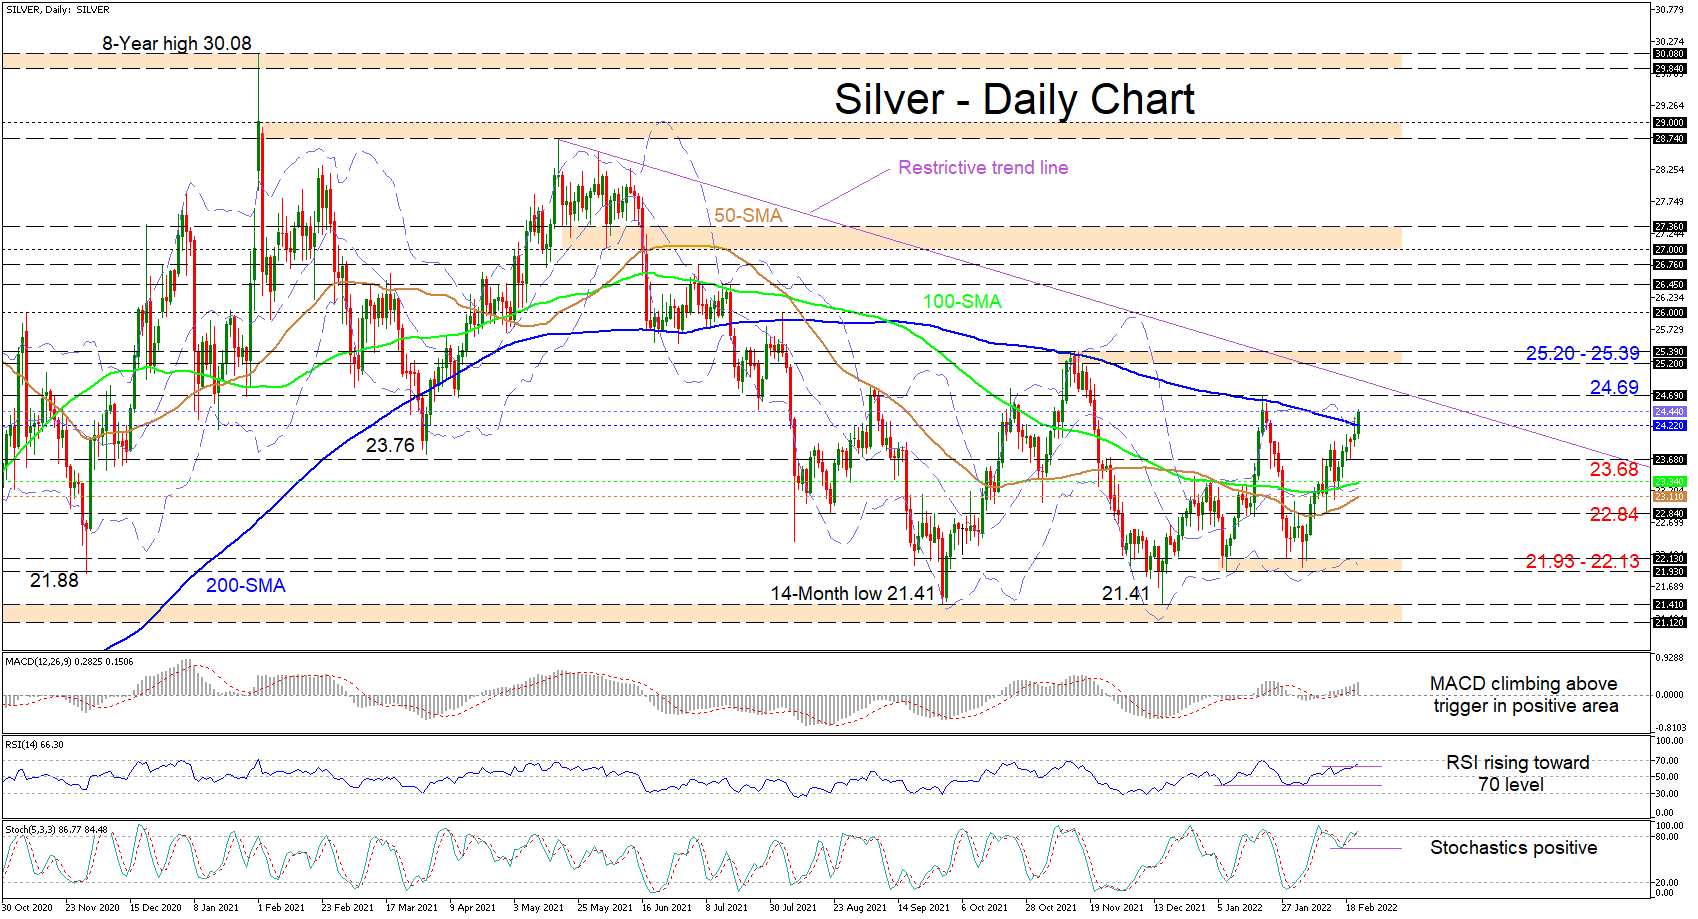
Silver is simultaneously overpowering the 200-day simple moving average (SMA) at 24.22 and the adjacent upper Bollinger band around 24.44 trying to reel in the overhead high of 24.69 and the 25.20-25.39 ceiling of the near five-month sideways market. The gliding 200-day SMA is endorsing a bearish tone but has failed to suppress growing upside impetus, while the upturn in the slopes of the 50- and 100-day SMAs, suggests the minor price rally from the 21.93-22.13 support section may be firming.
The short-term oscillators remain skewed to the upside. The MACD, in the positive region, is advancing above its red signal line, while the climbing RSI is nearing the 70 overbought level. Additionally, above the 80 mark, the stochastic %K line has regained its positive charge, implying bullish pressures are persisting.
If the price manages to close above the 200-day SMA and the upper Bollinger band, prompt resistance could transpire from the 24.69 neighbouring high. Successfully overstepping this, and overshooting the potential descending line pulled from the 28.74 high, may reinforce the odds of a possible bullish breakout of the 25.20-25.39 ceiling of a trading range that has imprisoned the commodity for nearly five-months.
However, if bullish forces dissolve and the price closes back below the 200-day SMA, downside friction could commence at the 23.68 low ahead of a fortified buffer zone between the 100- and 50-day SMA at 23.34 and 23.11 respectively. If selling interest intensifies further, a deeper retracement may ignore the 22.84 barrier and target the 21.93-22.13 tough support section, moulded by the January and February troughs, which also encapsulates the lower Bollinger band.
Summarizing, silver is exhibiting a strong bullish tone above the 200-day SMA and around the upper parts of a broader sideways market. That said, the neutral-to-bullish pressures of the commodity may linger should the price manage to hold north of the 23.68 low and the 100- and 50-day SMAs at 23.34 and 23.11. Moreover, the lower and upper boundaries of the broader trading range are 21.41 and 25.39.
Precious Metals Shine Brighter as Silver Breaks Out
Precious metals continue to shine amid heightened geopolitical risks concerning Ukraine, a struggling global stock market and soaring inflation. Inflation is also helping to keep real bond yields in the negative territory, making the non-interest-bearing gold and silver attractive on a relative basis for yield-seekers.
Gold had already been showing strength amid haven flows in recent days, extending its good run of form from the start of the month when inflation concerns intensified. Silver has also been rising along with gold, albeit a little stealthier as it didn’t break any major levels… until today:
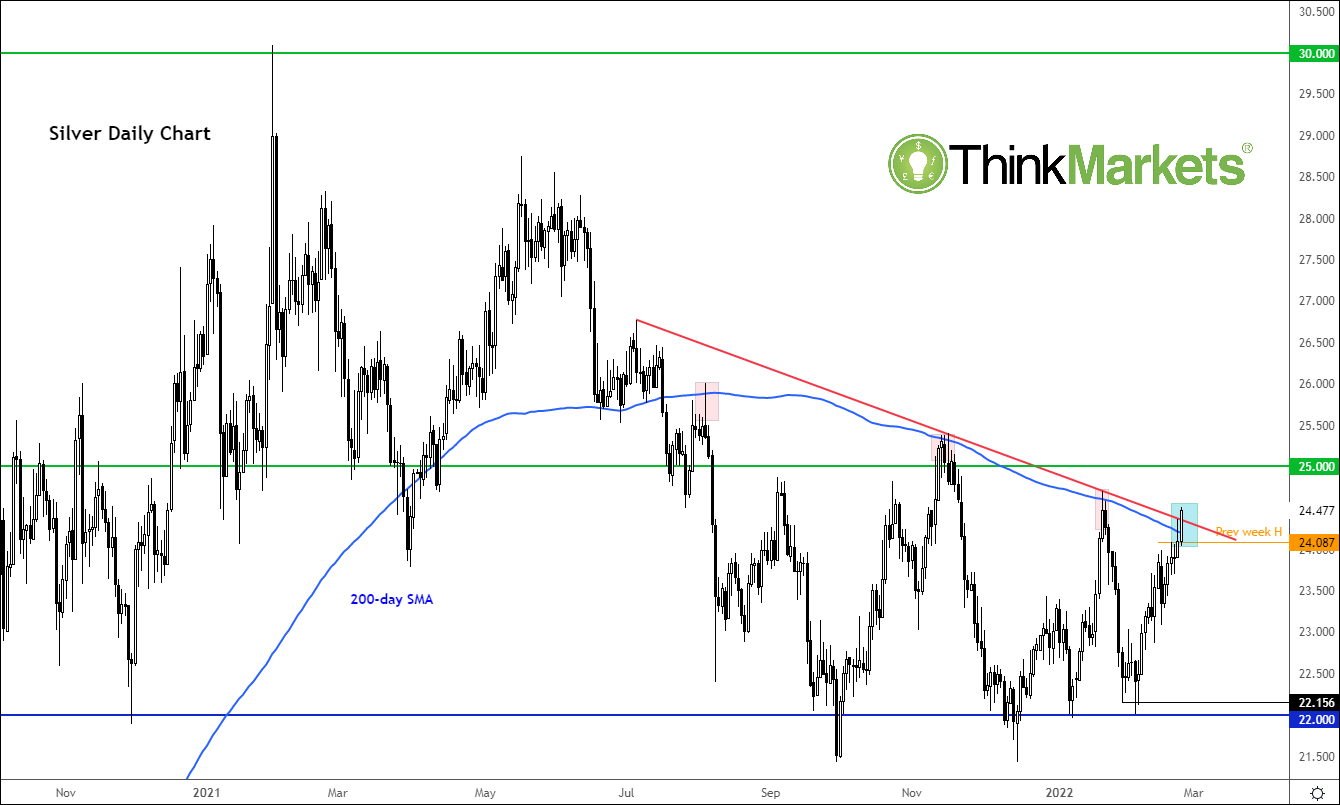
Source: ThinkMarkets and TradingView.com
The “poor man's gold” had been unable to take out its 200-day moving average on several occasions in recent past. But today, it has made a more decisive move. A close above here would pave the way for a potential rally to $25.00 next. But there’s the potential for a much larger move, given the current macro backdrop.
GBP/USD: Ripe for a Breakout
GBP/USD, stuck within a tight range of 1.36412-1.34921 since 10 February, is ripe for a breakout. The 200-pip question is in what direction. A lot will depend on how the outlook on monetary policy on both sides of the Atlantic shifts in the coming months.
Technically, the odds looked stacked against a break to the upside. The downtrend in GBP/USD started in the summer of last year has yet to be invalidated. Furthermore, the pairs recent tight range points to a further continuation of the pervious trend.
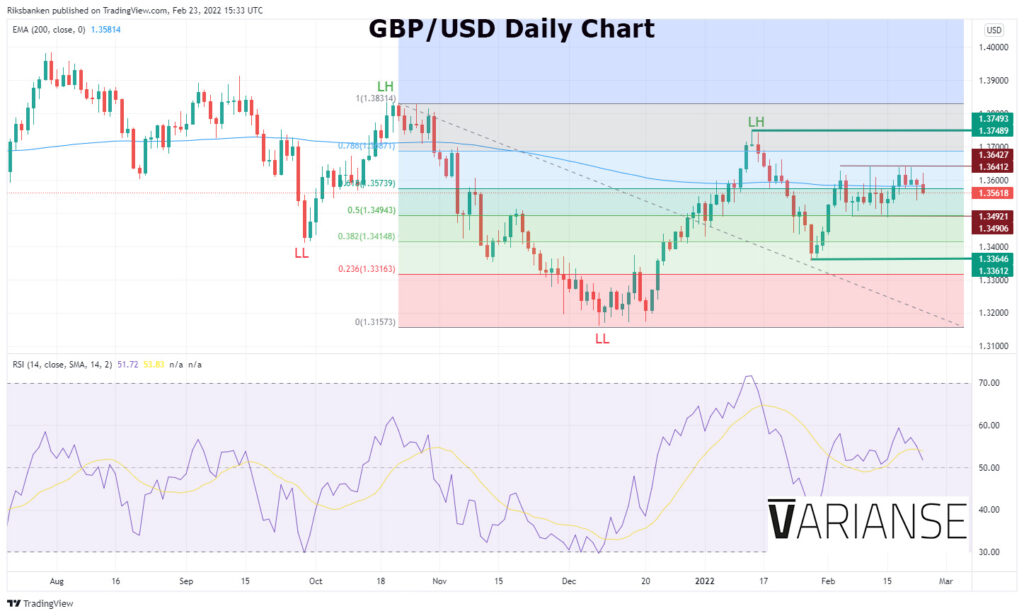
Still, price continues to tightly hug the 200-day exponential moving average and recent momentum has been biased to the upside. In other words, a break to the upside of its recent range certainly can’t be ruled out.
Meanwhile, the 78.6% Fibonacci retracement from the October swing high to the December swing low of 1.36872 could act as an impediment to further gains in the pair. In addition, 1.37493 is likely to act as a further ceiling on any future ascent. In terms of downside, 1.33646 may provide further support, before more substantial selling were to come on board.
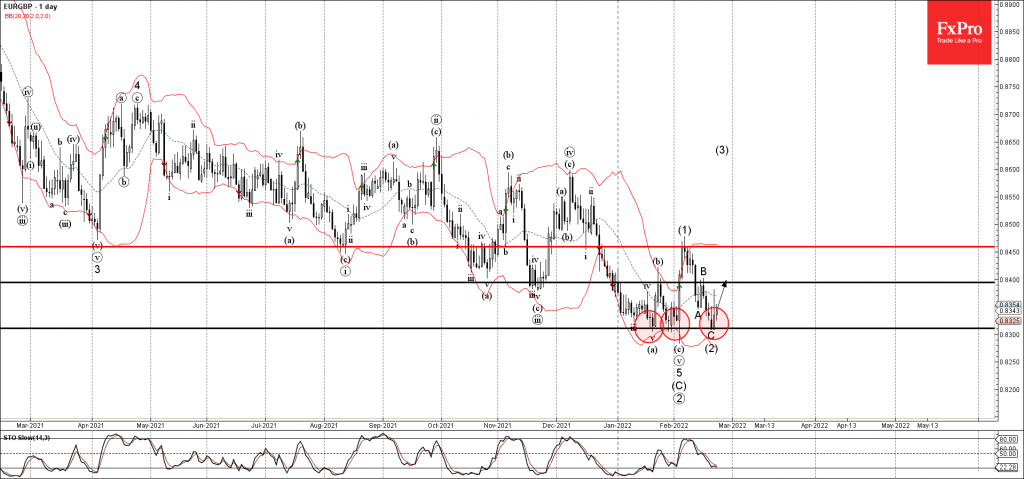
EURGBP Wave Analysis
- EURGBP reversed from support area
- Likely to rise to resistance level 0.8400
EURGBP currency pair recently reversed up from the support area located between the key support level 0.8310 (which has been reversing the pair from the start of January) and the lower daily Bollinger Band.
The upward reversal from this support area stopped the previous medium-term ABC correction (2).
Given the strength of the aforementioned support area – EURGBP currency pair can be expected to rise further toward the next resistance level 0.8400 (top of wave B).