Sample Category Title
USDCHF Ticks Upwards after its Short-Term Decline Pauses
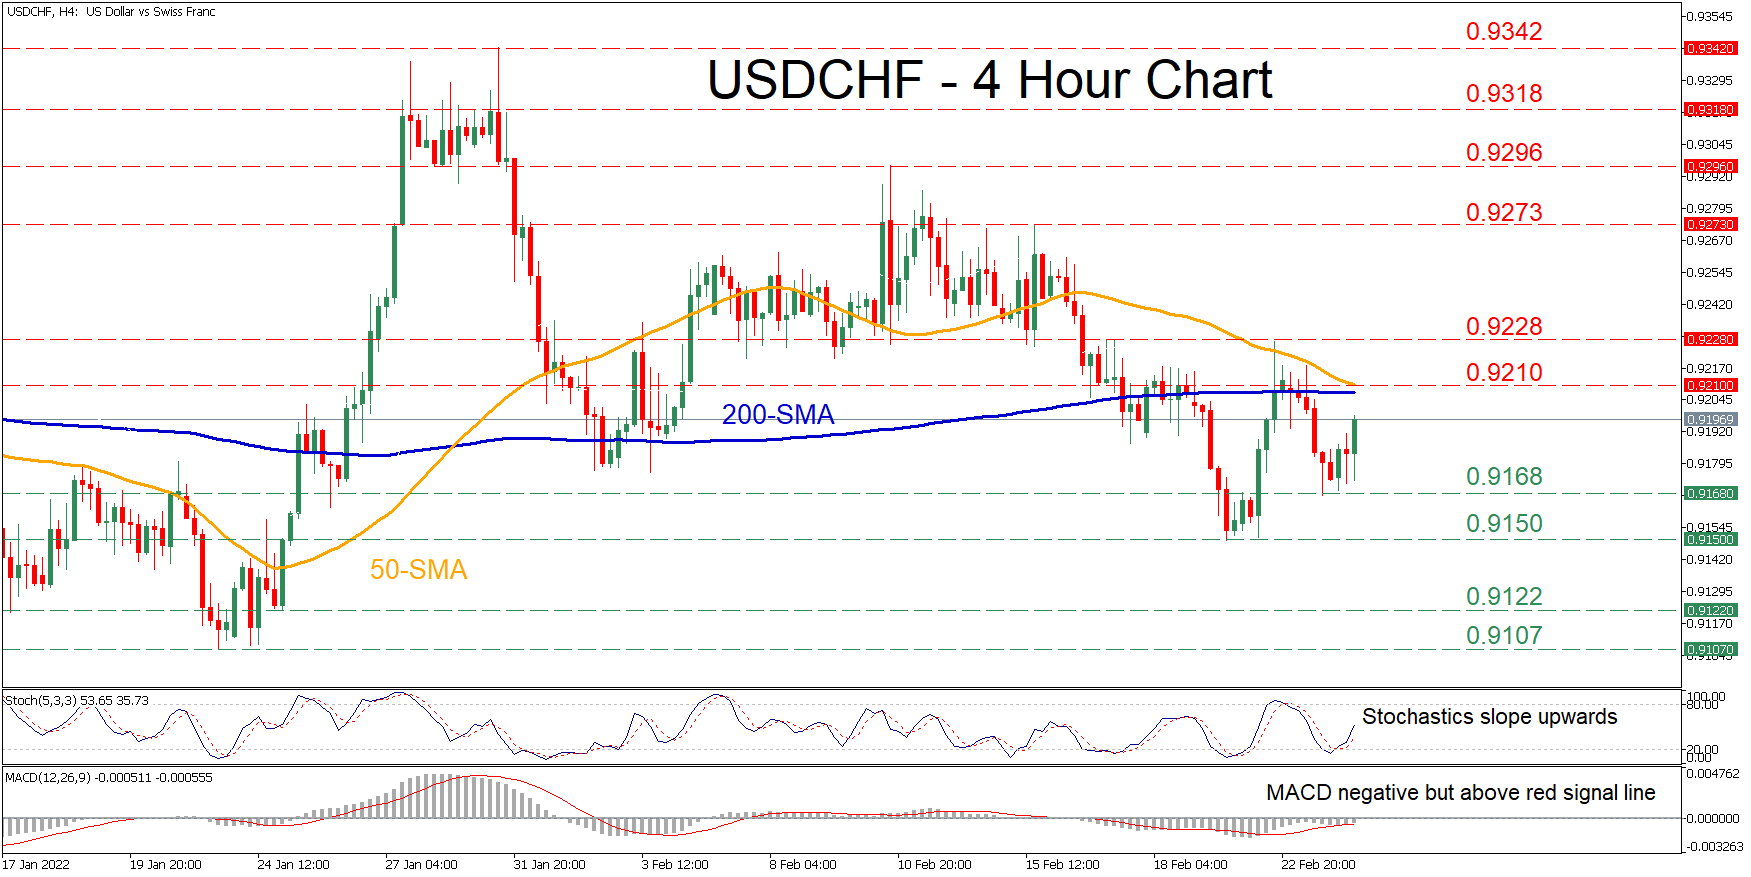
USDCHF has been trying to recoup part of its recent losses since it managed to find its feet at the 0.9150 region. Although the pair experienced a minor pullback, it is marching higher again as positive momentum seems to be intensifying.
The short-term oscillators indicate that near-term risks are tilted to the upside. The stochastic oscillator is nudging higher after posting a bullish cross, while the MACD histogram has jumped above its red signal line but remains in the negative zone.
Should the positive momentum strengthen and the price ascends, initial resistance could be encountered at 0.9210, a level where the pair’s 50- and 200-period simple moving averages (SMAs) seem ready to converge. If the upside pressure persists, the price may climb towards the 0.9228 hurdle, which has rejected three price advances in the last two weeks. Crossing above this region, the spotlight could turn to the 0.9273 level, a violation of which would set the stage for the February high of 0.9296.
Alternatively, if sellers retake control and push the pair lower, the recent low of 0.9168 could act as the first support barricade. Should the price breach this level, the bears might aim for the February low of 0.9150. Piercing through this support point, the price could descend towards 0.9122 before it challenges the 0.9107 obstacle.
Overall, USDCHF has been in recovery mode in the last few four-hour sessions as bullish forces appear to be consolidating. However, a break above the 0.9296 ceiling is needed to alter the short-term picture back to positive.
AUDUSD Returns Back Below the Falling Trend Line
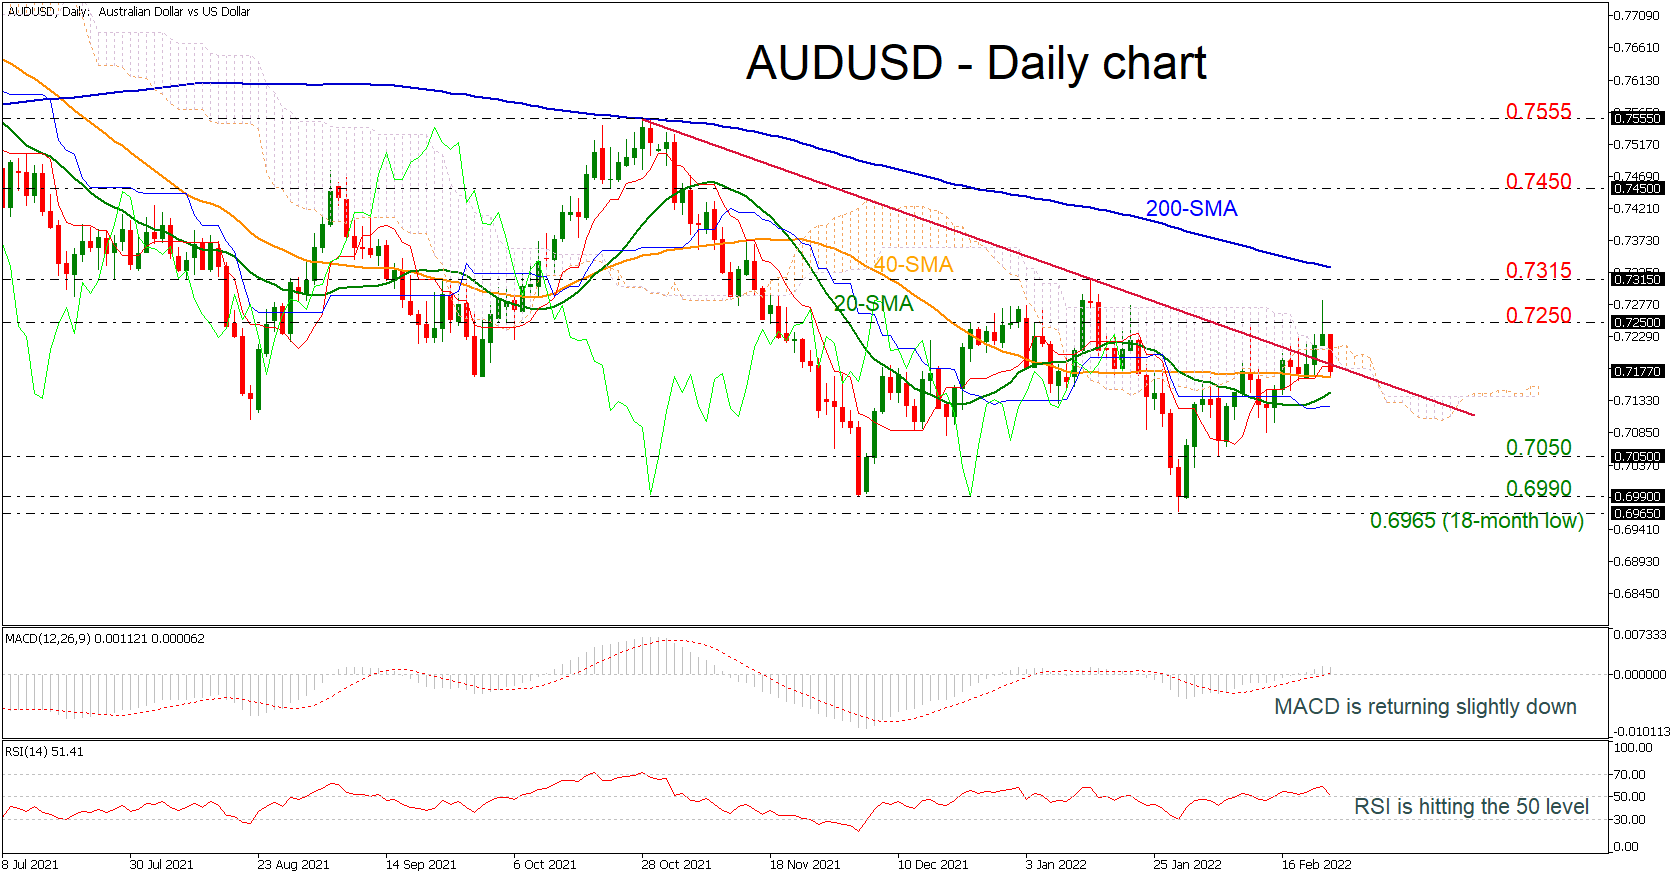
AUDUSD is heading south after failing to have a closing day above the 0.7250 resistance and touching the 40-day simple moving average (SMA) lower. The MACD oscillator is losing momentum above its trigger and zero lines, while the RSI is sloping down near the neutral threshold of 50 in the short-term.
Further declines may meet support around the 20-day SMA at 0.7145 before tumbling to the 0.7050 support. Not far below, support could occur around the 0.6990 barier, while even lower the 18-month low of 0.6965 may act as a turning point for the bulls.
On the upside, resistance could occur around the 0.7250 barrier ahead of the 0.7315 high, holding well above the descending trend line. Higher still, the 200-day SMA at 0.7330 would increasingly come into scope, not far above this point lie a couple of other peaks from previous months as well.
The medium-term picture continues to look predominantly bearish, despite the latest upside move above the falling trend line in the previous couple of days.
Daily Technical Analysis
EUR/USD
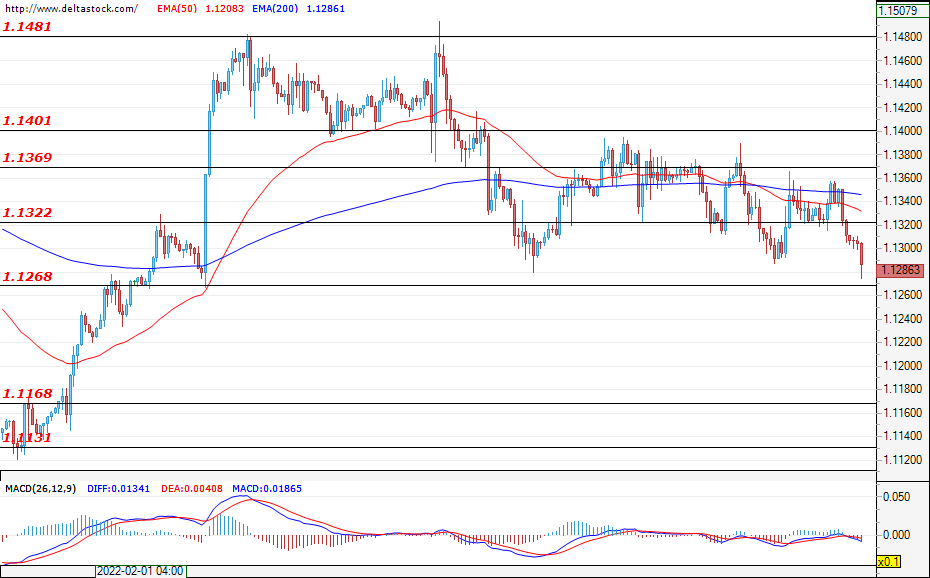
The common European currency continues to depreciate against the dollar as the currency pair breached the support level of 1.1322 and, at the time of writing, is headed towards a test of the next support at 1.1268. The forecast is for the pair to breach 1.1268 and to continue depreciating towards the next support zone at 1.1168. In the positive direction, the mentioned level of 1.1322 is acting as a first resistance for the EUR/USD. During today's trading session, the most important economic news that would be of interest to the market participants will be the GDP data and the initial jobless claims data reports for the U.S. at 13:30 GMT, as well as the new home sales data for the U.S. at 15:00 GMT.
USD/JPY
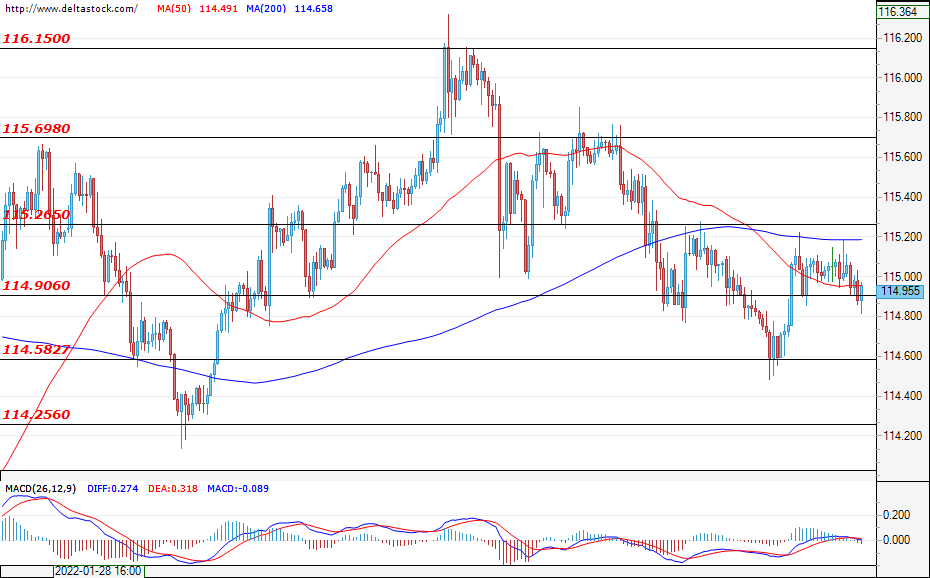
The Ninja continues to consolidate in the narrow range between the support at 114.90 and the resistance at 115.26. At the time of writing, the currency pair is headed towards a test of the lower border of the range. If the test is successful, then the bears would easily push the price towards the next support zone at 114.58. In case the 114.90 manages to withstand the bearish pressure, then the price would probably bounce back and test the upper border of the range.
GBP/USD
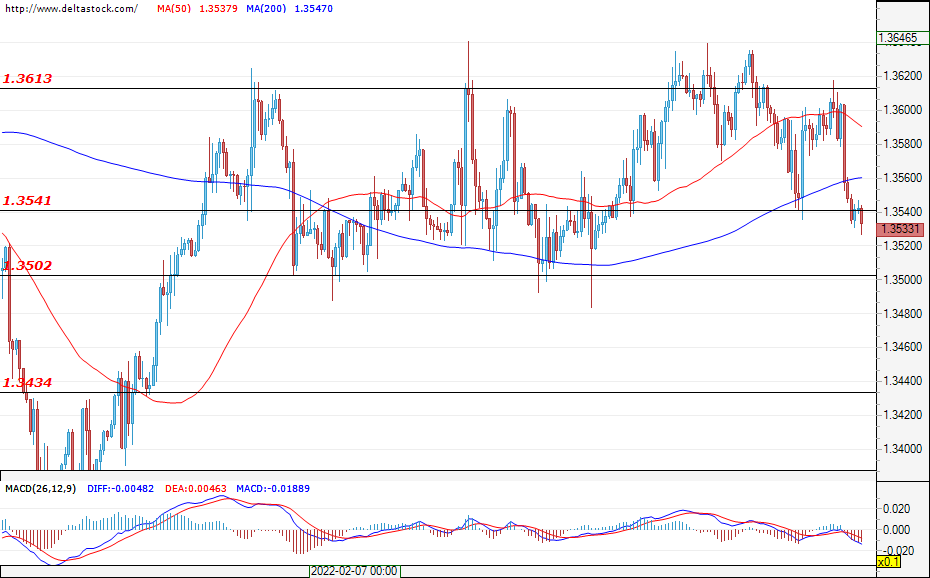
After yet another unsuccessful attempt of the bulls to violate the resistance level of 1.3613, the Cable is headed towards a re-test of the support level at 1.3540. In case this support is violated, then the decline would continue towards the psychological level of 1.3500. In the positive direction, only a confirmed breach of the key resistance at 1.3613 would let the bulls take control over the market.
EUGERMANY40
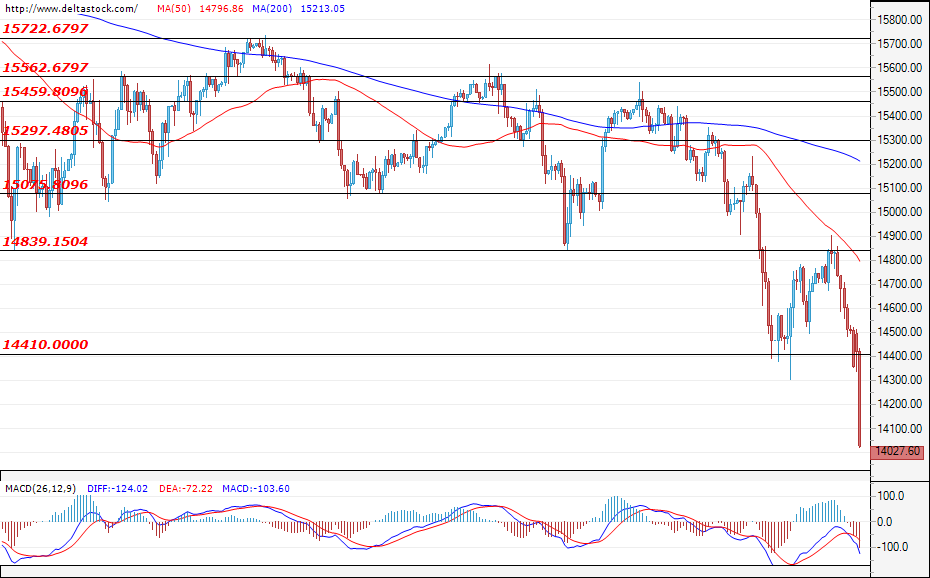
The start of the war in Ukraine sank the financial markets worldwide. The German index is not an exception, as in the early hours of today's trading session, the EUGERMANY40 lost nearly 3% of its value. The forecast is for the selloff to continue, interrupted by short-term retracements, but in a clear downtrend. In the positive direction, the level of 14410 is now acting as a resistance for the index.
US30
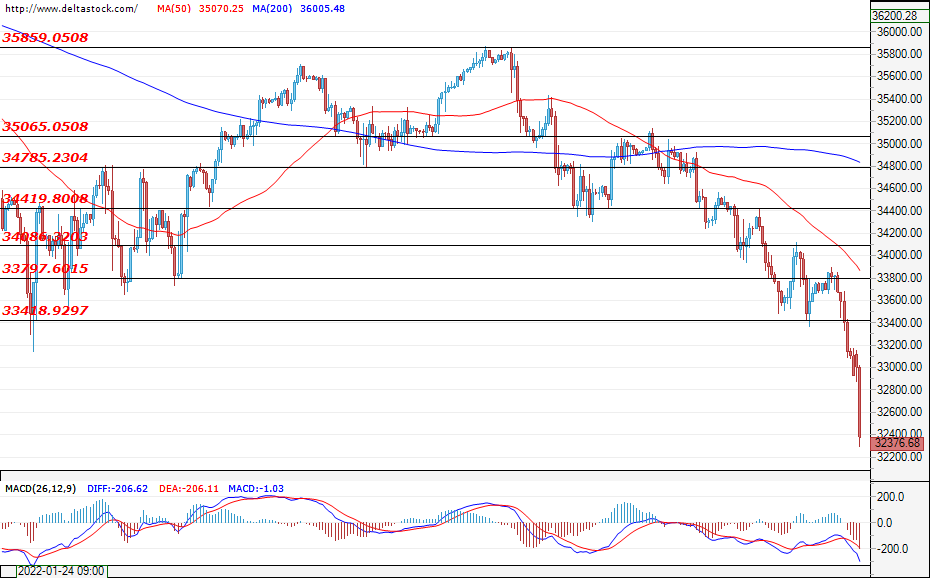
The downtrend for the U.S. blue-chip stock index continues, as in the early hours of today's trading session, the US30 lost as much as 700 points following a massive sell-off, and at the time of writing, is still struggling to find support. The forecast is for the sell-off to continue, while short-term retracements are also quite possible. In the positive direction, the first resistance level is found at 33418. The major fundamental factor, which is influencing the financial markets, remains the military conflict in Ukraine. During today's trading session, the most important economic news that would be of interest to the market participants will be the GDP data and the initial jobless claims data reports for the U.S. at 13:30 GMT, as well as the new home sales data for the U.S. at 15:00 GMT.
Uncertainty and Risk-off is the Name of the Game for Today
The cautious détente during the European session yesterday was short-lived. Sentiment soured as the US joined with president Biden announcing additional sanctions on Russia. Ukraine government and bank websites were targeted in cyberattacks and added to lingering fears of an impending all-out war. European stocks erased >1% gains to finish in the negative. Wall Street tanked 1.4-2.6%. Core bonds traded atypical with German yields still rising 4 bps at the front (2y). US yields even added 3.2-6.4 bps across the curve. The Swiss franc did well, closing below EUR/CHF 1.04 again. The euro but also the dollar and even the yen all traded mixed. But while yesterday may not have been a classic risk-off session, today absolutely is. Before dawn, president Putin of Russia ordered a special military operation to target military facilities across Ukraine. Putin said it wishes not to occupy Ukraine but to demilitarize it. Ukraine’s president Zelenskiy called it a “full-scale invasion” and imposed martial law. The US already responded that it will impose severe sanctions on Russia. Other countries including Australia unveiled new sanctions as well. The Moscow Exchange halted trading in the ruble, stocks and futures but damage on other financial markets is material.
Equities: Asian-Pacific stock exchanges plummet with losses mounting to more than 3%. Stock futures point to heavy losses of >4% for Europe and more than 2% in the US. The EuroStoxx50 will probably lose support from the pre-pandemic high at 3867.
Bonds: US Treasuries and German Bunds skyrocket amid safe haven flows. US bond yields currently nosedive 9 to 13 bps with the belly of the curve outperforming. The 10y yield (-12 bps) is looking at support around 1.84%. Germany’s 10y will most likely gap below 0.15% support.
Currencies: a stellar performance by the Japanese yen. EUR/JPY slides from 130 to 128.7 with support at 128 kicking in. USD/JPY gives up the fight with 115 and eases to 114.5 currently. The Swiss franc takes second place. EUR/CHF intraday set a new 7 year low sub 1.03. The dollar finishes the top three. EUR/USD hit the lowest level since the ECB pivot in early February at 1.1236. Every single currency with the slightest whiff of risk, gets sold. The NOK and SEK lose 0.6-1.5% depending the major plotted against. Central-European currencies shed 1-1.4% against the euro and up to 2% against the dollar. The Czech koruna (EUR/ZK 24.91) underperforms regional peers. Turkey’s lira goes 2-2.5% down. The Russian ruble in interbank trading neared USD/RUB 90, printing losses of more than 5%.
Commodities: Brent oil (>5%) surges above $100/barrel for the first time since 2014. Natural gas prices surged more than 10% and go berserk with a 25% rise at the open. With Ukraine as key exporter of corn and wheat, prices of both soft commodities jump 4-5%. The price of safe haven asset gold jumps 1.8% to $1943. Other metals rose up to 3%
Uncertainty and risk-off is the name of the game for today. Although the market impact of geopolitical events tends to fade after a relatively short period of time, we’d advise not to row against the current tide.
News Headlines
The Bank of Korea kept its policy rate unchanged at 1.25% as expected following back-to-back 25 bps rate hikes in November and January. Upward revisions to inflation forecasts suggests that more tightening is under way. The BoK increased its 2022 prognosis from 2% in November to 3.1% while lifting the 2023 number from 1.7% to 2%. Growth forecasts remain unchanged at 3% and 2.5% respectively. Price pressure both comes internally from services costs as externally via commodity prices. The Ukrainian conflict in this respect poses both upside inflation risks and downside growth risks. Governor Lee at his final meeting said that one more rate hike would still not be considered as tightening. Market expectations of a policy rate <=2% by the end of the year are in line with the BoK’s views. The Korean won loses out in this morning’s risk-off move with USD/KRW rising from 1190 to 1202.
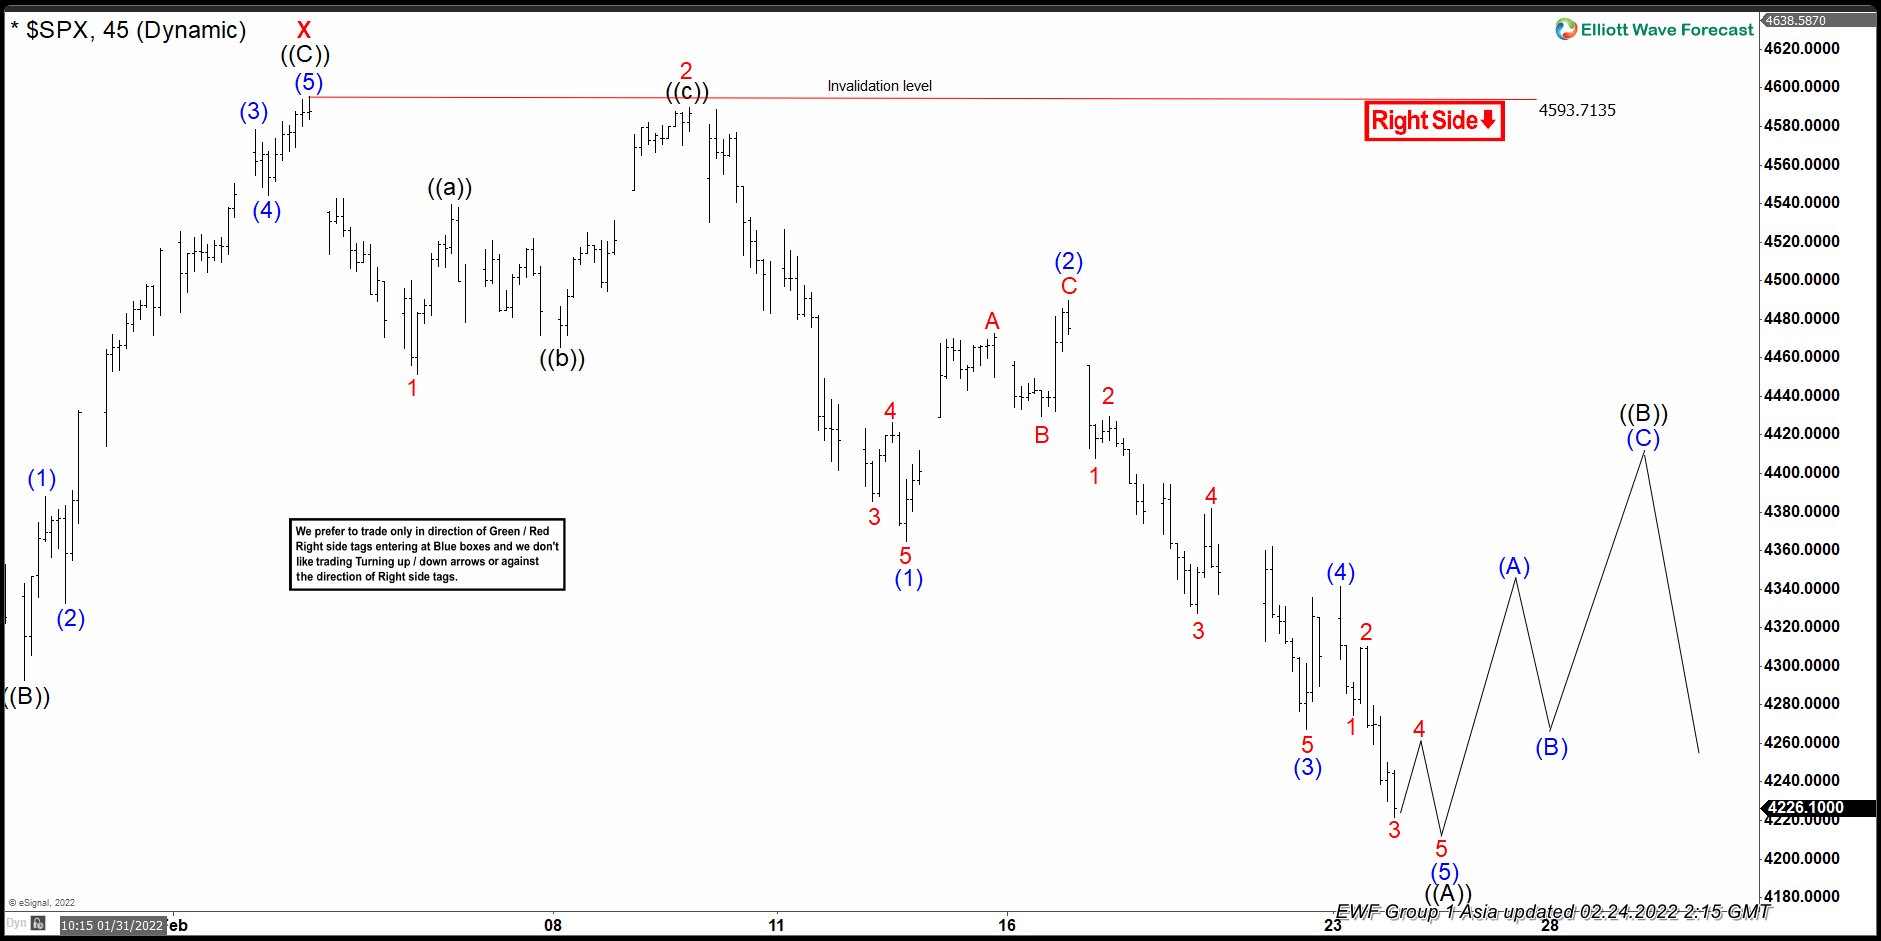
SPX Elliott Wave View: More Downside Is Expected To Take Place
The broader view in SPX suggests that it’s correcting the cycle from March 2020 low cycle. While the short-term cycle from 04 January 2022 high is unfolding as Elliott wave double three structure favoring more downside to take place. Down from the 1/04/2022 high the decline to $4222.62 low ended cycle degree wave w in red. Up from there, the index made a bounce higher as a zigzag structure where wave ((A)) ended at $4453.23 high. Wave ((B)) ended at $4292.46 low and wave ((C)) ended at $4593.71 high thus completing cycle degree x bounce.
Since that peak in x wave, the decline looks to be unfolding in 5 wave impulse sequence suggesting that possible zigzag correction in a lesser degree cycle within cycle degree y leg lower must be taking place. Whereas, wave (1) ended at $4364.84 low. Wave (2) bounce ended at 4489.55 high, wave (3) ended at $4267.11 low, wave (4) bounce ended at $4341.51 high, and wave (5) can end in between $4227- $4140 area lower to complete wave ((A)) lower. Then index is expected to see a bounce higher in wave ((B)) to correct the short-term cycle from 2/02/2022 high before seeing the final leg lower in wave ((C)) of y.
SPX 1 Hour Elliott Wave Chart
Russia Invades Ukraine
Market movers today
Market's focus remains on Ukraine and notably on politicians' response to the Russian invasion of Ukraine.
From Sweden, we will get the labor force survey for January and in the afternoon, the US weekly jobless claims are due for release. We will also have a range of central bank speakers on the wires, including ECB's Schnabel and Fed's Daly, Bostic, Barkin and Mester.
The 60 second overview
Russia launches incursion: Russia has launched a military incursion into Ukraine. At the time of writing, the market reaction appears very much in line with what one would expect: US treasury bond yields are falling and oil has increased a bit overnight to USD101/barrel from the high 90's yesterday. Equity futures are printing -4% to -2%, which is in line with recent trading sessions. In FX, USD/RUB has jumped to our estimated 'worst case' scenario at 87.00. Naturally, EUR/USD has taken the brunt of the effect in non-RUB assets, so far, dropping roughly a small figure from yesterday to 1.1236 and Eastern European currencies (especially PLN) have weakened. The market reaction appears highly in line with what we would expect from the notion of rising risk aversion towards European assets as well as seeing a negative effect from a further rise in energy prices. Naturally, the next step will be to view the reaction from politicians in terms of sanctions.
Final euro area HICP inflation figures for January supported the case of ECB hawks pushing for a faster policy normalisation pace, with strong evidence of building underlying inflation pressures from cost-push inflation (i.e. higher input costs working their way through the pricing chain and being passed on to consumers). As we expect supply chain pressures to persist at least until H2 22 and the demand environment for price increases remaining unusually favourable for companies, we expect goods price inflation to stay elevated this year. We now foresee HICP inflation in 2022 at 4.7% due to higher commodity and goods price inflation pressures and expect euro area core inflation to average 2.4% in 2022 (see also Euro inflation notes - Cost-push inflation: the genie is out of the bottle, 23 February).
When will ECB raise interest rates? There were significant moves in the short end in European fixed income yesterday, seeing 4bp higher yields in 2Y area during the day. The reason behind this move early yesterday may partly have been comments from ECBs Holzmann (hawk) about first rate hike in summer and before ending APP. This would be at odds with the current expectations.
Equities: Futures have plunged -2% overnight as Russian troops invaded Ukraine. Markets have been rightfully discounting parts of that risk, for instance energy being the top performer yesterday in a clear risk-off session. Cyclicals have been selling off (especially growth cyclicals such as tech and consumer discretionary) and defensives and energy the groups faring the best. Most markets are already in correction territory: S&P -11% YTD, Nasdaq -20% (!), Nordics 10-15% (with Oslo the exception). S&P500 stripped of another -1.8%, Dow -1.4%, Nasdaq -2.6% and Russell 2000 1.8% yesterday. As said, futures are plunging another -2% this morning and Asian markets 2-3%.
FI: Yesterday, markets again saw intraday volatility most of the session after a turbulent session Tuesday.
FX: Russia has launched a military incursion in to Ukraine. Rising risk aversion and energy costs weigh on EUR/USD and other European currencies, as could be expected.
Credit: Cash bonds finally saw some signs of relief yesterday with HY tightening 4-5bp and IG 1.5bp. Sentiment was less positive in CDS space where iTraxx Xover widened 1.5bp and Main was unchanged.
Nordic macro
In Sweden today, it is time for the SNDO to announce their new forecast for the central government's finances and borrowing needs. Throughout 2021, the state finances have turned out stronger than expected by the SNDO, notably outperforming expectations by SEK56bn during only the last three months of the year! This makes it highly likely that they will revise up their view on the budget balance of 2022 and we would not be surprised to see a forecast indicating a budget surplus of SEK130-150bn for the full year of 2022.
We also get unemployment figures for the month of January from Statistics Sweden, however these are unlikely to affect markets.
This is War
Russia launched a full-scale invasion of Ukraine as Russian troops landed to Odessa while others crossed the border inti Kharkiv. There are attacks against 10 Ukrainian regions and The Guardian reported that there have been at least seven powerful airstrikes near an airport outside Kyiv where Ukraine’s military fighter bombers are kept.
The situation evolves extremely fast and operations of different kinds are reported. Air raid sirens are sounding in the capital Kyiv and Zelensky calls for martial law in national address.
It’s panic in the markets panic. The S&P500 futures are down by almost 2%, the Nasdaq futures slipped 2.5% and the DAX and Eurostoxx futures lost near 4% this morning. FTSE futures are down more than 2%, but the British blue-chip index should outperform its European and American peers due to its high commodity exposure.
In commodities, the European natural gas futures are already up 10%. Brent crude spiked above the $101 per barrel this morning, as US crude jumped past the $98 mark. Gold flirts with the $1950 per ounce and the bulls are already to target a further advance toward the $2000 threshold.
Corn futures are up more than 4%, wheat futures are up more than 5%, as Russia is the world’s largest grain wheat exporter. Oat futures, soybean futures, silver, platinum, palladium, all move higher this morning expect for sugar, cotton, orange juice and live cattle.
At this point, it’s impossible to bet on any scenario. We can only monitor closely the latest developments and stand ready for more volatility. The VIX index is around the 30 level and should spike higher within the next couple of hours.
The combined revenue exposure of the S&P500 to Russia and Ukraine is only about 1%. It’s not much. Yet, the rising energy and commodity prices are a growing threat for the US equities as they will put a further upside pressure on inflation and force the Federal Reserve’s (Fed) hand to act more aggressively to tame the inflation.
But on the other hand, could the Fed go full blast into an aggressive policy normalization while a war is taking a severe toll on the global growth and the economic recovery? Not so sure. It will sure give Jerome Powell the best excuse to hold fire and soften the market expectations.
Activity on fed funds futures now tells us that the probability of a 50bp hike is no more than around 10% this morning. Of course, the heightened demand in US sovereigns as a safe haven play explains most of the price action on the US papers, yet the Fed should also take into account that there is a war disruption to the global economy and tightening policy too fast may not be a good idea, even with the skyrocketing inflation.
Rising energy prices are also a big headache for Europe, as 40% of Europe’s natural gas and 30% of its oil supplies come from Russia. Yesterday, the data confirmed that inflation in the Eurozone advanced to 5.1% in January, and the February numbers will be even more scary. Yet, the ECB cannot do much about it right now, as the geopolitical tensions could take a severe toll on the economy and the economy needs the ECB’s support.
In the FX, the US dollar index is trending higher this morning and the US dollar is certainly a ‘safe’ tactical currency play as the Ukrainian tensions escalate.
One place that’s not safe is Bitcoin, as the coin has been very vulnerable to both the hawkish Fed expectations and the geopolitical tensions. If the situation in the Ukraine worsens, we could see the price of a coin fall toward the $30K and even below, depending on how bad the situation is. The other cryptocurrencies will also feel the pinch of the Ukrainian war. Remember, when Bitcoin sneezes, all the crypto-industry catches cold. There is also the fact that the higher energy prices make crypto mining more expensive. So that’s also a fundamental reason that prevents Bitcoin from being a safe haven asset in the actual environment.
EUR/USD Daily Outlook
Daily Pivots: (S1) 1.1283; (P) 1.1321; (R1) 1.1341; More...
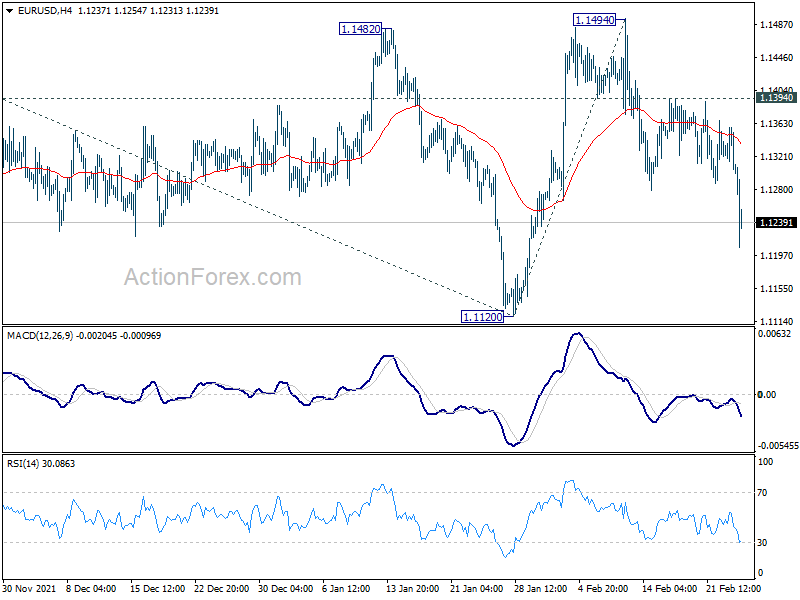
Break of 1.1265 minor support should confirm that EUR/USD's rebound from 1.1120 has completed at 1.1494, after rejection by 1.1482 resistance. Intraday bias is back on the downside for retesting 1.1120 low first. Firm break there will resume larger down trend from 1.2348. Next target is 61.8% projection of 1.2265 to 1.1120 from 1.1494 at 1.0786. For now, risk will stay on the downside as long as 1.1394 minor resistance holds, in case of recovery.
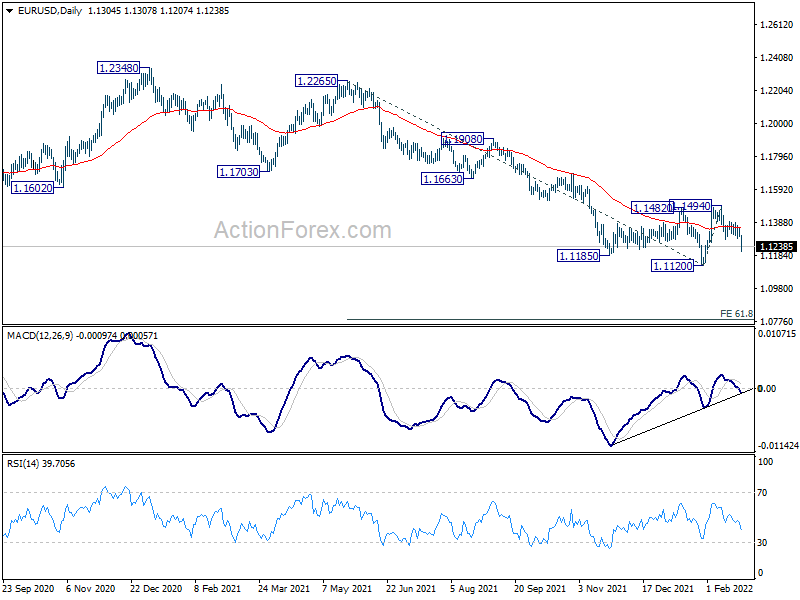
In the bigger picture, the decline from 1.2348 (2021 high) is seen as a leg inside the range pattern from 1.2555 (2018 high). Sustained trading above 55 week EMA (now at 1.1593) will argue that it has completed and stronger rise would be seen back towards top of the range between 1.2348 and 1.2555. However, firm break of 1.0635 (2020 low) will raise the chance of long term down trend resumption and target a retest on 1.0339 (2017 low) next.
GBP/USD Daily Outlook
Daily Pivots: (S1) 1.3514; (P) 1.3567; (R1) 1.3599; More...
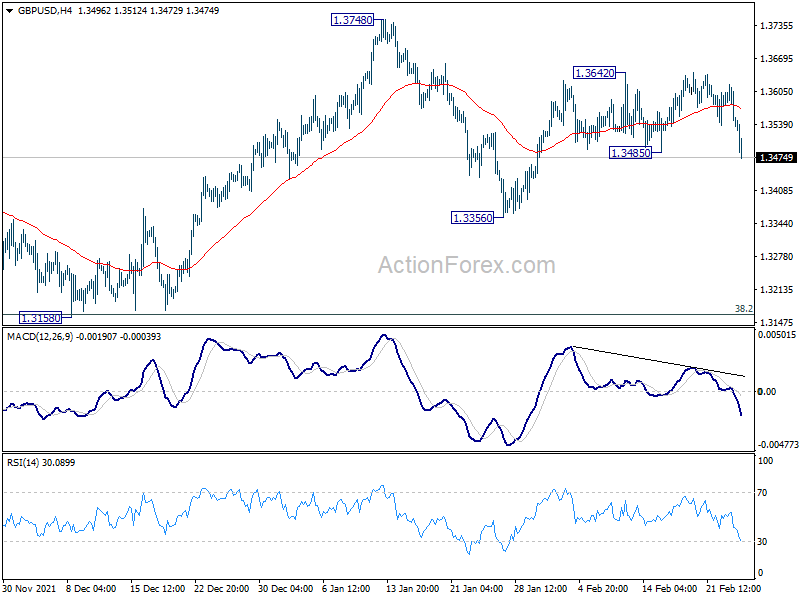
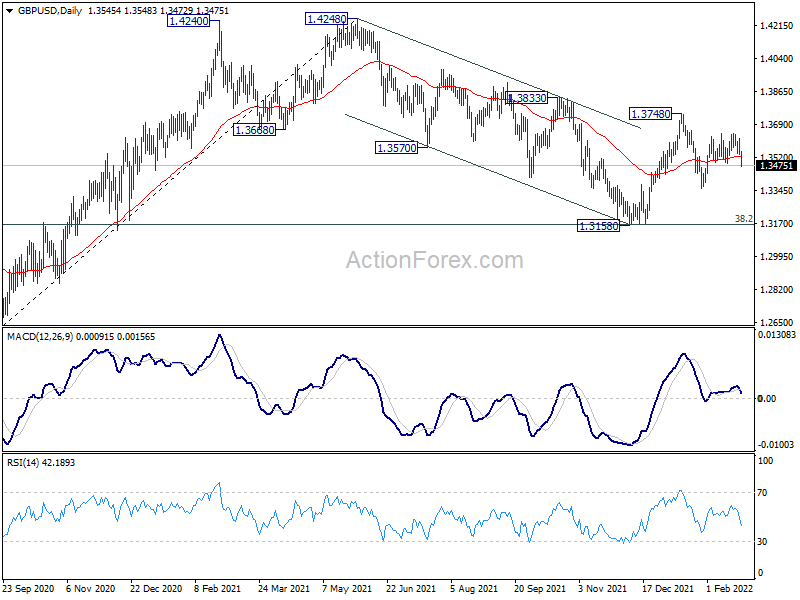
GBP/USD's break of 1.3485 support suggests that recovery from 1.3356 has completed, and fall from 1.3748 is ready to resume. intraday bias is back on the downside for 1.3356 support first. Break there target a test on 1.3158 low. For now, risk will stay on the downside as long as 1.3642 resistance holds, in case of recovery.
In the bigger picture, as long as 38.2% retracement of 1.1409 to 1.4248 at 1.3164 holds, up trend from 1.1409 (2020 low) is still in progress. On resumption, next target will be 38.2% retracement of 2.1161 to 1.1409 at 1.5134. Nevertheless sustained break of 1.3164 will argue that whole rise from 1.1409 has completed and bring deeper fall to 61.8% retracement at 1.2493.
USD/CHF Daily Outlook
Daily Pivots: (S1) 0.9162; (P) 0.9191; (R1) 0.9212; More....
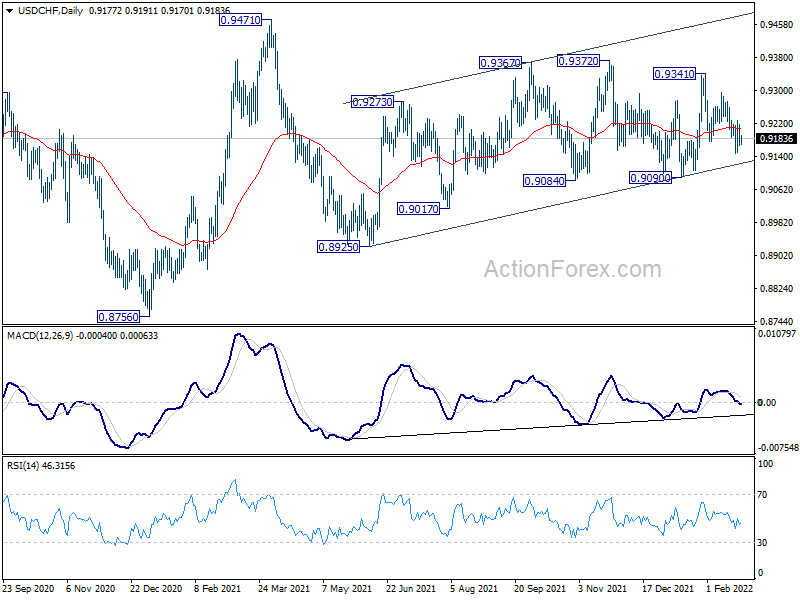
Sideway trading continues in USD/CHF and intraday bias remains neutral. Choppy rise from 0.8925 would still be in favor to extend higher as long as 0.9090 support holds. Break of 0.9341 will target 0.9372 resistance and then 0.9471. On the downside, however, break of 0.9090 will bring deeper fall back to 0.8925 support.
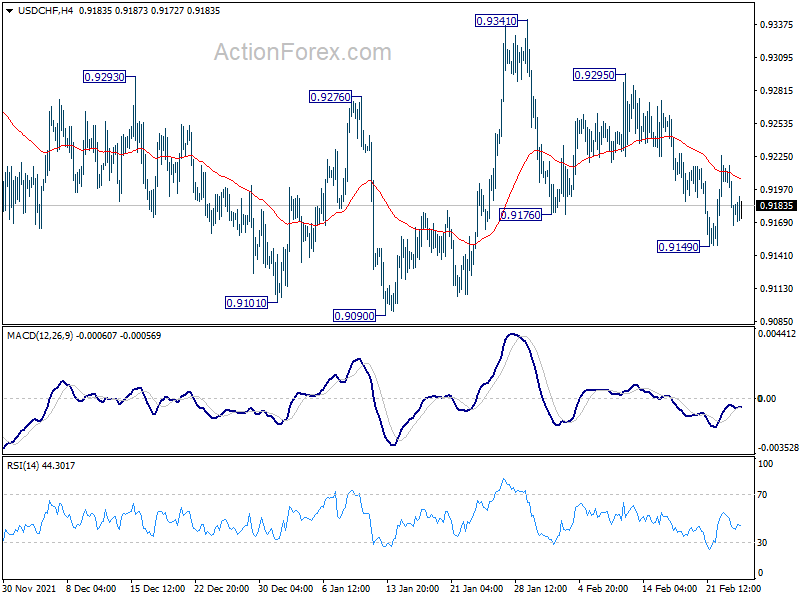
In the bigger picture, medium term outlook will be neutral at best as long as 0.9471 resistance holds. Larger down trend could still extend through 0.8756 (2021 low). However, firm break of 0.9471 will argue that the trend has already reversed and rebound the rally from 0.8756 with another impulsive move.