

Sample Category Title
Stocks Extend Losses in Risk-off Trade
The US stock markets continue to struggle with investor sentiment hurt by several factors ranging from the ongoing situation in Ukraine, to surging inflationary pressures around the and policy tightening from the Fed. While Wall Street attempted a recovery after the minutes of the FOMC’s January meeting were released last night, the gains proved to be short-lived. Traders were happy to sell into that spike. Safe-haven gold is on the rise, as investors attempt to protect their purchasing powers from being eroded by inflation damaging the values of fiat currencies.
There’s thus little surprise to see the indices come under selling pressure again. As we warned earlier this week, the S&P 500 failed to reclaim its 200-day moving average yesterday and has consequently retreated further today.
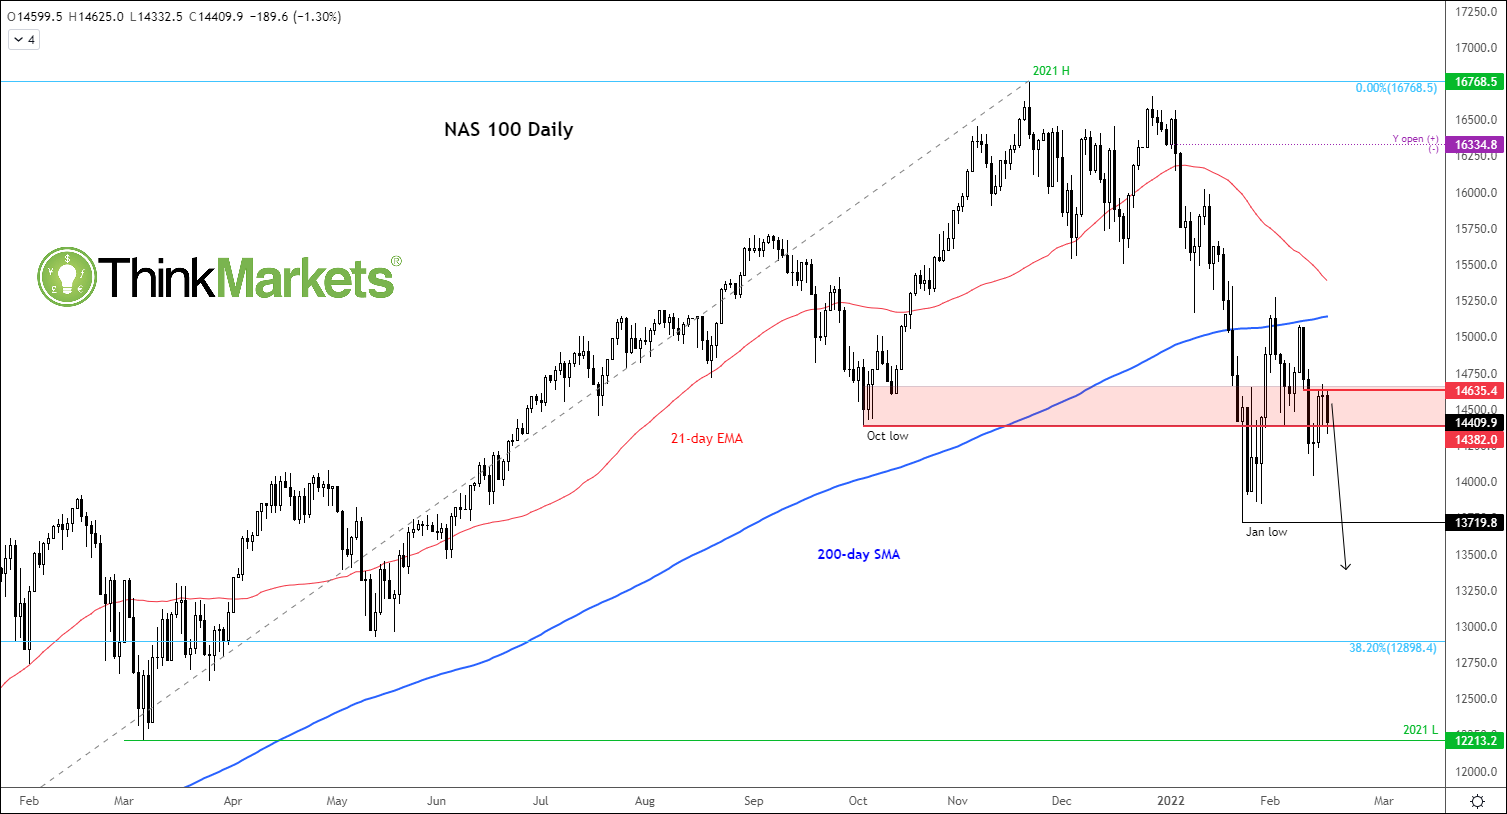
Meanwhile, the technology-heavy and interest-rate-sensitive Nasdaq 100 has turned lower from where it should have:
Source: ThinkMarkets and TradingView.com
As per the chart, the shaded region was support and resistance in the past and this zone has now turned into resistance. A closing breaking below this region should keep the bears in control heading into the business end of the week.
EURGBP Wave Analysis
- EURGBP broke support level 0.8350
- Likely to fall to support level 0.8285
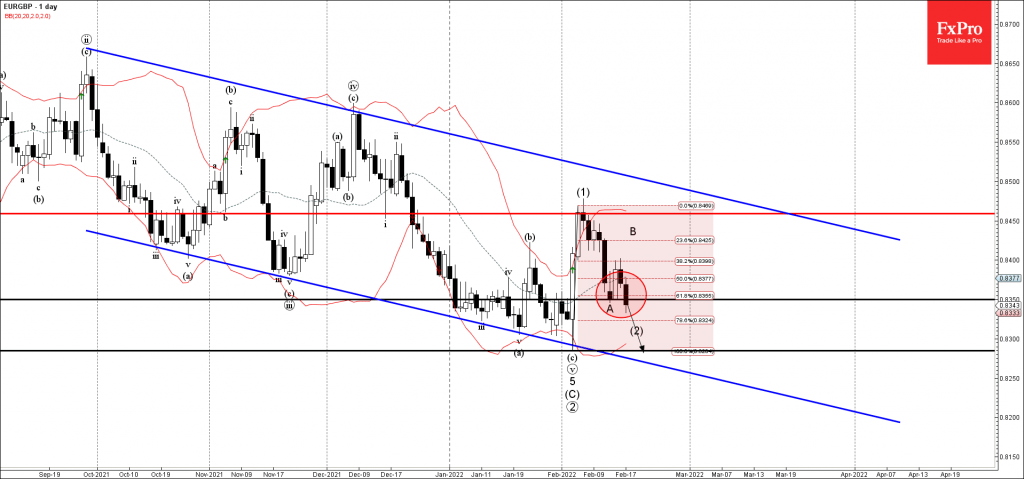
EURGBP currency pair recently broke the key support level 0.8350 (low of the previous wave A), intersecting with the 61.8% Fibonacci correction of the previous wave (1).
The breakout of the resistance level 0.8350 should accelerate the active short-term ABC correction (2) from the start of this month.
EURGBP currency pair can be expected to fall further toward the next key support level 0.8285 (low of wave (C), target for the completion of active short-term ABC correction (2)).
Gold Wave Analysis
- Gold broke key resistance level 1875.00
- Likely to rise to resistance level 1920.00
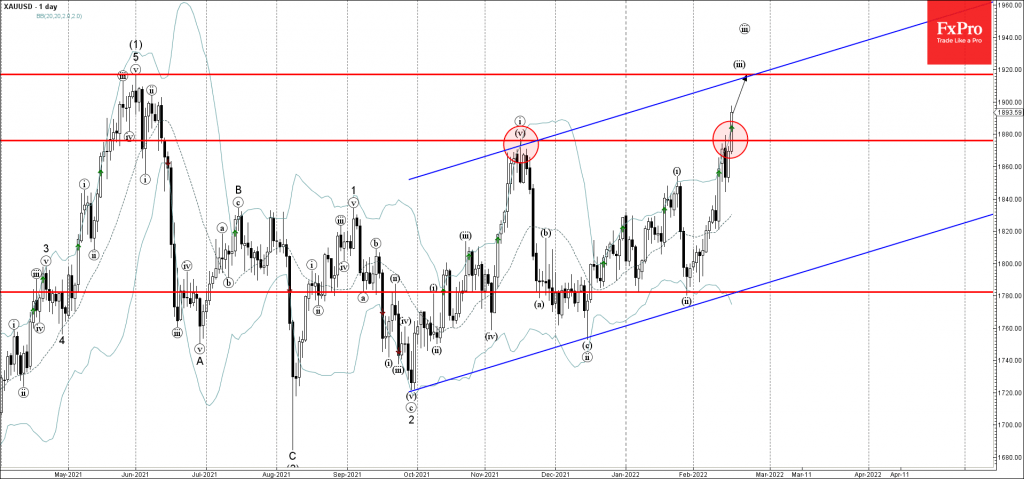
Gold continues to rise after the earlier breakout of the key resistance level 1875.00, which was set as the likely upward target in earlier forecast of this instrument.
The breakout of the resistance level 1875.00 should accelerate the active short-term impulse waves iii and (iii).
Gold can be expected to rise further toward the next key resistance level 1920.00 (target for the completion of wave (iii), intersecting with the daily up channel from September).
As Bitcoin Heads Higher Again, Is It Tracking Gold or Wall Street?
The debate about whether Bitcoin is a good store of value, and thus, comparable to gold, has been rumbling on for some time. But more recently, Bitcoin and other cryptocurrencies have seen some positive correlation with the US stock market, and in particular, with tech and growth stocks. Bitcoin’s incredible post-pandemic rally came to an abrupt halt in November, and the price went into freefall soon after. The moves mirror closely what’s been happening in equity markets. But now that the cryptocurrency king is heading back up again, it’s not clear whether the bulls are taking the lead from gold’s resurgence or the rebound on Wall Street.
Trading like a risk asset
Over the years, Bitcoin and the other major cryptocurrencies such as Ethereum and Ripple have frequently confounded their critics, becoming increasingly mainstream both as a payment option for consumers and as a worthy asset class among institutional investors. This spectacular growth has come even as cryptocurrencies face tougher scrutiny from regulators amid rising cases of fraud and their use in money laundering.
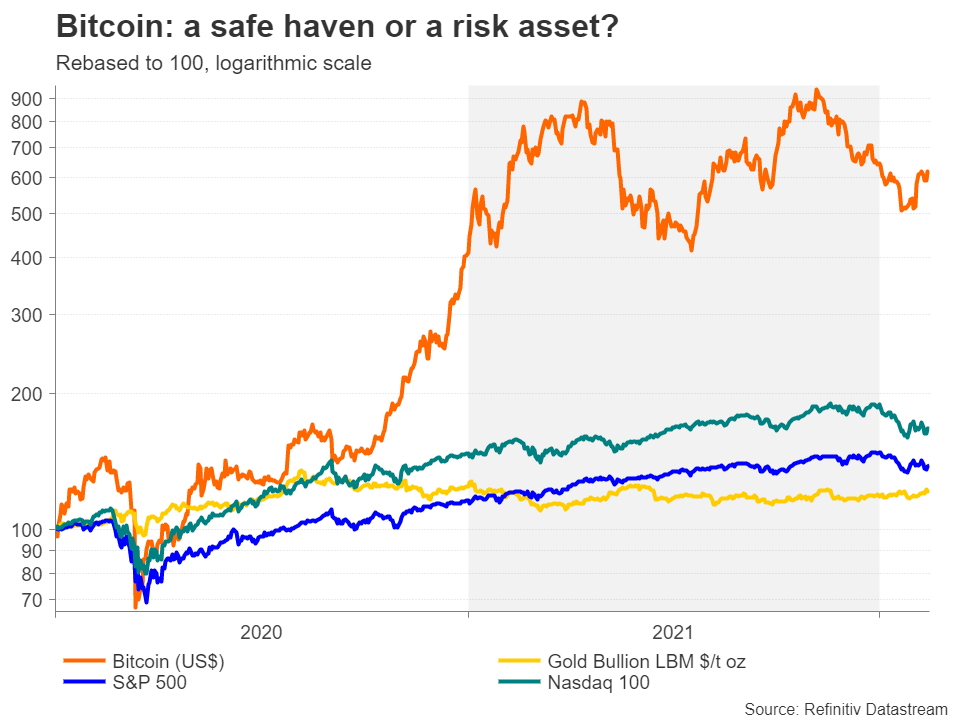
Bitcoin has skyrocketed by more than 500% since the beginning of 2020, and this after two big corrections, both of which took place in 2021. The latter started to take shape as the tech-centric Nasdaq neared its peak. The price is currently trending up, recovering from a six-month low of $36,725 it hit on January 24. The upturn coincides with that in US equities - well, sort of. As Bitcoin started to mature in the mid-2010s, a positive correlation began to emerge with stocks in 2016. That correlation strengthened in 2020 and the close relationship with the S&P 500 since the onset of the pandemic is quite striking.
Digital gold?
However, that relationship has weakened again slightly as Bitcoin’s rebound has been notably stronger than Wall Street’s wobbly comeback. Meanwhile, gold has been crawling higher this year as geopolitical risks have resurfaced. Tensions between Russia and Ukraine propelled the precious metal to eight-month highs above $1,890/oz this week.
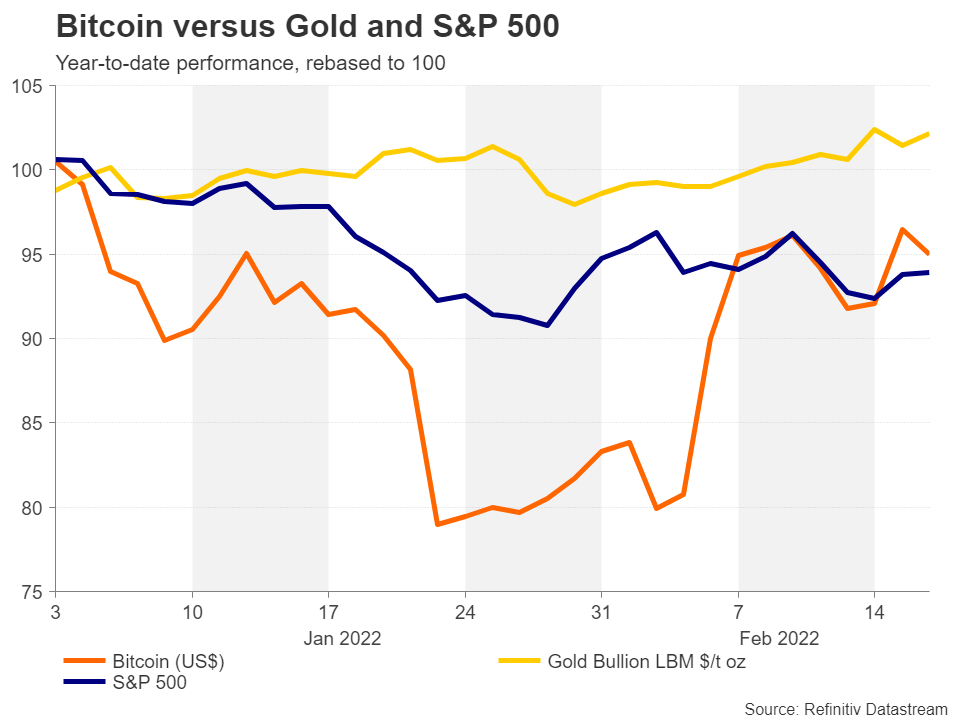
Bitcoin is often compared to the safe-haven gold, with some cryptocurrency enthusiasts dubbing it as the “digital gold”. However, although there have been periods when Bitcoin has risen in tandem with gold, sometimes even denting bullion’s upside, there are few convincing arguments that cryptos have safe-haven attributes.
A store of value
There can be no doubt about Bitcoin’s status as a store of value. Like precious metals, the supply of Bitcoin is fixed, and it can be stored and retrieved at a later date without deteriorating in value. It also functions as a medium of exchange and doesn’t have fundamental factors determining its price the way other assets such as stocks do.
This attribute is also the reason why some investors have been using Bitcoin as a hedge against inflation over the past year. In contrast, it can be argued that the boost to bullion from inflation hedging has been somewhat restrained compared to previous inflationary episodes.
Still, the question remains about whether Bitcoin is as good a store of value as the traditional haven gold. The recent geopolitical developments in Ukraine suggest otherwise. Although the broader rallies in both gold and cryptos coincide, the precise timings of the major price movements are unrelated.
A lot of upside
In fact, Bitcoin’s largest gains this month have been on the back of the improvement in market risk appetite following some upbeat corporate earnings that brought an end to the January slump on Wall Street. The only distinction here is that the rebound in cryptos appears to be on a more solid footing.
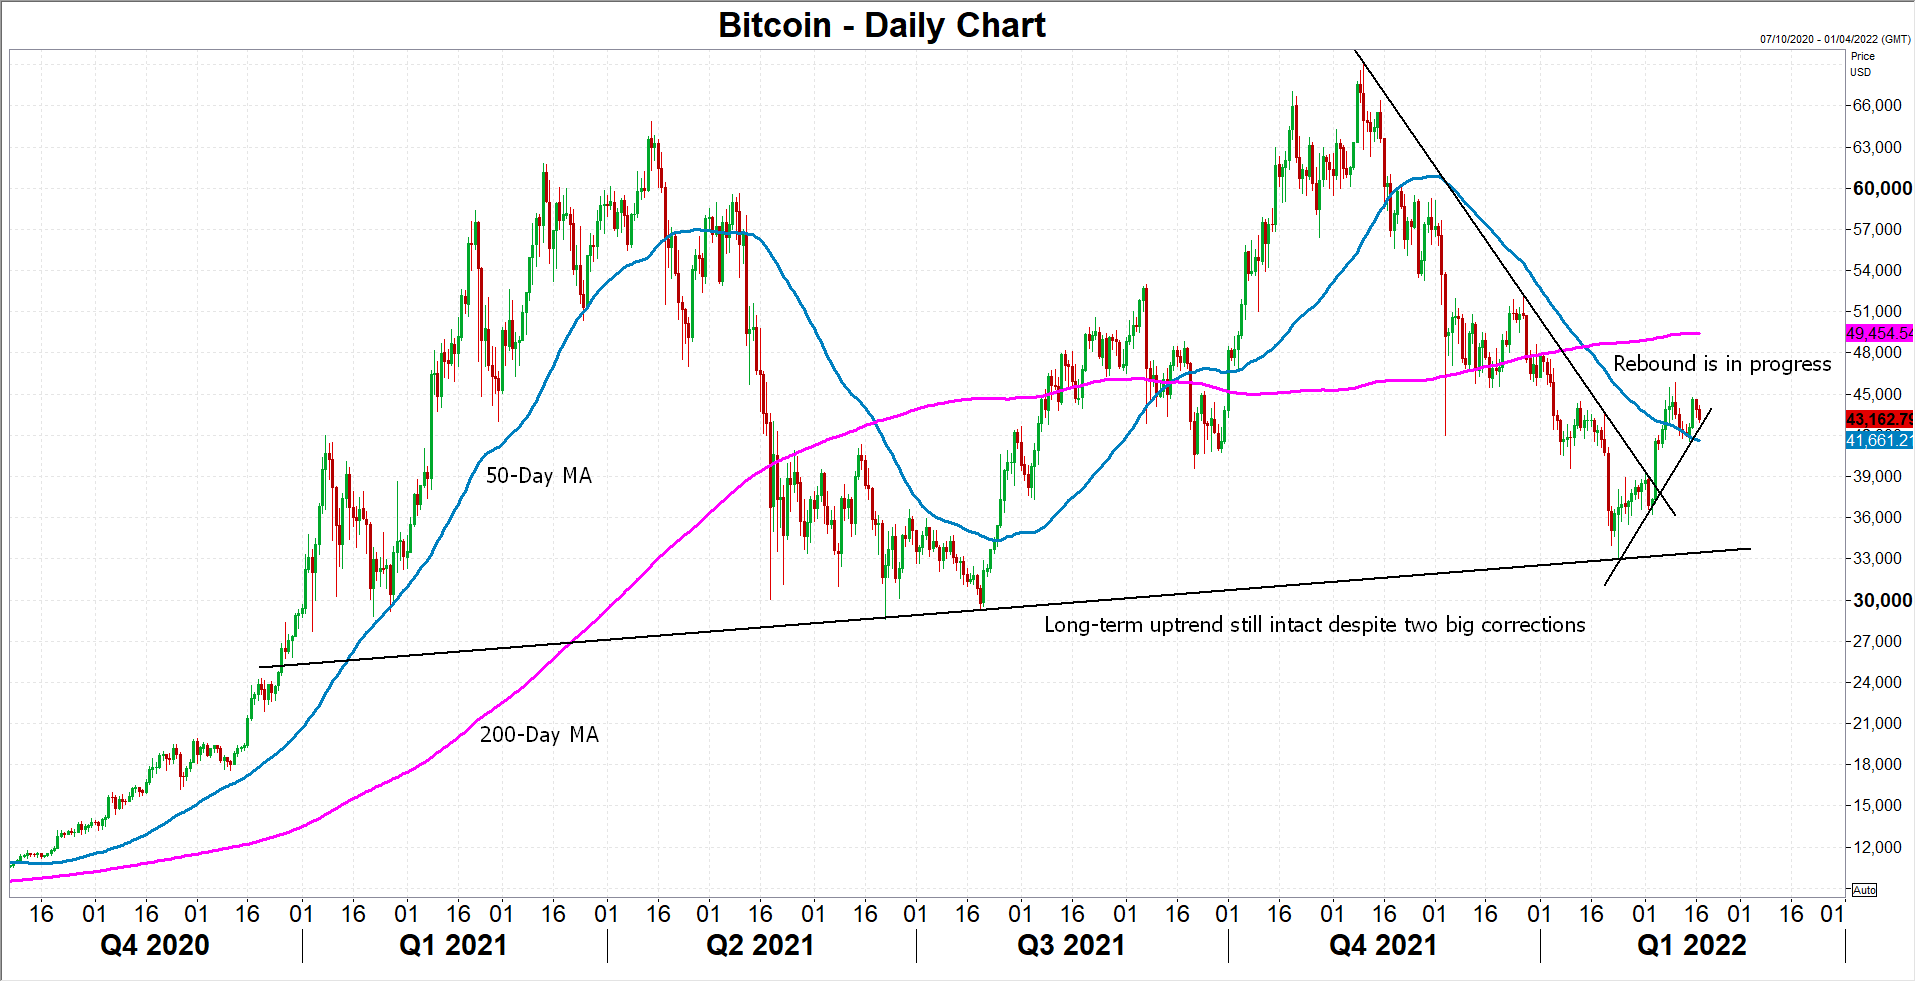
Crypto-specific headlines might have something to do with that. For instance, signs of a pushback against regulators seeking to ban cryptocurrencies have bolstered the uptrend after El Salvador rejected the IMF’s advice to drop Bitcoin as the country’s official currency, while the Russian government appears to have opted to regulate digital currencies rather than outright ban them.
In the meantime, Bitcoin itself has been benefiting from shifting trends within the crypto world, as the very first digital currency has been reasserting its lead over the market lately. Moreover, booming revenue for crypto mining companies despite the recent ban in China has further contributed to the positive sentiment towards Bitcoin.
Another factor to consider here is that a short squeeze triggered by the recent price jumps could have exacerbated the gains in the short term.
Can the rally last?
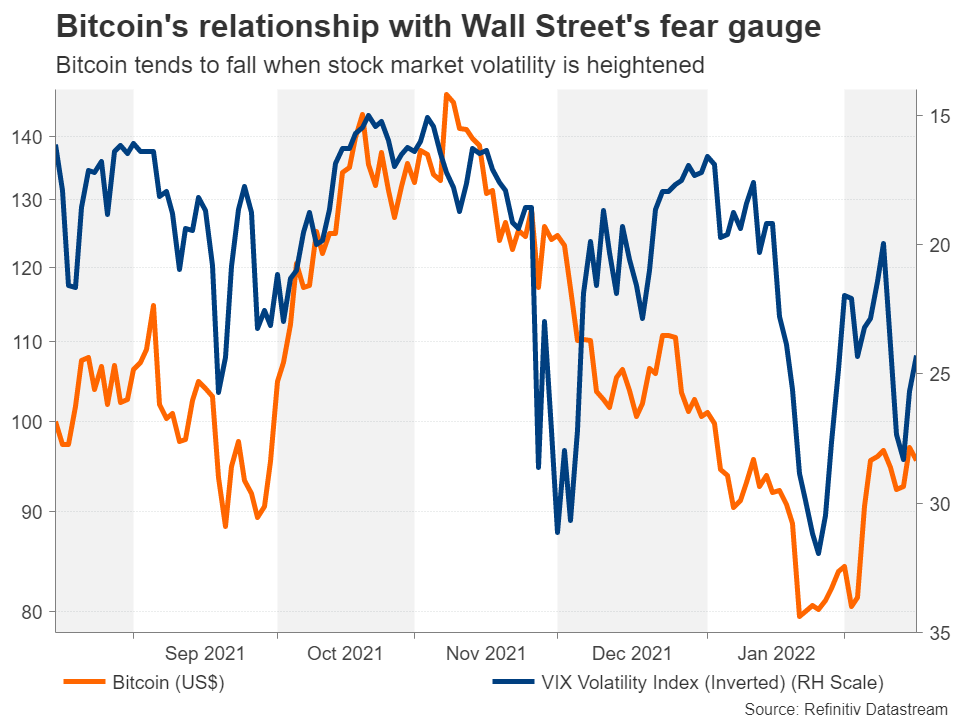
To sum up, the evidence suggesting that Bitcoin is a proxy for risk is far stronger than the evidence backing its safe haven characteristics. After all, it’s hard to justify that an asset can be considered a safe haven when it’s been so in sync (inversely) with the S&P 500’s fear gauge – the VIX volatility index – lately, not to mention the extreme bouts of volatility that are spurred on by tweets from certain high-profile personalities like Elon Musk.
Over the coming months, when the Federal Reserve is expected to start raising interest rates and there is a more substantial tightening in financial conditions, it will be interesting to see what will Bitcoin align itself more closely with: gold or equities? Either way, there’s an elevated chance the latest upleg could soon hit another stumbling block.
However, in the longer-term, with a growing number of investment managers seeing the value of adding Bitcoin and other cryptocurrencies to their portfolios as a means of diversifying their holdings at the very least, further big rallies cannot be ruled out. Even the push for further regulation of cryptocurrencies could work out in the industry’s favour as this could inadvertently endorse cryptos as a valid asset class.
Sunset Market Commentary
Markets
Markets don’t have that much to thrive on. The geopolitical “fake news” accusations in both directions lose impact as market worry. Upheaval in the Luhansk region this morning triggered a risk-off spike in thin Asian dealings, but moves are mostly reversed during European dealings. Main equity indices lose around 0.5%-1%. Core bonds are in consolidation modus. We argued before that the second half of February offered some potential relief to this year’s aggressive sell-off. Markets are positioned for a fierce normalization process (especially in the US and the UK) and lack new guidance between last week’s US CPI data and fresh numbers early March (new CPI batches & US payrolls). Pivotal monetary policy meetings are scheduled for March 10 (ECB) and 16 (Fed). US yields lose 1.9 bps (2-yr) to 4.6 bps (7-yr) today with the belly of the curve outperforming the wings. The US 10-yr yield returns below 2% after extensively testing the 2.06% recovery top. First support comes in near 1.9%. Changes on the German curve vary between -1 bp (30-yr) and -2.4 bps (5-yr). 10-yr yield spread changes vs Germany narrow by up to 4 bps for Italy. UK Gilts continue their outperformance at the front end of the curve (2-yr -7.5 bps today). It’s a complete reversal of Monday’s huge underperformance (2-yr: +15 bps). It’s hard to pinpoint a specific driver behind this week’s dynamics as we didn’t see any BoE comments. Markets potentially ran ahead of themselves going into this week’s UK eco data. Labour market numbers and inflation figures confirmed the BoE’s normalization efforts, but printed all in all near consensus. This could have triggered some scaling down of to tight monetary policy bets. The UK currency is in any case unnerved by the lost of interest rate support today. Sterling outperforms the euro and the dollar for a second session straight with EUR/GBP sliding from 0.8375 towards 0.8340. EUR/USD trades choppy around 1.1360. Today’s eco calendar included mixed US housing data (housing starts unexpectedly fell by 4.1% M/M while building permits significantly beat consensus at 0.7% M/M), and unforeseen increase in weekly jobless claims (248k from 225k). The February Philly Fed Business Outlook declined from 23.2 to 16 (vs 20 consensus). Details showed a broad-based moderation (incl. price pressure) with rising employment & workweek exception to the rule.
News Headlines
In a monthly survey conducted by Kantor Sifo Prospera and commissioned by the Swedish Riksnank, Swedish money markets participants slightly upwardly revised their expectations for the CPIF inflation from 2.0% to 2.1% in 5-yr. Expectations for 1-yr and 2-yr were also upwardly revised to respectively 2.4% and 2.1%. Expectations for the repo rate were upwardly revised to 0.1% in 12 months and 0.5% in 24 months. At its policy meeting on February 10, the Riksbank still held an very accommodative monetary policy stance even as CPIF inflation printed at 4.1% in January. The central bank slightly brought forward its indication for a first rate hike but this still is only expected for the second half of 2024. The Swedish koruna lost further ground this week in the wake of last week’s Riksbank meeting. Today’s survey didn’t help. EUR/SEK trades in the 10.60 area.
After reducing the policy rate 500 bps from 19% to 14% between September and December, the Turkish central bank (CBRT) kept is policy rate unchanged for the third consecutive meeting. The outcome was expected even as the headline inflation in January rose further to 48.7%, leaving the real policy rate at an astonishing -35%. In its communiqué the CBRT repeats that current high inflation is still driven by factors that are not supported by economic fundaments. With respect to recent policy measures, the CBRT expects that the comprehensive review of the policy framework that aims to encourage a permanent lirazation will create a foundation for sustainable price stability. The CBRT also hopes that an expected current account surplus in 2022 will be important to contribute to price stability. ‘The Committee expects the disinflation process to start on the back of measures taken and decisively pursued for sustainable price and financial stability along with the decline in inflation owing to the base effect’. The reaction of the lira to the policy decision was limited. The lira eases slightly with EUR/TRY trading near 15.50.
US Dollar Index Outlook: Dollar Remains at Back Foot after Less Hawkish than Expected Fed Minutes
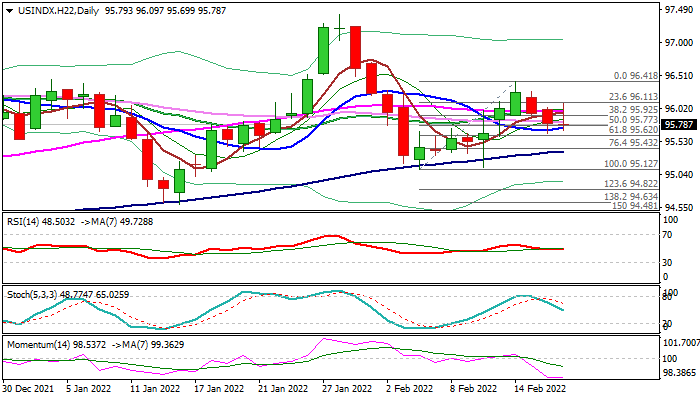
The dollar was deflated in European trading on Thursday and entered the US session in red after traders digested Fed’s minutes of January policy meeting and judged that the central bank’s outlook was less hawkish than expected.
Although the policymakers pointed to the start of post-pandemic tightening cycle, as early as March, there was no consensus about the pace of hiking, as hawks look for initial hike of 0.5% (instead of widely expected 0.25%) and continuation of raising rates on coming meetings, others suggest more cautious approach, with initial hike of 0.25% and reviewing the overall situation in the US economy, as well as inflation rate, ahead of each future policy meeting.
The near-term action pressures pivotal support provided by 10DMA (95.73), also near 50% retracement of 95.12/96.41 upleg, with clear break here to further weaken the structure and risk retest of a higher base at 95.12. Daily MA’s are still mixed, but bearish momentum remains very strong, adding to weaker post-Fed sentiment.
Daily Kijun-sen (96.00) needs to cap the action and keep near-term bears in play.
Res: 96.00; 96.10; 96.27; 96.41.
Sup: 95.65; 95.38; 95.12; 94.87.
ECB Lane: Medium-term inflation expectations increasing towards 2% target over the last year
ECB Chief Economist Philip Lane said in a speech that "medium-term inflation expectations have been increasing from a low base towards the two per cent inflation target over the last year, even before the energy shock."
"There are several factors indicating that the excessively-low inflation environment that prevailed from 2014 to2019 (a period over which inflation averaged just 0.9 per cent) might not re-emerge even after the pandemic cycle is over," he added.
"If the medium-term inflation dynamic is anticipated to stabilise around the two per cent target, this will permit a gradual normalisation of monetary policy," he said. "Whereas if inflation threatens to persist significantly above the two per cent target over the medium term, a tightening of monetary policy will be required."
EURUSD Heads Up Within Ichimoku Cloud
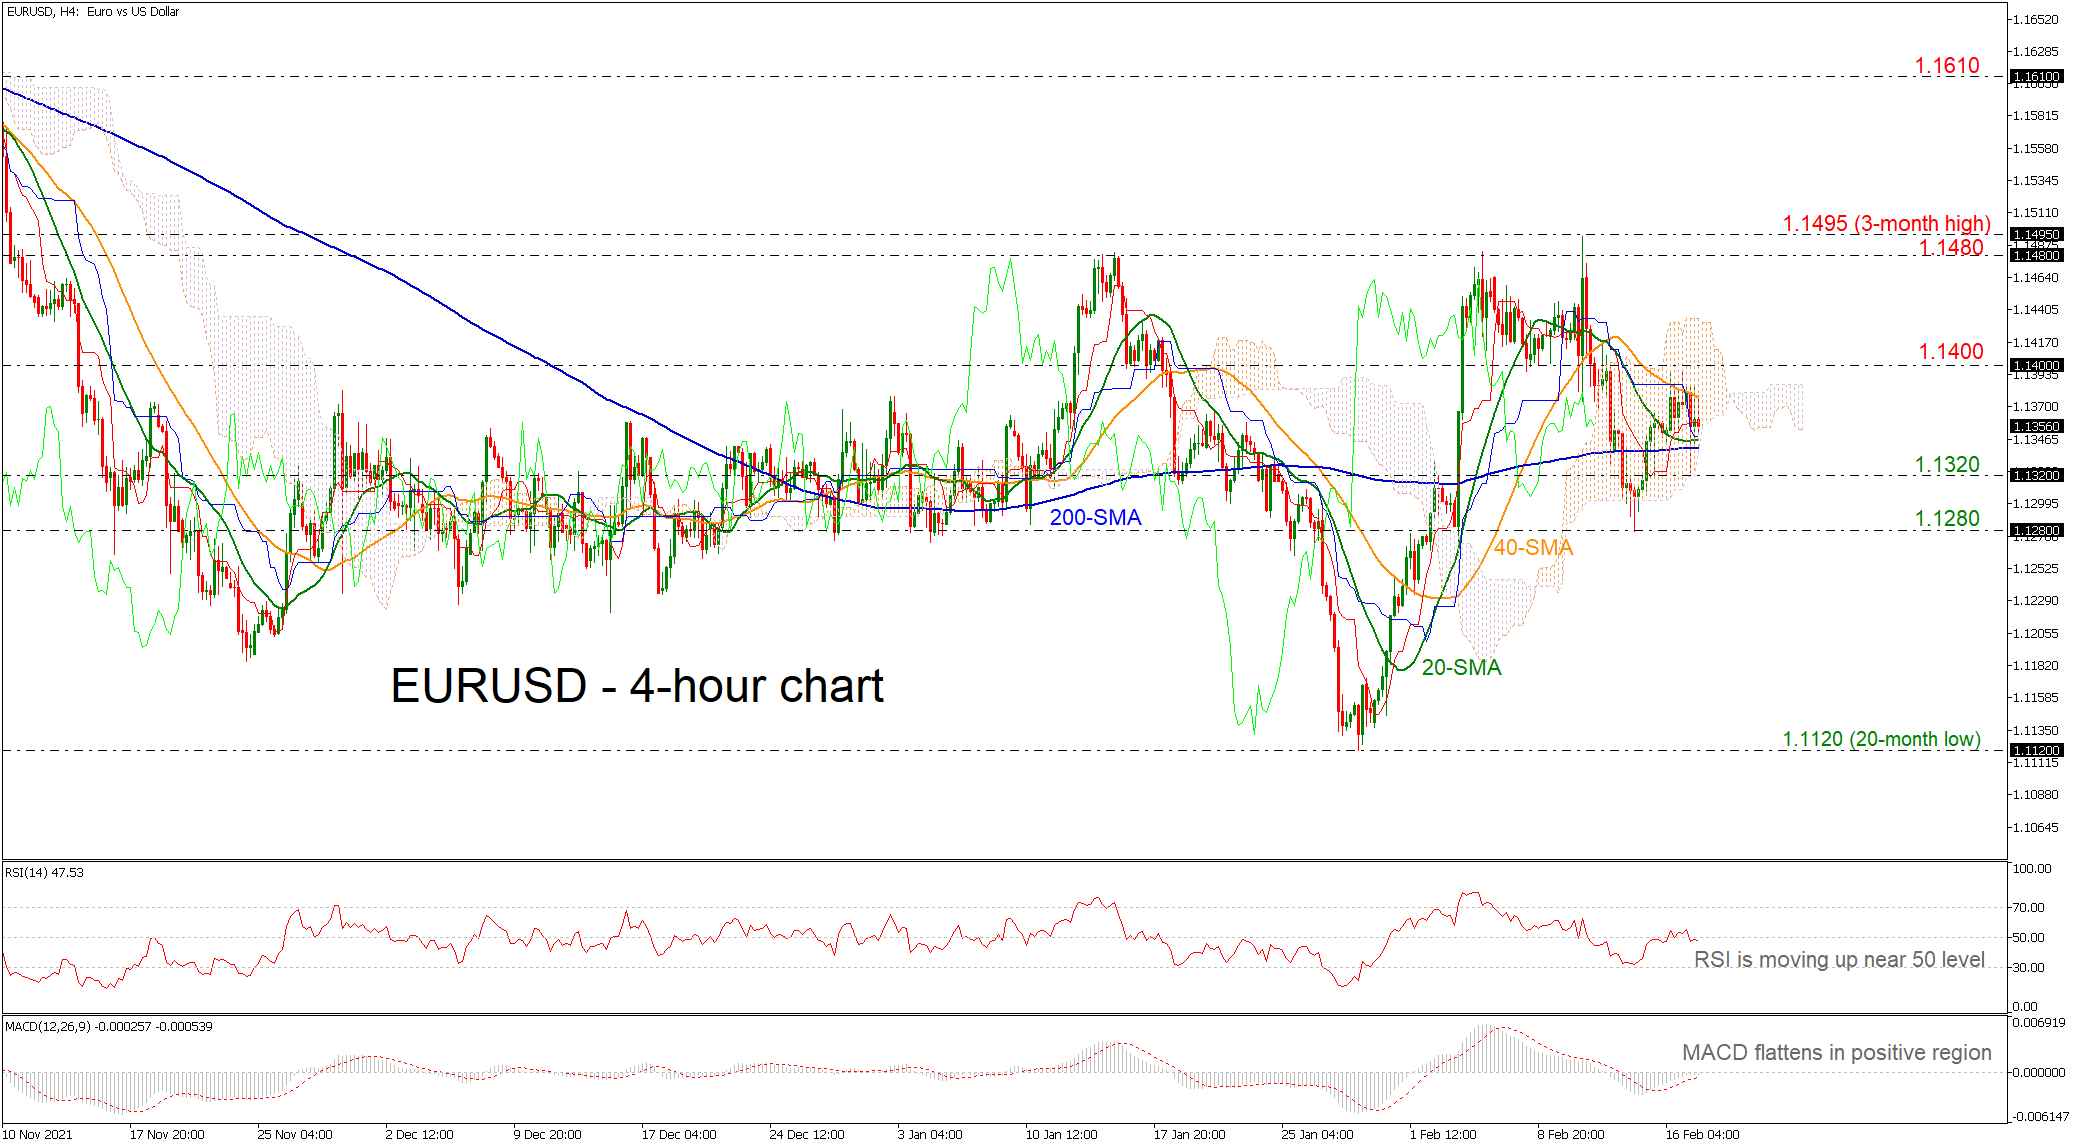
EURUSD is moving with weak momentum over the last couple of sessions, holding within the short-term simple moving averages (SMAs) and the Ichimoku cloud. The technical indicators are mirroring the latest movements as the MACD is moving sideways around the zero level and the RSI is touching its neutral threshold of 50.
If the market manages to pick up speed, the 40-period SMA at 1.1375 could offer nearby resistance ahead of the 1.1400 psychological mark. A significant close above the latter would break the 1.1480 and the three-month high of 1.1495, raising the chances of further increases.
Should prices decline, immediate support could be found around the 200-period SMA at 1.1340 before visiting the 1.1320 barrier. Then a leg below that level, the pair could meet the 1.1280 level before the focus shifts to the 20-month low of 1.1120.
Overall, EURUSD is bullish in the near term as long as it holds above the 200-period SMA. In case it violates this line, bears could take the upper hand.
USD/JPY Won’t Always be a Rising Sun
Rising economic activity and lower inflation from Japan could dampen further gains in USD/JPY just as the broad US dollar’s ascent shows signs of stalling.
USD/JPY has been the best performing major currency pair over the past twelve months. Past performance, however, is not a guarantee of future performance. Rising economic activity and lower inflation from Japan could dampen further gains in USD/JPY just as the broad US dollar’s ascent shows signs of stalling.
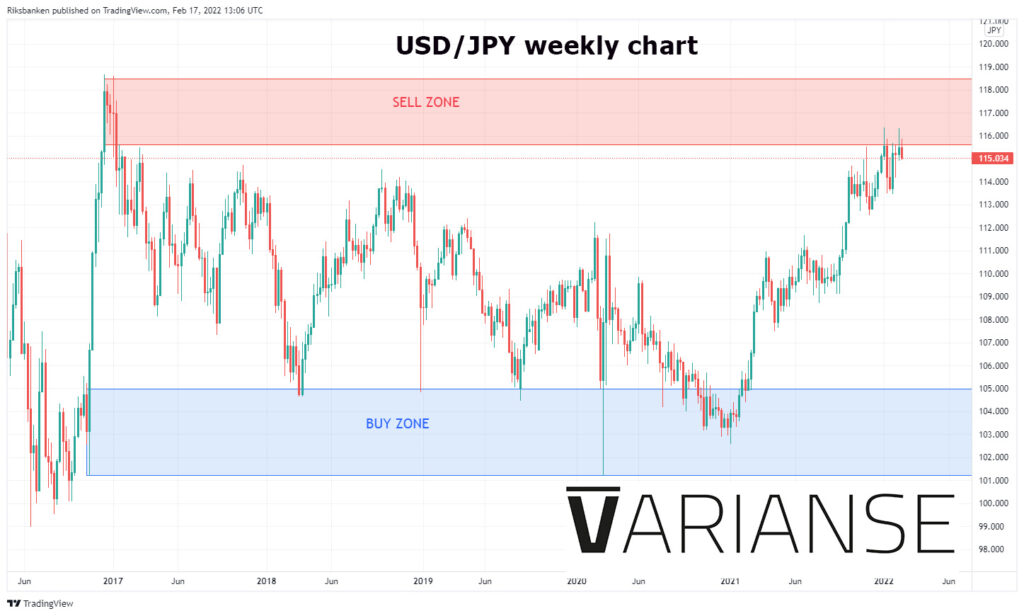
But it hasn’t just been the Japanese yen that has been a loser against the US dollar. Dollar strength has driven all the other major currencies lower against the US dollar over the past year. Propelled by an increasingly hawkish Federal reserve, a strong rebound in economic activity over 2021, and from its role as maximum safe-haven currency during times of global economic and geopolitical upheaval.

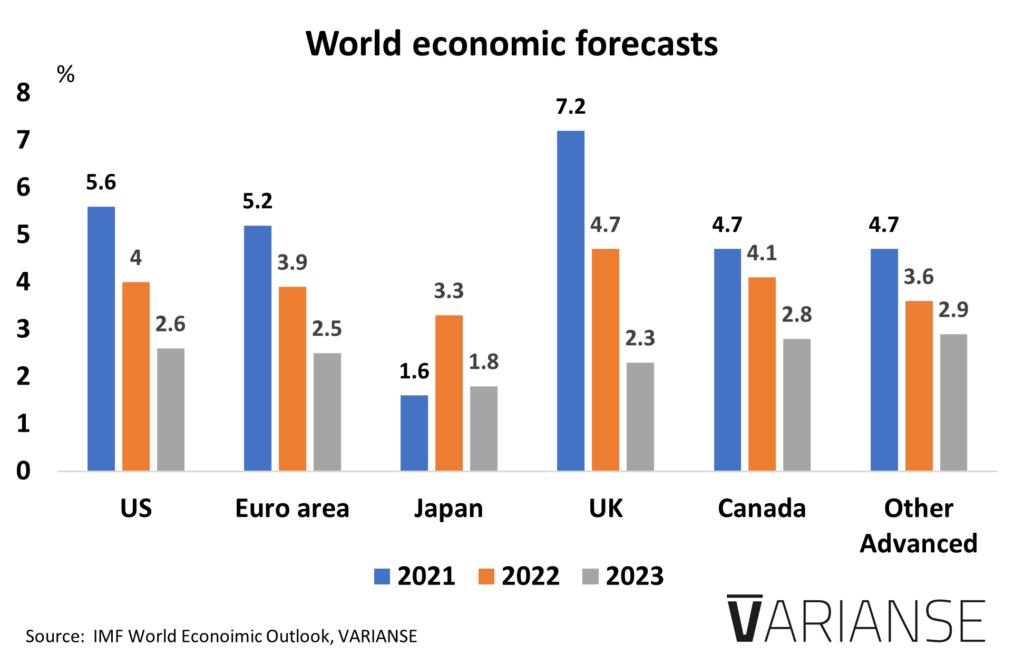
US dollar tailwinds, however, could easily turn into headwinds as the US economy grapples with a slower pace of growth, record high inflation, and as other developed economies further recover from their post-pandemic slump in 2022.
 Furthermore, market expectations around future interest rates from the Federal reserve already look full. At the time of writing, the market was pricing 150 bps of policy tightening in 2022, up from c. 75 bps at the start of the month.
Granted, the Bank of Japan looks nowhere near tightening policy anytime soon as it looks to defend low long-term bond yields, but inflation in Japan is still running low at 0.8% versus 7.5% in the US. In fact, Japan’s low inflation rate could benefit the yen should inflation remain stubbornly high in the US and growth end up surprisingly low.
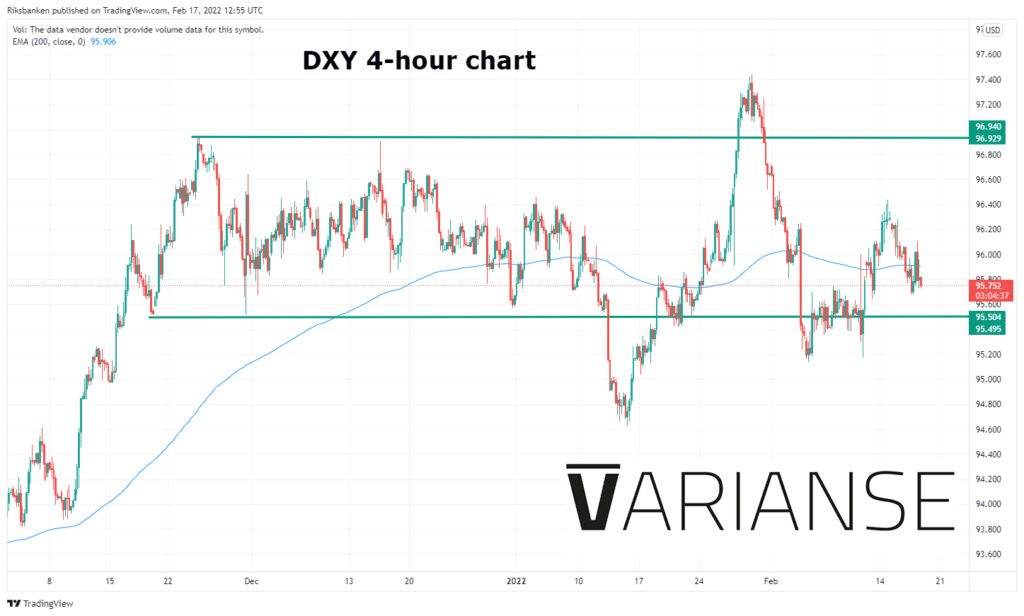
Meanwhile, on a broader basis, last year’s big assent in the US dollar index (DXY), has begun to show signs of stalling. The index, which has more or less traded within a range of 96.929 – 95.504 since, now trades nearer to the bottom. Should the broader DXY stumble, expect the USD/JPY to be a big beneficiary.