

Sample Category Title
Geopolitical Tensions Dent Risk Sentiment
Market movers today
Focus remains on Russia-Ukraine after multiple shelling incidents were reported in Eastern Ukraine in the early hours of Thursday with both sides (separatists and Ukrainian army) reportedly active. Markets have remained relatively calm though despite growing uncertainty. Yesterday's headlines were only in the direction of escalation of the conflict. Overnight, the US confirmed that Blinkin and Lavrov are to meet next week in an attempt to reach a diplomatic solution. This supported the risk sentiment overnight.
Friday's data calendar is pretty empty, with UK retail sales, EA consumer confidence and US existing home sales due.
Several Fed speakers on the wires as well: Evans, Waller, Williams and Brainard. We now expect Fed to hike rates by 200bps this year and continue to look for any hints from the policymakers regarding the pace of tightening or even the possibility of an emergency rate hike before the March meeting.
The 60 second overview
FOMC comments: Bullard was again on the wires yesterday repeating his hawkish views of 100bp hike by July and start a balance sheet reduction in Q2. Furthermore, he said that there may be a need to increase the policy rate above the neutral rate (2%). Markets did not react much to the signals. Mester also supported a more aggressive Fed tightening to get inflation lower.
Fed hiking cycle: This morning we published a short paper on how the Fed hiking cycle differs from previous cycles, see Research US: How the coming Fed hiking cycle will differ - and why it matters, 18 February. A key difference is that the Fed is much more behind the curve this time which points to a more front loaded hiking cycle. Another difference is that the 2-10 yield curve is flatter this time at rate take-off. We believe the Fed will aim to counter an inversion (or at least postpone it) by doing 'active QT' starting in May; hence sell bonds outright rather than only allowing them to run off. All else equal, this will add upward pressure on long bond yields. 'Active QT' also puts us in unchartered territory when it comes to Fed tightening, which warrants higher risk premium in risk assets compared to previous cycles.
Equities: The zig-zag market continued, with equities lower - and sharply lower in the US session. Ukraine continued to dominate the narrative, along with weakish macro and monetary policy. Investors continued to shift into defensives and out of cyclicals (especially growth cyclicals). Tech and consumer discretionary underperformed consumer staples by 3p.p. This summarized to S&P500 -2.1%, Dow -1.8%, Nasdaq -2.9% and Russell -2.5%. According to US futures we are in for another zig-zag today, with futures pointing higher.
FI: Geopolitical headlines and EUR rates market catching up with the late-night rally on Wednesday after the FOMC minutes resulted in 4-5bp lower yields in the 10y point across most jurisdictions. Yields declined across the entire maturity spectrum, but mostly in the front end, with Schatz 6.7bp lower. 10s30s were broadly unchanged while Bund spreads yet again widened (by 2bp yesterday). With the weekend approaching and sensitivity to the geopolitical headlines, we expect a choppy session with the balance of risks skewed for lower rates, although the outlook for a meeting between Blinkin and Lavrov supported risk sentiment overnight.
FX: Geopolitics continue to take centre stage as headlines in terms of Russia/Ukraine continue to drive choppy price action - not least in commodity and risk sensitive currencies. EUR/USD trades just north of 1.1350 while both EUR/SEK and EUR/NOK have moved above 10.60 and 10.10, respectively.
Credit: Due to the skirmishes in the Eastern Ukrainian border-land and due to less benign rhetoric from Russian and US officials, the geopolitically driven risk-off sentiment resumed yesterday. Main widened 1.3bp to 67.7bp and Xover widened 8.2bp to 331.1bp. Even so, the primary markets appear to be open, as exemplified by prints from both Sagax and Vasakronan.
Nordic macro
In Sweden, January inflation numbers due out today at 08:00. We expect core to pick up to 1.9% yoy such that our estimate is slightly higher than the Riksbank estimate and consensus. That said, January is notoriously hard to predict due to re-weightings and this time the uncertainty is larger than normal due to flagged price hikes on goods from various businesses.
Technical Outlook and Review
DXY:
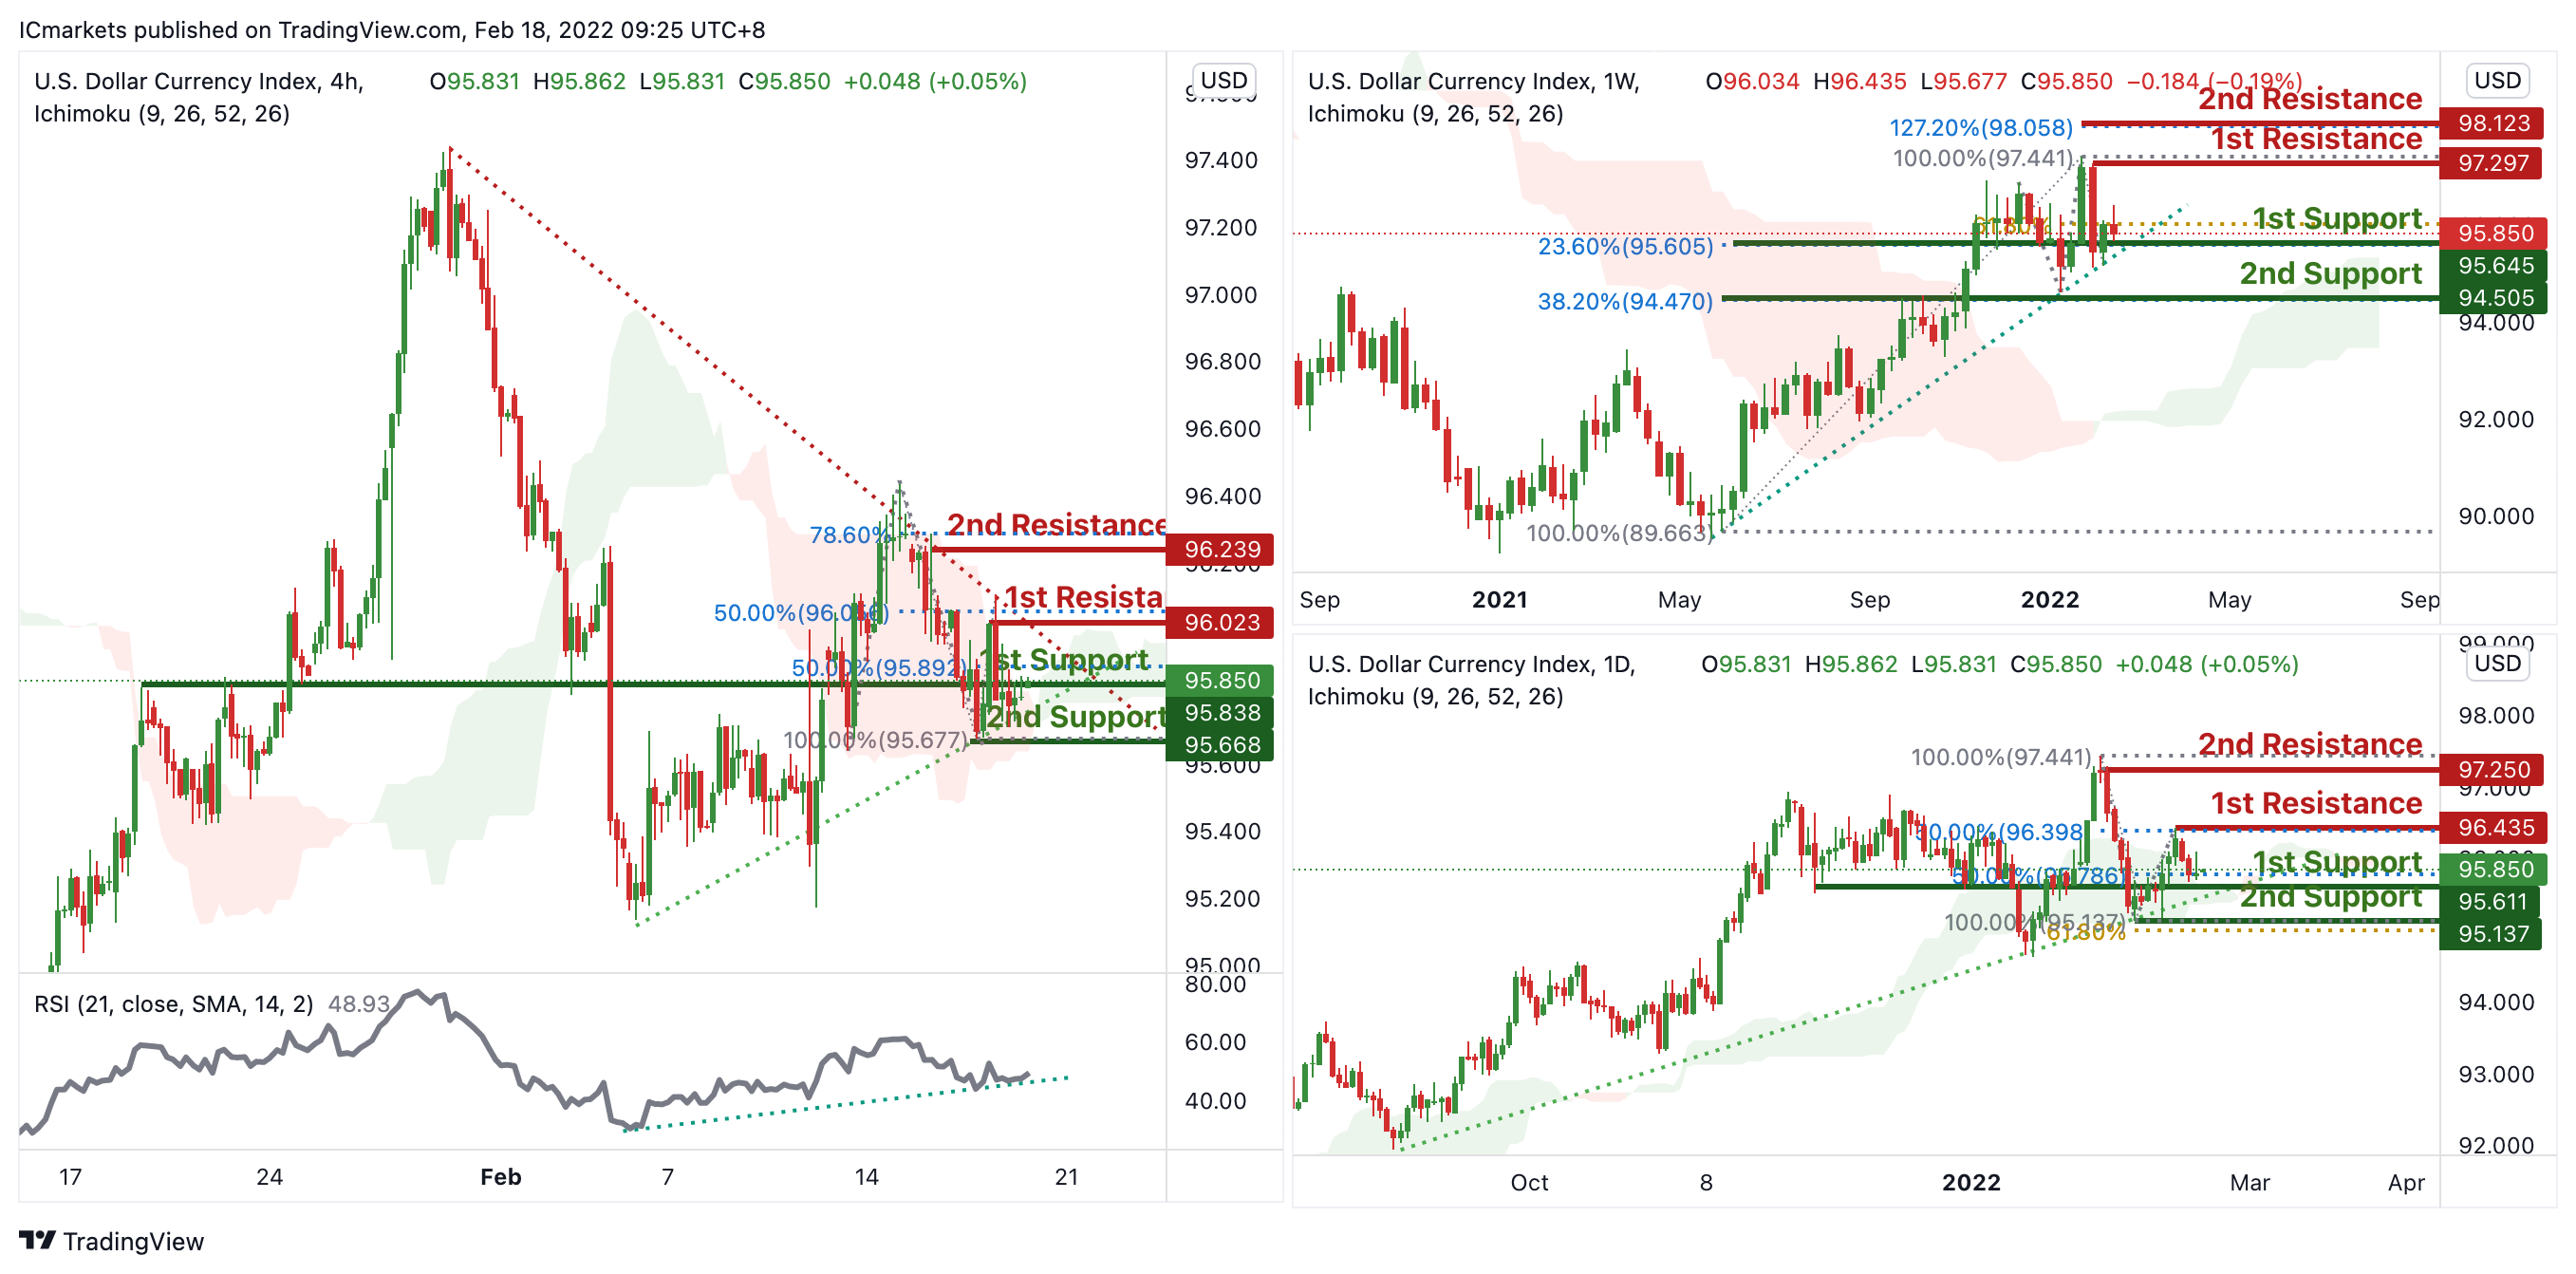
On the weekly, prices are on bullish momentum and abiding to our ascending trendline. We see potential for prices to bounce from our 1st support at 96.645 in line with 23.6% Fibonacci retracement and 61.8% Fibonacci extension towards our 1st resistance at 97.297 in line with 100% Fibonacci retracement. Prices are trading above our Ichimoku Cloud support, further supporting our bullish bias.
On the daily, prices are on a bullish momentum and abiding to a bullish trendline. We see potential for prices to bounce from our 1st support at 95.611 in line with 50% Fibonacci retracement towards our 1st resistance at 96.435 in line with 50% Fibonacci retracement. Prices are trading above our Ichimoku Cloud support, further supporting our bullish bias.
On the H4 timeframe, prices are consolidating in a triangle. We would expect a bounce from our 1st support at 95.850 in line with 50% Fibonacci retracement towards our 1st resistance at 96.023 in line with 50% Fibonacci retracement. Our bullish bias is further supported by RSI depicting bullish momentum and also prices trading our ichimoku clouds.
Areas of consideration:
- H4 time frame, 1st resistance at 96.023
- H4 time frame, 1st support at 95.838
XAU/USD (GOLD):
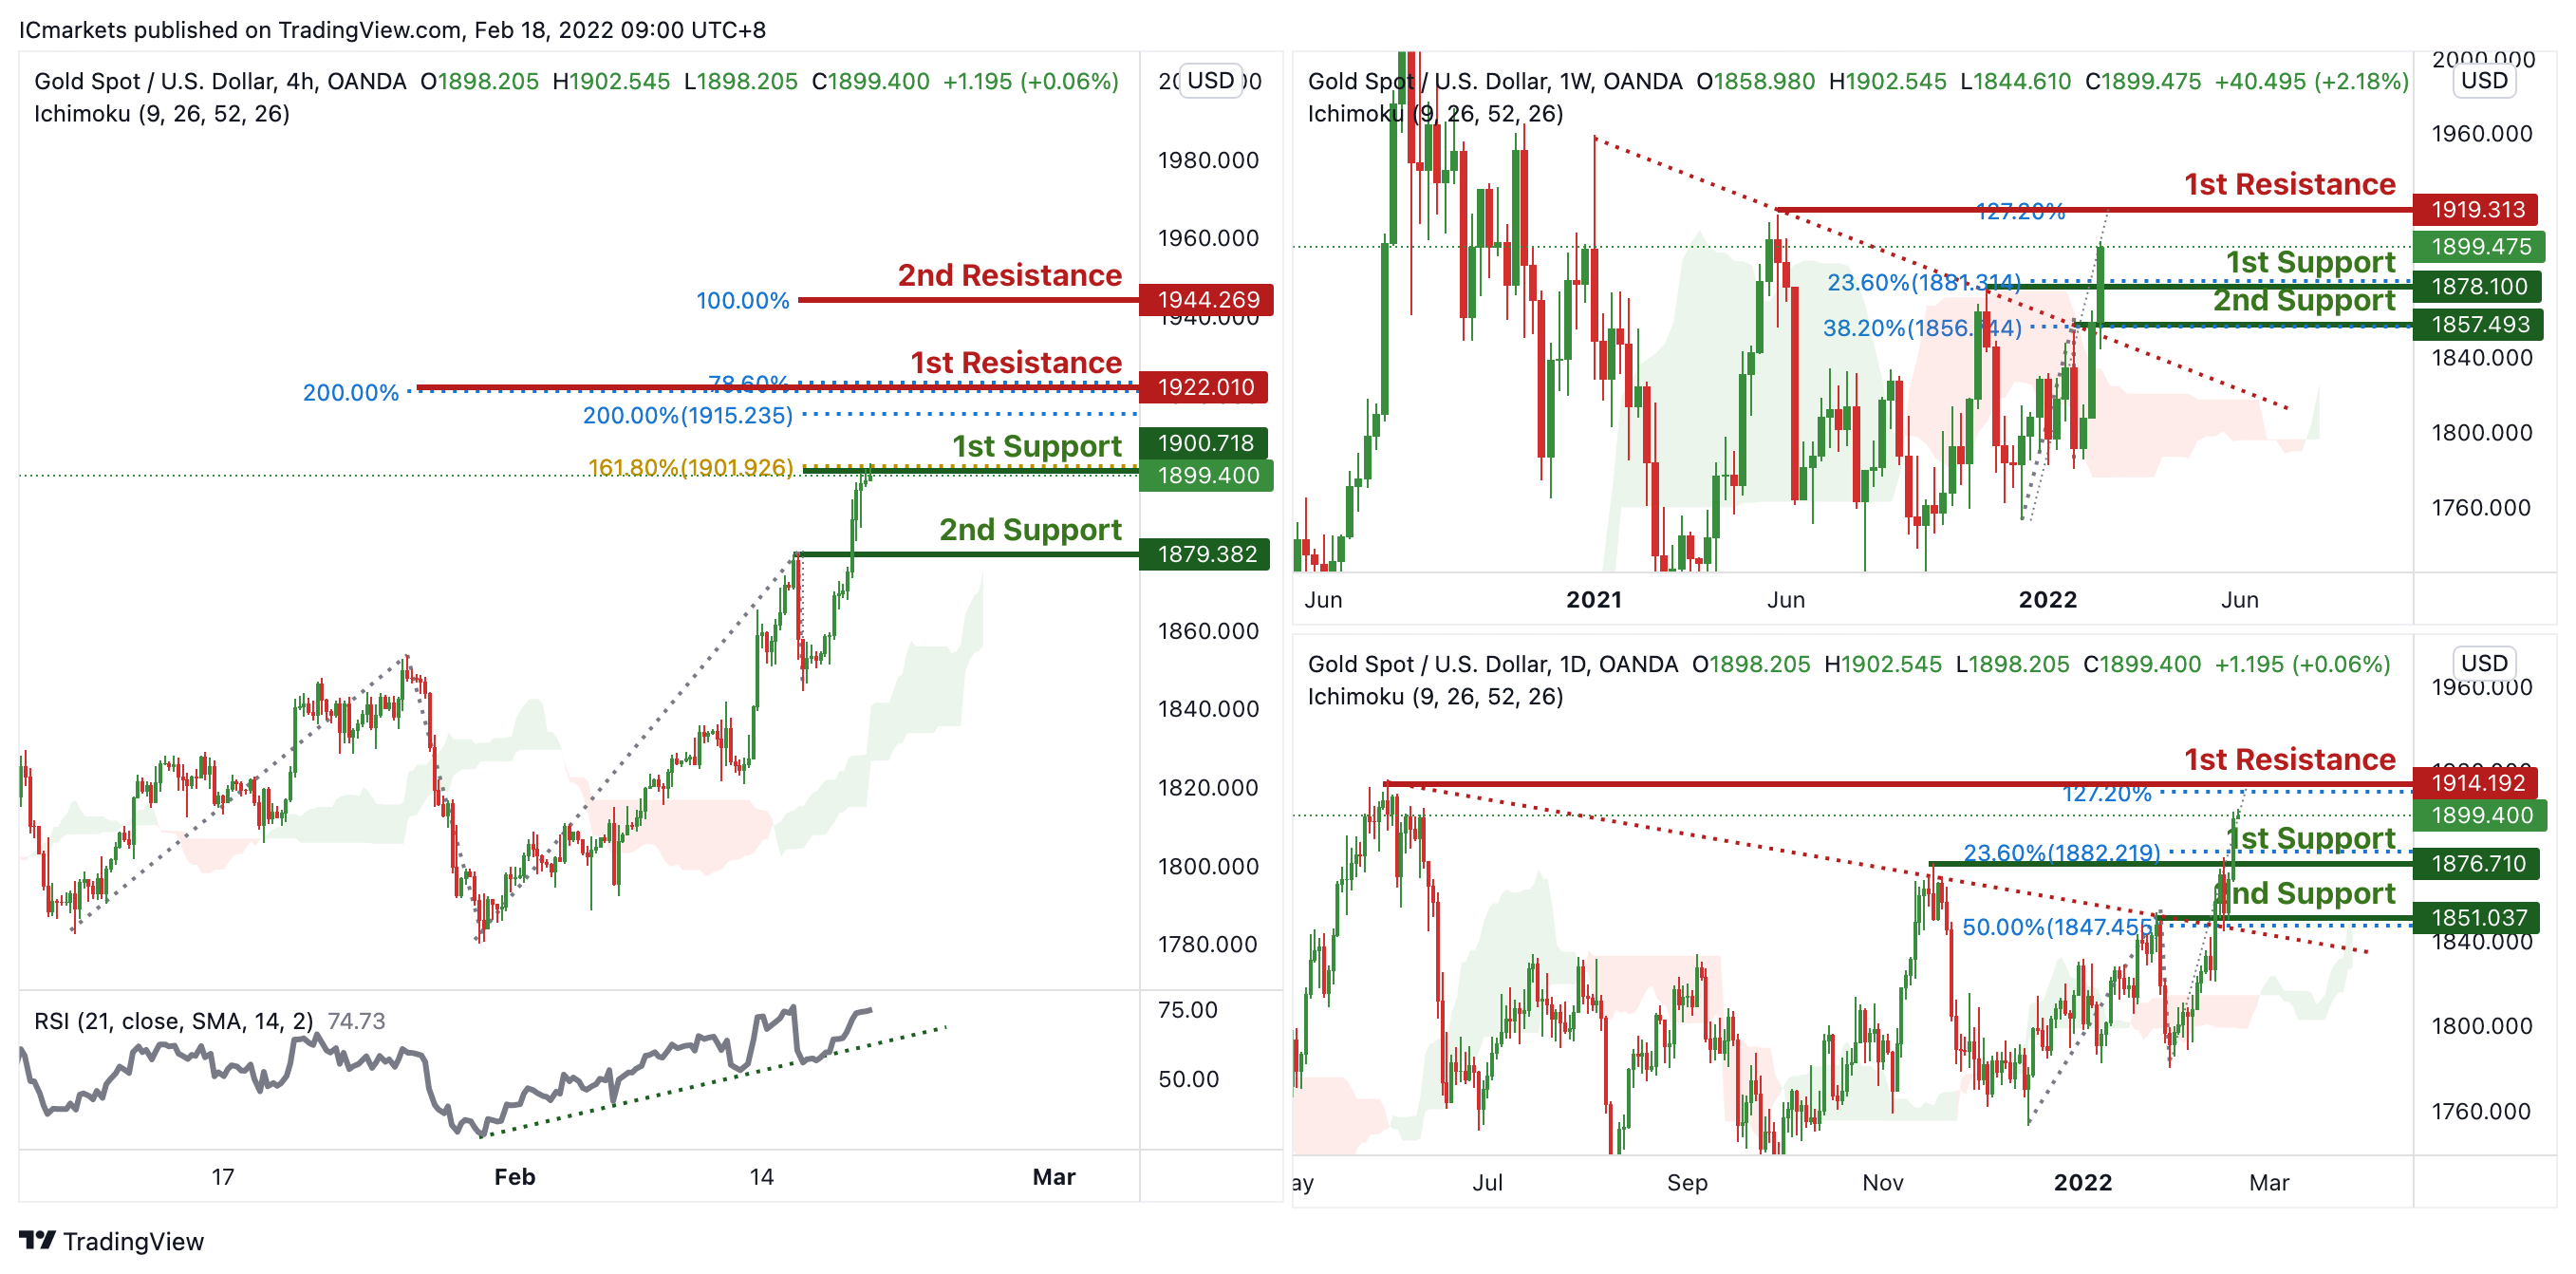
On the weekly, prices have broken out of our descending trendline resistance and are on bullish momentum. We see the potential for bullish continuation from our 1st support at 1878.1 in line with 23.6% Fibonacci retracement towards our 1st resistance at 1919.313 in line with 127.2% Fibonacci extension. Ichimoku is supporting our bias by forecasting green clouds.
On the daily, prices have broken out of our descending trendline resistance and are on bullish momentum. We see the potential for bullish continuation from our 1st support at 1876.71 in line with 23.6% Fibonacci retracement towards our 1st resistance at 1914.192 in line with 127.2% Fibonacci extension. Prices are trading above our Ichimoku support, further supporting our bullish bias.
On the H4 chart, prices are on bullish momentum. We see potential for bullish continuation from our 1st support at 1899.4 in line with 161.8% Fibonacci projection towards our 1st resistance at 1922.010 which is an area of Fibonacci confluences. Prices are trading above our Ichimoku support and RSI is depicting bullish momentum, further supporting our bullish bias.
Areas of consideration:
- 4h 1st support at 1899.4
- 4h 1st resistance at 1922.010
GBP/USD
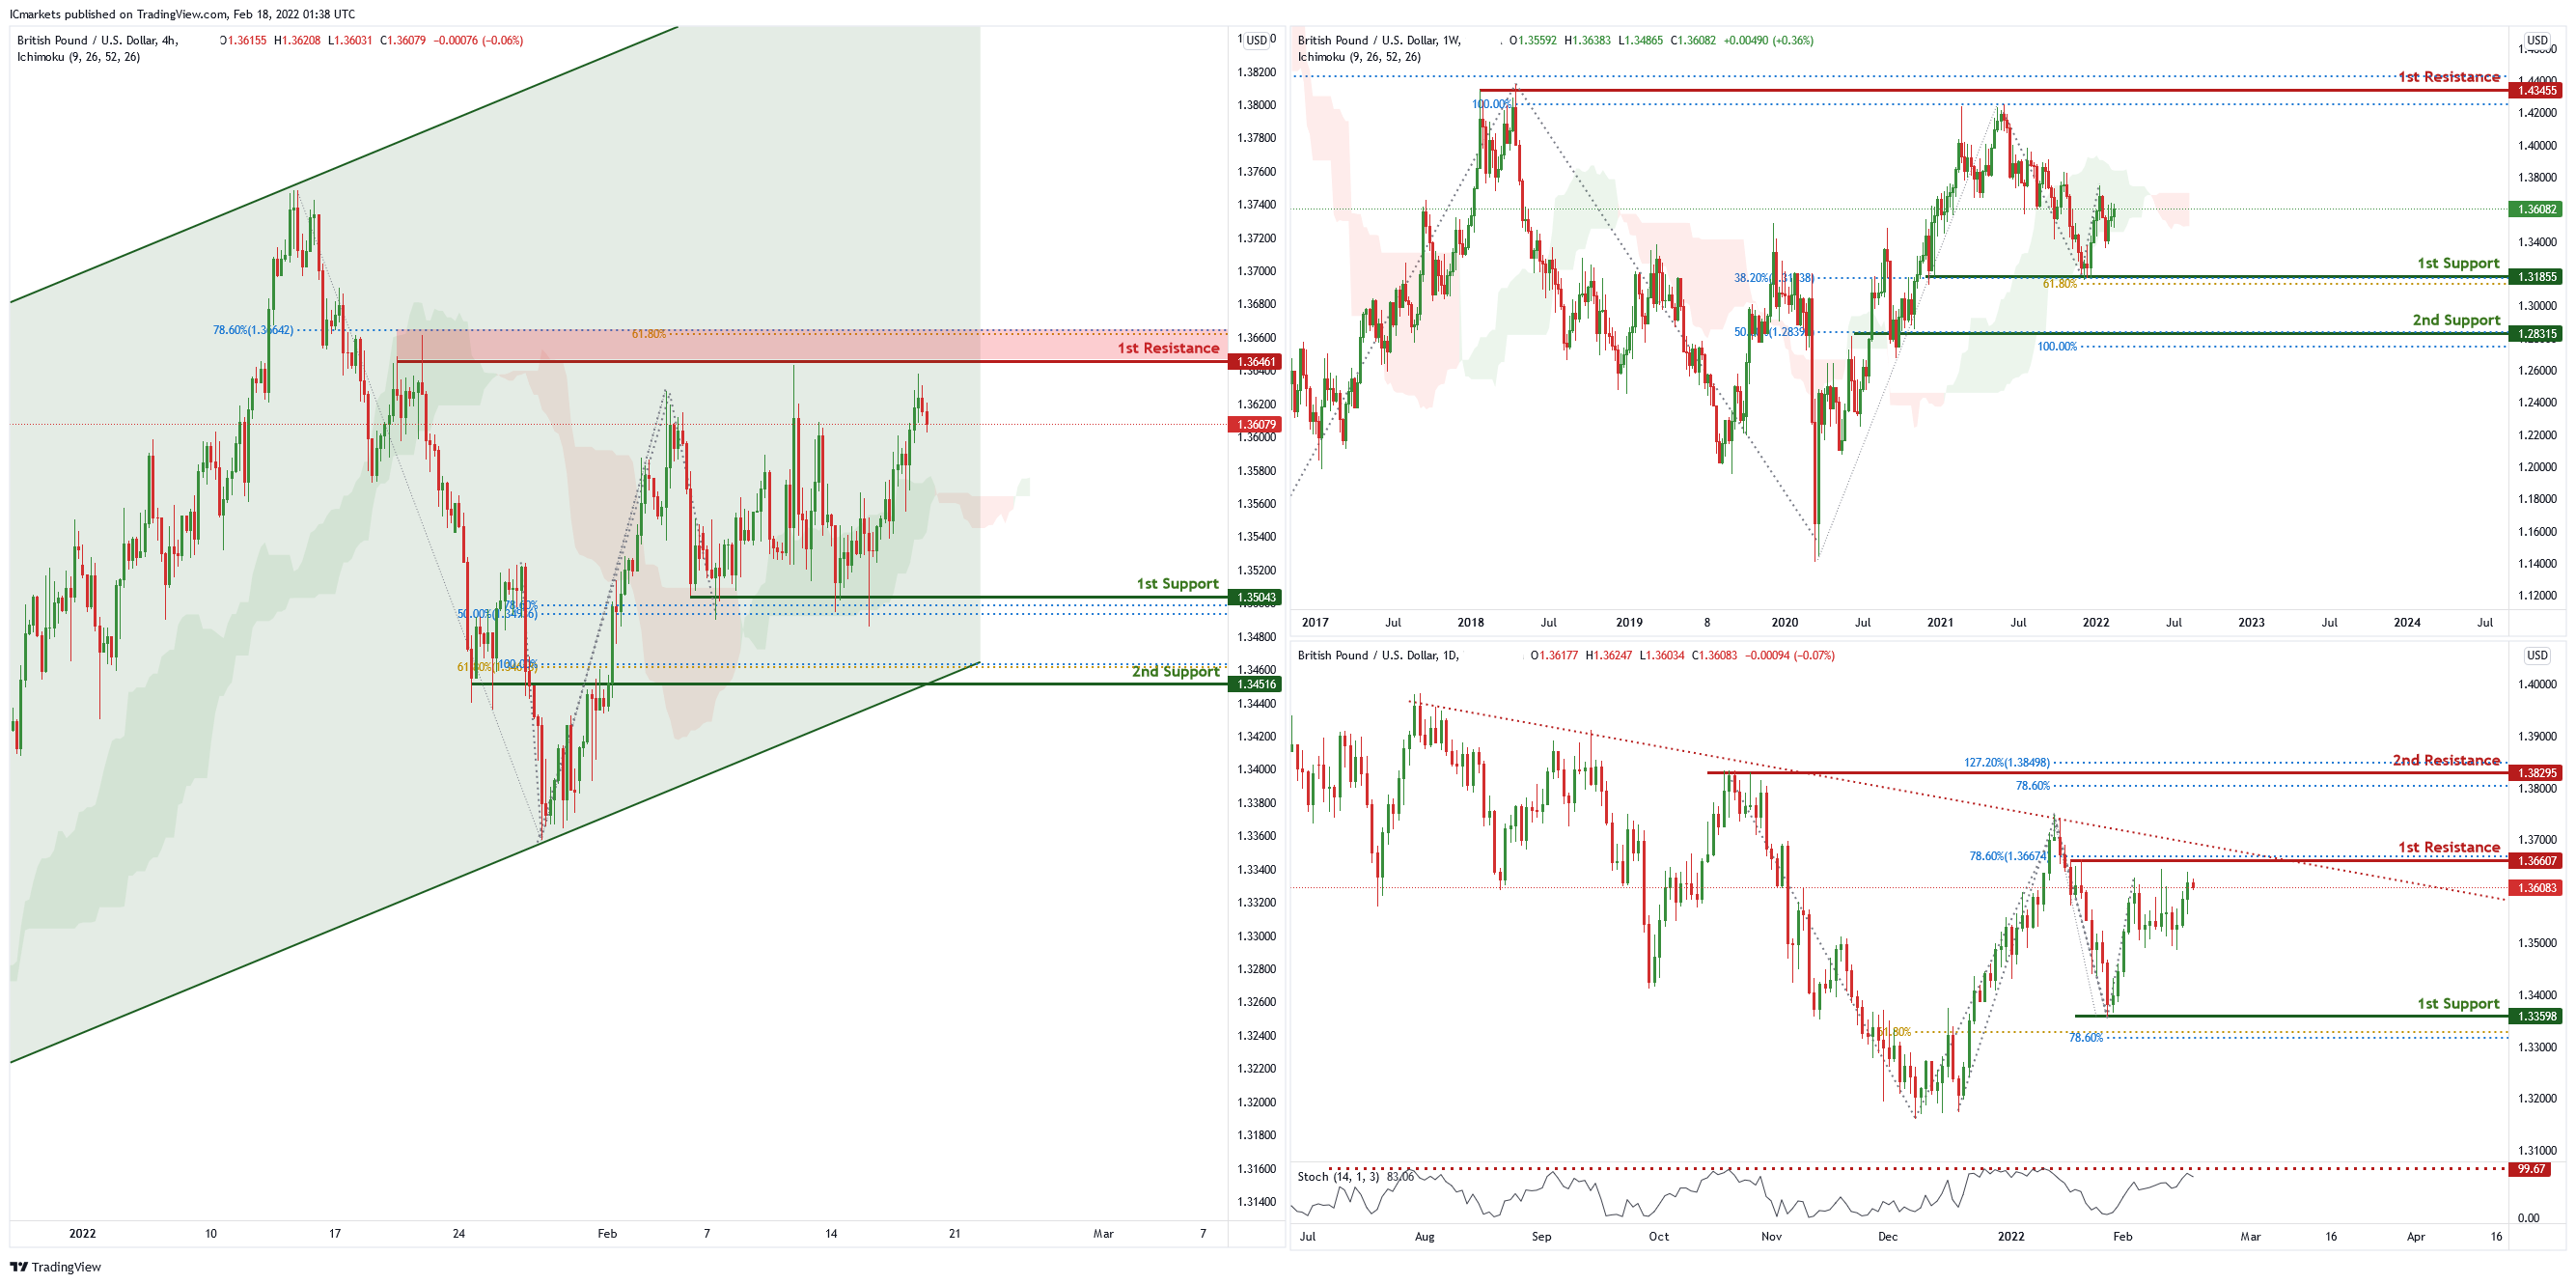
On the weekly chart , price has recently bounced off the 1st support level of 1.31885 which is also 38.2% Fibonacci retracement and 61.8% Fibonacci projection. Price can potentially go to the 1st resistance level of 1.42498 which is also 100% Fibonacci projection and 50% Fibonacci retracement. Our bullish bias is supported by the ichimoku cloud indicator.
On the daily chart , price is abiding by a descending trendline and near the 1st resistance level of 1.36607 which is 78.6% Fibonacci retracement. Price can potentially dip to the 1st support level of 1.33598 which is also 61.8% Fibonacci projection and 78.6% Fibonacci retracement. Our bearish bias is supported by the stochastic indicator as it is near resistance level.
On the H4 chart , price is near 1st resistance level of 1.36461 in line with 61.8% Fibonacci retracement and 78.6% Fibonacci projection. Price can potentially dip to the take profit level of 1.35026 in line with 50% Fibonacci retracement and 100% Fibonacci projection . Our bearish bias is supported by the stochastic indicator as it is near resistance level.
Areas of consideration
- H4 1st resistance at 1.36461
- H4 1st support at 1.35026
USD/CHF:
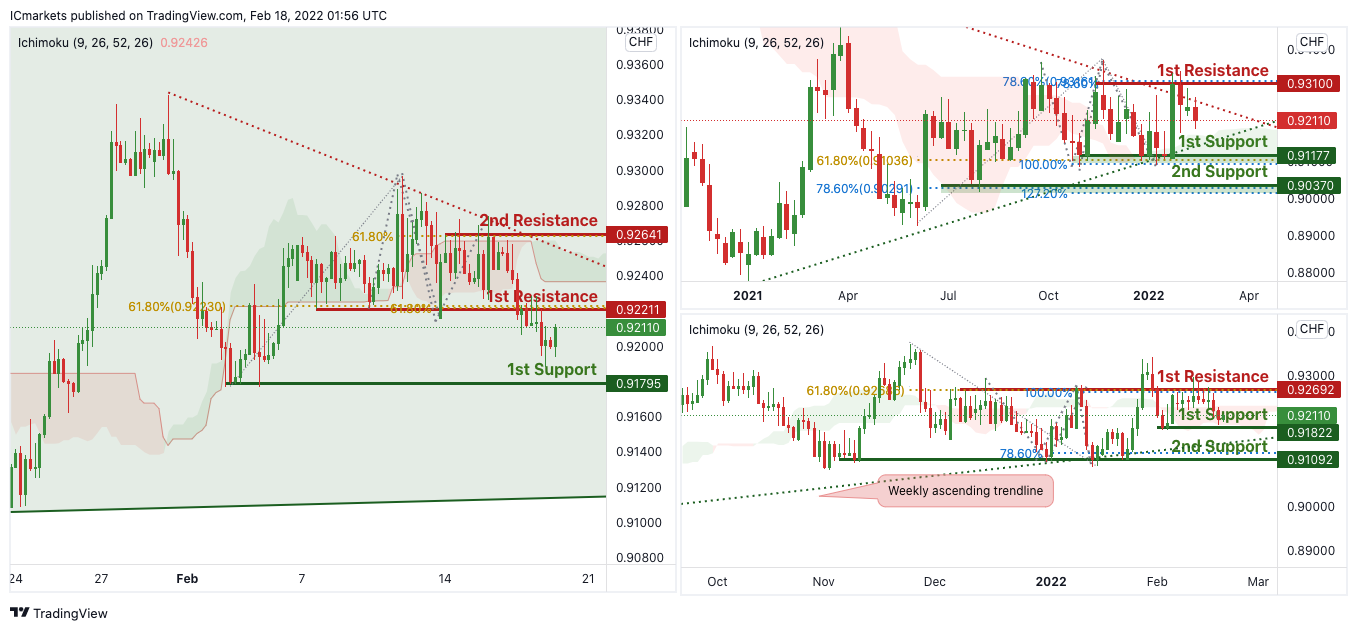
On the Weekly, with price expected to bounce off the support of the ichimoku cloud, signifying an overall bullish momentum. We can expect price to rise to our 1st resistance at 0.93100 in line horizontal graphical swing high resistance and 78.6% Fibonacci extension level from our 1st support in line with horizontal overlap support and 100% Fibonacci projection at 0.91177. Alternatively, price may break 1st support structure and head for 2nd support, which coincides with horizontal swing low support and 127.2% Fibonacci extension at 0.90370.
On the Daily, with price expected to bounce off the support of the ichimoku cloud, signifying an overall bullish momentum. We can expect price to rise to our 1st resistance at 0.92692 in line horizontal graphical swing high resistance and 100% Fibonacci projection level from our 1st support in line with horizontal overlap support at 0.91822. Alternatively, price may break 1st support structure and head for 2nd support, which coincides with horizontal swing low support and 78.6% Fibonacci extension at 0.92692.
On the H4 timeframe, price is abiding to the daily ascending channel and descending trendline resistance on the H4. We can expect the price to drop from 1st Resistance in line with 61.8% Fibonacci projection towards 1st Support in line with 61.8% Fibonacci projection and 61.8% Fibonacci retracement. Our bearish bias is further supported by the RSI indicator where it is abiding to the descending trendline resistance. Traders should wait for prices to swing higher or lower before entering.
Areas of consideration:
- Watch 1st Support at 0.91795
- Watch 1st Resistance at 0.92211
EUR/USD :
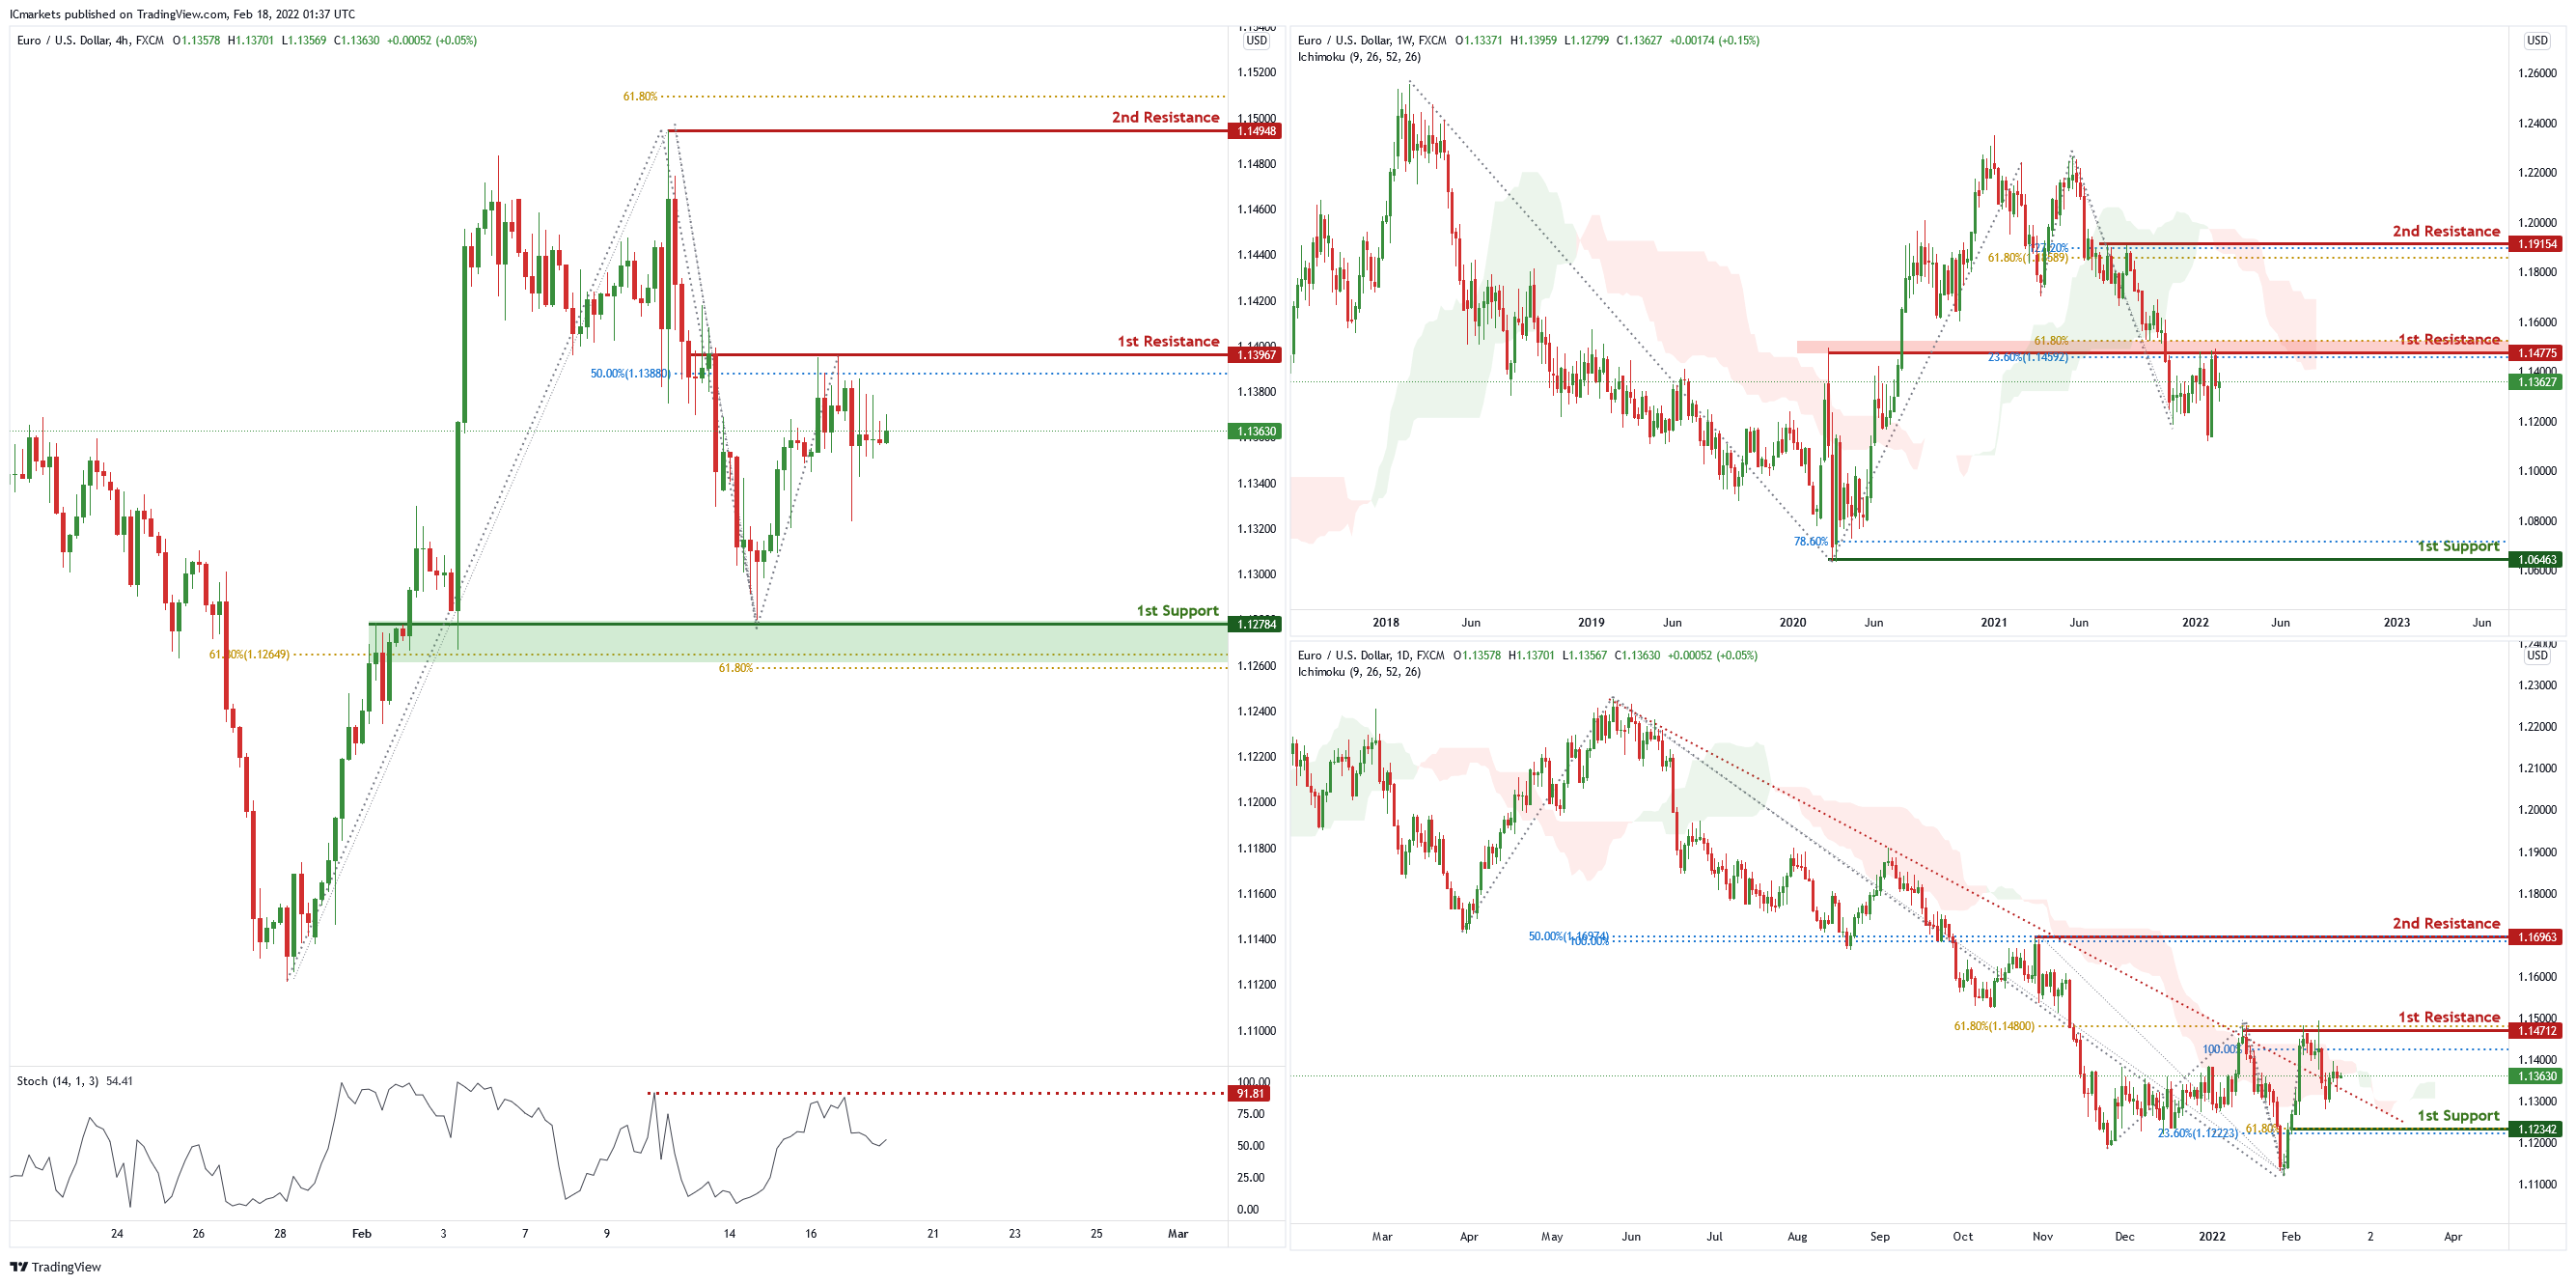
On the weekly chart, price is near 1st resistance level of 1.14226 which is also 61.8% Fibonacci projection and 23.6% Fibonacci retracement. Price can potentially dip to the 1st support level of 1.06475 which is 78.6% Fibonacci projection. Our bearish bias is supported by the ichimoku cloud indicator as price is trading below it.
On the daily chart, price has broken out of the descending trendline and is near 1st resistance level of 1.14666 which is also 100% Fibonacci projection and 61.8% Fibonacci retracement. Price can potentially go to the 2nd resistance level of 1.16931 which is 50% retracement and 100% projection. Our bullish bias is supported by the ichimoku cloud indicator as price is trading above the cloud.
On the H4 chart, price is near 1st resistance level of 1.13967 in line with 50% Fibonacci retracement. Price can potentially dip to the 1st support level of 1.12784 in line with 61.8% Fibonacci retracement and 61.8% Fibonacci projection. Our bearish bias is supported by the stochastic indicator as it is near the resistance level.
Areas of consideration
- H4 1st resistance at 1.13967
- H4 1st support at 1.12784
USD/JPY:
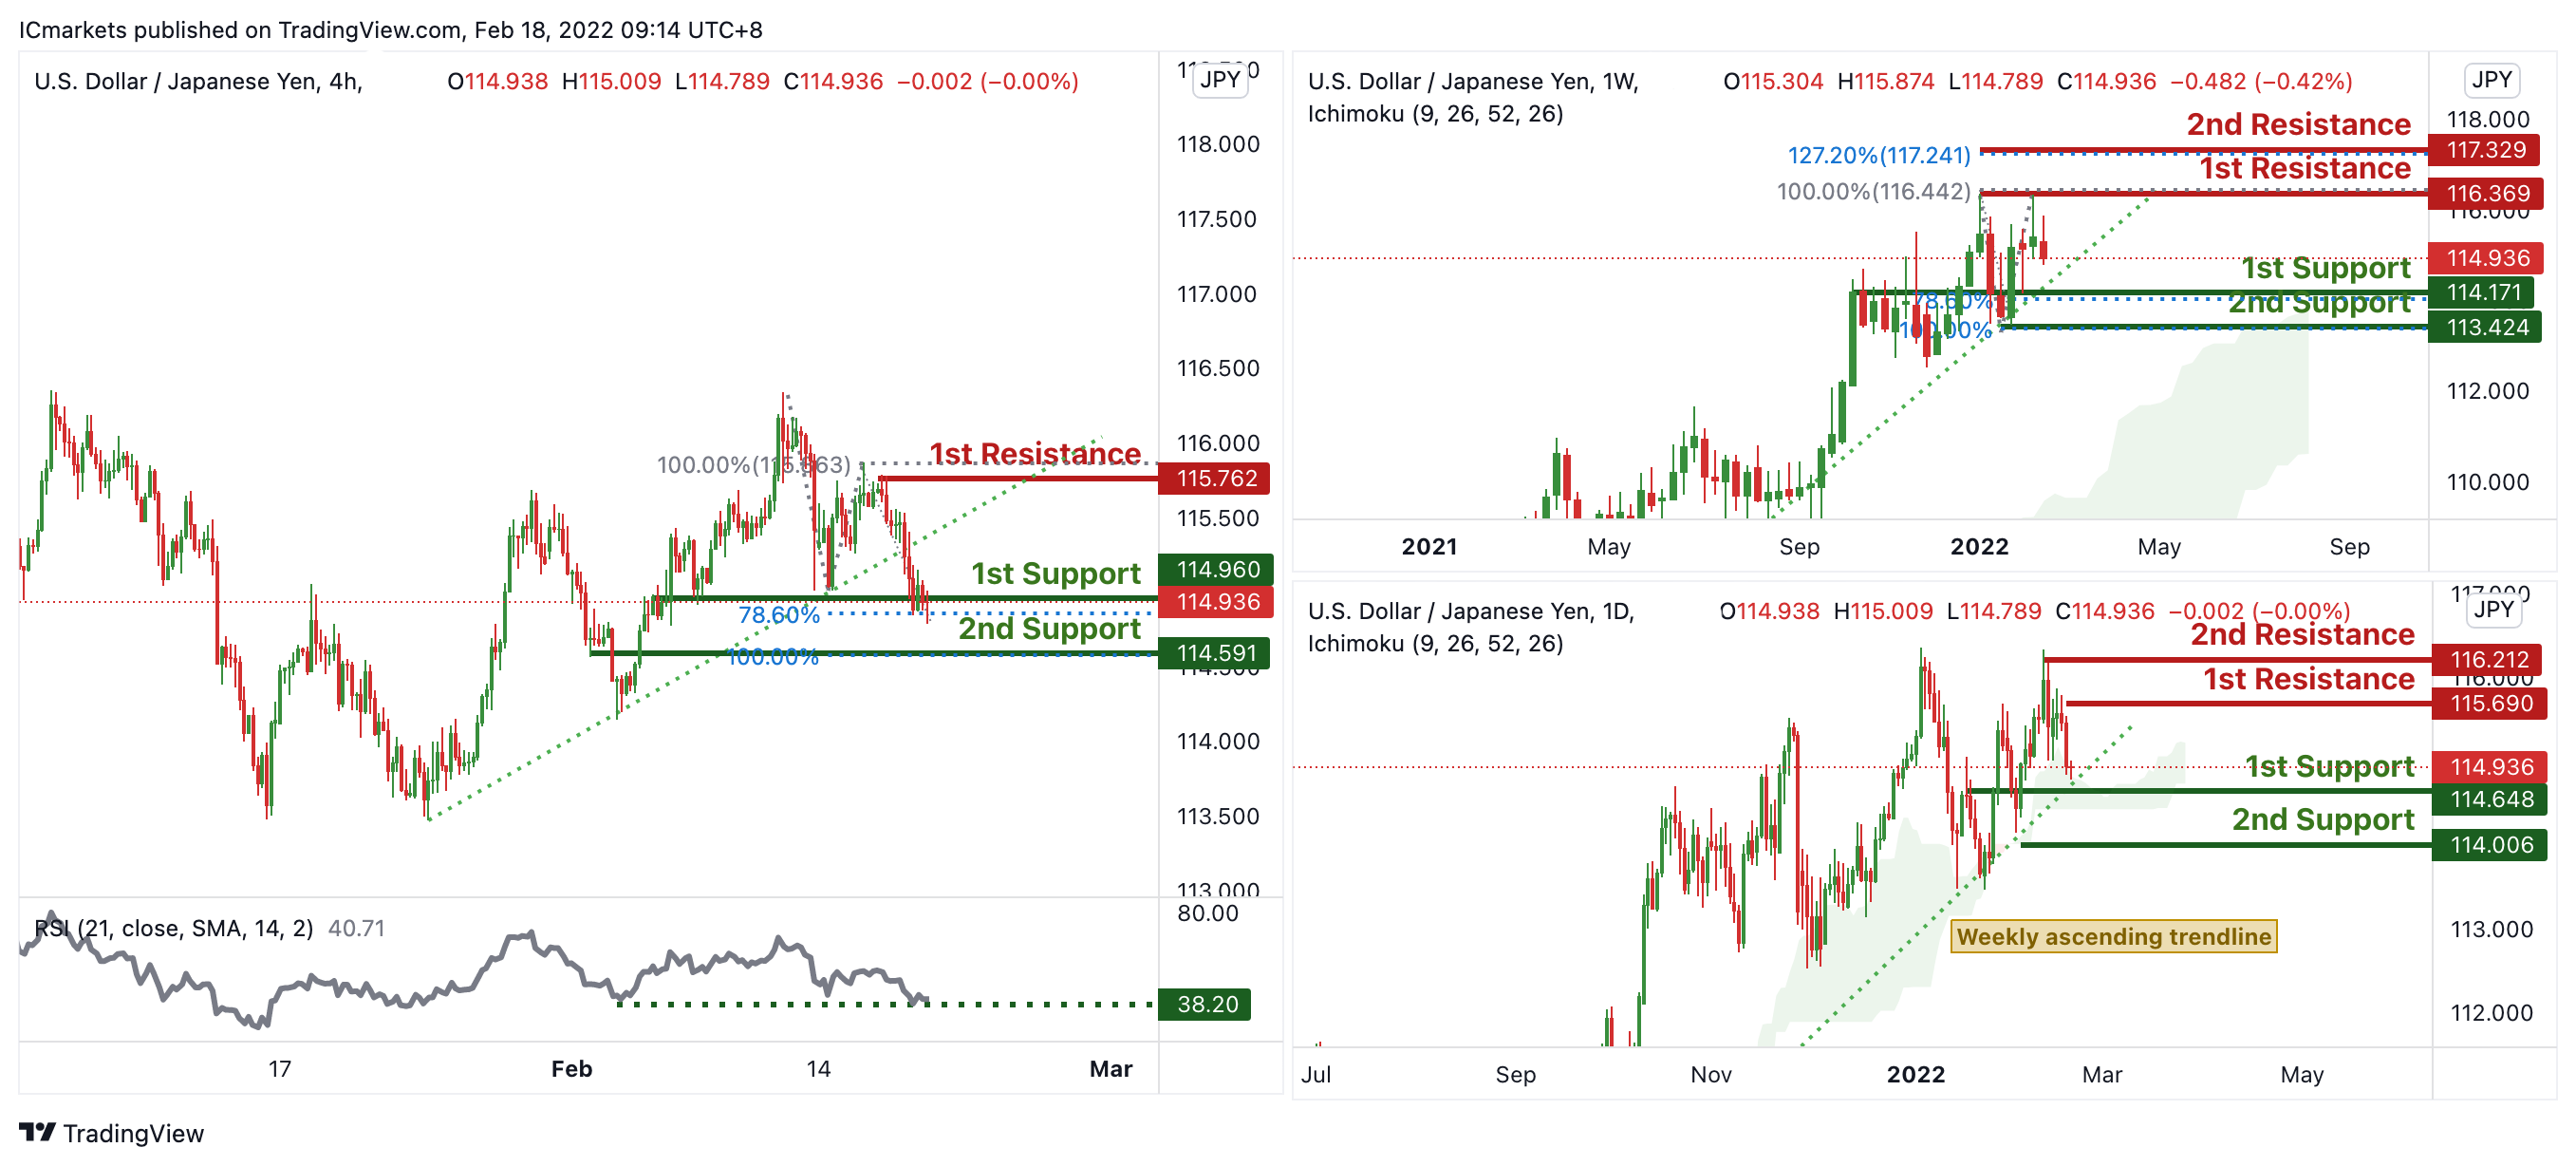
On the weekly, prices are on bullish momentum and abiding to our ascending trendline. We see potential for prices to bounce from our 1st support at 114.171 in line with 78.6% Fibonacci extension towards our 1st resistance at 116.369 in line with 100% Fibonacci retracement. Prices are trading above our Ichimoku Cloud support, further supporting our bullish bias.
On the daily, prices are on a bullish momentum and abiding to a bullish trendline. We see potential for prices to bounce from our 1st support at 114.648 in line with 61.8% Fibonacci retracement towards our 1st resistance at 115.690 in line with 61.8% Fibonacci retracement. Prices are trading above our Ichimoku Cloud support, further supporting our bullish bias.
On the H4 timeframe, prices have recently broken out of our ascending trendline. We see the possibility of a retest of the ascending trendline from our 1st support at 114.960 in line with 78.6% Fibonacci extension towards our 1st resistance at 115.762 in line with 100% Fibonacci retracement. Our bullish bias is further supported by RSI being at levels where bounces previously occurred.
Areas of consideration:
- H4 time frame, 1st resistance at 115.762
- H4 time frame, 1st support at 115.762
AUD/USD:
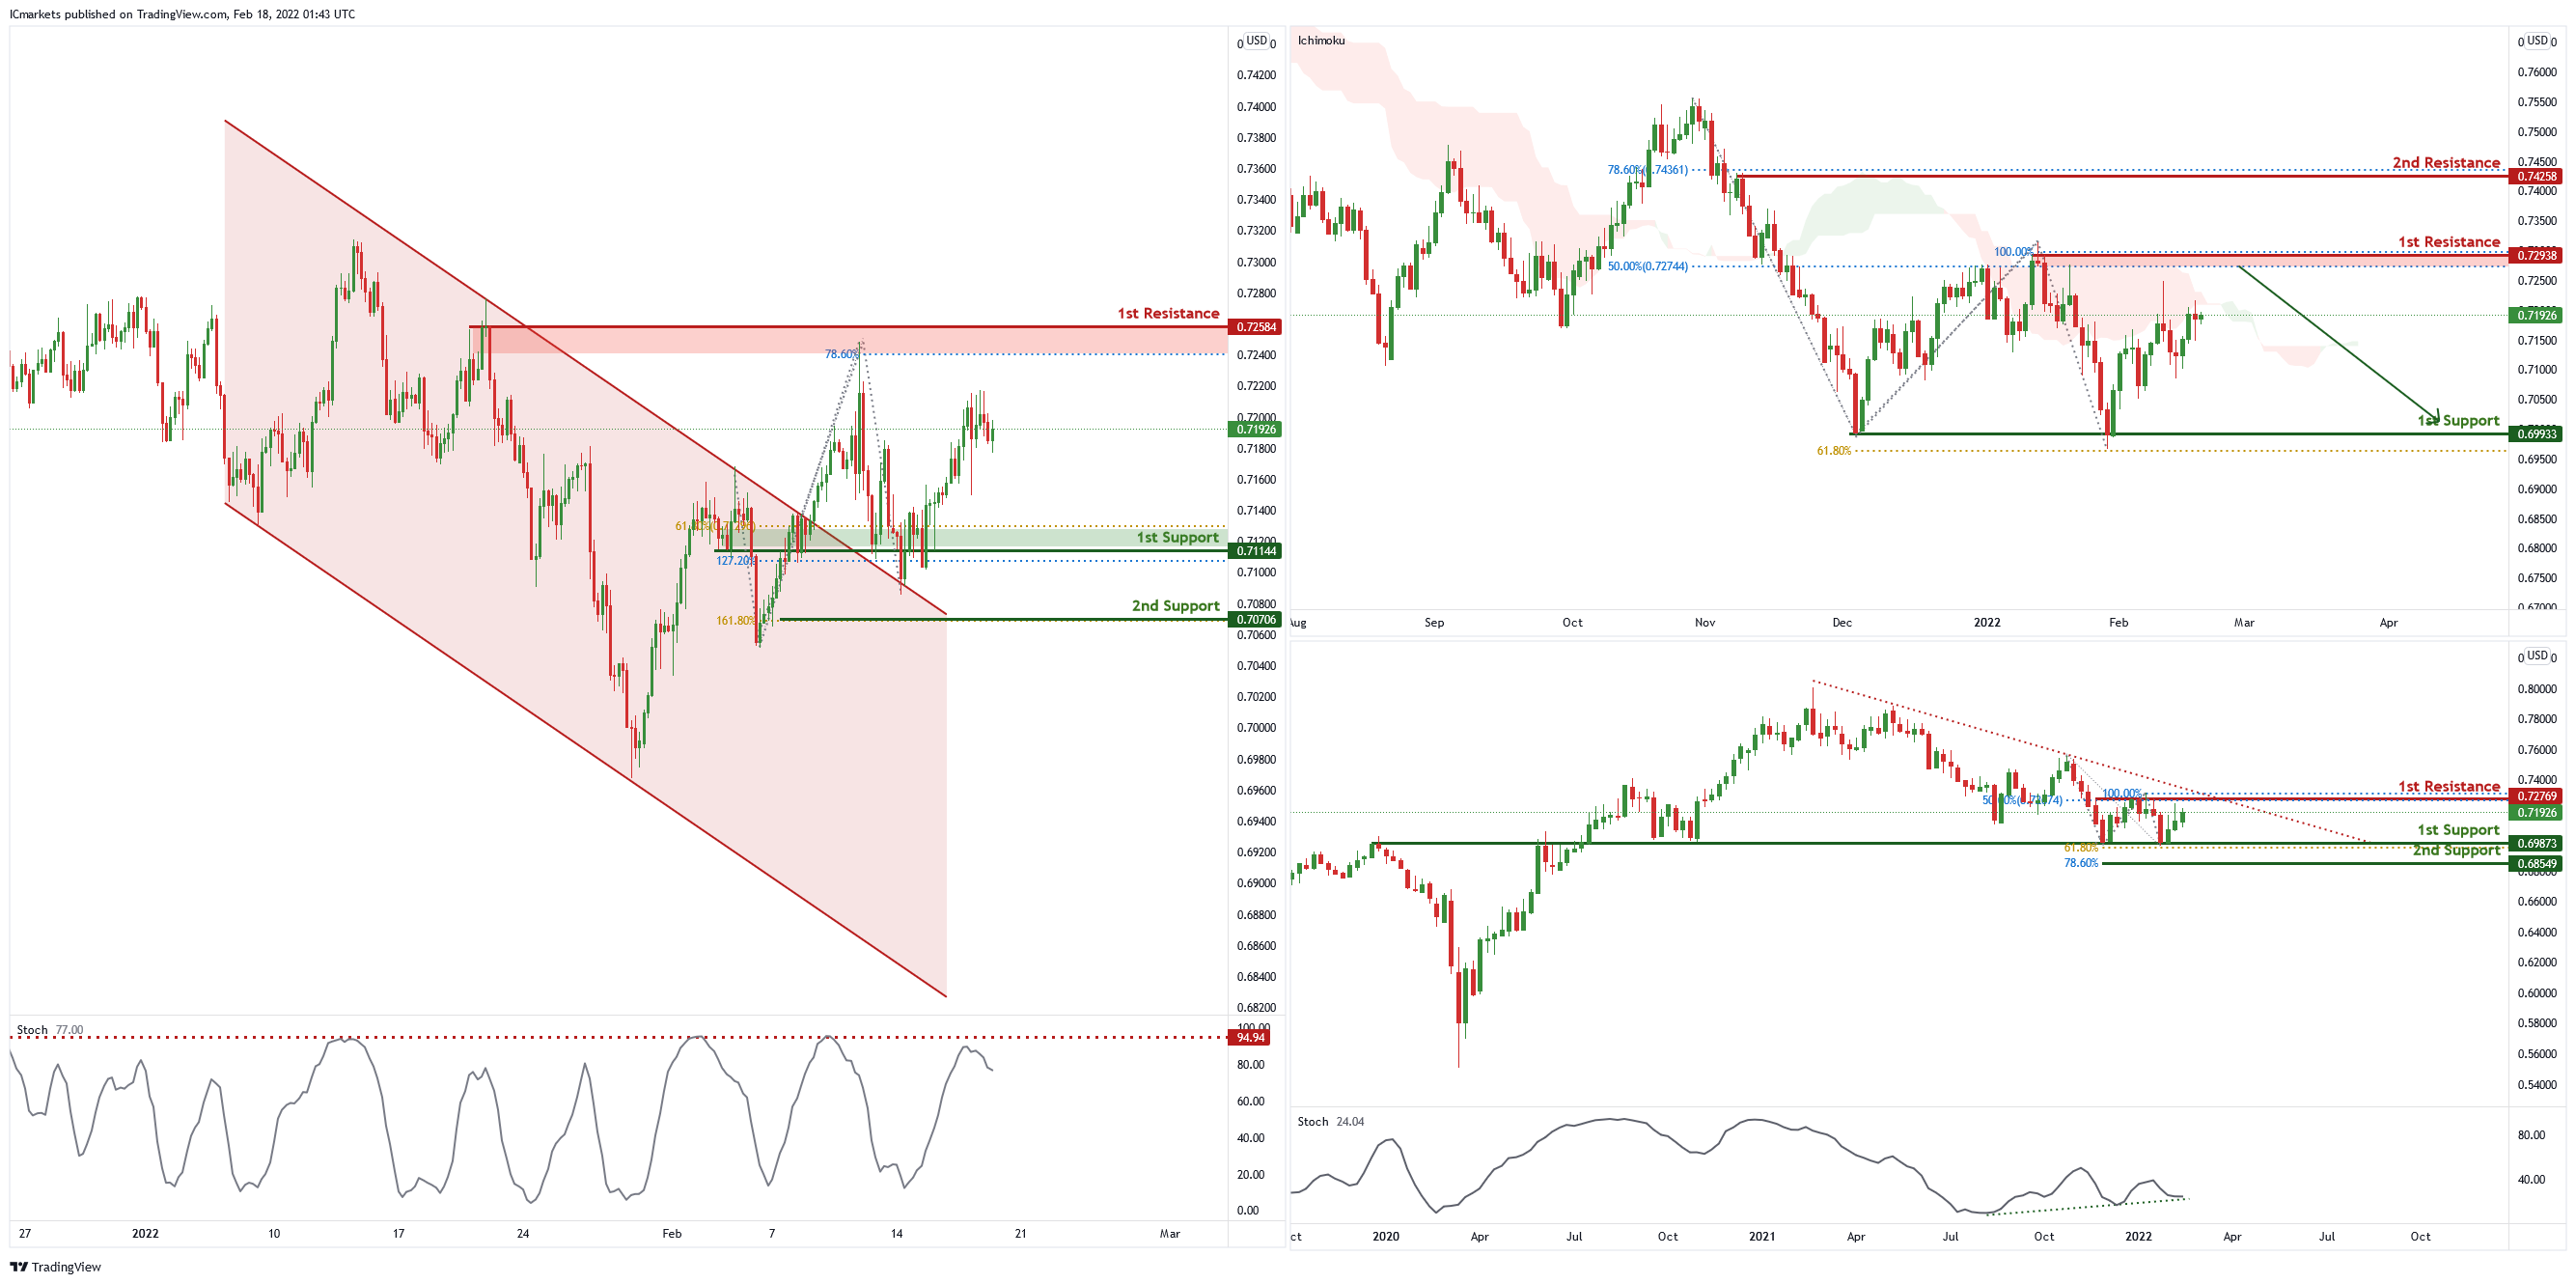
On the weekly, price is abiding to the descending trendline resistance , signifying an overall bearish momentum. However, the price bounced up at the horizontal support. We can expect price to reach 1st Resistance in line with 50% Fibonacci retracement and 100% Fibonacci projection. Traders can wait for prices to swing higher or lower before entering.
On the Daily timeframe, price is near the 1st resistance level of 0.72938 in line with 100% Fibonacci projection and 50% Fibonacci retracement. Price can potentially dip to the 1st support level of 0.69933 in line with 100% Fibonacci projection. Our bearish bias is supported by the ichimoku cloud indicator.
Price broke out of the descending channel. Price is near the 1st resistance level of 0.72584 in line with 78.6% Fibonacci projection. Price can potentially dip to the 1st support level of 0.71144 in line with 127.2% Fibonacci projection and 61.8% Fibonacci retracement. Our bearish bias is supported by the stochastic indicator as it is near resistance level.
Areas of consideration :
- H4 1st resistance of 0.72584
- H4 1st support of 0.71144
NZD/USD:
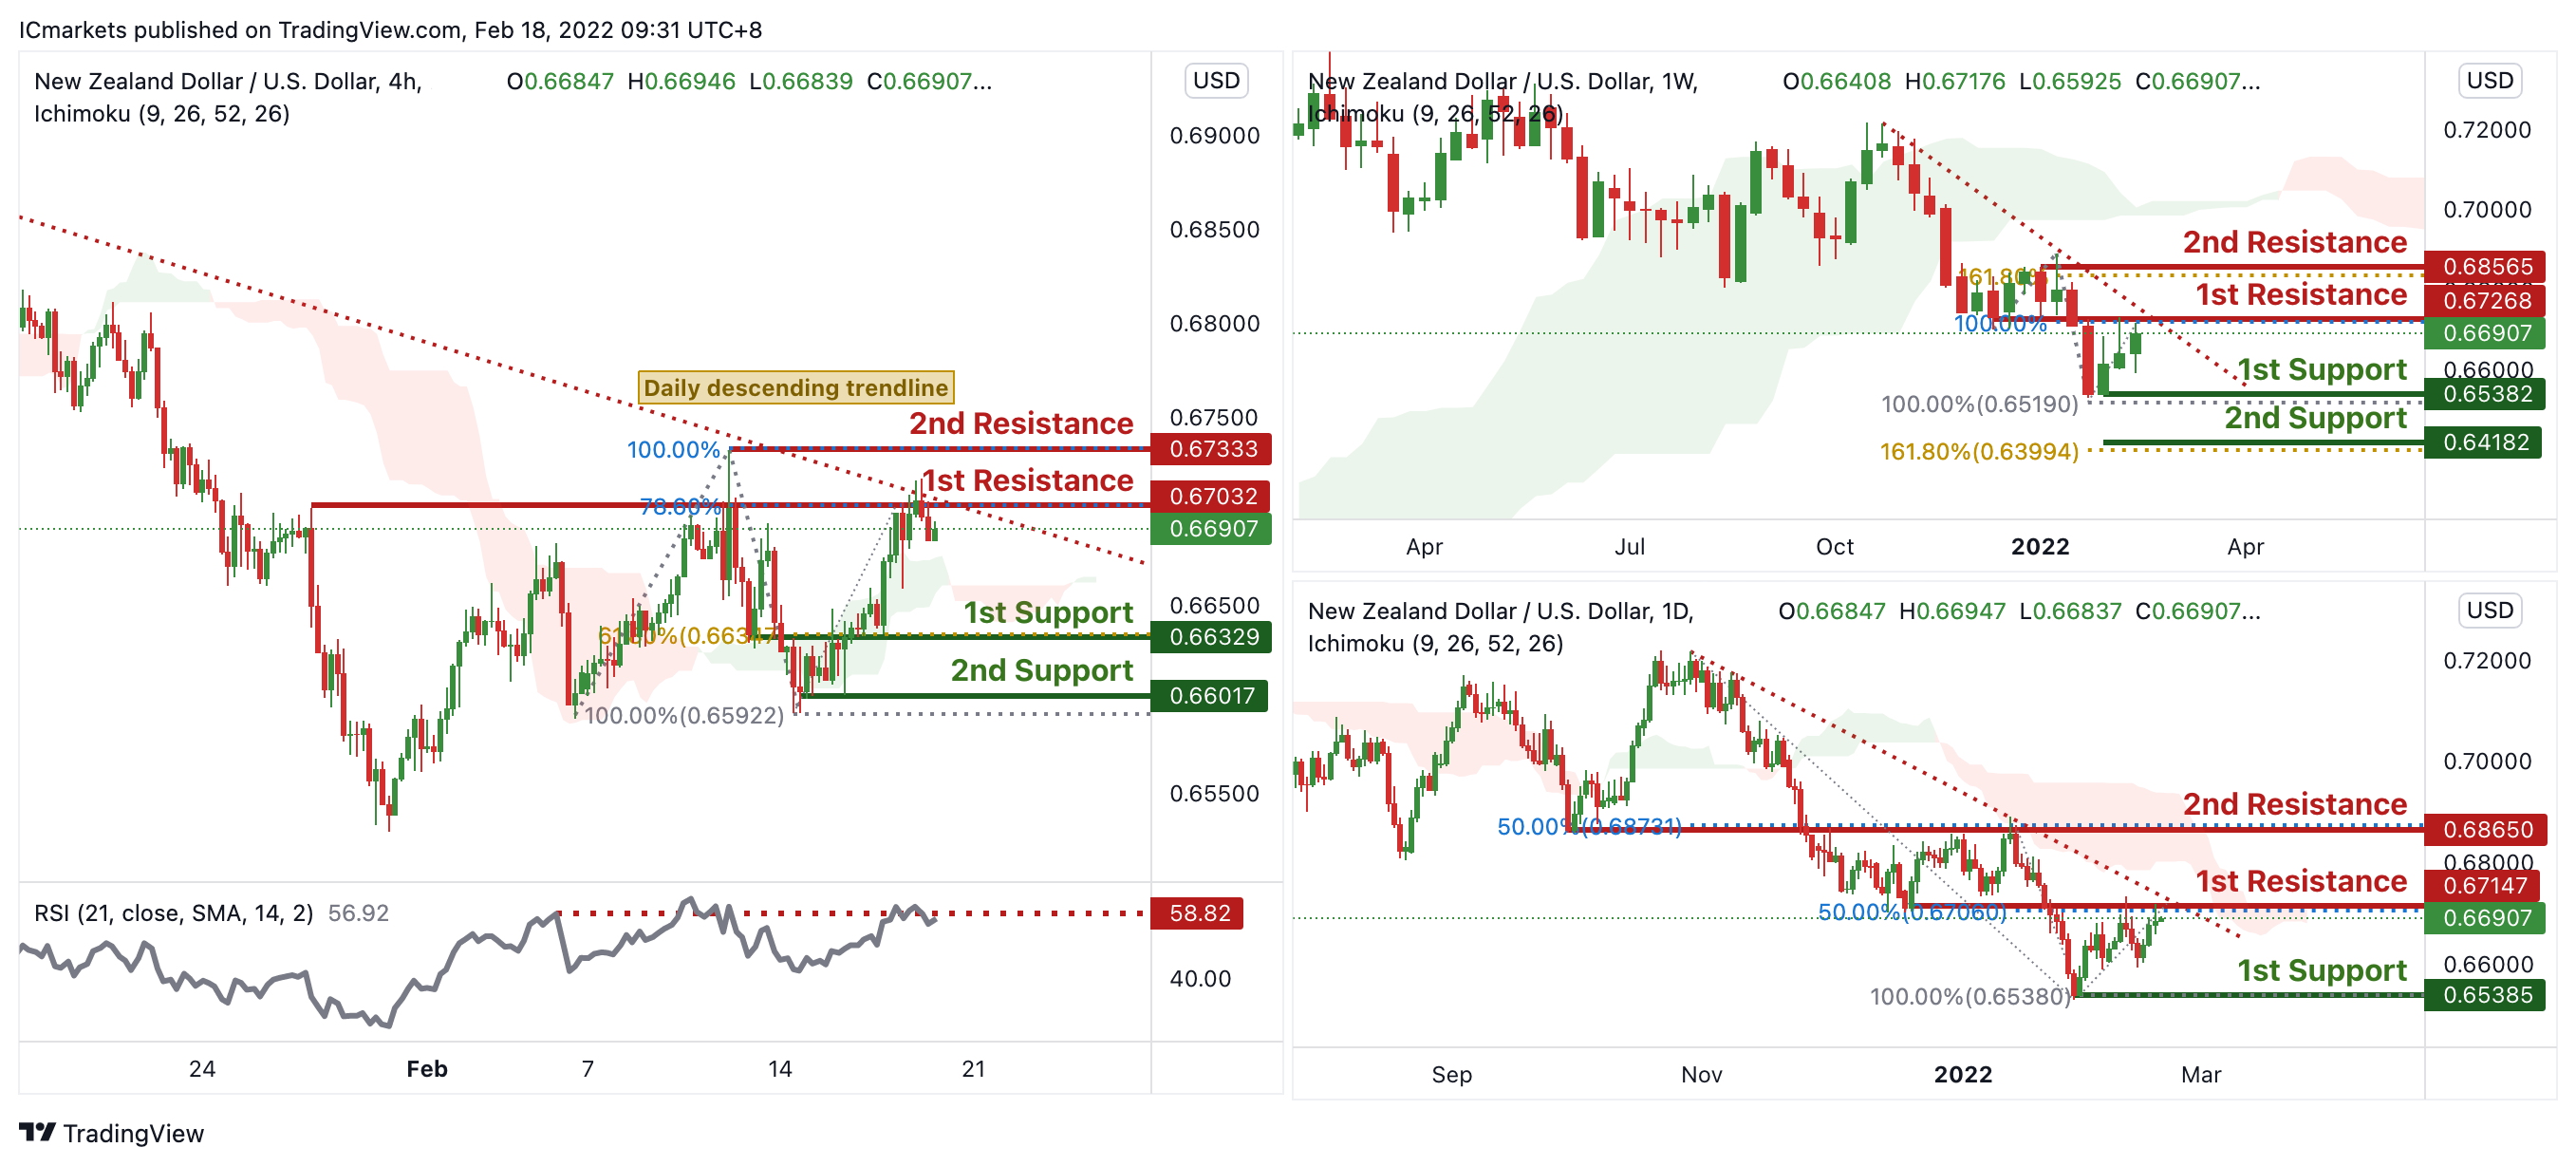
On the weekly, prices are on bearish momentum and abiding to a descending trendline. We see potential for a dip from our 1st resistance at 0.67268 in line with 100% Fibonacci extension and descending trendline towards 1st support at 0.65382 in line with 100% Fibonacci retracement. Prices are trading below our ichimoku cloud resistance, further supporting our bearish bias.
On the daily, prices are on bearish momentum and abiding to a descending trendline. We see potential for a dip from our 1st resistance at 0.67147 in line with 50% Fibonacci retracement and descending trendline towards 1st support at 0.65385 in line with 100% Fibonacci retracement. Prices are trading below our ichimoku cloud resistance, further supporting our bearish bias.
On the H4 timeframe, prices are on bearish momentum and abiding to a daily descending trendline. We see potential for a dip from our 1st resistance at 0.67032 in line with 78.6% Fibonacci extension and descending trendline towards 1st support at 0.66329 in line with 61.8% Fibonacci retracement. Ichimoku clouds are forecasting bearish momentum and also RSI are at levels where dips previously occurred, further supporting our bearish bias.
Areas of consideration:
- H4 time frame, 1st resistance at 0.67032
- H4 time frame, 1st support at 0.66329
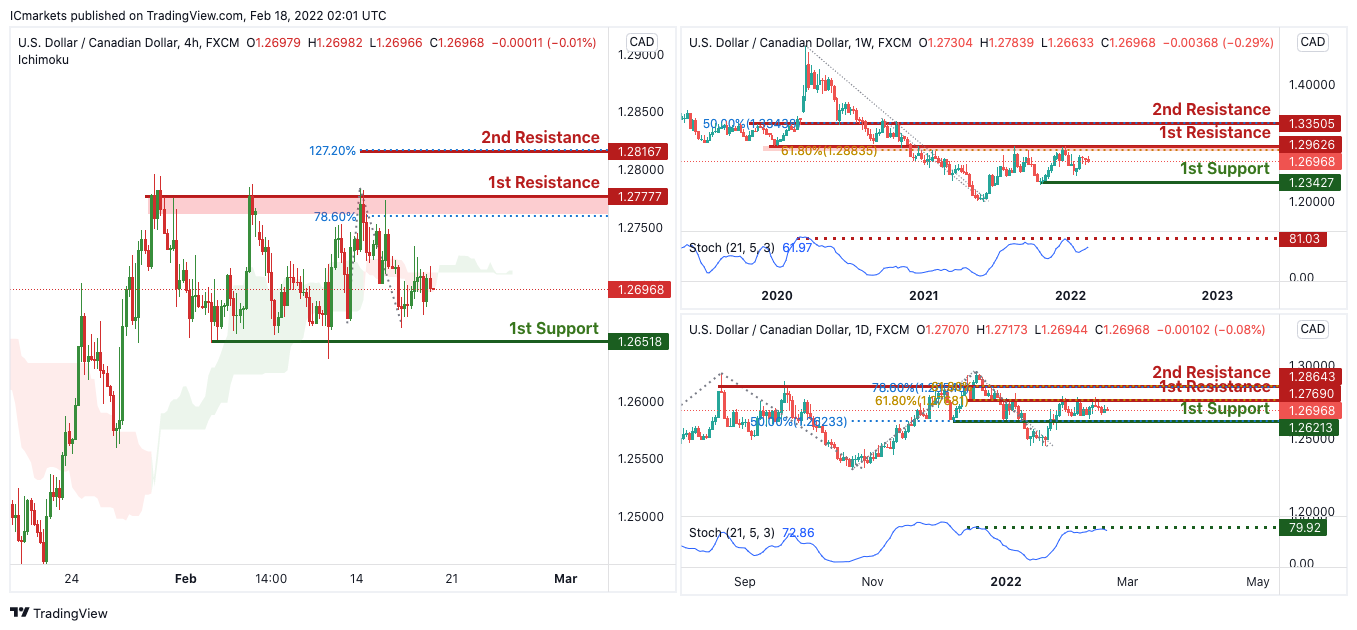
USD/CAD:
On the Weekly, with price moving expected to bounce off the stochastics, we can expect price to drop from our 1st resistance at 1.29626 in line horizontal graphical overlap resistance to our 1st support in line with horizontal overlap support at 1.23427. Alternatively, price may break 1st resistance structure and head for 2nd resistance, which coincides with horizontal swing high resistance at 1.33505.
On the Daily, with price moving expected to bounce off the stochastics, we can expect price to drop from our 1st resistance at 1.297690 in line horizontal graphical swing high resistance to our 1st support in line with horizontal overlap support and 50% Fibonacci retracement at 1.26218. Alternatively, price may break 1st resistance structure and head for 2nd resistance, which coincides with horizontal swing high resistance at 1.28643.
On the H4, with price moving below the ichimoku cloud, we can expect price to drop from our 1st resistance at 1.277777 in line horizontal graphical swing high resistance to our 1st support in line with horizontal overlap support and 78.6% Fibonacci retracement at 1.26518. Alternatively, price may break 1st resistance structure and head for 2nd resistance, which coincides with horizontal swing high resistance at 1.28167.
Areas of consideration:
- H4 time frame, 1st support at 1.26518
- H4 time frame, 1st resistance at 1.277777
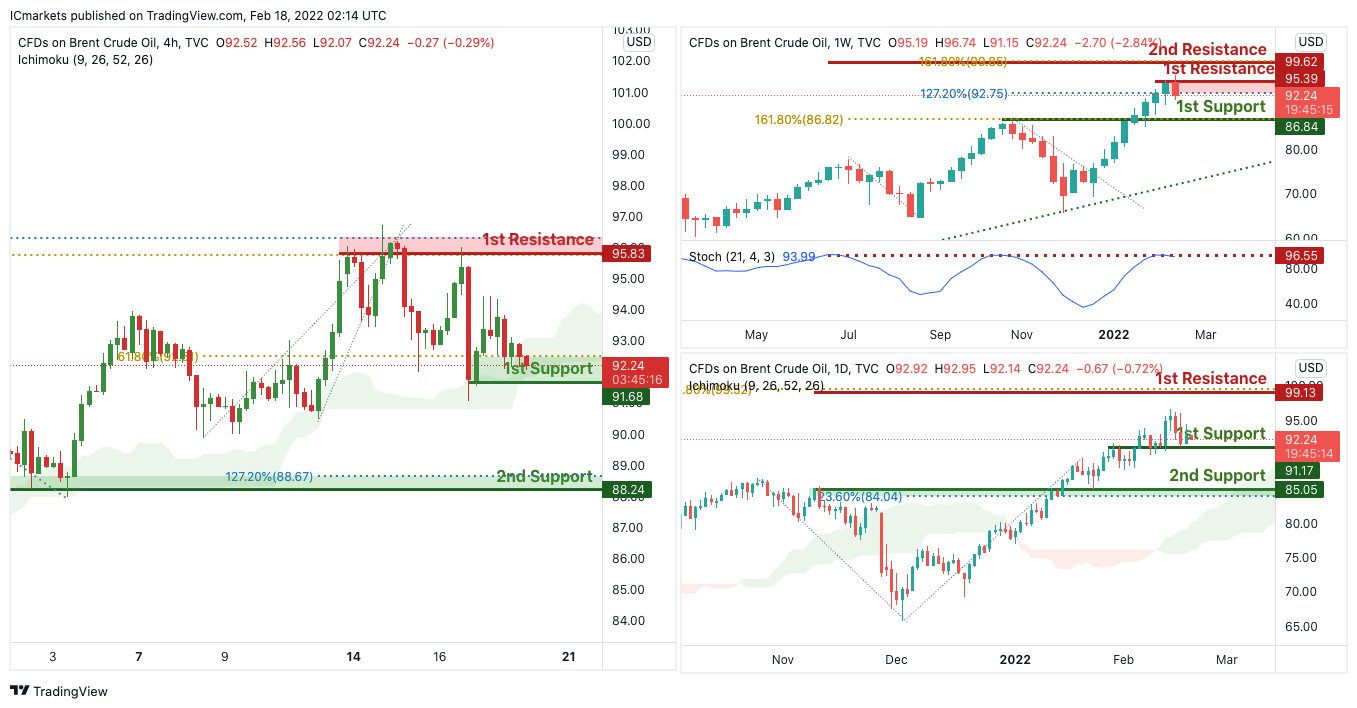
OIL:
On the Weekly, with price expected to reverse off the stochastics, we can expect price to drop from our 1st resistance at 95.39 in line horizontal graphical swing high resistance to our 1st support in line with horizontal overlap support and 127.2% Fibonacci extension at 86.84. Alternatively, price may break 1st resistance structure and head for 2nd resistance, which coincides with 161.8% Fibonacci extension at 99.62.
On the Daily, with price moving above of the ichimoku cloud, signifying an overall bullish momentum. We can expect price to rise to our 1st resistance at 99.13 in line horizontal graphical swing high resistance and 61.8% Fibonacci retracement level from our 1st support in line with horizontal overlap support at 91.17. Alternatively, price may break 1st support structure and head for 2nd support, which coincides with horizontal swing low support and 23.6% Fibonacci retracement at 85.05.
On the H4, with price expected to bounce off the support of the ichimoku cloud, signifying an overall bullish momentum. We can expect price to rise to our 1st resistance at 95.83 in line horizontal graphical swing high resistance and -61.8% Fibonacci expansion and 127.2% Fibonacci extension level from our 1st support in line with horizontal overlap support and 61.8% Fibonacci retracement at 91.68. Alternatively, price may break 1st support structure and head for 2nd support, which coincides with horizontal swing low support and 127.2% Fibonacci extension at 88.24.
Areas of consideration:
- H4 time frame, 1st resistance of 95.83
- H4 time frame, 1st support of 91.68
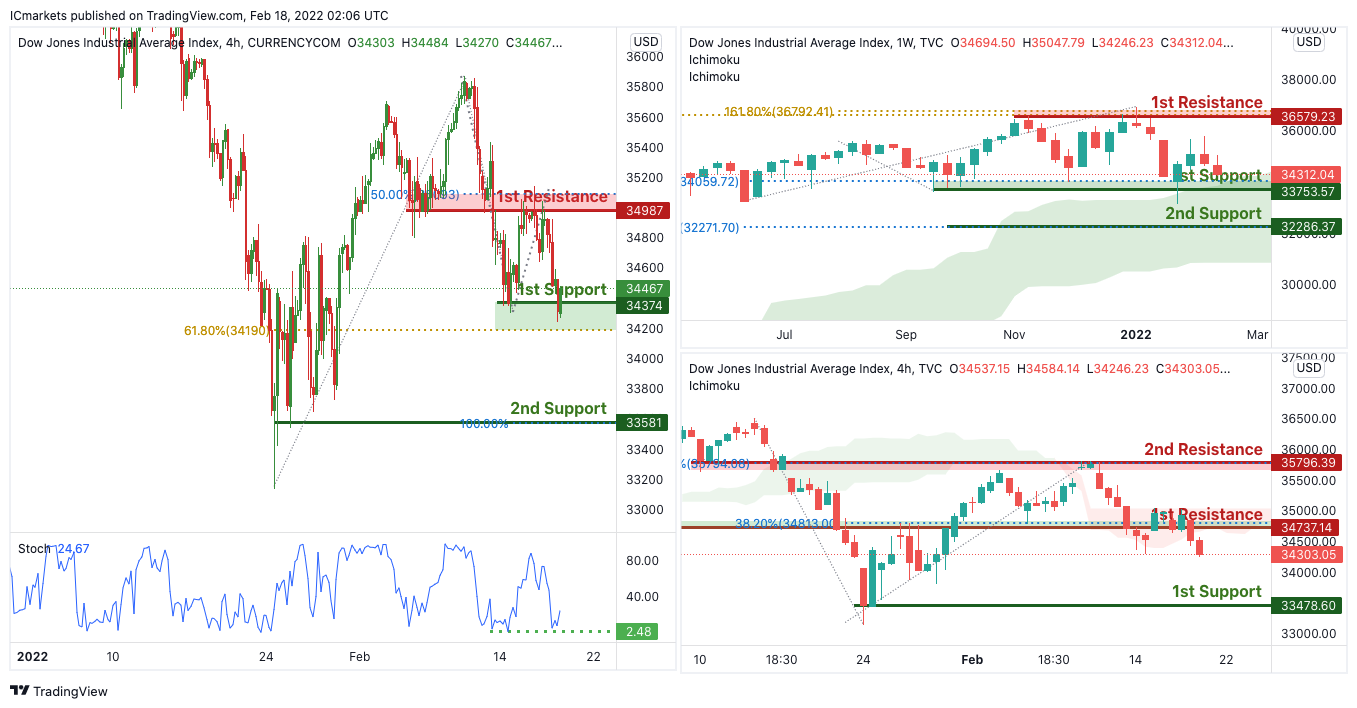
Dow Jones Industrial Average:
On the Weekly, with price expected to bounce off the support of the ichimoku cloud, signifying an overall bullish momentum. We can expect price to rise to our 1st resistance at 36579 in line horizontal graphical swing high resistance and 161.8% Fibonacci extension from our 1st support in line with horizontal overlap support and 78.2% Fibonacci retracement at 33753. Alternatively, price may break 1st support structure and head for 2nd support, which coincides with horizontal swing low support and 127.2% Fibonacci extension at 32286.
On the Daily, with prices moving below the ichimoku cloud, we see the potential for a drop to our 1st support at 34374 in line with horizontal swing low support from our 1st resistance at 33478 in line with the swing low support. Alternatively, price may break 1st resistance structure and head for 2nd resistance at 35796, in line with the horizontal overlap resistance and 78.6% Fibonacci retracement.
On the H4, with price expected to bounce off the support of the stochastics, signifying an overall bullish momentum. We can expect price to rise to our 1st resistance at 34987 in line horizontal graphical swing high resistance and 50% Fibonacci retracement from our 1st support in line with horizontal swing low support and 61.8% Fibonacci retracement at 34374. Alternatively, price may break 1st support structure and head for 2nd support, which coincides with horizontal swing low support at 33681.
Areas of consideration:
- H4 time frame, 1st resistance of 34987
- H4 time frame, 1st support of 34374
GBP/USD Daily Outlook
Daily Pivots: (S1) 1.3567; (P) 1.3603; (R1) 1.3649; More...
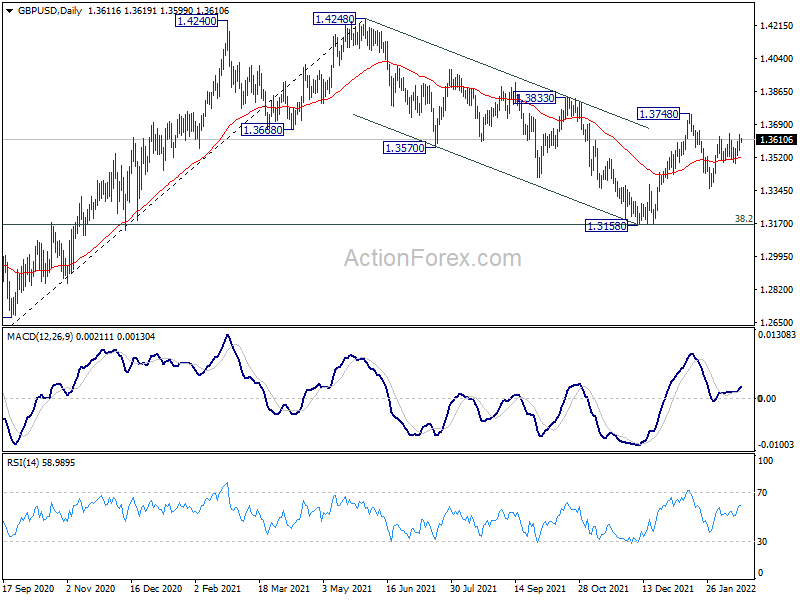
Intraday bias in GBP/USD remains neutral for the moment, and focus stays on 1.3642 resistance. Break there will resume the rebound from 1.3356 to 1.3748 resistance. Firm break there will revive the bullish case that correction from 1.4248 has completed with three waves down to 1.3158. Further rally should then be seen to retest 1.4248 high. On the downside, though, break of 1.3485 will turn bias to the downside for 1.3356 support instead.
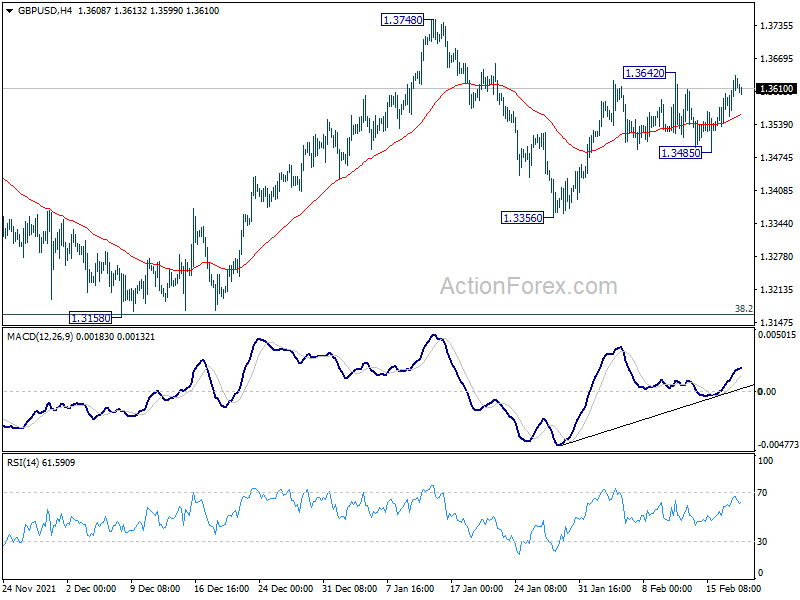
In the bigger picture, as long as 38.2% retracement of 1.1409 to 1.4248 at 1.3164 holds, up trend from 1.1409 (2020 low) is still in progress. On resumption, next target will be 38.2% retracement of 2.1161 to 1.1409 at 1.5134. Nevertheless sustained break of 1.3164 will argue that whole rise from 1.1409 has completed and bring deeper fall to 61.8% retracement at 1.2493.
Sterling to Look into Retail Sales for Range Breakout
Even though the US markets were in deep selloff overnight, Asian markets are just mixed. Investors are still waiting for come clarity on the Russia-Ukraine situation before taking a committed move. Trading is also subdued ahead of a long weekend in the US, with a holiday on Monday. In the currency markets, Aussie and Kiwi are currently the strongest ones for the week. Dollar, Euro and Yen are the worst performing. But the picture could easily change if something dramatic happens.
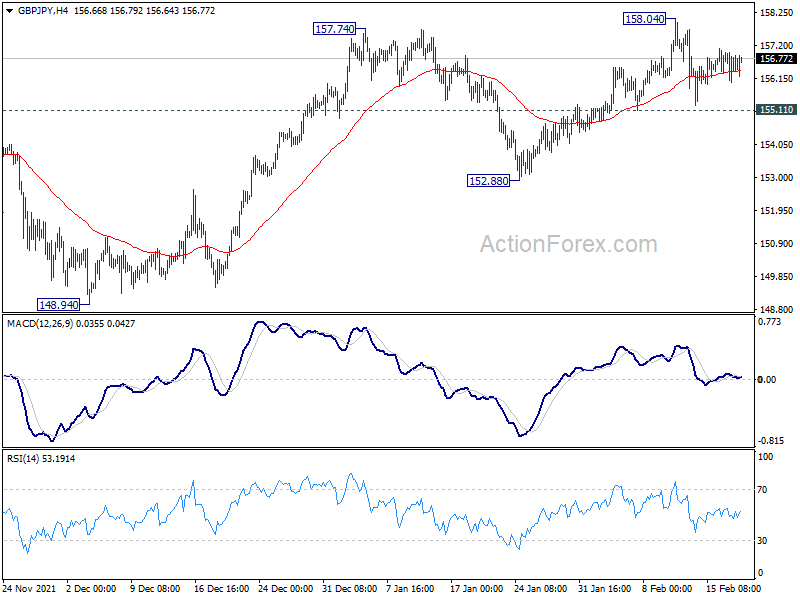
Technically, GBP/USD would be a focus today, with retail sales data featured. Break of 1.3642 will resume the rise from 1.3356 to 1.3748 resistance further break there will revive the case of bullish reversal, and could set the stage for retesting 1.4248 high at a later stage. Meanwhile, GBP/JPY is also rather resilient in spite of geopolitical uncertainties. Break of 158.04/19 resistance zone will confirm even confirm resumption of medium term up trend for next.
In Asia, at the time of writing, Nikkei is down -0.18%. Hong Kong HSI is down -0.48%. China Shanghai SSE is up 0.02%. Singapore Strait Times is up 0.05%. Japan 10-year JGB yield is down -0.0016 at 0.222. Overnight, DOW dropped -1.78%. S&P 500 dropped -2.12%. NASDAQ dropped -2.88%. 10-year yield dropped -0.075 to 1.972.
Fed Bullard: We're at risk that inflation won't dissipate
St. Louis Federal Reserve President James Bullard warned during a panel talk at Columbia University, "we're at more risk now than we've been in a generation that this (inflation) could get out of control."
One scenario would be, "a new surprise that hits us that we can't anticipate right now, but we would have even more inflation," he said. "That's the kind of situation that we want to ... make sure it doesn't occur."
"Overall, I'd say there's been too much emphasis and too much mindshare devoted to the idea that inflation will dissipate at some point in the future," Bullard said. "We're at risk that inflation won't dissipate, and 2022 will be the second year in a row of quite high inflation. So that's why given this situation, the Fed should move faster and more aggressively than we would have in other circumstances."
Fed Mester: Appropriate to hike in March, and follow with further increases in coming months
Cleveland Fed President Loretta Mester said yesterday, "I believe it will be appropriate to move the funds rate up in March and follow with further increases in the coming months."
"If by mid-year, I assess that inflation is not going to moderate as expected, then I would support removing accommodation at a faster pace over the second half of the year," she added.
Mester still expects inflation to remain above 2% this year and next. Moderation in inflation is "conditioned on the FOMC taking appropriate action to transition away from the current emergency levels of accommodation."
"We will need to convey the overall trajectory of policy and give the rationale for our policy decisions based on our assessment of the outlook and risks around the outlook, which are informed by economic and financial developments," Mester said. "This change in communications will provide a better sense of the FOMC's policy reaction function and should not be interpreted as the FOMC backing away from transparency."
Japan CPI core slowed to 0.2% yoy in Jan, CPI core core dropped to -1.1% yoy
Japan all item CPI slowed from 0.8% yoy to 0.5% yoy in January, below expectation of 0.6% yoy. CPI core (all item less fresh food) dropped from 0.5% yoy to 0.2% yoy, below expectation of 0.3% yoy. CPI core-core (all item less fresh food and energy), dropped from -0.7% yoy to -1.1% yoy, below expectation of -0.7% yoy.
Finance Minister Shunichi Suzuki said recent prices rises were "driven mostly by increases in energy costs", though forex moves also has had some impact. He added, "if inflation rises before improvement in job market, wage hikes kick in, that could affect consumption."
Elsewhere
New Zealand PPI input rose 1.1% qoq in Q4, below expectation of 1.6% qoq. PPI output rose 1.4% qoq, below expectation of 2.3% qoq.
UK retail sales and Eurozone current account will be featured in European session. Later in the day, Canada will release retail sales and new housing price index. US will release existing home sales.
GBP/USD Daily Outlook
Daily Pivots: (S1) 1.3567; (P) 1.3603; (R1) 1.3649; More...
Intraday bias in GBP/USD remains neutral for the moment, and focus stays on 1.3642 resistance. Break there will resume the rebound from 1.3356 to 1.3748 resistance. Firm break there will revive the bullish case that correction from 1.4248 has completed with three waves down to 1.3158. Further rally should then be seen to retest 1.4248 high. On the downside, though, break of 1.3485 will turn bias to the downside for 1.3356 support instead.
In the bigger picture, as long as 38.2% retracement of 1.1409 to 1.4248 at 1.3164 holds, up trend from 1.1409 (2020 low) is still in progress. On resumption, next target will be 38.2% retracement of 2.1161 to 1.1409 at 1.5134. Nevertheless sustained break of 1.3164 will argue that whole rise from 1.1409 has completed and bring deeper fall to 61.8% retracement at 1.2493.
Economic Indicators Update
| GMT | Ccy | Events | Actual | Forecast | Previous | Revised |
|---|---|---|---|---|---|---|
| 21:45 | NZD | PPI Input Q/Q Q4 | 1.10% | 1.60% | 1.60% | |
| 21:45 | NZD | PPI Output Q/Q Q4 | 1.40% | 2.30% | 1.80% | |
| 23:30 | JPY | National CPI Core Y/Y Jan | 0.20% | 0.30% | 0.50% | |
| 07:00 | GBP | Retail Sales M/M Jan | 1.00% | -3.70% | ||
| 07:00 | GBP | Retail Sales Y/Y Jan | 8.70% | -0.90% | ||
| 07:00 | GBP | Retail Sales ex-Fuel M/M Jan | 1.20% | -3.60% | ||
| 07:00 | GBP | Retail Sales ex-Fuel Y/Y Jan | 7.90% | -3.00% | ||
| 09:00 | EUR | Eurozone Current Account (EUR) Dec | 24.3B | 23.6B | ||
| 13:30 | CAD | New Housing Price Index M/M Jan | 0.50% | 0.20% | ||
| 13:30 | CAD | Retail Sales M/M Dec | -2.10% | 0.70% | ||
| 13:30 | CAD | Retail Sales ex Autos M/M Dec | -2.10% | 1.10% | ||
| 15:00 | USD | Existing Home Sales Jan | 6.12M | 6.18M | ||
| 15:00 | EUR | Eurozone Consumer Confidence Feb P | -8 | -9 |
Japan CPI core slowed to 0.2% yoy in Jan, CPI core core dropped to -1.1% yoy
Japan all item CPI slowed from 0.8% yoy to 0.5% yoy in January, below expectation of 0.6% yoy. CPI core (all item less fresh food) dropped from 0.5% yoy to 0.2% yoy, below expectation of 0.3% yoy. CPI core-core (all item less fresh food and energy), dropped from -0.7% yoy to -1.1% yoy, below expectation of -0.7% yoy.
Finance Minister Shunichi Suzuki said recent prices rises were "driven mostly by increases in energy costs", though forex moves also has had some impact. He added, "if inflation rises before improvement in job market, wage hikes kick in, that could affect consumption."
Fed Mester: Appropriate to hike in March, and follow with further increases in coming months
Cleveland Fed President Loretta Mester said yesterday, "I believe it will be appropriate to move the funds rate up in March and follow with further increases in the coming months."
"If by mid-year, I assess that inflation is not going to moderate as expected, then I would support removing accommodation at a faster pace over the second half of the year," she added.
Mester still expects inflation to remain above 2% this year and next. Moderation in inflation is "conditioned on the FOMC taking appropriate action to transition away from the current emergency levels of accommodation."
"We will need to convey the overall trajectory of policy and give the rationale for our policy decisions based on our assessment of the outlook and risks around the outlook, which are informed by economic and financial developments," Mester said. "This change in communications will provide a better sense of the FOMC's policy reaction function and should not be interpreted as the FOMC backing away from transparency."
Fed Bullard: We’re at risk that inflation won’t dissipate
St. Louis Federal Reserve President James Bullard warned during a panel talk at Columbia University, "we're at more risk now than we've been in a generation that this (inflation) could get out of control."
One scenario would be, "a new surprise that hits us that we can't anticipate right now, but we would have even more inflation," he said. "That's the kind of situation that we want to ... make sure it doesn't occur."
"Overall, I'd say there's been too much emphasis and too much mindshare devoted to the idea that inflation will dissipate at some point in the future," Bullard said. "We're at risk that inflation won't dissipate, and 2022 will be the second year in a row of quite high inflation. So that's why given this situation, the Fed should move faster and more aggressively than we would have in other circumstances."
Elliott Wave View: CADJPY Looking for Further Downside
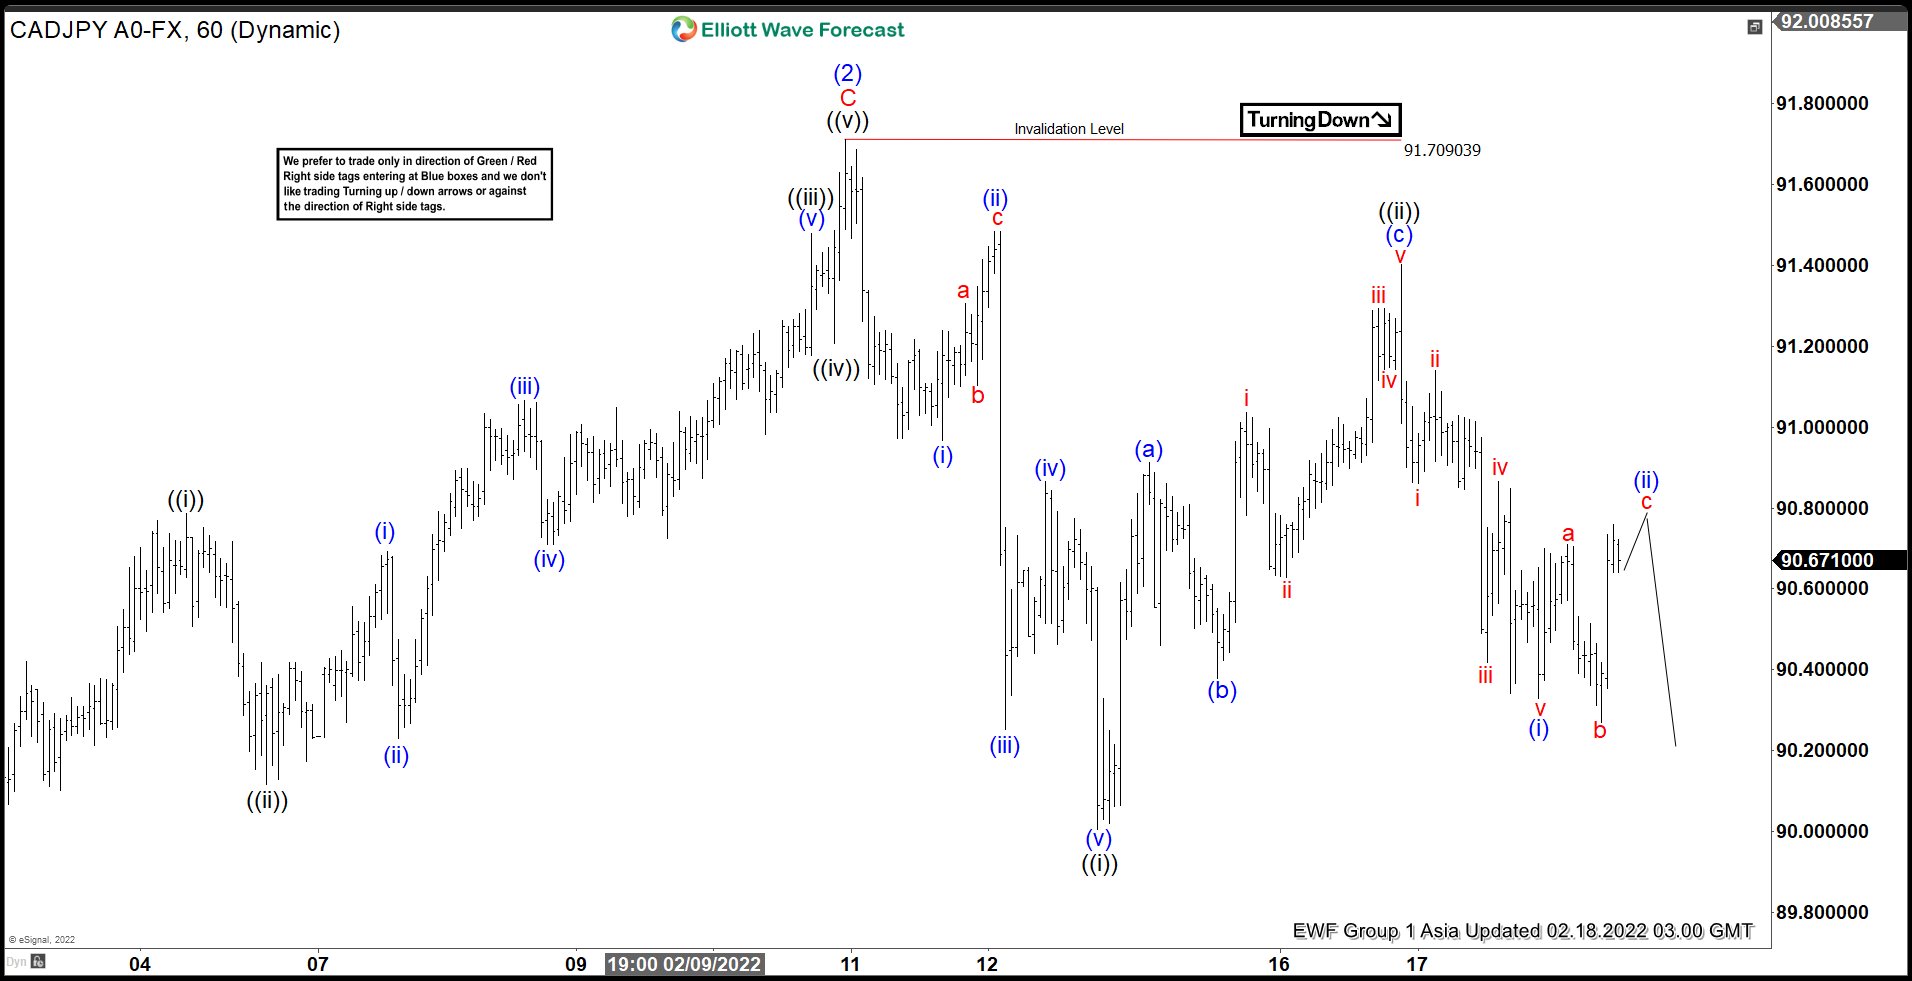
Short Term Elliott Wave View on CADJPY suggests that the rally to 91.7 ended wave (2). Pair has turned lower in wave (3) with internal subdivision as a 5 waves impulse Elliott Wave structure. Down from wave (2), wave (i) ended at 90.97 and rally in wave (ii) ended at 91.485. Pair resumes lower in wave (iii) towards 90.25 and rally in wave (iv) ended at 90.86. Final wave (v) lower ended at 90. This completed wave ((i)) in higher degree. Pair then corrected in wave ((ii)) which ended at 91.40.
Internal subdivision of wave ((ii)) unfolded as a zigzag Elliottwave structure. Up from wave ((i)), wave (a) ended at 90.91, pullback in wave (b) ended at 90.37, and wave (c) higher ended at 91.40. This completed wave ((ii)) in higher degree and pair has turned lower in wave ((iii)). Down from wave ((ii)), wave i ended at 90.86, wave ii ended at 91.13, wave iii ended at 90.419, wave iv ended at 90.86, and wave v ended at 90.32. This completed wave (i) of ((iii)) in higher degree. Near term, expect wave (ii) rally to correct the decline from wave ((ii)) peak before the next leg lower. As far as pivot at 91.7 high remains intact, rally should fail in 3, 7, or 11 swing for further downside.
CADJPY 60 Minutes Elliott Wave Chart
Cliff Notes: Balancing the Risks to Growth and Inflation
Key insights from the week that was.
A quiet week for data kept the focus on central banks and the heightened uncertainty surrounding Ukraine.
The first key event for the week was the release of the RBA February meeting minutes. Following a speech and parliamentary testimony by the Governor as well as the February Statement on Monetary policy, this set of minutes provided little additional insight with respect to the policy outlook. As discussed by our Chief Economist Bill Evans, taken together, recent guidance from the Governor and RBA Board continue to point to a “patient” approach to policy, with two more CPI prints likely to be assessed before an interest rate decision is made. Regarding wages, comfort looks to be growing amongst the Board that momentum is building, with the minutes noting that “the outlook for broader measures of employee earnings growth had been upgraded more substantially than base wages.” This supports our view that we do not need to see the Wage Price Index print above 3.0%yr before the first rate hike. Westpac continues to believe this step will be taken in August after the June CPI report is received in July. We also continue to forecast that the cash rate will reach a peak of 1.75% in early-2024. This tightening cycle is expected to have a material impact on the housing market, with a 14% price decline forecast between late-2022 and end-2024.
The January labour force survey was the sole primary data release for Australia this week. As in prior months, it pointed to robust strength in employment growth and a tight labour market overall, with 13k jobs created in the month and the unemployment rate unchanged at 4.2% despite a 0.1ppt increase in participation. The 8.8% decline in hours worked in the month highlights the impact of omicron; however, the weakness coming in hours rather than headcount signals it is only a transitory shock.
Moving offshore, the key release was the minutes of the FOMC’s January meeting, the tone of which was supportive of our expectation of a measured FOMC rate hiking cycle. The Committee are clearly confident in the economy’s prospects, with ‘maximum’ employment likely achieved and the risk discussion focused on inflation versus activity. Still, there was no evidence of alarm over inflation, with the risks on this front still seen as primarily coming from supply disruptions, global re-opening and US fiscal policy’s temporary support of demand, not the underlying strength of activity. On the latter, the Committee twice referenced “real wage growth in excess of productivity growth” as necessary to stimulate additional sustained inflation pressures.
This is certainly not in view for the US. Deflating annual growth in the Employment Cost Index wage measure at December by headline PCE inflation shows real wages down 0.6%yr in 2021; deflating instead by the CPI at January points to a real wage loss of closer to 2% over the past year. To make up this loss, US nominal wage rates need to grow 5.0%+ in 2022, assuming our CPI forecast of 3.3%yr is correct, and materially more if real wages are to grow “in excess” of productivity.
Two other discussions from the minutes are worth highlighting. With respect to the pace of tightening ahead, the Committee made a specific comparison to the last tightening cycle which began in 2015. The FOMC sees current conditions as warranting “a faster pace” of tightening in 2022; but this still points to only a modest action, with both 2015 and 2016 having seen just one rate hike after which 2017 and 2018 respectively saw three and four hikes (and 2019 rate cuts). Clearly, if the FOMC were considering a 50bp hike at the March meeting and/or the six hikes that the market has priced for 2022, a very different conversation would have been had at the January meeting.
On the balance sheet, it is notable that the Committee again considered ending asset purchases early, but instead chose to let them continue until March (again signalling comfort with the inflation outlook). Subsequently, they outlined that “a faster pace” of run off was likely appropriate ahead than in 2017-19. This speaks to our belief that the Committee will look to run two forms of tightening at the same time in 2022, with a willingness to be more aggressive with the balance sheet given the financial stability concerns associated with this form of easing.
The take home from these discussions is that a measured, conditional fed fund rate hiking cycle is most likely through 2022 and 2023, while remaining aware of the evolution of inflation risks. Our baseline forecast remains one hike per quarter beginning in March, with the fed funds rate peaking at 1.875% in Q3 2023. This should be a stance tight enough to mitigate inflation risks into the medium-term, but which still allows growth to remain at or near trend.
USD/JPY Starts Corrective Decrease, 114.20 Is The Key
Key Highlights
- USD/JPY failed to surpass the 116.40 resistance and corrected lower.
- It traded below a major bullish trend line with support near 115.25 on the 4-hours chart.
- EUR/USD is still struggling to clear the 1.1400 resistance.
- GBP/USD eyes more upsides above 1.3620.
USD/JPY Technical Analysis
The US Dollar attempted a strong move above 116.00 against the Japanese Yen. However, USD/JPY failed to surpass 116.40 and started a downside correction.
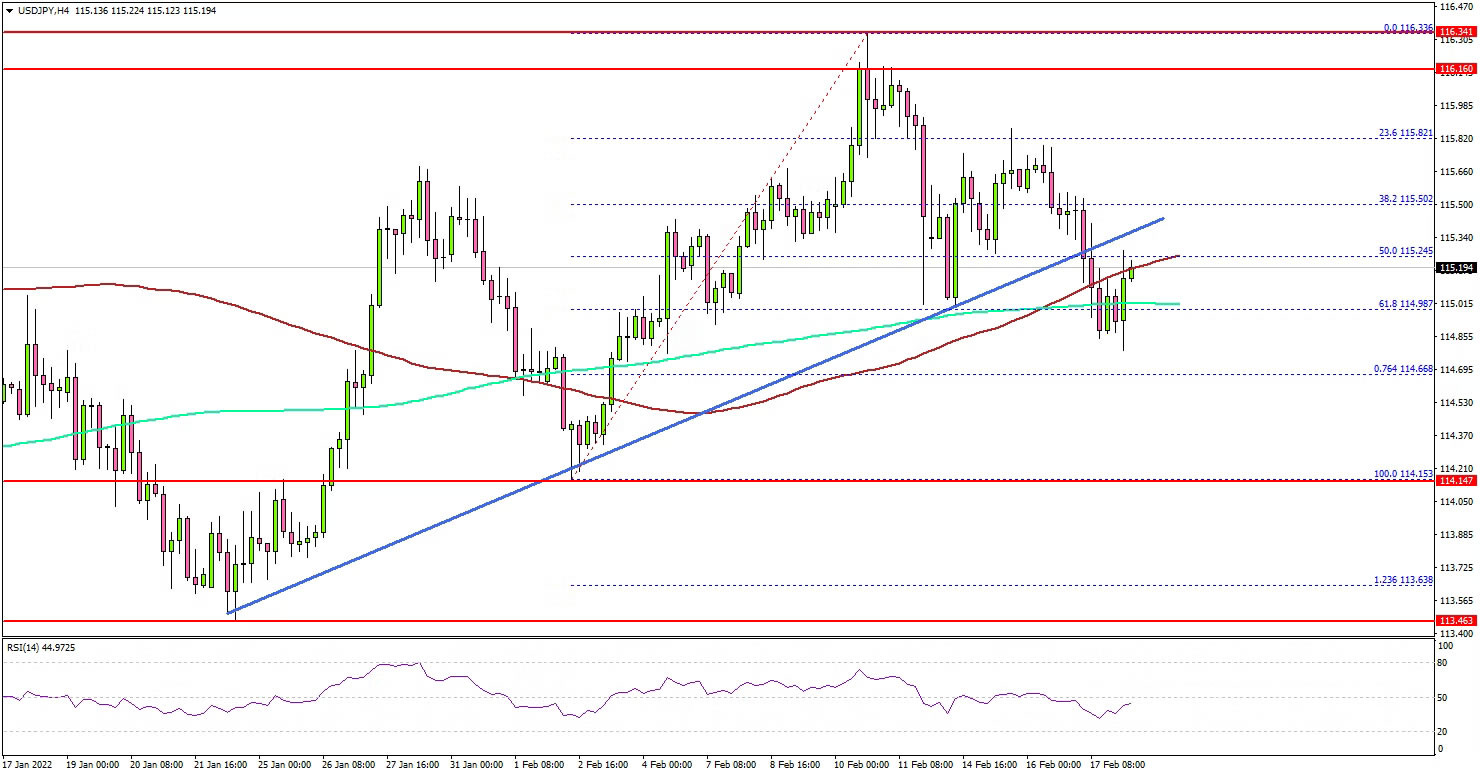
Looking at the 4-hours chart, the pair formed a top near 116.33 and corrected lower. There was a move below the 116.00 and 115.80 support levels. The pair declined below the 50% Fib retracement level of the upward move from the 114.15 swing low to 116.33 high.
Besides, there was a break below a major bullish trend line with support near 115.25 on the same chart. The pair even declined below the 100 simple moving average (red, 4-hours) and the 200 simple moving average (green, 4-hours).
The next key support is near 114.65. It coincides with the 76.4% Fib retracement level of the upward move from the 114.15 swing low to 116.33 high.
Any more losses might send the pair towards 114.20. On the upside, the pair is facing resistance near the 115.50 level. The next major resistance is near the 115.80 level. A close above 115.80 could open the doors for a strong increase.
Looking at EUR/USD, the pair is still struggling to clear the 1.1400 resistance zone. Conversely, GBP/USD seems to be aiming a clear move above 1.3650.
Economic Releases
- UK Retail Sales for Jan 2022 (YoY) - Forecast +8.7%, versus -0.9% previous.
- UK Retail Sales for Jan 2022 (MoM) - Forecast +1.0%, versus -3.7% previous.
- US Existing Home Sales for Jan 2022 (MoM) - Forecast -1.0%, versus -4.6% previous.