

Sample Category Title
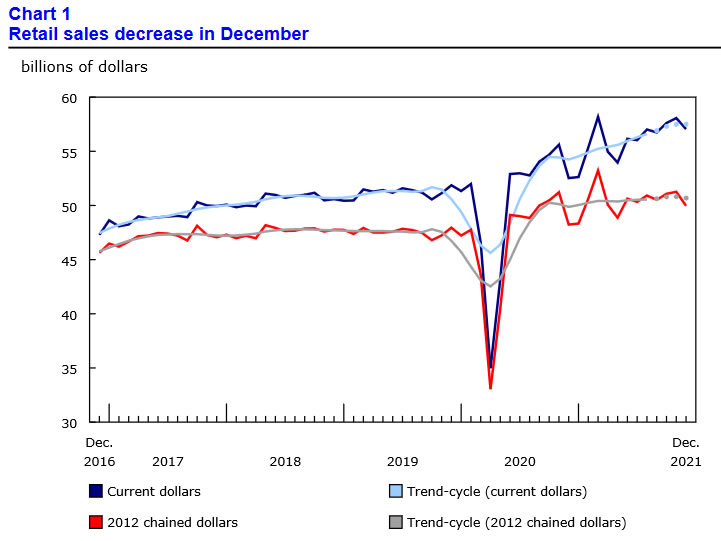
Canada retail sales dropped -1.8% mom in Dec, to rebound by 2.4% in Jan
Canada retail sales dropped -1.8% mom to CAD 57.0B in December, better than expectation of -2.1%. Sales were down in 8 of 11 subsectors, representing 62.9% of retail trade. Excluding gasoline stations and motor vehicle and parts, sales dropped -2.4% mom.
For Q4, retail sales were up 1.7%, marking its second consecutive quarterly increase.
Advance estimate suggests sales rose 2.4% in January.
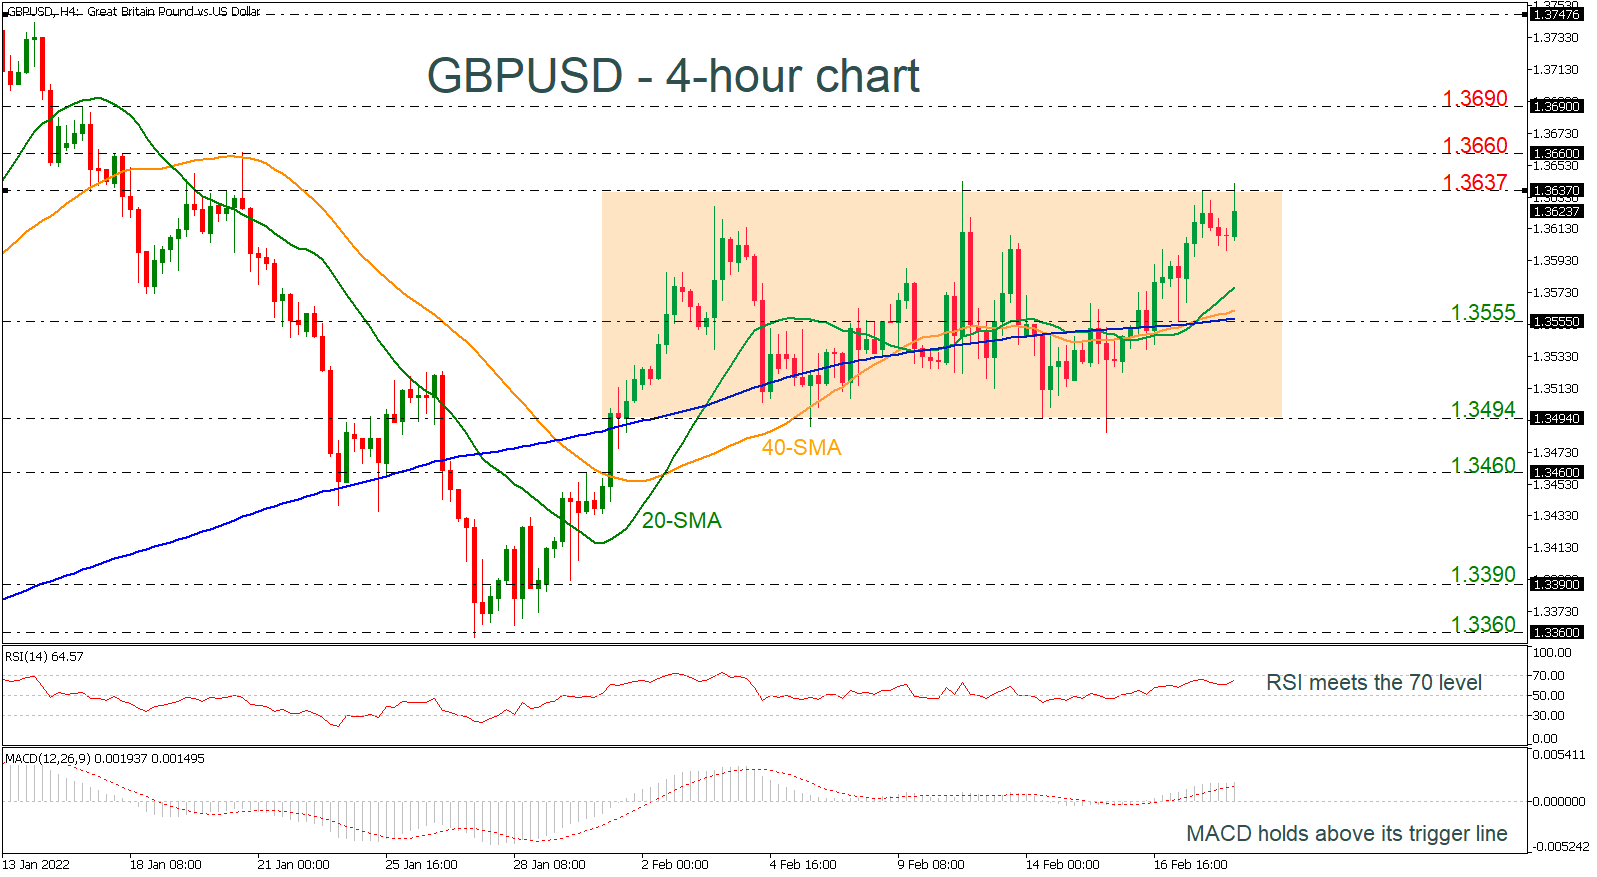
GBPUSD Tests Upper Boundary of Trading Range
GBPUSD is moving higher over the last 4-hour session remaining well above the short-term simple moving averages (SMAs). The RSI indicator is pointing up near the 70 level, while the MACD oscillator is holding above its trigger line in the positive region.
If the market overcomes the 1.3637 resistance level, the next stop could come from the 1.3660 resistance level. Surpassing the aforementioned levels, the bulls may visit the 1.3690 hurdle ahead of the 1.3750 barrier, registered in January 13.
On the other hand, a drop lower could take the bears until the immediate 20-period SMA at 1.3576 before tumbling to the 40- and the 200-period SMAs near the 1.3555 support level. Underneath these obstacles the market could make a pause at the 1.3494 mark.
In conclusion, GBPUSD has been in neutral phase in the short-term with upper boundary the 1.3637 resistance and lower boundary the 1.3494 support. Only a move above or below these levels may change this outlook.
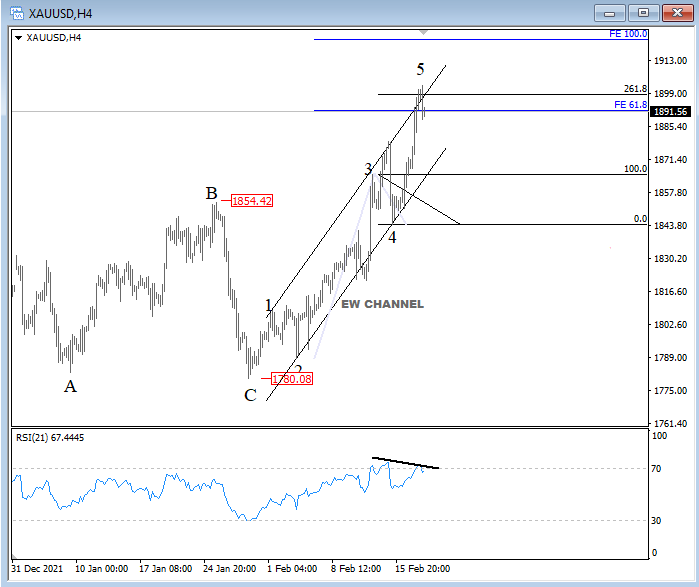
Gold May Slowdown for a Correction: Elliott Wave Analysis
Gold is coming sharply to the upside as a "safe haven" asset based on the latest US-Russia tensions. Higher inflation is also one of the reasons for higher metals.
Technically we see prices are coming up from 1780 in an impulsive fashion after 1854 was broken, but we see gold in a fifth wave now at strong 1900 resistance where we also see some important Fib levels. And RSI divergence may also suggest that bulls may slow down for a correction Important upward resistance area is at 1900.
Gold 4h Elliott Wave analysis
Cautious End to the Week
It promises to be a fascinating end to the week as European equity markets steady and US futures pare losses amid planned talks between the US and Russia next week.
Risk aversion swept through the markets on Thursday as the perceived risk of a Russian invasion of Ukraine rose. Much like the weather here in London, Friday was shaping up to be rather treacherous in the markets, that is until US Secretary of State Antony Blinken accepted an invitation to meet Russian Foreign Minister Sergei Lavrov in Europe next week.
While we're still being warned that a Russian invasion is highly likely, the meeting does offer hope that nothing will happen before then which is bringing some stability in the markets. In the absence of the meeting, it could have been another turbulent day in the markets and we could still see some risk aversion creeping in as we near the close, given how quickly these situations can change.
Rebound in UK retail sales nothing to get excited about
UK retail sales bounced back strongly in January from the slump in December which turned out to be worse than first thought after revisions. It was always likely that we were going to see a strong rebound as December's figures were heavily impacted by early Christmas shopping and the onset of omicron, so I don't think anyone is getting too excited by the data.
Not least because the cost-of-living crisis is upon us and it's not going to get any easier as real incomes are squeezed thanks to a broad array of price increases. The energy price cap increase and higher national insurance contributions will hit household finances again in April. This doesn't bode well when consumer confidence is already slumping.
Oil slides as the US nears nuclear accord with Iran
Reports of the US and Iran nearing a new nuclear deal couldn't have come at a better time and oil prices are slipping at the prospect of more than a million barrels of crude re-entering the market. In the absence of a deal, we could already be talking about triple-figure oil prices.
Of course, the risk of a Russian invasion remains heightened so there's plenty of potential for oil prices to head higher once more if troops do cross the border but the combination of next week's Blinkin-Lavrov meeting and a nuclear deal are providing relief for crude markets.
Gold shines as panic sets in
Gold surged once again on Thursday in risk-averse trade and topped $1,900 for the first time in eight months. The yellow metal is paring gains today, off around four-tenths of one percent, but remains well supported given the level of uncertainty and anxiety that exists.
It has really benefited from its role as a safe haven and inflation hedge, blowing away any suggestion that gold no longer serves such a purpose or that it's been in any way replaced. If troops cross the border, we could see it surge once more and potentially eye levels not seen since late 2020.
Bitcoin battered but holds at key support
Bitcoin got hammered on Thursday alongside other risk assets but importantly saw strong support around $40,000 where it continues to trade above. It had held up well in recent weeks, even during periods of risk-aversion, but it was well and truly swept up in it yesterday. A break below here could see it come under some pressure in the near term, especially if combined with broad risk-aversion in the markets.
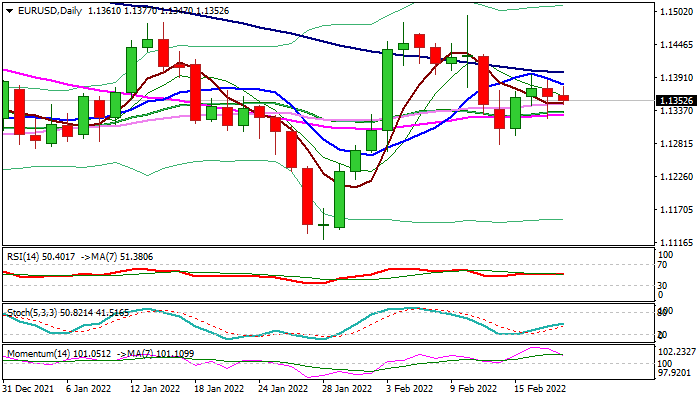
EUR/USD Outlook: Near-Term Action Remains Negatively Aligned Below Falling 10DMA
The Euro is trading in a choppy sideways mode in European session on Friday, with near-term action being weighed down by south-heading 10DMA which capped upticks in past two days and fading bullish momentum on daily chart.
Fresh weakness is probing below the base of thinning daily cloud and pressuring pivotal Fibo support at 1.1351 (38.2% of 1.1280/1.1395) upleg, violation of which would spark fresh acceleration lower for retest of Thursday’s low (1.1323, also Fibo 61.8% of 1.1280/1.1395) where bears were strongly rejected.
Caution on repeated failure to close below 1.1351 Fibo support that would signal extended sideways mode, however, near-term bias is expected to remain with bears as long action stays below descending 100DMA (1.1399).
Res: 1.1379; 1.1386; 1.1399; 1.1430.
Sup: 1.1337; 1.1323; 1.1294; 1.1280.
EURNZD Wave Analysis
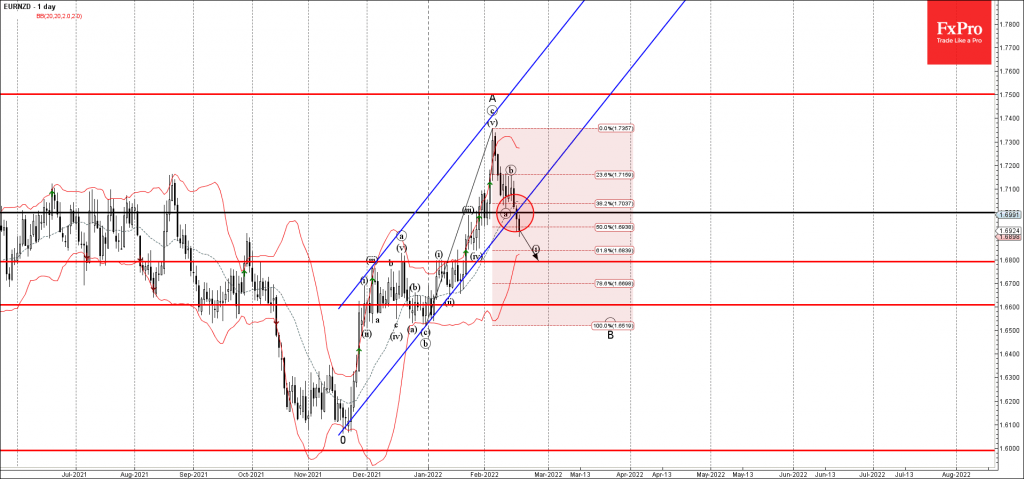
- EURNZD broke daily up channel
- Likely to fall to support level 1.6800
EURNZD currency pair recently broke the round support level 1.700, intersecting with the support trendline of the daily up channel from last November.
The breakout of the support level 1.700 accelerated the active minor impulse wave (i) – which belongs to the higher order downward wave B from the start of February.
EURNZD can be expected to fall further toward the next support level 1.6800 (former resistance from December and January, target for the completion of the active impulse wave (i)).
WTI Wave Analysis
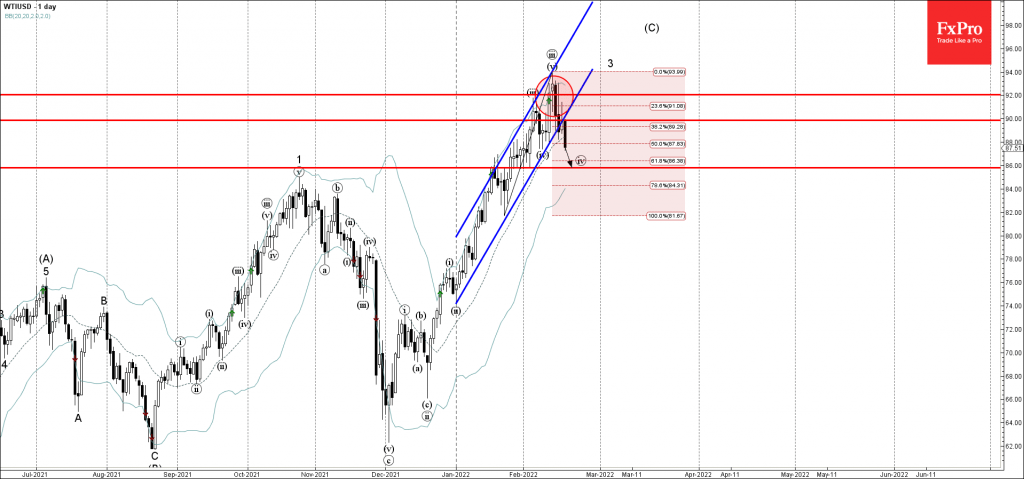
- WTI broke round support level 90.00
- Likely to fall to support level 86.00
WTI crude oil recently broke the round support level 90.00, intersecting with the support trendline of the daily up channel from December and the 38.2% Fibonacci correction of the previous upward impulse from January.
The breakout of the support level 90.00 accelerated the active minor correction (iv) – which started earlier from the key resistance level 92.00.
WTI crude oil can be expected to fall further toward the next support level 86.00 (target for the completion of the active minor correction (iv)).
GBPCAD Wave Analysis
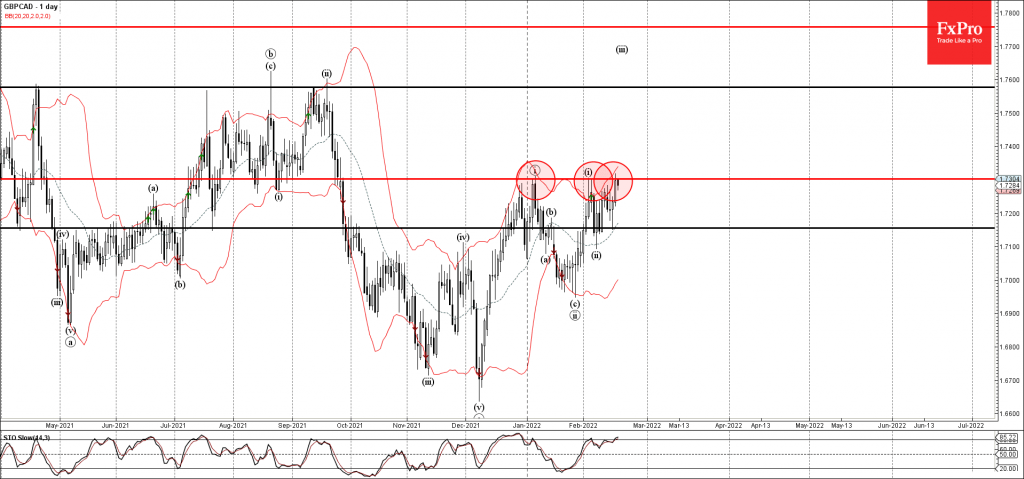
- GBPCAD reversed from resistance level 1.7300
- Likely to fall to support level 1.7155.
GBPCAD currency pair recently reversed down from the resistance level 1.7300 (which has been repeatedly reversing the price from the start of January).
The resistance zone near the resistance level 1.7300 was strengthened by the upper daily Bollinger Band.
Given the overbought daily Stochastic – GBPCAD currency pair can be expected to fall further toward the next key support level 1.7155.
USDCAD Stuck in 3-Week Range as Trend Vanishes
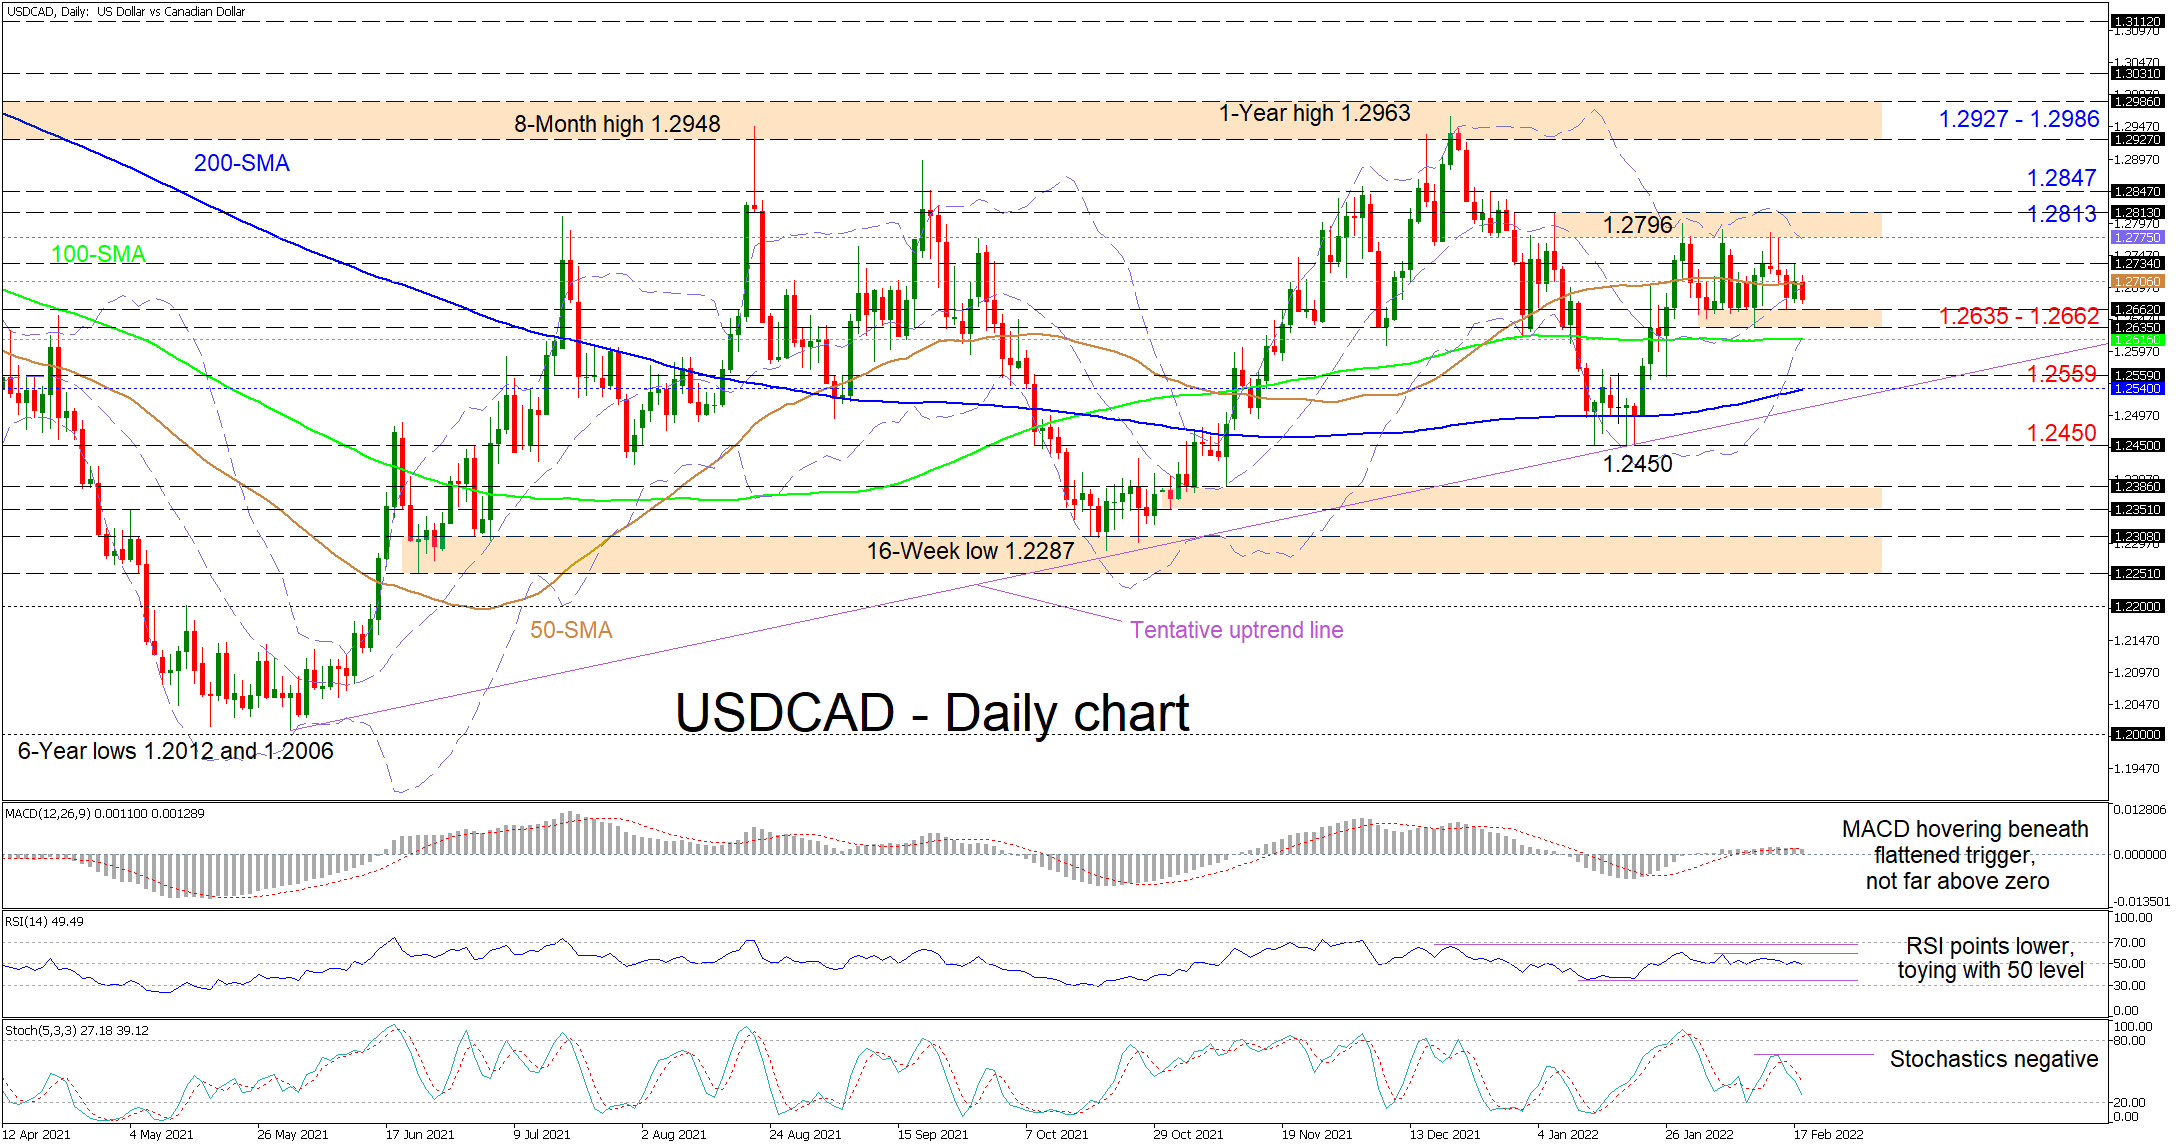
USDCAD is trading just beneath the horizontal 50-day simple moving average (SMA) around 1.2706 as a three-week consolidation period seems to have the pair chained between the 1.2635 and 1.2796 boundaries. The overall neutral trajectories of the SMAs suggest that the price trend has dissolved, hinting that the pair may continue to drift for a while longer.
The short-term oscillators are conveying conflicting messages in directional momentum. The MACD, slightly north of the zero threshold, is trailing marginally underneath its firming red signal line, while the RSI is flirting with the 50 level. That said, the negatively charged stochastic oscillator is promoting additional negative price moves on the lower side of the range.
In the negative scenario, preliminary downside constraints could occur at the 1.2635-1.2662 nearby base. If this floor of the sideways pattern gives way, prompt tough support may then come from the converged lower Bollinger band and 100-day SMA at 1.2616, before sellers target the region between the 1.2559 trough and the 200-day SMA at 1.2540. A further break of this key support band, which is overlapped by the tentative uptrend line pulled from the 6-year low of 1.2006, could be a tough blow towards the more than six-month gradual climb in the pair. Yet, the bears would need to slide beneath the January 19 trough of 1.2450 to spark worries about growing negative tendencies in the pair.
On the other hand, if buyers re-emerge and overstep the mid-Bollinger band at 1.2706 - coupled with the flattening 50-day SMA - the yesterday’s high of 1.2734 could delay the test of the 1.2775-1.2796 ceiling of the range. That said, to strengthen upside momentum, the bulls would need to surpass this resistance section, which extends slightly higher up until the January 6 high of 1.2813. From here, overstepping the neighbouring 1.2847 barrier too could then propel the price higher towards the 1.2927-1.2986 resistance barricade, which has capped advances in the broader picture since early November 2020.
Summarizing, USDCAD is exhibiting a neutral-to-bullish tone above the 1.2635-1.2662 base, the longer-term 100- and 200-day SMAs, and the ascending trend line. That said, a break either below 1.2635-1.2662 or above 1.2813 could reveal the next clear price direction.
Strong UK Retail Sales Pave the Way up for Pound
UK retail sales added 1.9% in January, following a dip of 4.0% a month earlier. By the same month a year earlier, the increase was 9.1%, as January 2021 saw a sharp tightening of the lockdown and the vaccination campaign had only just started.
The data came out slightly better than expected, supporting purchases of British currency against the dollar, but remains very volatile due to restrictions in previous months. Sales generally remained above multi-year trend levels, which is a good signal of the economy’s health.
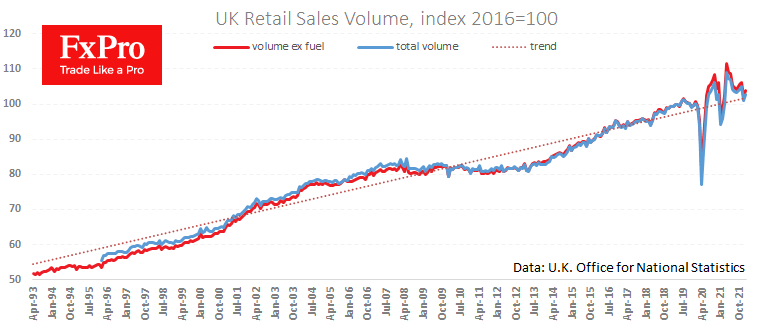
After the financial crisis from 2009 to 2016, there was a long period when sales were below the long-term trend line and were one of the obstacles why the Bank of England could not go ahead with a rate hike.
These days, the need to suppress inflation is combined with the ability to do so thanks to strong consumer demand and the labour market.
Sales were also boosted by pent-up demand for services and goods that were in restricted supply during the pandemic. This process may gain momentum in the coming months, painting a more colourful picture of consumer activity, but could lead to disappointment in the second half of the year.
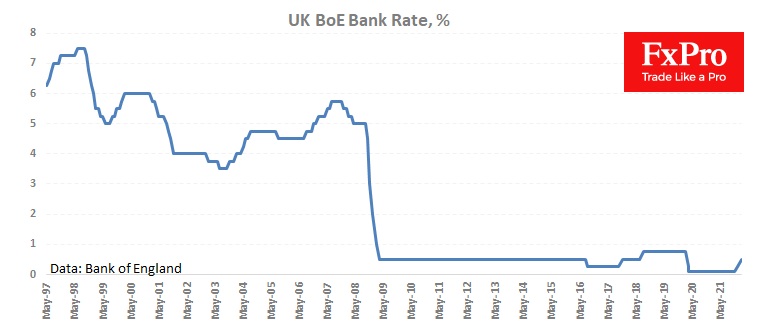
The Bank of England should keep a close eye on the coming economic releases to avoid repeating the mistakes of the ECB, which rushed through a rate hike in May 2009, undermining the economic recovery.
On Friday morning, the British pound is testing the highs of February, rising to 1.3630. A rise to 1.3680 may be a development in the current momentum. However, a jump even higher would reflect a break of the downtrend since last June, anchoring GBPUSD above the 200-day average and setting the pair up to test previous highs.