

Sample Category Title
Roaring Start to the Tiger Year
US futures traded flat in the overnight trading session, as the Federal Reserve (Fed) hawks came back in charge following strong job additions, and solid wages growth in the latest US jobs data.
The US 2-year yield peaked above the 1.30% for the first time since the beginning of the pandemic. The short end of the US yield curve is rebounding fast, but we are still at the pre-pandemic levels meaning that there is more room for a further yield flattening in the coming weeks. Therefore, the risks are still touted to the downside for equity markets.
Week ahead
This week the attention will shift from corporate earnings to macroeconomic data, more specifically to latest US consumer price index that could have advanced to 7.3% in the US in January. Fear of a stronger inflation will likely keep the investor appetite limited until the data release. Thursday’s US CPI figure is expected to have advanced to a fresh 40-year high of 7.3% in January, as energy prices kept souring during the first month of the year, and they show no signs of easing. The barrel of US crude is now consolidating gains above the $92 mark.
The S&P00 closed last week above its 200-DMA, while Nasdaq gained more than 2% during the week, although we are still below the 200-DMA, and with a 50-DMA which is now plunging toward the 200-DMA as a sign that a death cross formation will soon be what we will be discussing.
Overall
Chinese stocks rallied as Chinese investors returned from a week-long Lunar New Year break, and they had some gains to catch up with. Plus, the better-than-expected Caixin services PMI offered a roaring start to the Tiger Year, but the rest of Asia looks much less promising with stock in Japan, Hong Kong and Australia trading in the red due to the stronger hawkish Fed expectations.
The US dollar rebounded from its 100-DMA, Bitcoin finally cleared the $40K resistance.
The Bitcoin relief comes with a slight delay to the rebound in stocks, but gains could remain limited as the worries that initially sent the cryptocurrency valuations lower are still in play and should be watched closely.
Markets Eye the End of Negative Rates in the Euro Area
Market movers today
Monday's data calendar is light with only German industrial production data for December due. Consensus expects stabilisation in monthly figures after a contraction in November.
Today's EP hearing with ECB president Lagarde starting at 16:45 CET will attract more than the usual attention in light of ECB hawkish turnaround last week.
Later in the week, we get the US CPI data from January on Thursday, which is extremely important for what the Fed will do at the March meeting. UK Q4 GDP data is out on Friday.
We are looking forward to hearing from the Riksbank on Thursday, not least now that other central banks are turning more hawkish.
We will have ECB Villeroy on the wires on Tuesday and Thursday, while Fed's Bowman and Mester will speak on Wednesday. In the context of aggressive market repricing, we will pay close attention to any clues regarding the pace of monetary policy tightening.
Any headlines regarding the Russia-Ukraine stand-off will also remain in focus. French President Macron is heading to Moscow to discuss a de-escalation with President Putin.
The 60 second overview
Strong US jobs report: Non-farm payrolls were quite strong in January taking into account the high number of sick days due to omicron (also highlighted by the difference between employment growth in the establishment and household surveys). There were also very large revisions to employment. Wage sum growth remains higher than before COVID-19 and the wage sum level is now above the old pre-COVID trend path, suggesting very strong demand in the US. As a result, the implied probability of a 50bp rate hike in March rose from ~20% to ~40% (a total of 5.3 rate hikes this year), which seems fair given the current economic condition, see Fed Update: Different economy, different hiking cycle - a comparison with December 2015, 3 February.
ECB market pricing: In Europe, markets eye the end of negative rates in the euro area with 2yr €STR now in positive territory. ECB's Klaas Knot expects the first rate hike as early as Q4 2022 and the second one in spring 2023, in line with our new ECB call, as we call for 25bp rate hikes in December 2022 and March 2023, see ECB Review: New call - ECB to hike in December 2022 and March 2023, 3 February.
Oil: Oil prices continue to move higher and are now close to 94 USD/barrel, the highest level since 2014. The upward trend in oil prices is also putting more pressure on central banks around the world.
Emerging markets: This morning we published our new Emerging Markets Monthly - Will Fed tightening trigger an EM crisis?, 7 February, where we argue that EM FX could be up for broad-based weakness if and when US financial conditions tighten. Historically, US rate hikes alone have not led to a sustained tightening in financial conditions, but EM weakness has been more pronounced during times of market stress, i.e. when wider credit spreads and weaker equity valuations imply tighter financial conditions.
Equities: Very mixed performance on global equity markets Friday. Some markets in Asia lifted by the post New Year holiday reopening, Europe hit by a negative catch-up to the Thursday US session and finally yet importantly US lifted by some very strong earnings by few giants. To put it into perspective, cyclicals outperforming in the US while underperforming in Europe. Growth outperformed although bond yields were higher, but earnings reports were sufficient to off-set the macro drivers Friday. Asian stocks are mostly lower this morning with mainland China going against the tide as it reopens after Lunar New Year. Futures in Europe are higher while US futures are close to unchanged this morning.
FI: A continuation of Thursday's blood bath in rates markets continued on Friday after the hawkish turnaround from the ECB (the pace was accelerated on the strong US jobs report). European bonds yields took another leg higher in yields (by 6-7bp) in core countries, while peripheral bond yields rose an additional 3bp in the 10y area. However, the 5y point suffered the most with 5y Germany turning positive for the first time since 2018. The Friday close of BTPs-Bund spread at 154bp is the widest since the summer 2020, in the aftermath of the PEPP announcement. 10s30s part of the curve flattened yet again, with the EUR swap flattening 3.5bp to -7.5bp, while the cash curve flattened 4bp to 14.9bp. Inflation forward curves flattened again with the 5y5y down 3bp to 1.75%.
FX: On Friday, EUR/USD rose closer to 1.15 but erased some of the gains after the strong US jobs report. Both EUR/NOK and EUR/SEK moved higher. EUR/GBP moved higher and is now closer to 0.85 than 0.84.
Credit: Friday, the very bad risk sentiment we saw post the hawkish CB announcements continued. The hawkish expectations got further fuel during the day after the strong US NFP. Main widened by 2.7bp to 64.8bp while Xover widened 14.3bp to 314.5bp. The latter marks some 29bp widening during last week. The liquidity in cash space is very thin currently, but the few trades that got done pointed to markedly wider spreads during Friday.
ECB Kazaks: July hike imply an imply an extremely and unlikely quick pace of tapering
ECB Governing Council member Martins Kazaks said in a Reuters interview that a July rate hike "would imply an extremely and unlikely quick pace of tapering". Overall, "at the current juncture, naming a specific month would be much premature."
"If we see that inflation remains high and the labor market remains strong or strengthens further, if we see that the economy keeps going, the direction is clear: we may act sooner than we assumed in the past," he added.
Over the weekend, another Governing Council member Klass Knot said, "personally I expect our first rate increase to take place around the fourth quarter of this year.... Normally we would raise rates by a quarter percentage point, I have no reason to expect we would take a different step."
USD/CAD Correcting Gains from 1.2787 High
The US Dollar started a steady increase from the 1.2650 support zone against the Canadian Dollar. The USD/CAD pair gained pace for a move above the 1.2700 level.
The pair even cleared the 1.2740 level and settled above the 50 hourly simple moving average. A high was formed near 1.2787 and the pair is now correcting gains. An immediate support is near 1.2725 on FXOpen.
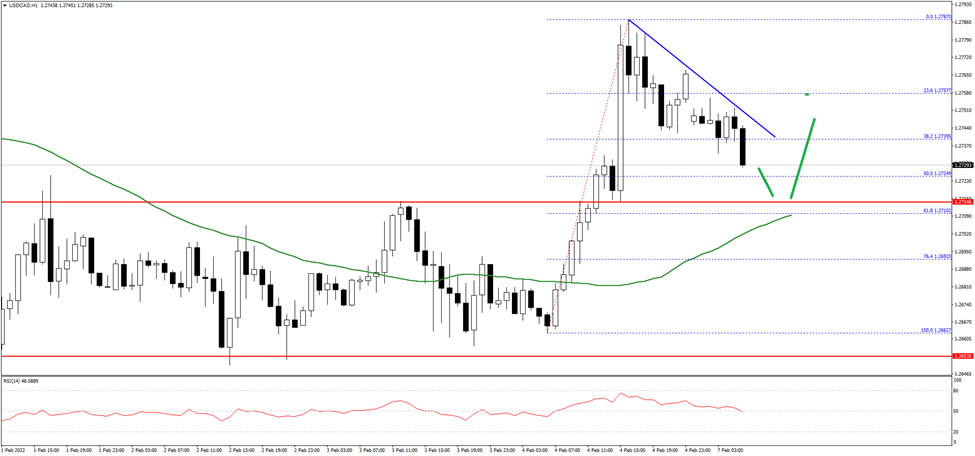
The next major support is near the 1.2710 level and the 50 hourly simple moving average. Any more losses might call for a move towards the 1.2650 support zone.
On the upside, the pair is facing resistance near a connecting bearish trend line at 1.2740 on the hourly chart. If there is a clear upside break, USD/CAD might start a steady increase towards the 1.2785 and 1.2800 levels in the near term.
Will the US Dollar Rise Again?
Although the dollar index fell to the lowest level in two years, it has room to recover.
JPMorgan believes that the US dollar can continue its upward journey even after the Federal Reserve starts raising interest rates. The Fed has been struggling with taming the fastest inflation since the 1980s. The dollar index has risen about 5% in the past year, raising questions about whether the uptrend is over.
However, in our view, the USD has more room to rise and make bigger gains. The markets are still in a mode of price discovery, and pricing economic data and Fed decisions. Notice that the dollar's peak usually comes a month or two after the Fed hike rates.
Market expectations of five rate hikes this year have strengthened, following hawkish comments from President Jerome Powell during the last meeting. The US central bank may choose to start raising rates by 50 basis points at the March meeting.
The market is chasing the Fed, trying to anticipate its next moves, because this is clearly a very unconventional cycle. For example, the Fed initially predicted that inflation would calm down if the supply chain problems related to the pandemic subside. However, it recently acknowledged that this process is taking longer than expected.
Obstacles for the US dollar
The dollar may face obstacles that will hamper the upward trend, with a significant shift in tone from the European Central Bank and the Bank of England.
The Bank of England and the European Central Bank both met market expectations. The BoE raised the interest rate by 25 basis points to 0.50% for the second time in a row. At the same time, the ECB kept its policy unchanged but shifted its tone in addressing the risks of inflation attacking the Eurozone.
The dollar index recorded its worst week in nearly two years last Friday, after the euro settled at its highest in three weeks at the beginning of this week, while the pound rose after strong shifts from ECB and BoE. EUR/USD saw a significant upward shift in price action last Friday (largest one-day move since December 2020) after ECB President Christine Lagarde acknowledged rising inflation risks and declined to repeat earlier guidance that a rate hike this year is highly unlikely. That marks a sharp shift in the tone of monetary policy for one of the world's most dovish central banks. With that, the decision to raise rates in the Eurozone in 2022, which was previously unacceptable, is now available on the table.
Nevertheless, the euro's gains will not continue in the short term, with a looming Fed tightening, which will support the dollar strongly.
US economy is improving
US jobs data, stronger than expected, supported the dollar last Friday, pushing the dollar index back to 95.46 after a week full of bruises for the US currency. As the US economy and labor market improve, this will lead the Fed to tighten policies and raise rates at the March meeting.
In the end, the dollar is expected to continue its bullish trend, as it has not reached its peak yet. However, the USD might struggle with some EUR strength with the support of ECB tightening, which may curb its gains. Nevertheless, it will not kill the uptrend.
Technical Outlook and Review
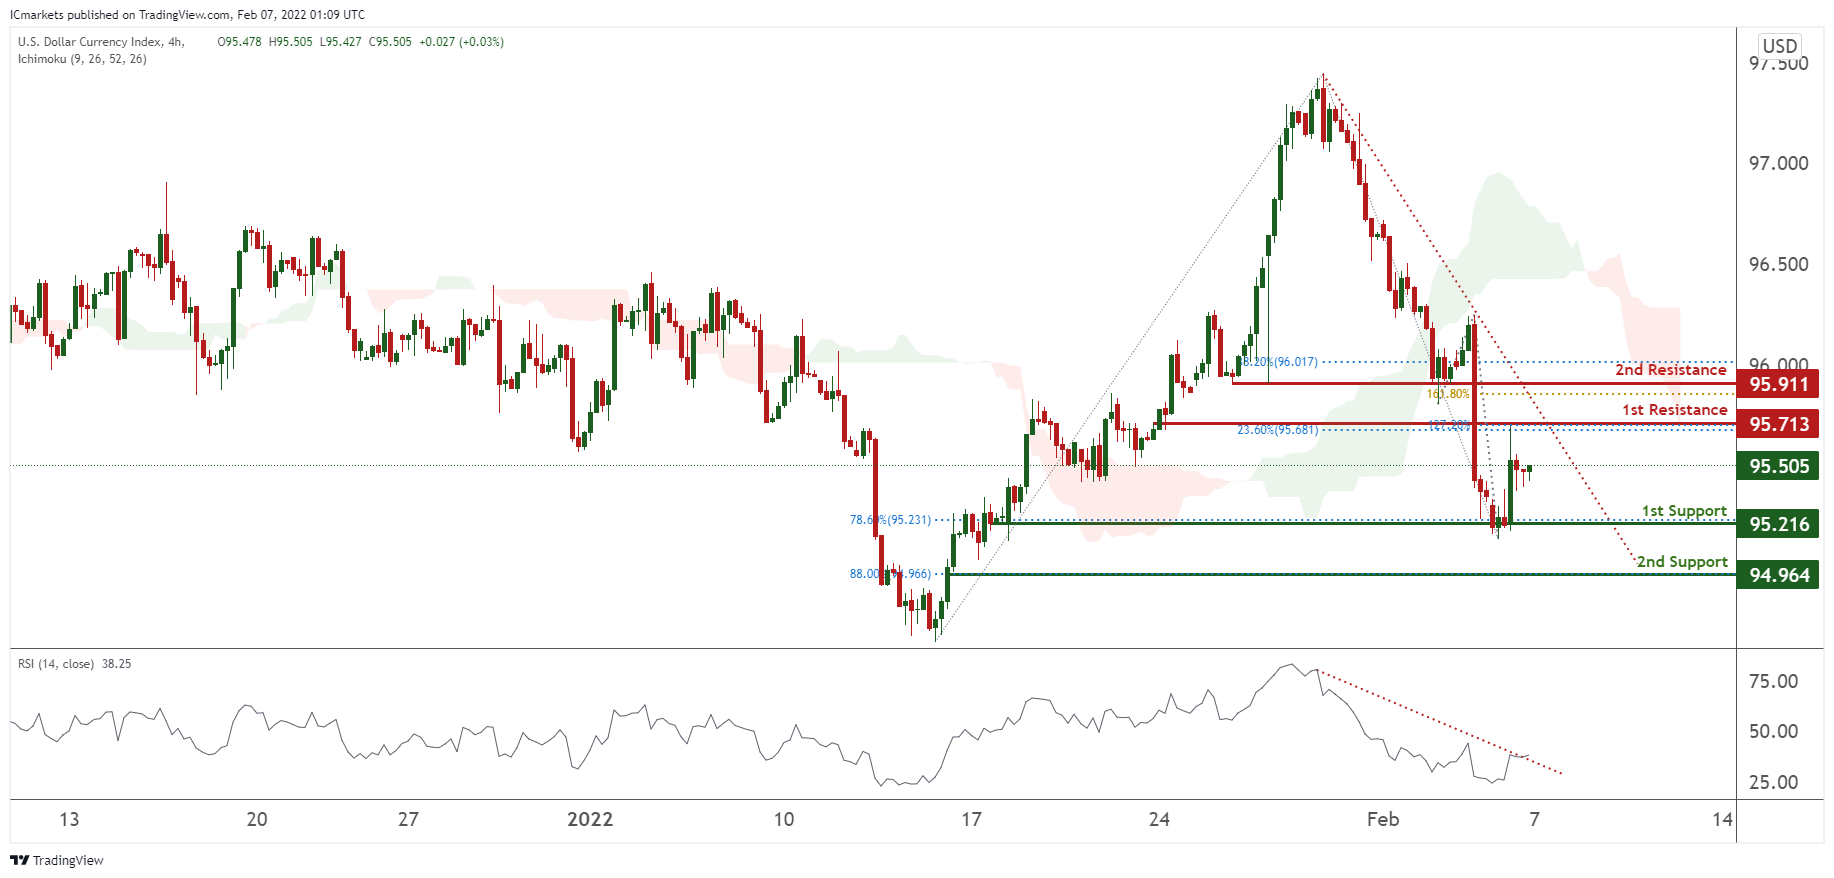
DXY:
On the H4 timeframe, prices are on bearish momentum and abiding to our descending trendline. We see the potential for a dip from our 1st resistance at 95.713 in line with 23.6% Fibonacci retracement and 127.2% Fibonacci extension towards our 1st support at 95.216 in line with 78.6% Fibonacci retracement. RSI and Ichimoku clouds are also showing bearish momentum.
Areas of consideration:
- H4 time frame, 1st resistance at 95.713
- H4 time frame, 1st support at 95216
XAU/USD (GOLD):
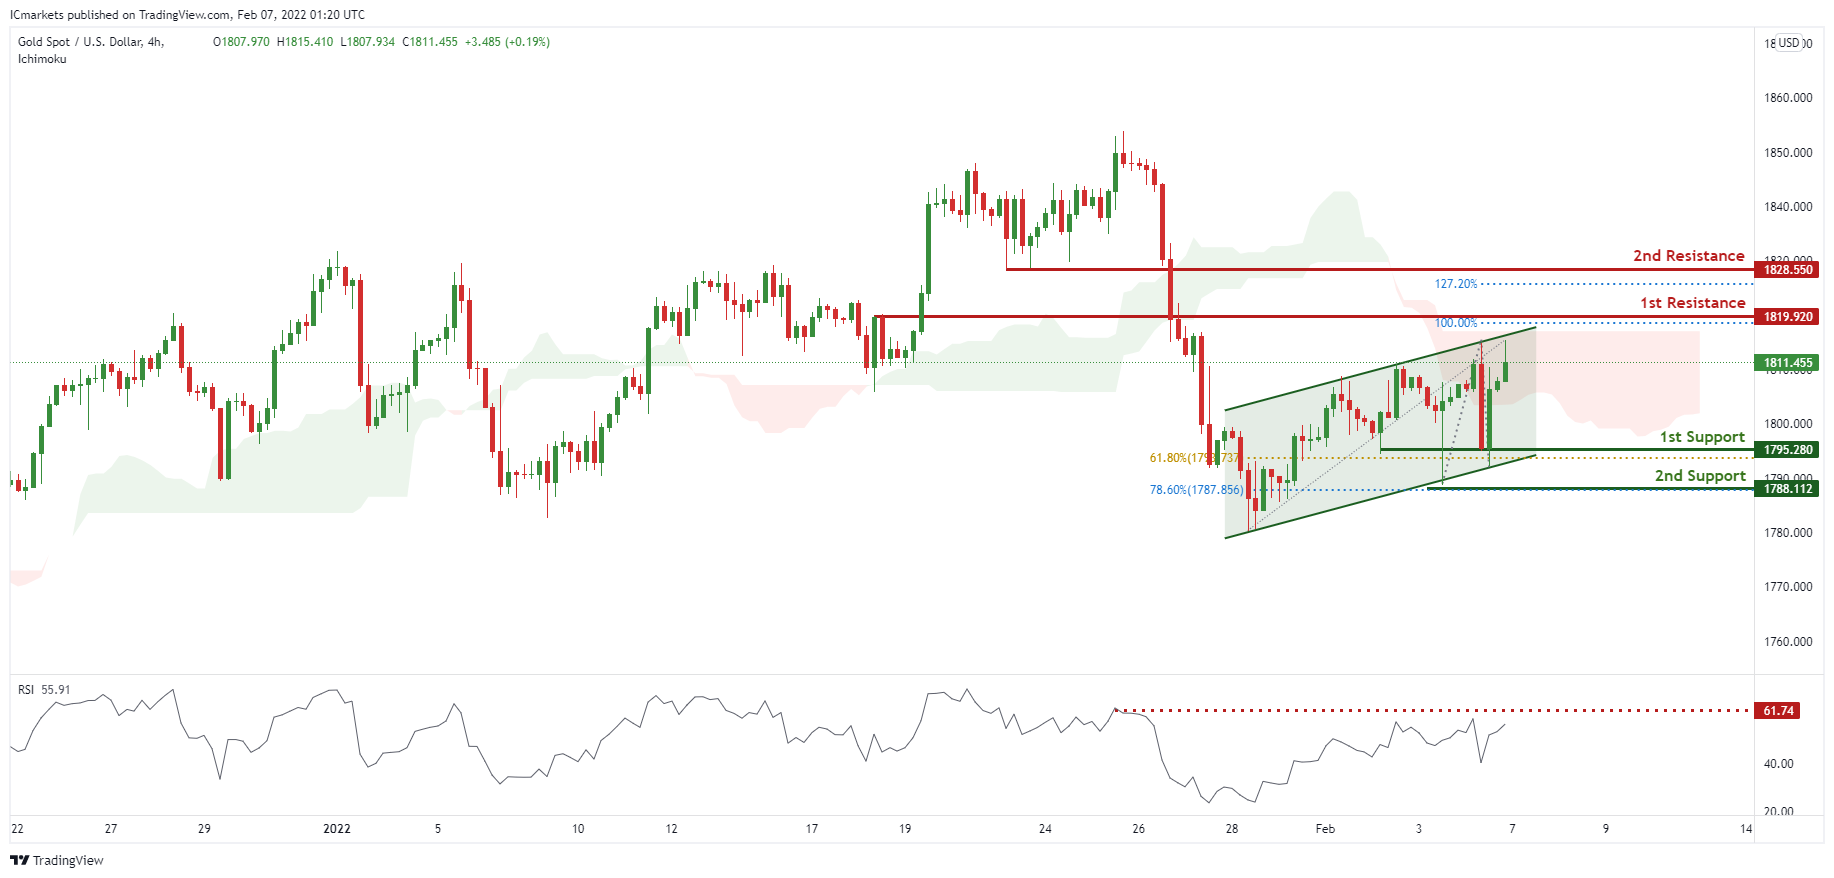
On the H4 chart, prices are abiding to an ascending parallel channel. We see potential for prices to dip from our 1st resistance at 1819.920 in line with 100% Fibonacci extension towards our 1st support at 1795.280 in line with 61.8% Fibonacci retracement. RSI are at levels where dips previously occurred and also prices are facing resistance at our Ichimoku cloud support.
Areas of consideration:
- 4h 1st support at 1795.280
- 4h 1st resistance at 1819.920
GBP/USD
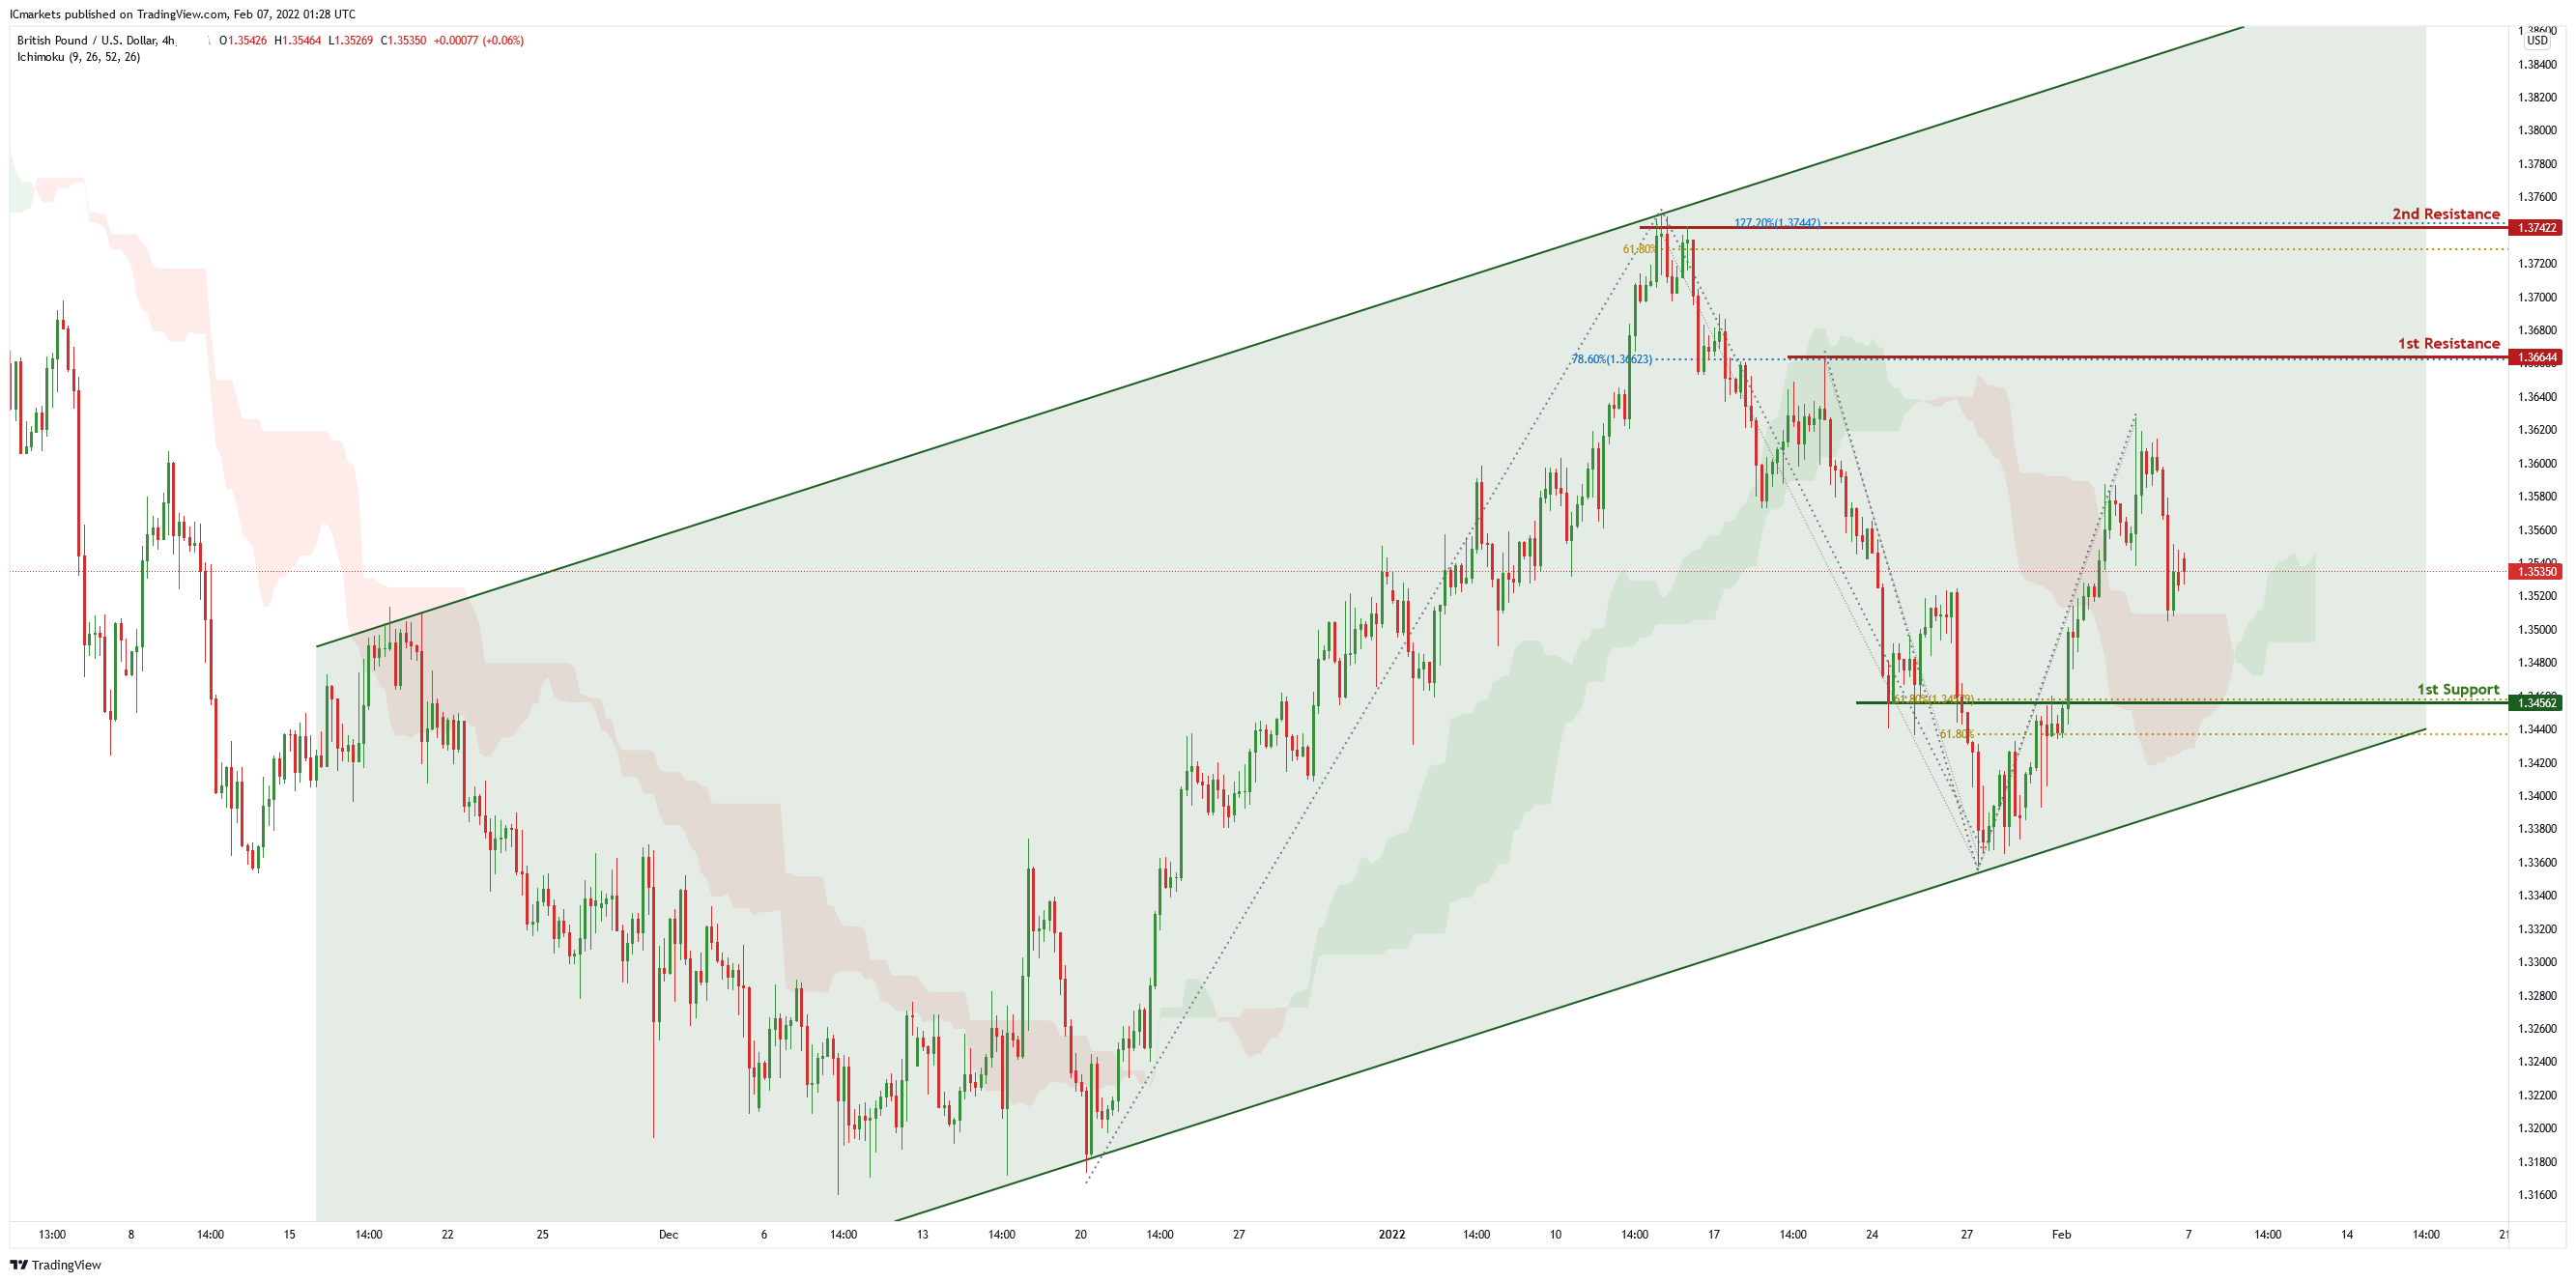
On the H4 chart , price is trading in an ascending channel , price is in the middle of the 1st resistance level of 1.36644 which is also 78.6% Fibonacci projection and 1st support level of 1.34562 which is also 61.8% Fibonacci projection and 61.8% Fibonacci retracement. Price can potentially go to its 1st resistance level. Our bullish bias is supported by the ichimoku cloud indicator.
Areas of consideration:
- H4 1st resistance at 1.36644
- H4 1st support at 1.34562
USD/CHF:
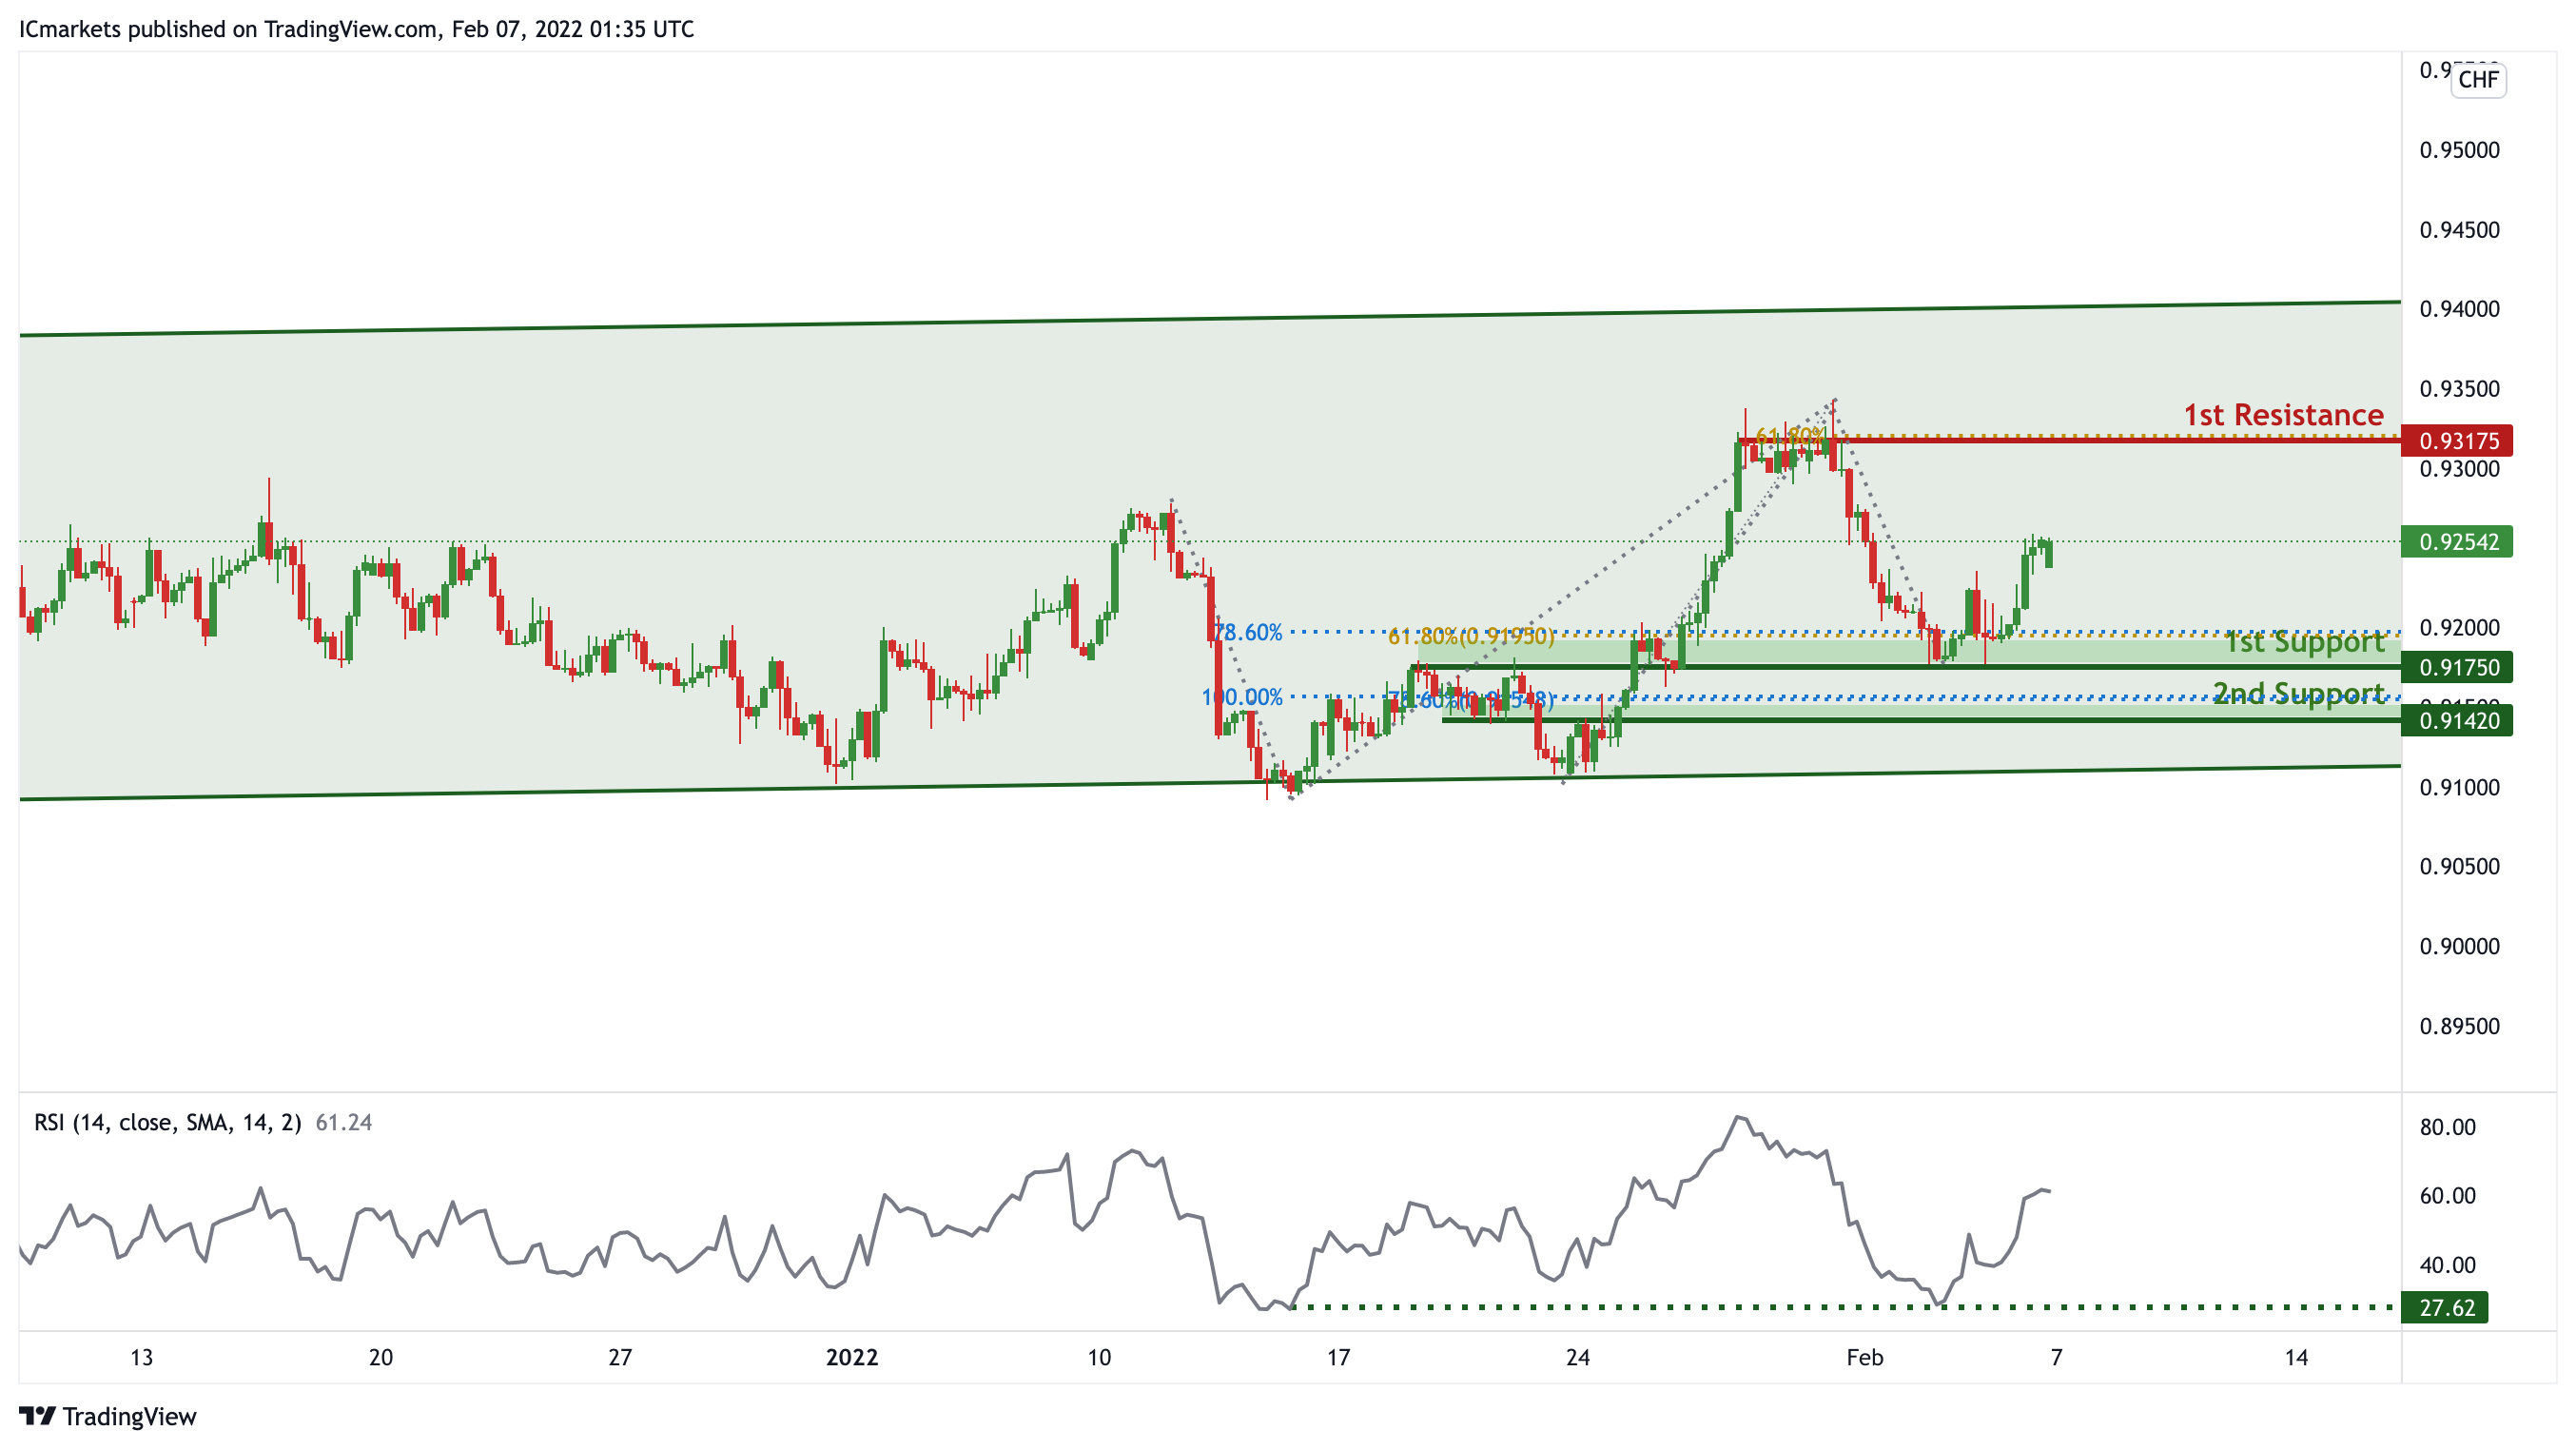
On the H4 timeframe,in reference to last week’s analysis price indeed bounced at the 1st Support level. Price is abiding to the daily ascending channel signifying an overall bullish momentum. We can expect the price to bounce from 1st Support in line with 78.6% Fibonacci projection and 61.8% fibonacci retracement towards 1st Resistance in line with 61.8% Fibonacci projection and previous swing high. Our bullish bias is further supported by the RSI indicator where it is at the support level. Traders should wait for prices to swing higher or lower before entering.
Areas of consideration:
- Watch 1st Support at 0.91750
- Watch 1st Resistance at 0.93175
EUR/USD :
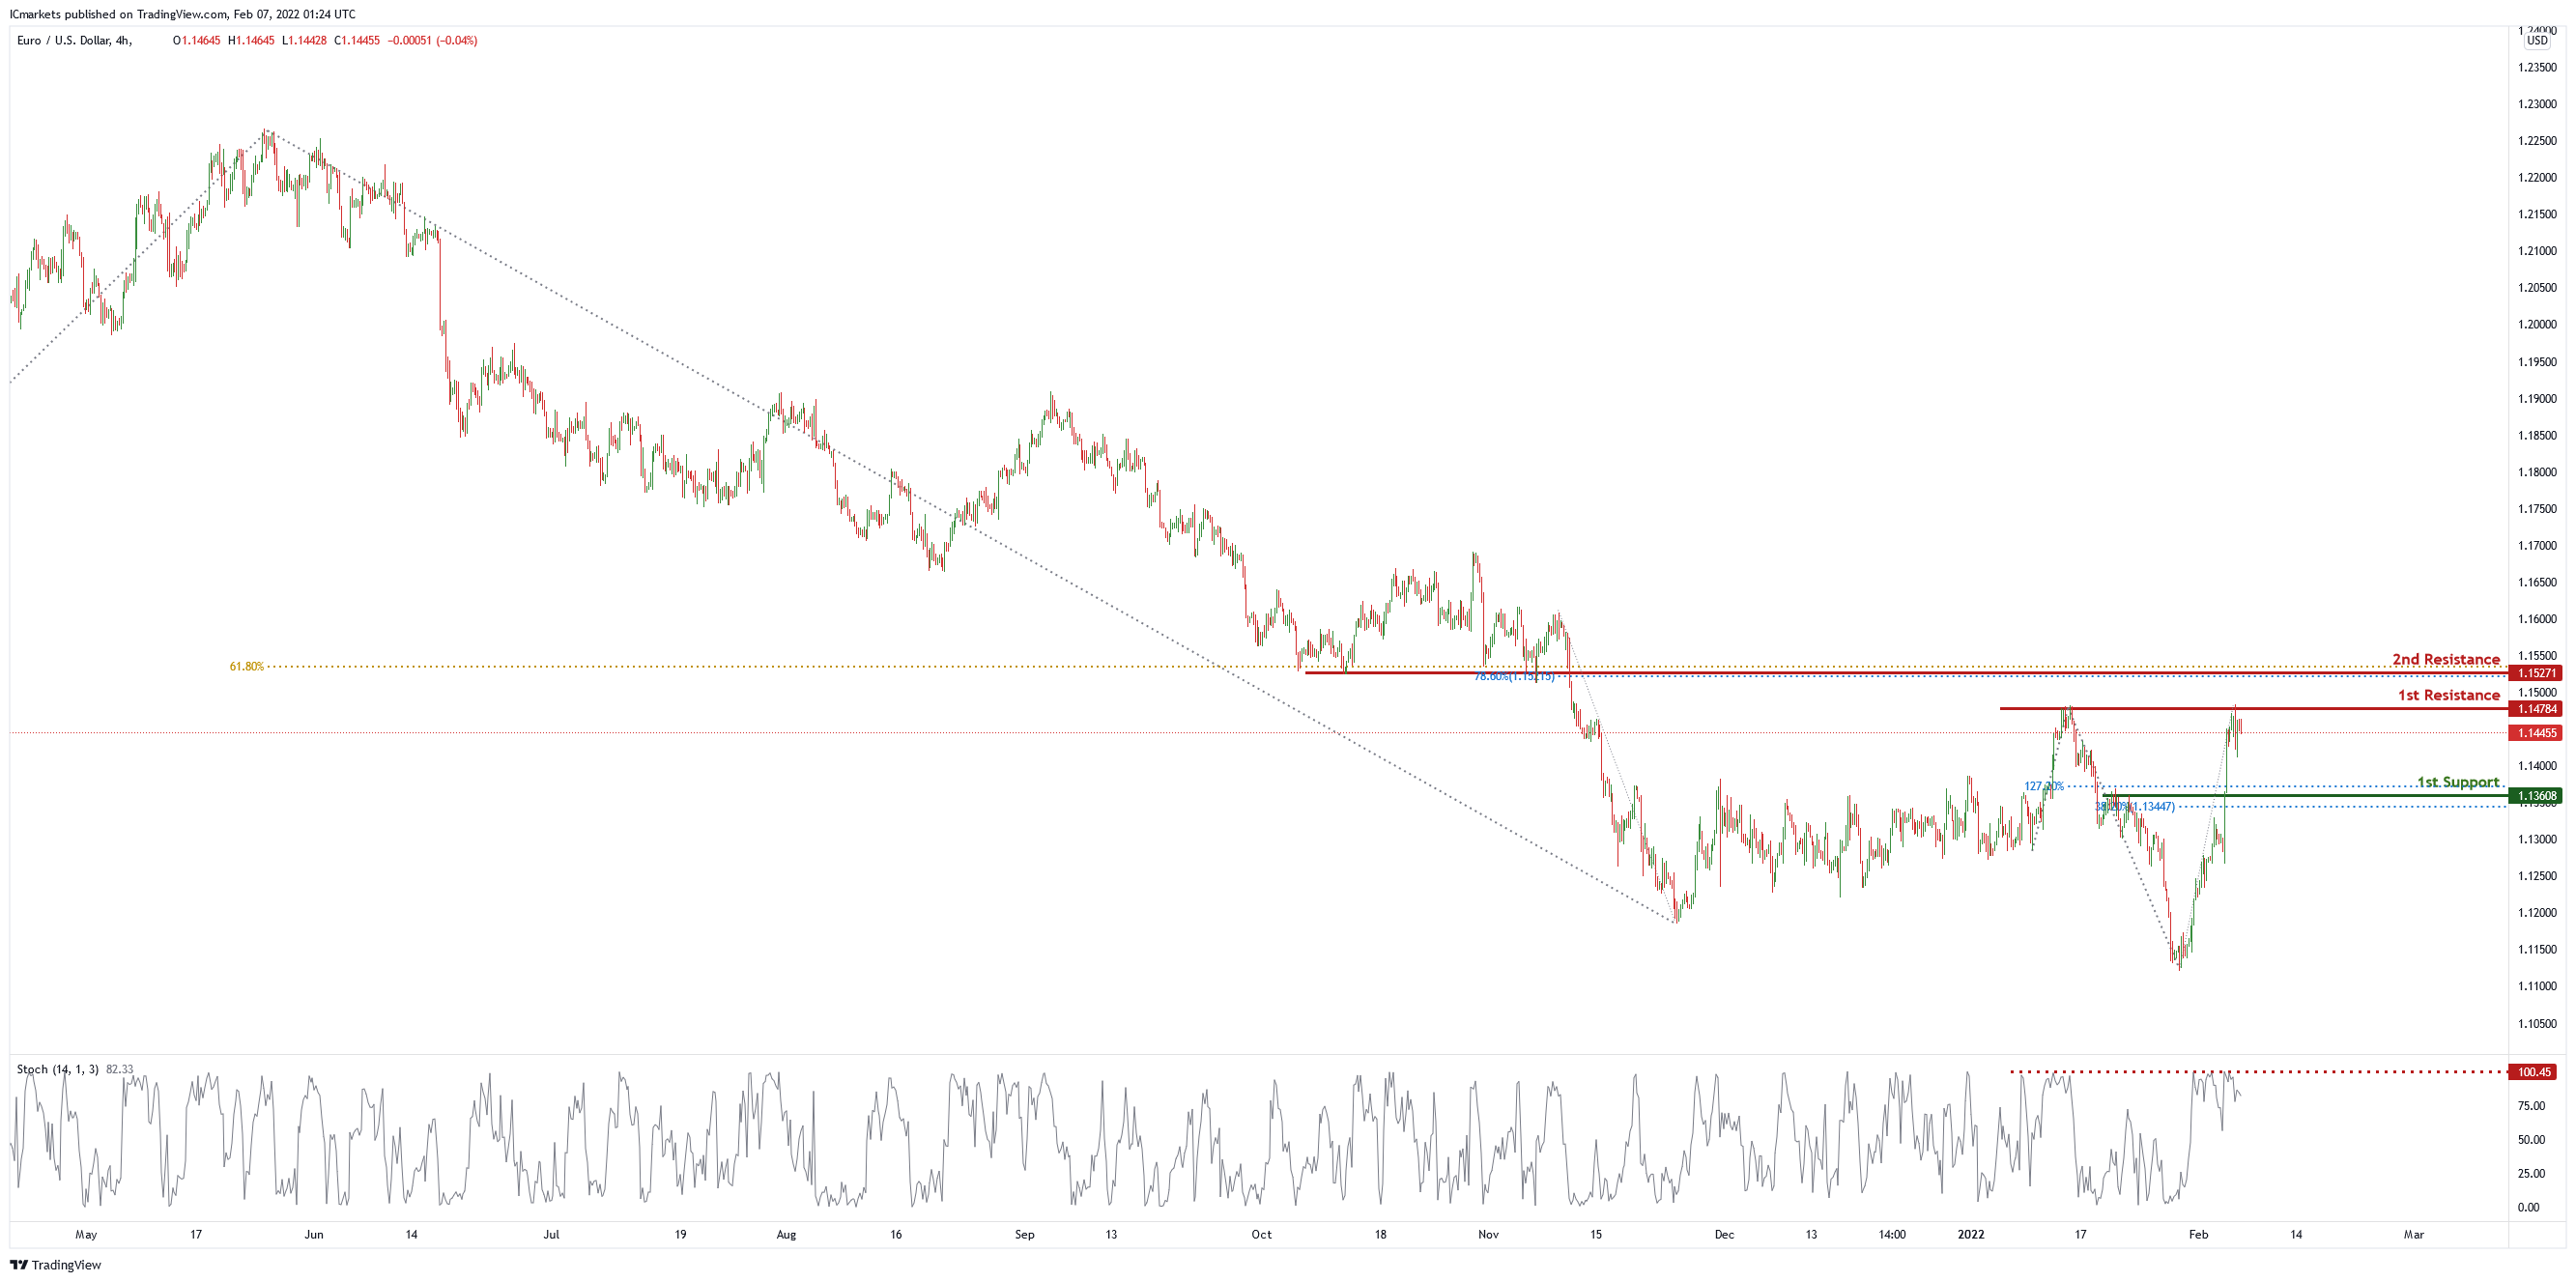
On the H4 chart , price is near the 1st resistance level of 1.14784 which is the graphical swing high. Price can potentially dip to the 1st support level of 1.13608 which is also 38.2% Fibonacci retracement and 127.2% Fibonacci projection. Our bearish bias is supported by the stochastic indicator as it is near resistance level,
Areas of consideration
- H4 1st support at 1.14784
- H4 1st resistance at 1.13608
USD/JPY:
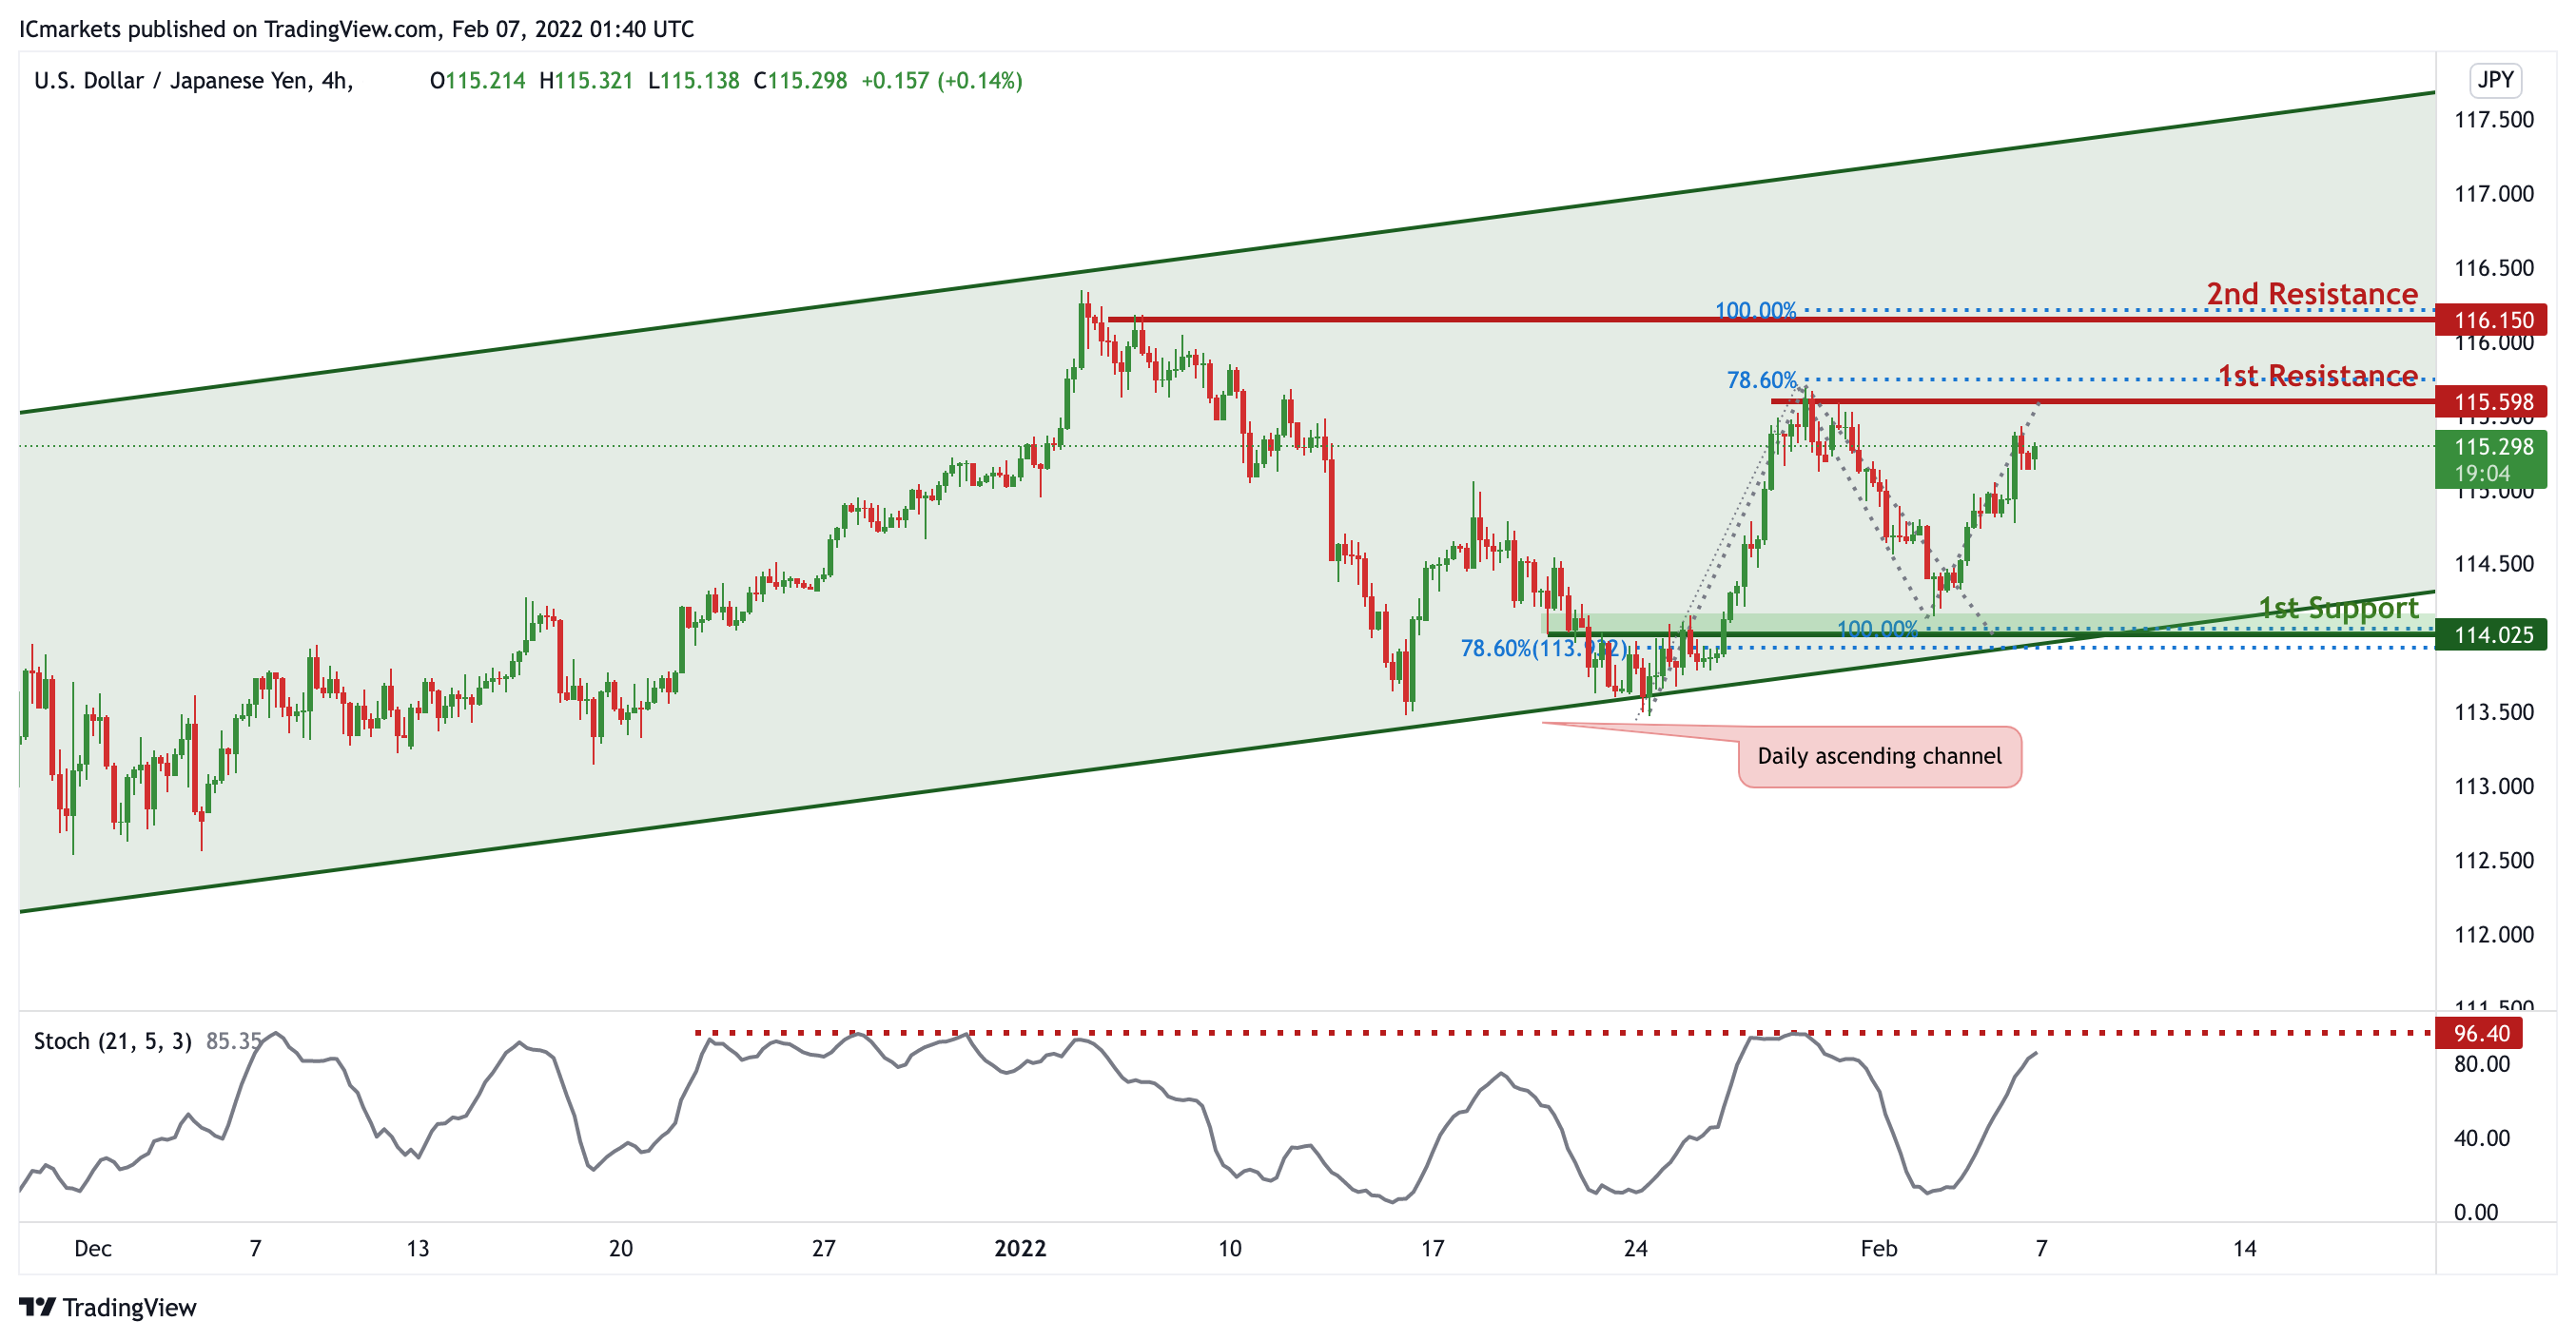
On the H4 chart,in reference to last week’s analysis, price indeed bounced at 1st Support and it is reaching our potential 1st Resistance level @ 115.598.
Price is trading in an ascending channel signifying an overall bullish momentum, however, we can expect a short-term bearish drop from 1st Resistance level in line with horizontal resistance and 78.6% Fibonacci projection towards 1st Support in line with previous swing low and 100% Fibonacci projection. Our bearish bias is further supported by the stochastic indicator where the %K line is at the resistance level.
Areas of consideration:
- H4 1st support at 114.025
- H4 1st resistance at 115.598
AUD/USD:
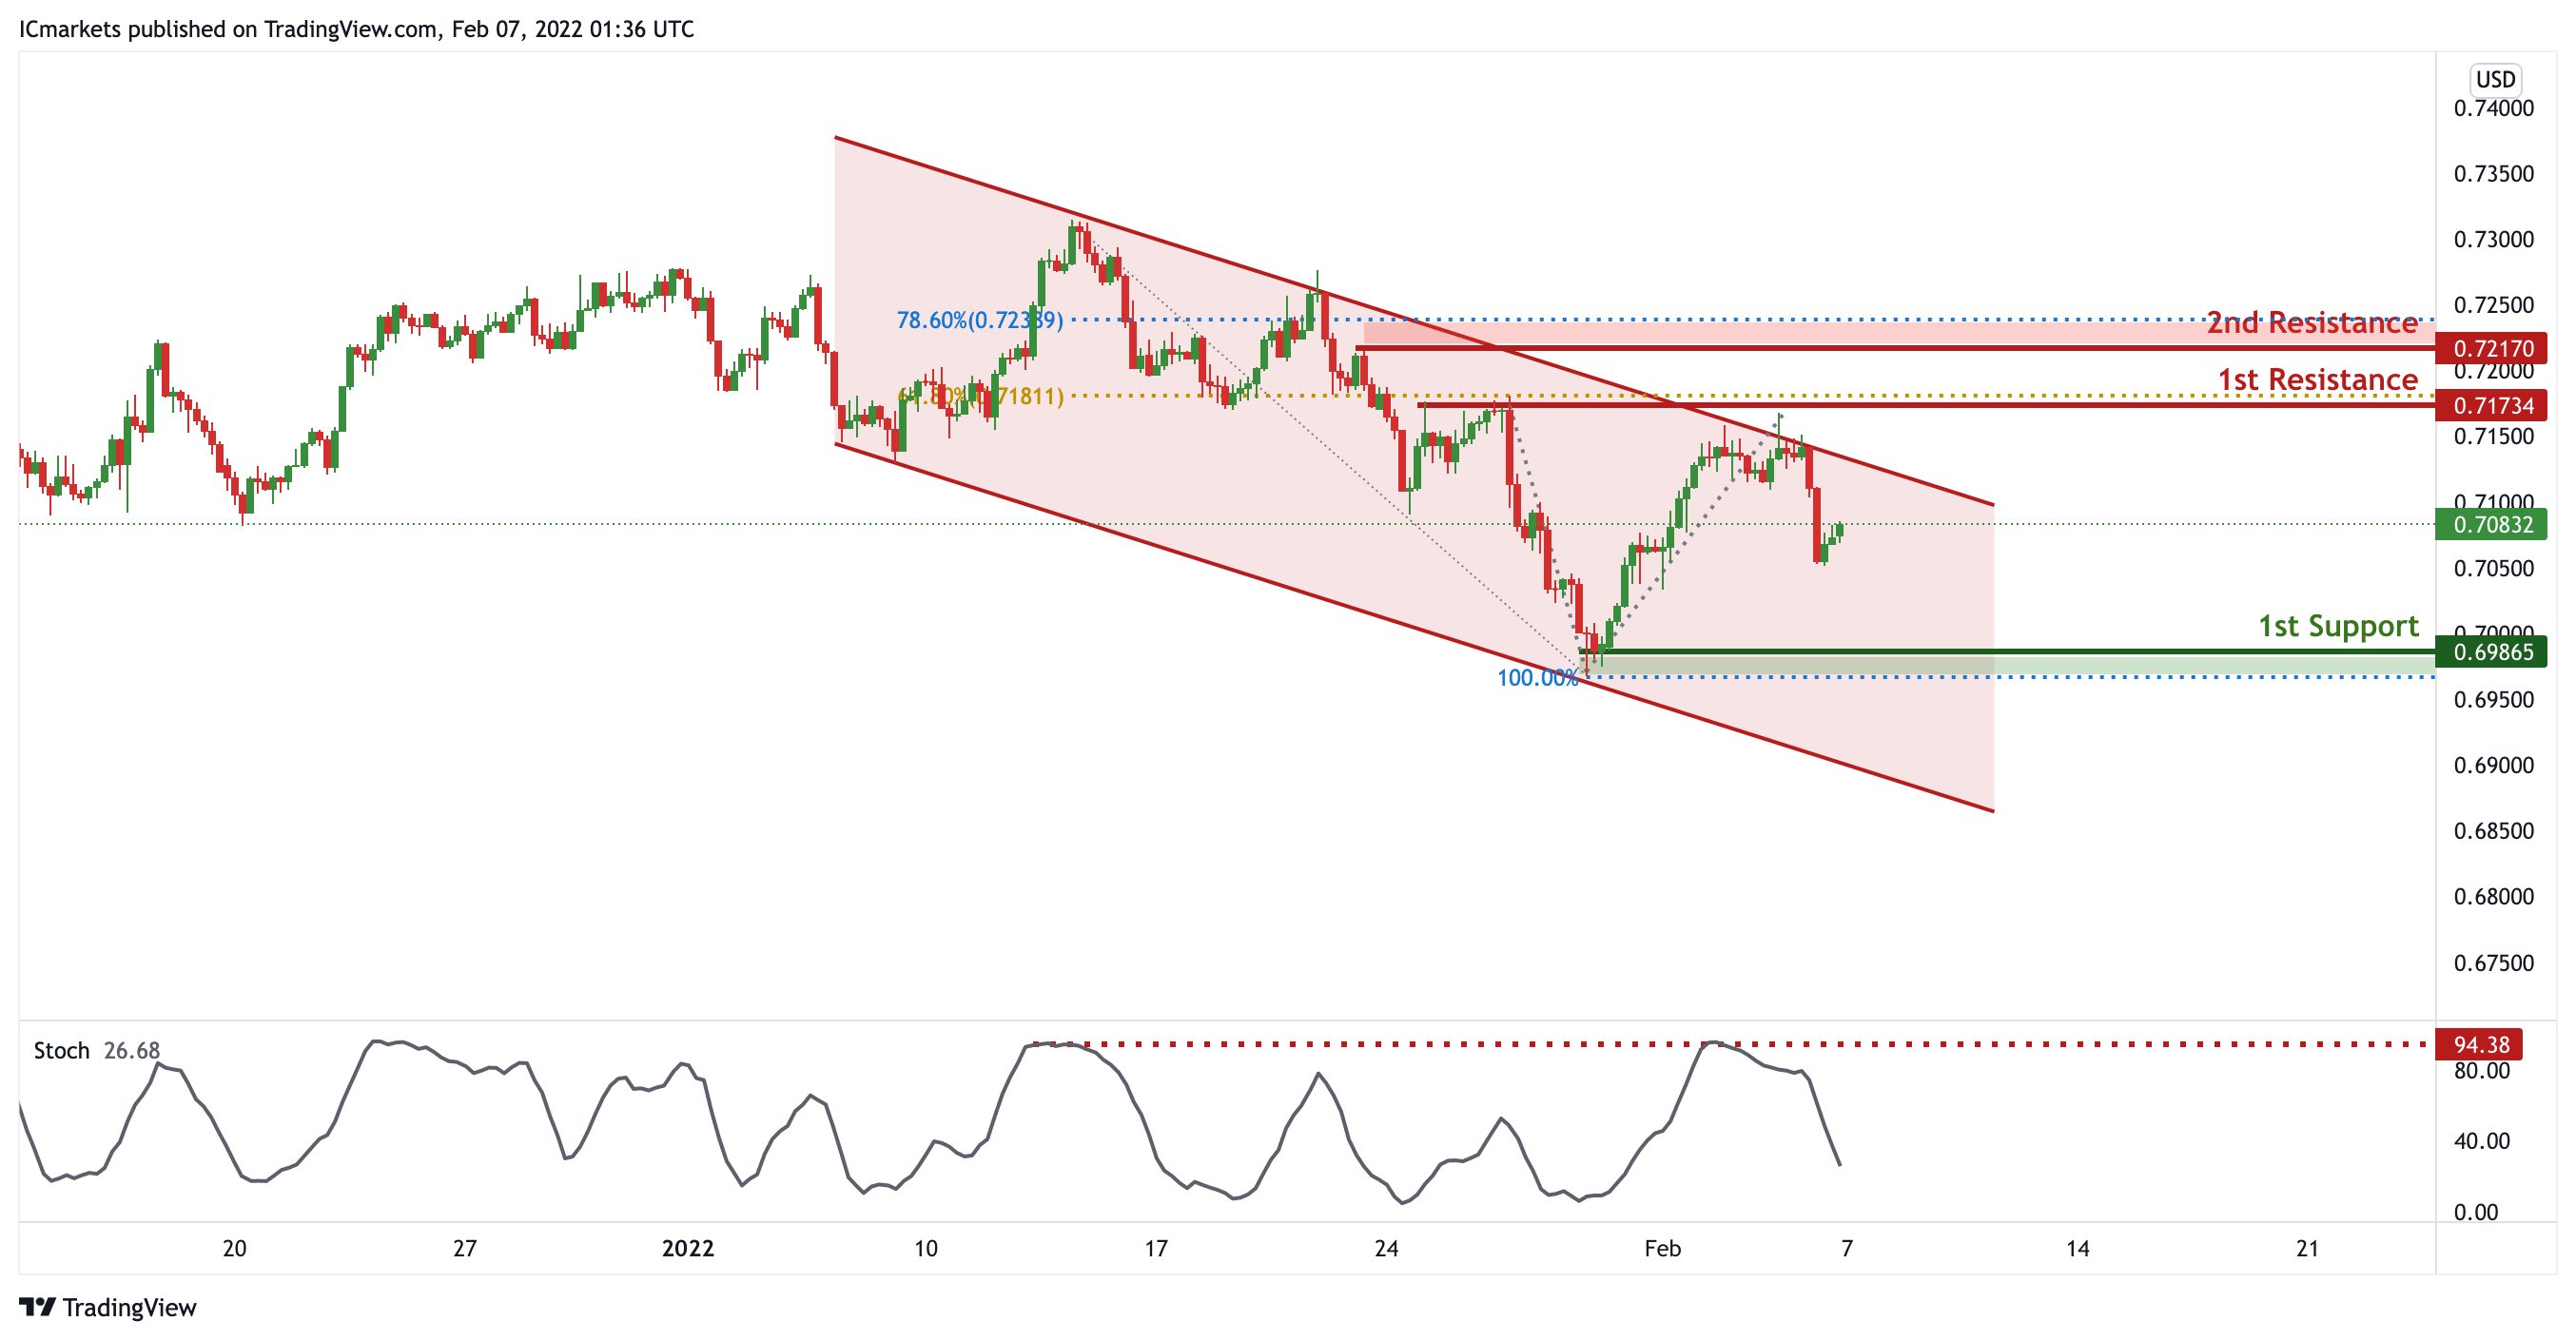
On the H4 timeframe, in reference to last week’s analysis, price indeed dropped from the resistance level. Price is abiding to the descending channel, signifying an overall bearish momentum. We can expect price to drop from 1st Resistance in line with 50% Fibonacci retracement towards 1st Support in line with previous swing low and 78.6% Fibonacci projection. Our bearish bias is further supported by the stochastic indicator where the %K line is at the resistance level. Traders should wait for prices to swing higher or lower before entering.
Areas of consideration:
- H4 1st Support level 0.69865
- H4 1st resistance level 0.71734
NZD/USD:
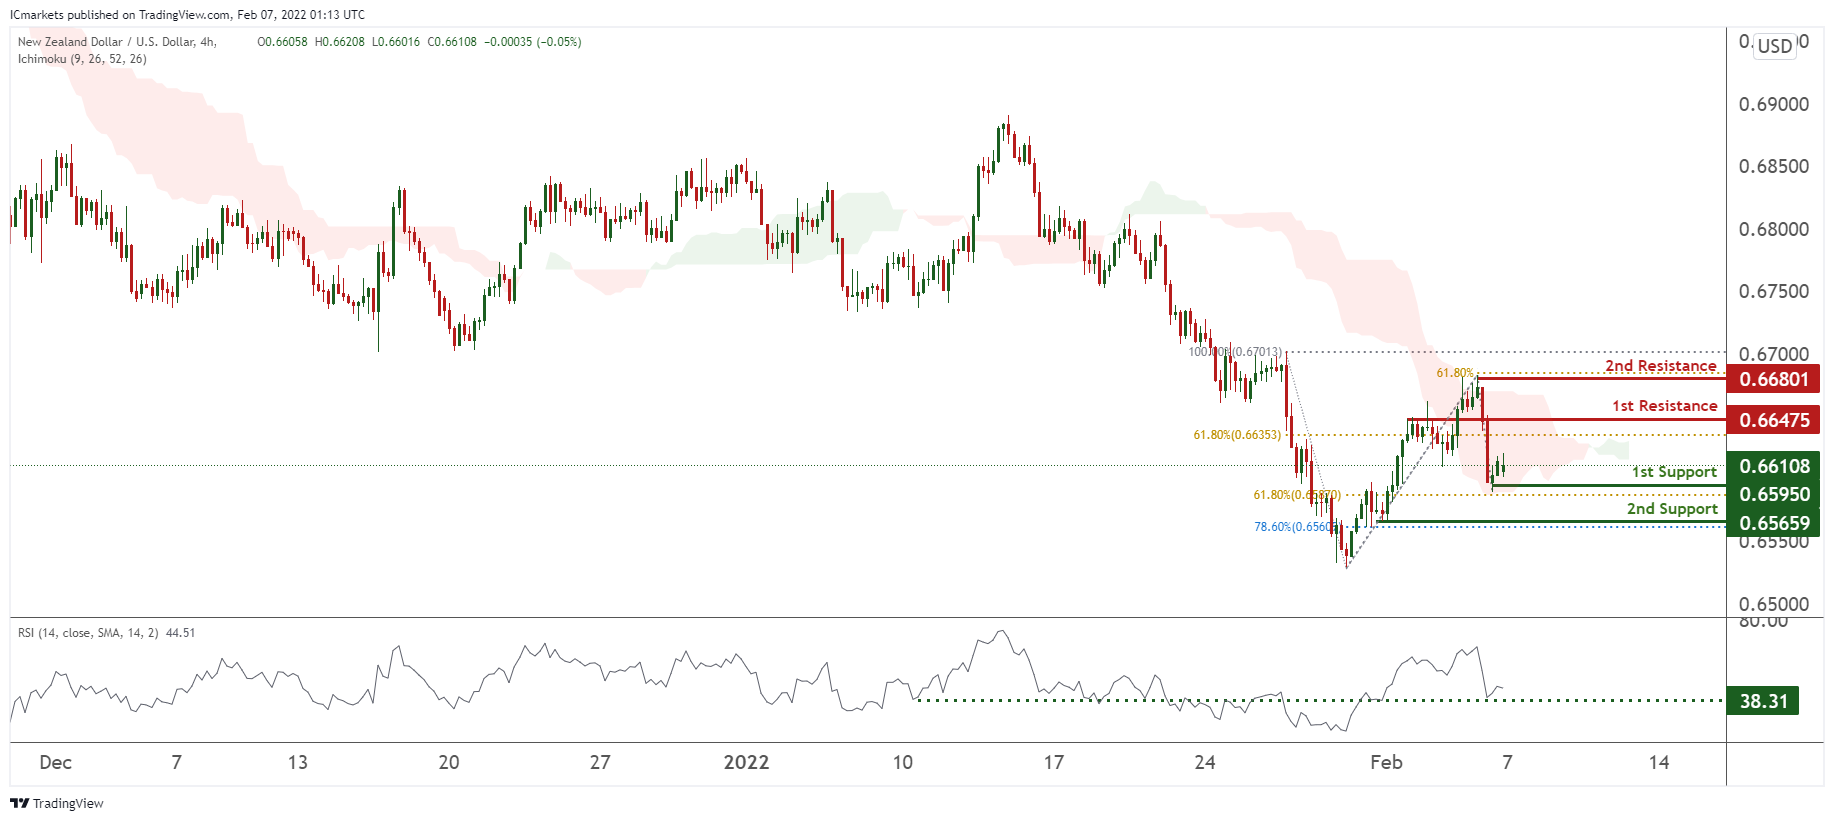
On the H4 timeframe, prices were on bearish momentum and have bounced off 1st support. We see potential for prices to bounce from our 1st support at 0.65950 in line with 61.8% Fibonacci retracement towards our 1st resistance at 0.66475 in line with 61.8% Fibonacci retracement. Our bias is further supported by the Ichimoku Clouds forecasting a bullishness and also RSI being at levels where bounces previously occurred. Alternatively, our stop loss will be placed at 2nd support at 0.65659 in line with 78.6% Fibonacci retracement.
Areas of consideration:
- H4 time frame, 1st resistance at 0.66475
- H4 time frame, 1st support at 0.65950
USD/CAD:
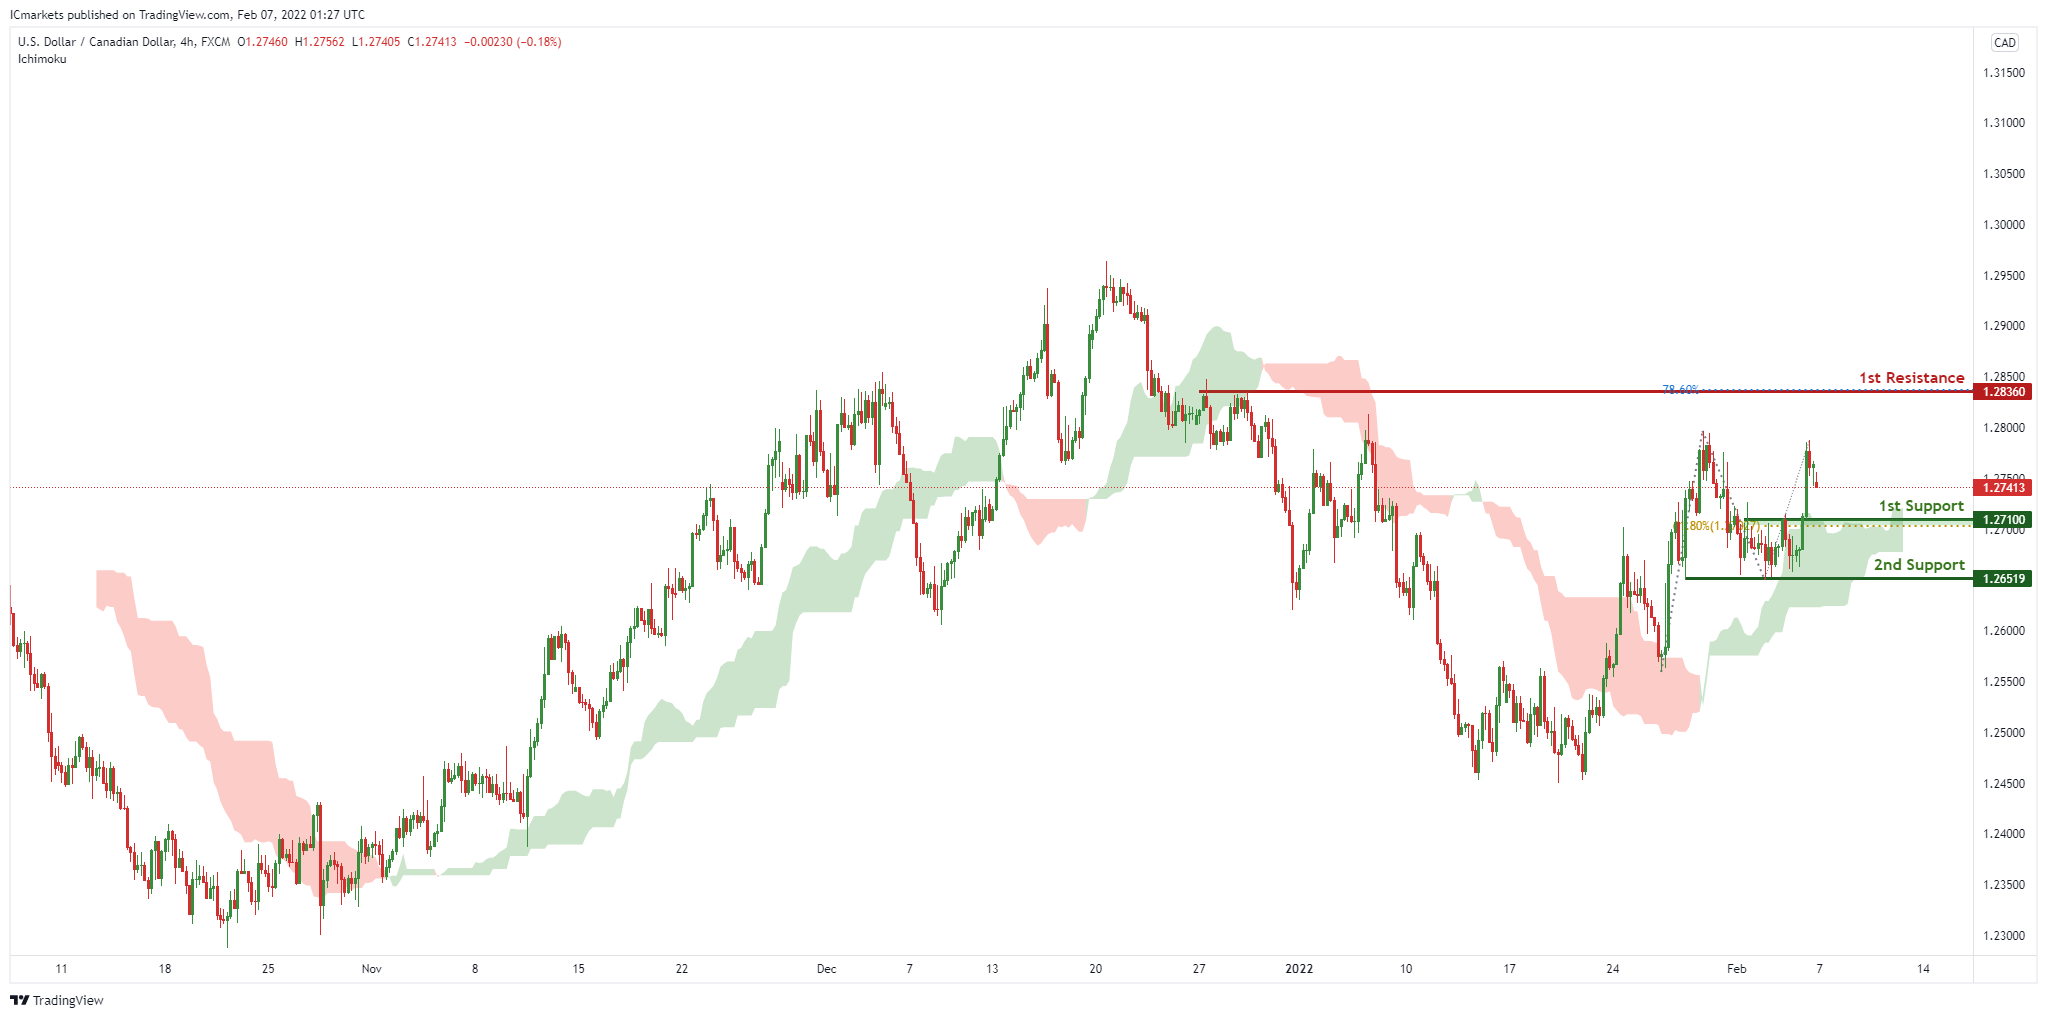
On the H4, with prices moving above the ichimoku cloud, we see the potential for a bounce from our 1st support at 1.27100 in line with horizontal overlap support and 61.8% Fibonacci retracement towards our 1st resistance at 1.28360 in line with horizontal swing high resistance and 78.6% Fibonacci retracement. Alternatively, price may break 1st support structure and head for 2nd support at 1.26519, in line with the horizontal swing low support.
Areas of consideration:
- H4 time frame, 1st support at 1.27100
- H4 time frame, 1st resistance at 1.28360
OIL:
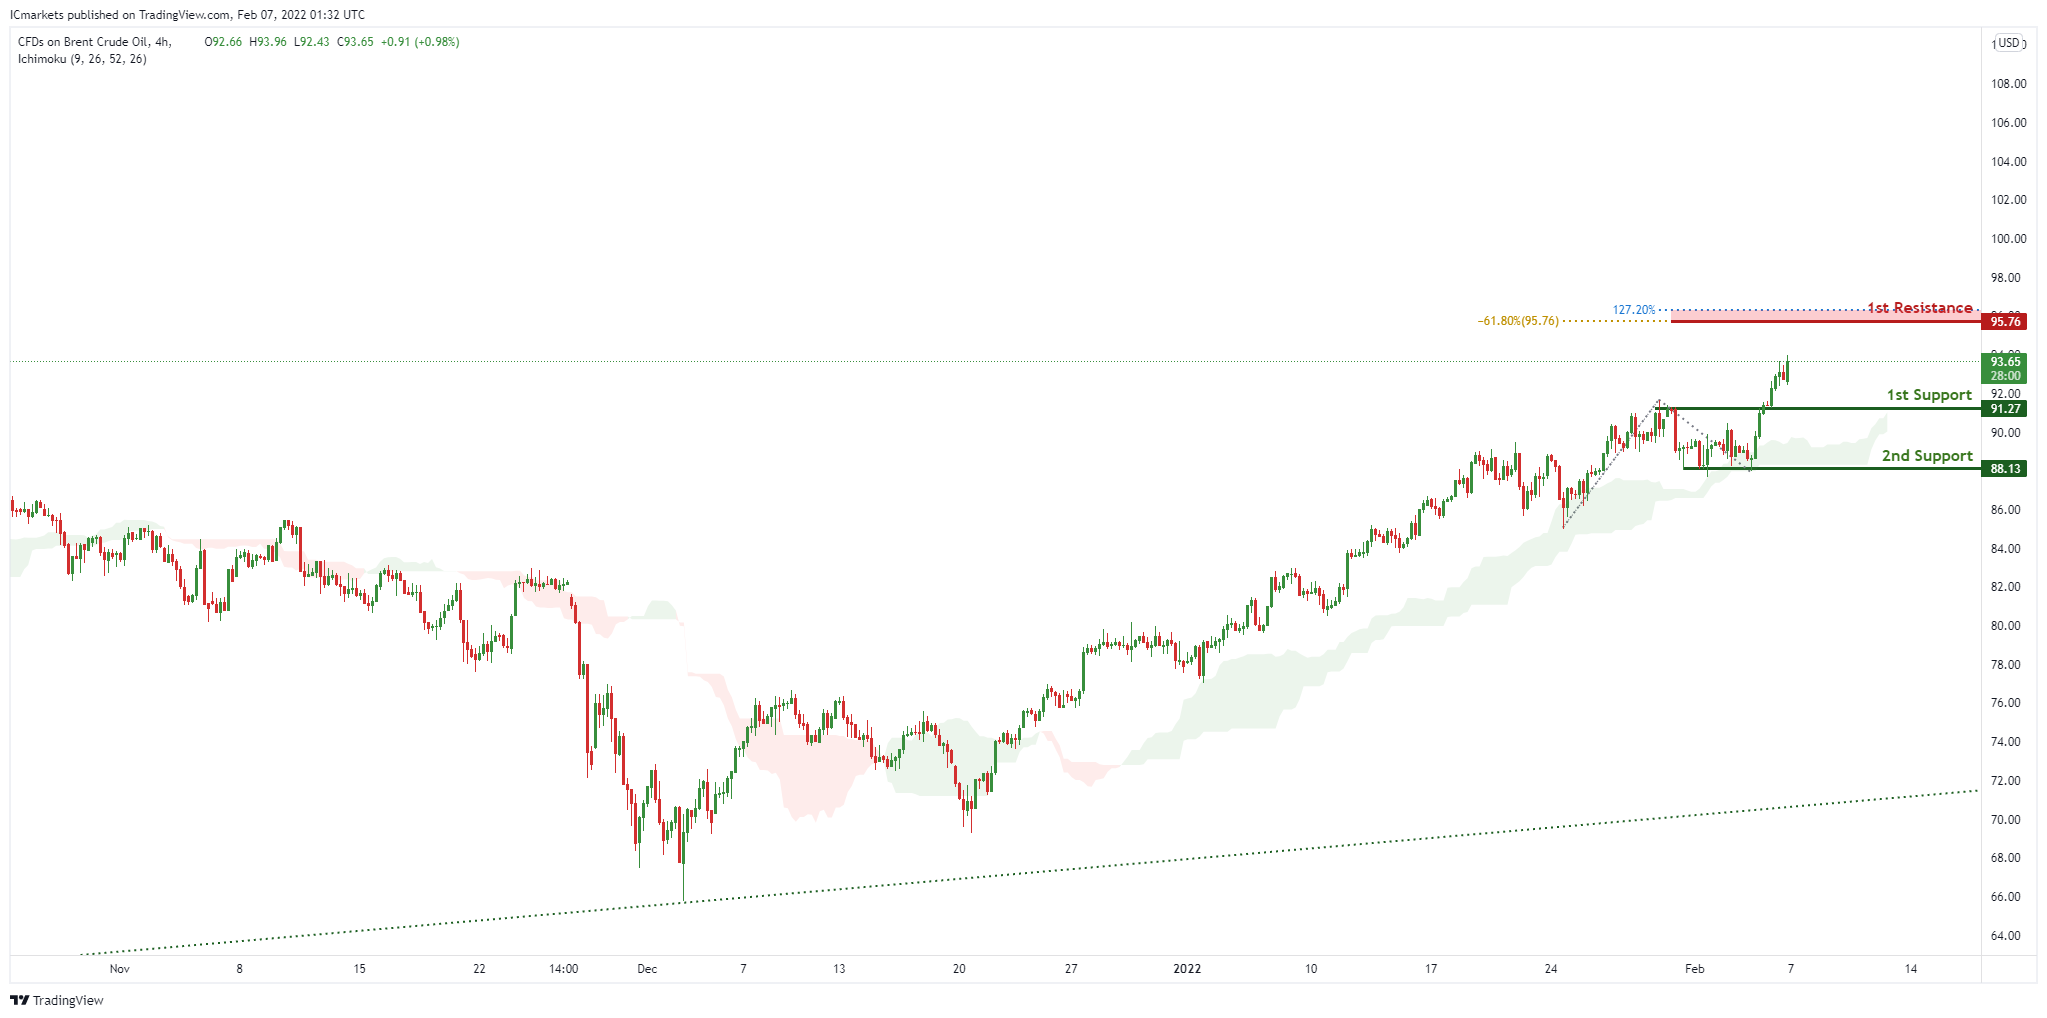
On the H4, with prices moving above the ichimoku cloud, we see the potential for a bounce from our 1st support at 91.27 in line with horizontal overlap support towards our 1st resistance at 95.76 in line with the 127.2% Fibonacci extension and -61.8% Fibonacci expansion. Alternatively, price may break 1st support structure and head for 2nd support at 88.13, in line with the horizontal swing low support.
Areas of consideration:
- H4 time frame, 1st resistance of 95.76
- H4 time frame, 1st support of 91.27
Dow Jones Industrial Average:
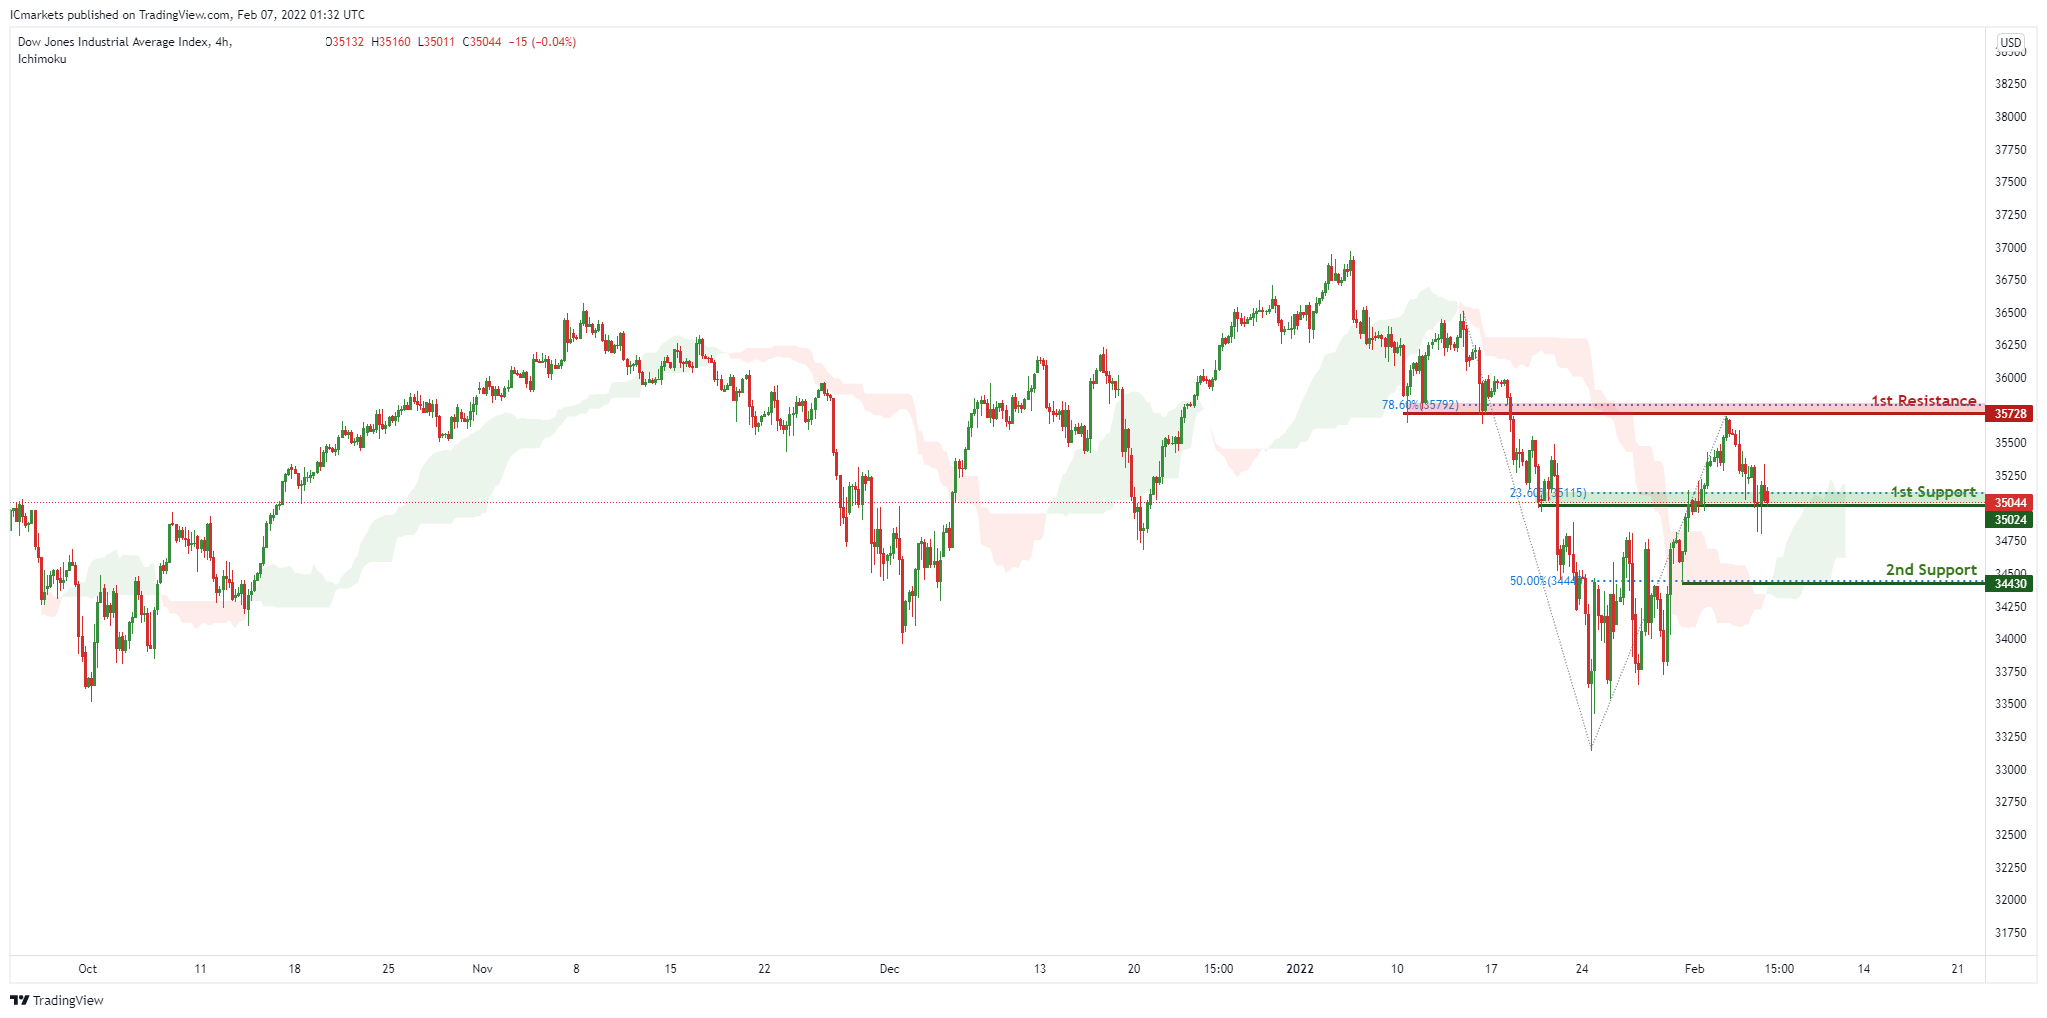
On the H4, with price moving above the ichimoku cloud, signifying an overall bullish momentum. We can expect price to rise to our 1st resistance at 35728 in line horizontal graphical swing high resistance and 78.6% Fibonacci retracement from our 1st support in line with horizontal overlap support and 23.6% Fibonacci retracement level at 35024. Alternatively, price may break 1st support structure and head for 2nd support, which coincides with 50% Fibonacci retracement level at 34430.
Areas of consideration:
- H4 time frame, 1st resistance of 35728
- H4 time frame, 1st support of 35024
EUR/USD Daily Outlook
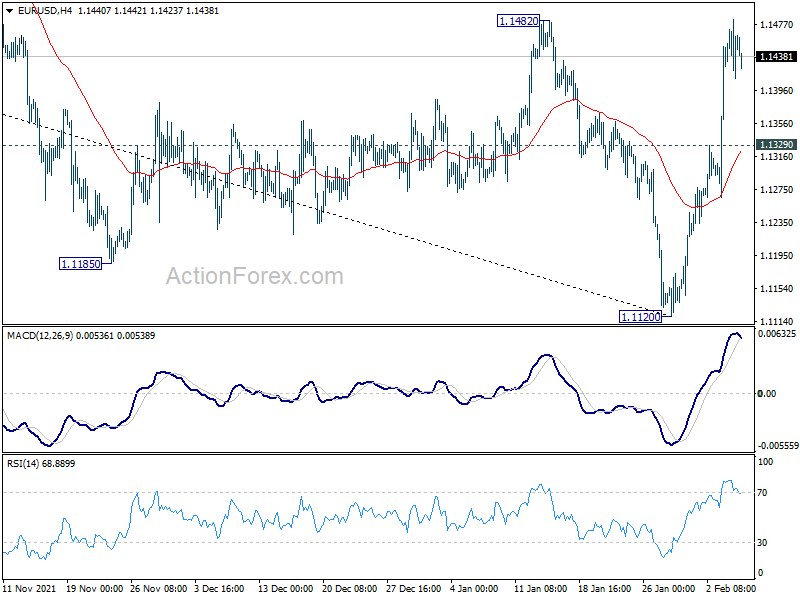
Daily Pivots: (S1) 1.1415; (P) 1.1449; (R1) 1.1486; More...
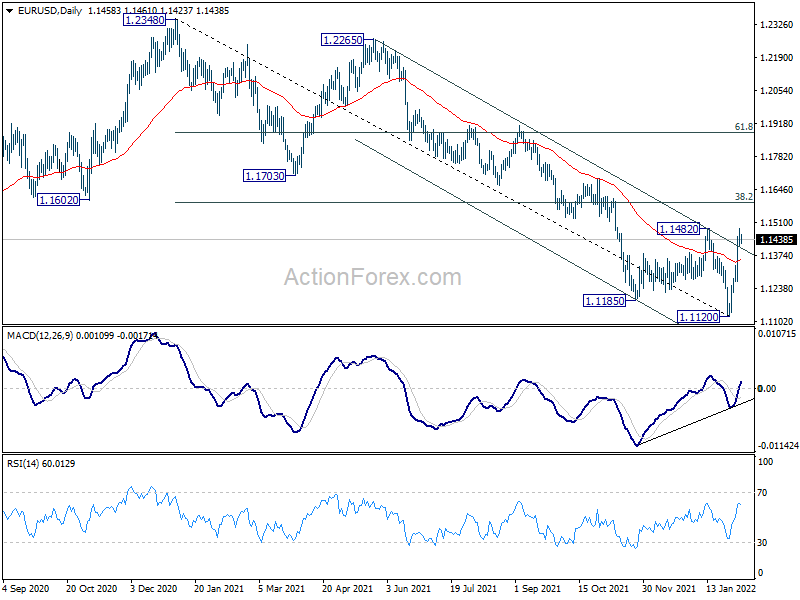
Intraday bias in EUR/USD remains on the upside at this point. A medium term bottom could be in place at 1.1120, on bullish convergence condition in daily MACD. Break of 1.1482 resistance will target 38.2% retracement of 1.2348 to 1.1120 at 1.1589 next. Sustained break there will argue that whole fall from 1.2348 has completed too and target 61.8% retracement at 1.1879. On the downside, break of 1.1329 minor support will mix up the outlook and turn intraday bias neutral first.
In the bigger picture, the decline from 1.2348 (2021 high) is seen as a leg inside the range pattern from 1.2555 (2018 high). Sustained trading above 55 week EMA (now at 1.1613) will argue that it has completed and stronger rise would be seen back towards top of the range between 1.2348 and 1.2555. However, firm break of 1.0635 (2020 low) will raise the chance of long term down trend resumption and target a retest on 1.0339 (2017 low) next.
GBP/USD Daily Outlook
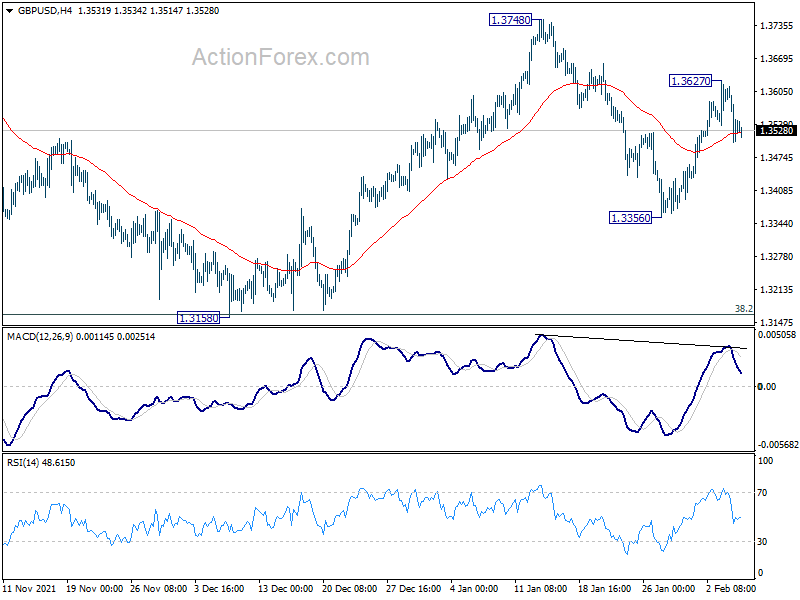
Daily Pivots: (S1) 1.3484; (P) 1.3549; (R1) 1.3594; More...
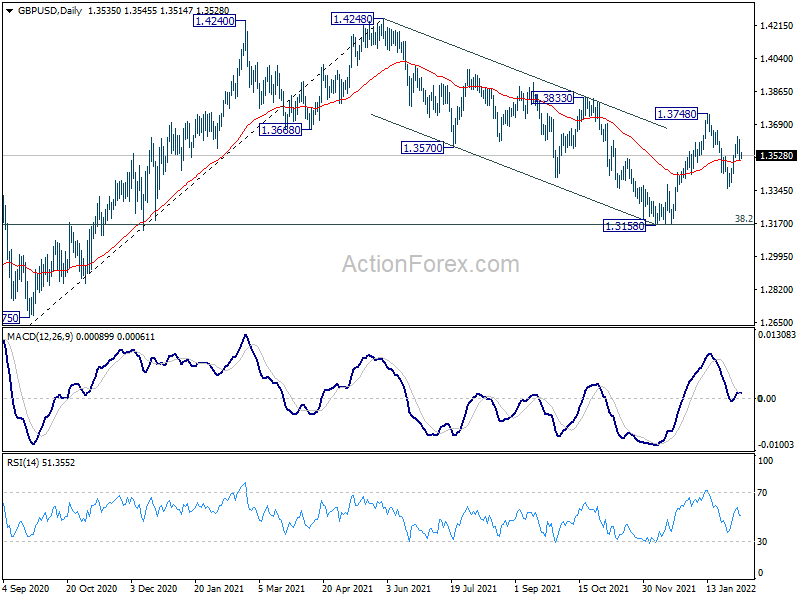
Intraday bias in GBP/USD remains neutral at this point. On the upside, break of 1.3627 will resume the rebound to 1.3748 resistance. Firm break there will revive the bullish case that correction from 1.4248 has completed with three waves down to 1.3158. Further rally should then be seen to retest 1.4248 high. On the downside, however, break of 1.3356 will bring retest of 1.3158 low.
In the bigger picture, as long as 38.2% retracement of 1.1409 to 1.4248 at 1.3164 holds, up trend from 1.1409 (2020 low) is still in progress. On resumption, next target will be 38.2% retracement of 2.1161 to 1.1409 at 1.5134. Nevertheless sustained break of 1.3164 will argue that whole rise from 1.1409 has completed and bring deeper fall to 61.8% retracement at 1.2493.
USD/CHF Daily Outlook
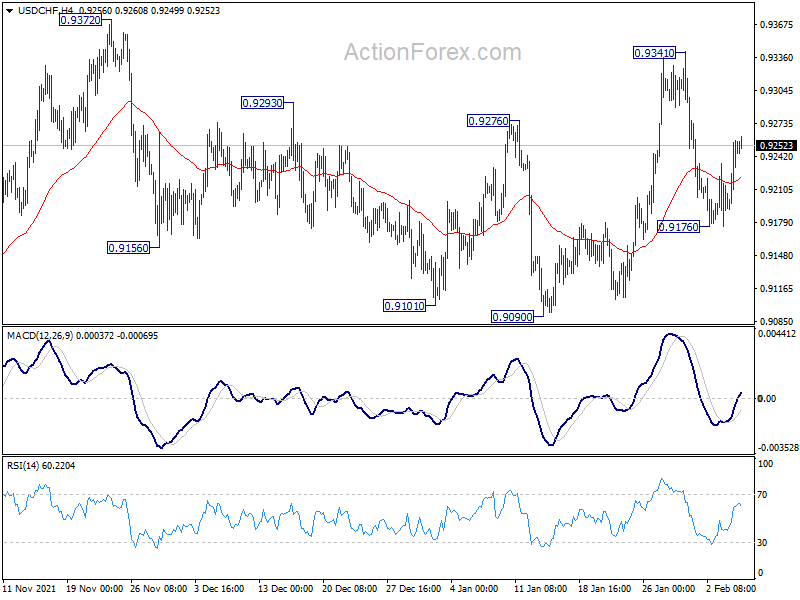
Daily Pivots: (S1) 0.9213; (P) 0.9236; (R1) 0.9279; More....
Intraday bias in USD/CHF remains neutral first. Further rise will remain mildly in favor as long as 0.9090 support holds. break of 0.9372 will resume the choppy rally from 0.8925 to 0.9471 high. However, break of 0.9090 will turn bias back to the downside for 0.8925 support instead.
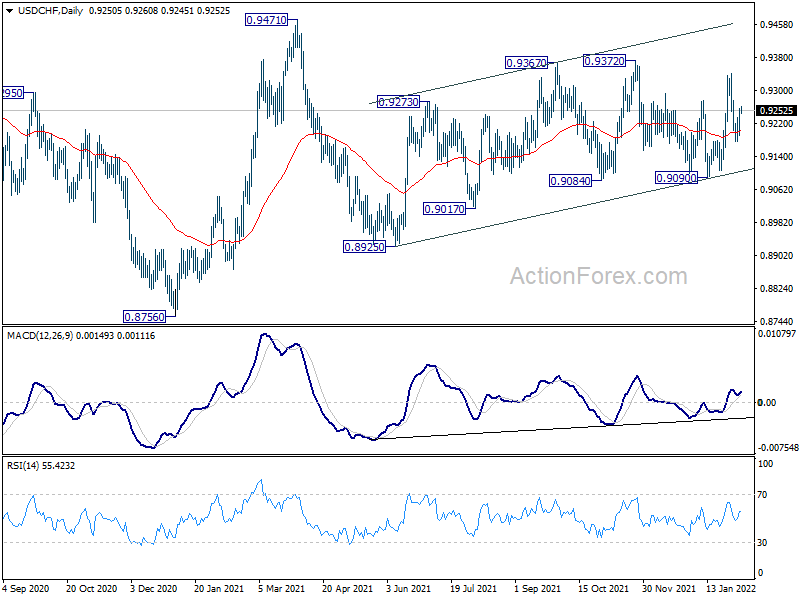
In the bigger picture, medium term outlook will be neutral at best as long as 0.9471 resistance holds. Larger down trend could still extend through 0.8756 (2021 low). However, firm break of 0.9471 will argue that the trend has already reversed and rebound the rally from 0.8756 with another impulsive move.
USD/JPY Daily Outlook
Daily Pivots: (S1) 114.84; (P) 115.13; (R1) 115.49; More...
Intraday bias in USD/JPY remains neutral for the moment. Consolidation from 116.34 is still extending. On the upside, break of 115.68 will resume the rebound from 113.46 to retest 116.34 high first. On the downside, break of 114.14 should extend the consolidation with another falling leg through 113.46 support.

In the bigger picture, no change in the view that rise from 102.58 is the third leg of the up trend from 101.18 (2020 low). Such rally should target a test on 118.65 (2016 high). Sustained break there will pave the way to 120.85 (2015 high) and raise the chance of long term up trend resumption. This will remain the favored case as long as 55 week EMA (now at 111.21) holds.
