Sample Category Title
USD/JPY Daily Outlook
Daily Pivots: (S1) 113.49; (P) 113.82; (R1) 114.04; More...
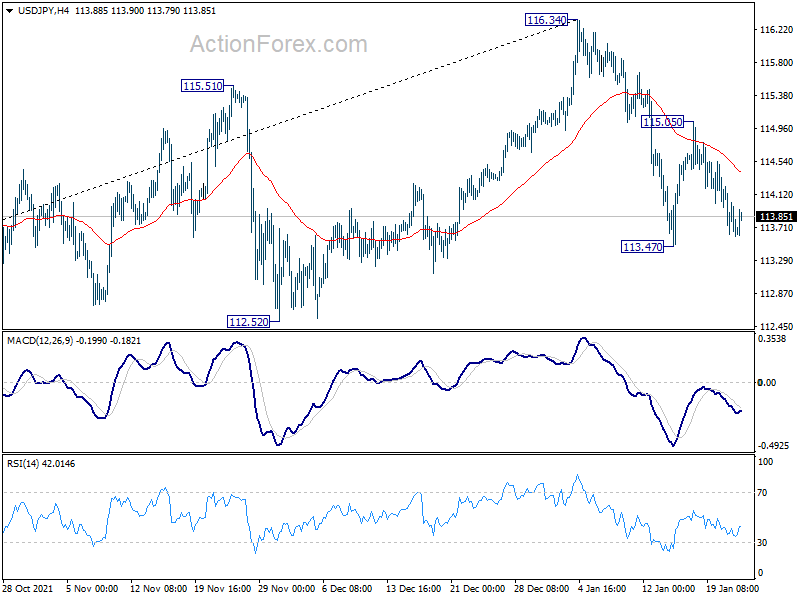
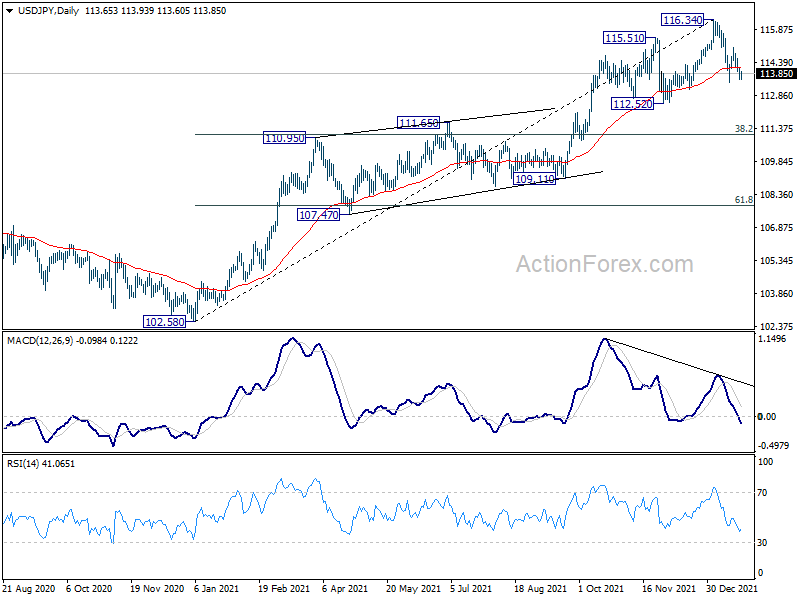
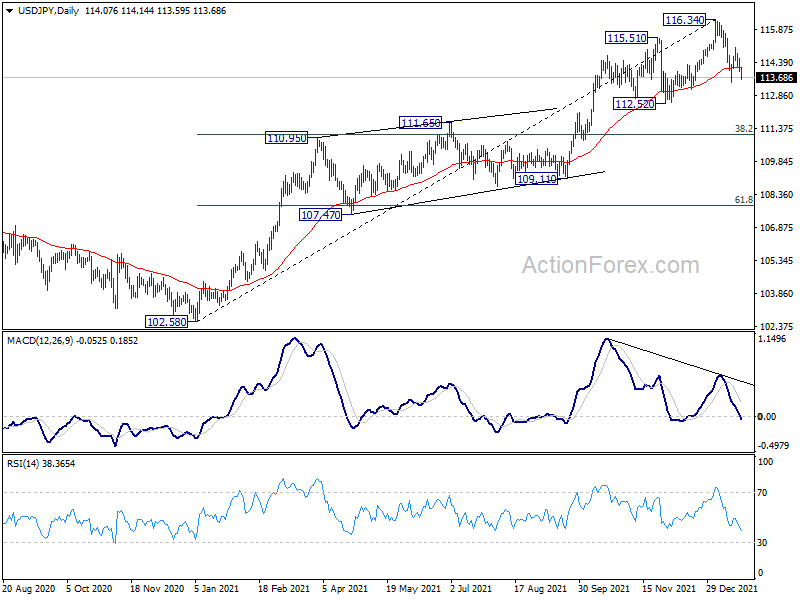
Intraday bias in USD/JPY remains mildly on the downside at this point. Considering bearish divergence condition in in daily MACD, it's probably already in correction to whole up trend from 102.58. Break of 113.47 will target 112.52 support first, and then 38.2% retracement of 102.58 to 116.34 at 111.08. For now, risk will stay on the downside as long as 115.05 resistance holds, in case of recovery.
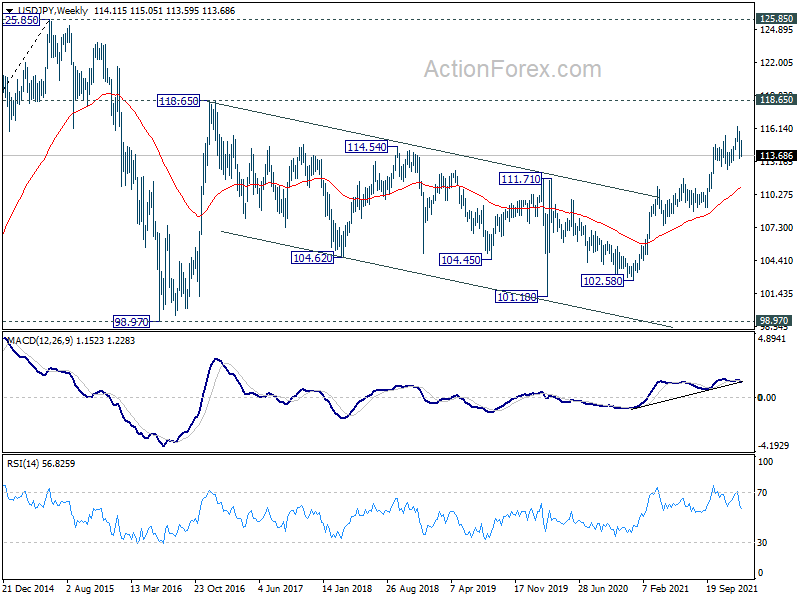
In the bigger picture, no change in the view that rise from 102.58 is the third leg of the up trend from 101.18 (2020 low). Such rally should target a test on 118.65 (2016 high). Sustained break there will pave the way to 120.85 (2015 high) and raise the chance of long term up trend resumption. This will remain the favored case as long as 55 week EMA (now at 110.91) holds.
Dollar Mixed Awaiting Fed Guidance, Markets Steady in Asia
The forex markets are pretty steady in Asian session even though others trade with a slight risk-off tone. Major pairs and crosses are stuck inside Friday's range for now. But volatility is guaranteed ahead, with Fed and BoC featured, as well as a large batch of important economic data. As for today, main focuses will be on PMIs from Eurozone and UK, indicating the states activities and inflation.
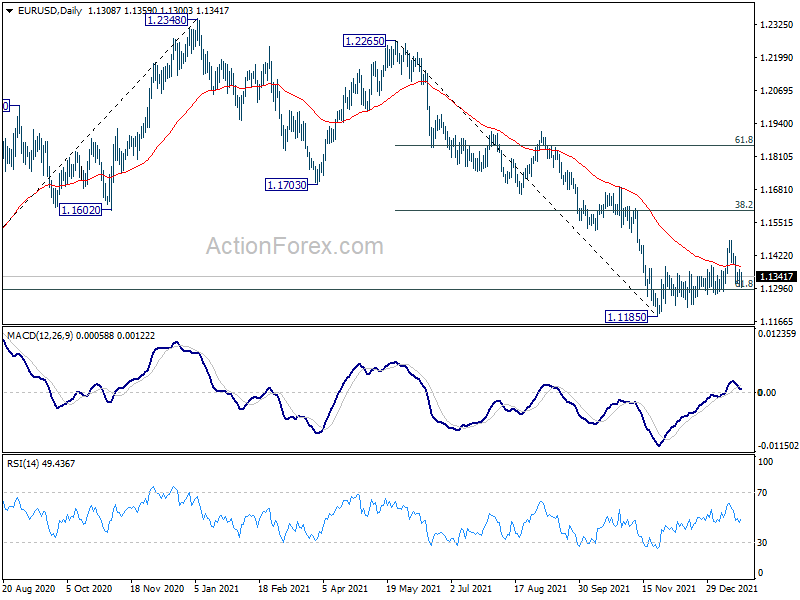
Technically, Dollar is rather mixed for now. EUR/USD didn't break through 1.1284 support to indicate completion of rebound from 1.1185. USD/JPY is holding above 113.47 temporary low, without resuming the fall from 116.34. USD/CHF is also holding above 0.9090 support, without resuming the fall from 0.9372. These pairs could probably need more guidance from Fed.
In Asia, at the time of writing, Nikkei is down -0.55%. Hong Kong HSI is down -1.07%. China Shanghai SSE is up 0.07%. Singapore Strait Times is down -0.16%. Japan 10-year JGB yield is up 0.0002 at 0.137.
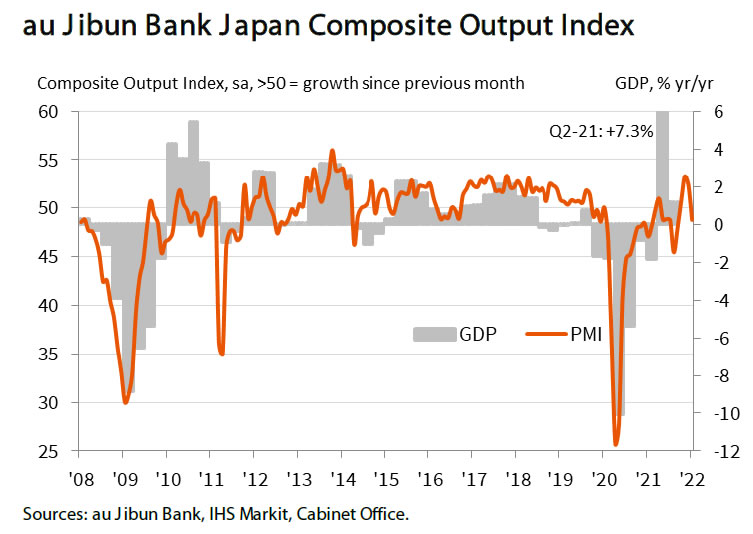
Japan PMI manufacturing ticked up to 54.6, services tumbled to 46.6
Japan PMI Manufacturing ticked up from 54.3 to 54.6 in January, below expectation of 55.0. PMI Services dropped sharply from 52.1 to 46.6. PMI Composite also dropped from 52.5 to 48.8.
Usamah Bhatti, Economist at IHS Markit, said: "Flash PMI data indicated that activity at Japanese private sector businesses dipped into contraction territory for the first time in four months at the start of 2022. The pace of decline was modest, and led by the sharpest fall in services activity since August, while manufacturers commented on a slight quickening in output growth."
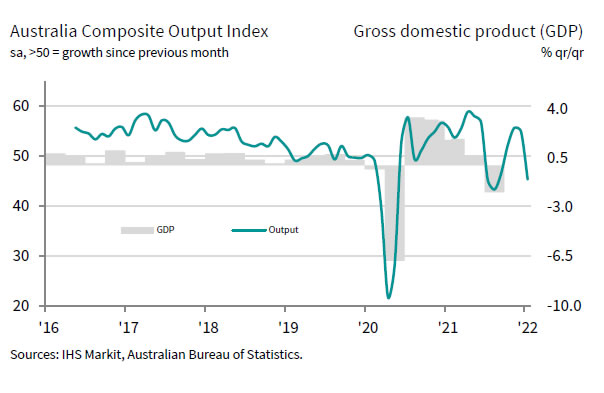
Australia PMI composite dropped to 45.3, slipped from strong recovery to contraction
Australia PMI Manufacturing dropped from 57.7 to 55.3 in January. PMI Services tumbled sharply from 55.1 to 45.0. PMI Composite also dropped from 54.9 to 45.3, first contraction follow three months of growth. All are at their 5-month low.
Jingyi Pan, Economics Associate Director at IHS Markit, said: "The Australian economy had slipped from a state of strong recovery in end-2021 to being affected by the surge in COVID-19 infections at the start of 2022... Supply issues meanwhile remained prevalent... This had led to input price inflation worsening Employment levels were unchanged."
ECB Rehn: Economic data to remain good despite Omicron
ECB Governing Council member Olli Rehn said over the weekend, "personally, I expect the economic data to remain relatively good despite being affected by the Omicron variant." He added that rate hikes in 2023 would be a logical step if there are no new economic shocks.
He added upward pressure on inflation will subside over the course of the year. Inflation is expected to hover around ECB's target of 2% in the next two years.
FOMC and BoC might set the stages for rate hikes
FOMC and BoC meetings are two major focuses this week. No policy change is expected for Fed yet, and there will not be new economic projections. The main focus is on whether, or how, Fed would make use of the statement and Chair Jerome Powell's press conference to lay down the ground work for rate hike in March.
BoC had indicated in December that interest rate will stay at effective lower bound until economic slack is absorbed, "sometime in the middle quarters of 2022". Hence, there is no policy change expected. The focus is on whether BoC would adjust the forward guidance to indicate that rate hike has become more imminent.
The economic calendar is also ultra-busy. Special focuses will be GDP data from US and Eurozone. On activities, a wave of PMI data will be released from Australia, Japan, Eurozone, UK and US. On sentiment, Germany Ifo will catch most attention. On inflation, Australia and New Zealand will release CPI while US will release PCE price indexes.
Here are some highlights for the week:
- Monday: Australia PMIs; Japan PMI Manufacturing; Eurozone PMIs; UK PMIs; US PMIs.
- Tuesday: Australia CPI, NAB business confidence; UK public sector net borrowing, CBI industrial order expectations; Germany Ifo business climate; US house price index, consumer confidence.
- Wednesday: New Zealand trade balance; Japan corporate service prices, BoJ summary of opinions; Swiss Credit Suisse economic expectations; US trade balance, wholesale inventories, new home sales, FOMC rate decision; BoC rate decision.
- Thursday: New Zealand CPI, Australia import prices; Swiss trade balance; Germany Gfk consumer climate; UK CBI realized sales; US GDP, durable goods orders, jobless claims, pending home sales.
- Friday: Japan Tokyo CPI; Australia PPI; France GDP, consumer spending; Germany import prices, GDP; Swiss KOF economic barometer; US personal income and spending, PCE inflation, employment cost index.
USD/JPY Daily Outlook
Daily Pivots: (S1) 113.49; (P) 113.82; (R1) 114.04; More...
Intraday bias in USD/JPY remains mildly on the downside at this point. Considering bearish divergence condition in in daily MACD, it's probably already in correction to whole up trend from 102.58. Break of 113.47 will target 112.52 support first, and then 38.2% retracement of 102.58 to 116.34 at 111.08. For now, risk will stay on the downside as long as 115.05 resistance holds, in case of recovery.
In the bigger picture, no change in the view that rise from 102.58 is the third leg of the up trend from 101.18 (2020 low). Such rally should target a test on 118.65 (2016 high). Sustained break there will pave the way to 120.85 (2015 high) and raise the chance of long term up trend resumption. This will remain the favored case as long as 55 week EMA (now at 110.91) holds.
Economic Indicators Update
| GMT | Ccy | Events | Actual | Forecast | Previous | Revised |
|---|---|---|---|---|---|---|
| 22:00 | AUD | Manufacturing PMI Jan P | 55.3 | 57.7 | ||
| 22:00 | AUD | Services PMI Jan P | 45.0 | 55.1 | ||
| 00:30 | JPY | Manufacturing PMI Jan P | 54.6 | 55 | 54.3 | |
| 08:15 | EUR | France Manufacturing PMI Jan P | 55.5 | 55.6 | ||
| 08:15 | EUR | France Services PMI Jan P | 55.3 | 57 | ||
| 08:30 | EUR | Germany Manufacturing PMI Jan P | 57 | 57.4 | ||
| 08:30 | EUR | Germany Services PMI Jan P | 48 | 48.7 | ||
| 09:00 | EUR | Eurozone Manufacturing PMI Jan P | 57.5 | 58 | ||
| 09:00 | EUR | Eurozone Services PMI Jan P | 52.2 | 53.1 | ||
| 09:30 | GBP | Manufacturing PMI Jan P | 57.9 | 57.9 | ||
| 09:30 | GBP | Services PMI Jan P | 55 | 53.6 | ||
| 14:45 | USD | Manufacturing PMI Jan P | 56.8 | 57.7 | ||
| 14:45 | USD | Services PMI Jan P | 55 | 57.6 |
Japan PMI manufacturing ticked up to 54.6, services tumbled to 46.6
Japan PMI Manufacturing ticked up from 54.3 to 54.6 in January, below expectation of 55.0. PMI Services dropped sharply from 52.1 to 46.6. PMI Composite also dropped from 52.5 to 48.8.
Usamah Bhatti, Economist at IHS Markit, said: "Flash PMI data indicated that activity at Japanese private sector businesses dipped into contraction territory for the first time in four months at the start of 2022. The pace of decline was modest, and led by the sharpest fall in services activity since August, while manufacturers commented on a slight quickening in output growth."
Australia PMI composite dropped to 45.3, slipped from strong recovery to contraction
Australia PMI Manufacturing dropped from 57.7 to 55.3 in January. PMI Services tumbled sharply from 55.1 to 45.0. PMI Composite also dropped from 54.9 to 45.3, first contraction follow three months of growth. All are at their 5-month low.
Jingyi Pan, Economics Associate Director at IHS Markit, said: "The Australian economy had slipped from a state of strong recovery in end-2021 to being affected by the surge in COVID-19 infections at the start of 2022... Supply issues meanwhile remained prevalent... This had led to input price inflation worsening Employment levels were unchanged."
ECB Rehn: Economic data to remain good despite Omicron
ECB Governing Council member Olli Rehn said over the weekend, "personally, I expect the economic data to remain relatively good despite being affected by the Omicron variant." He added that rate hikes in 2023 would be a logical step if there are no new economic shocks.
He added upward pressure on inflation will subside over the course of the year. Inflation is expected to hover around ECB's target of 2% in the next two years.
Bitcoin Weekend Plunge: 50% off Record Highs
Cryptocurrency traders have been suffering a slow painful death after the Fed ran out of excuses in tackling inflation. In just a few months, Wall Street had to reprice a much more aggressive Fed tightening strategy that made Bitcoin go from having a simple correction, to entering bear market territory, and now has fallen over 50% from its record highs.
Many crypto traders were anticipating one last plunge before jumping back in, but the regulatory environment got a lot cloudier now that the White House may soon unveil some national security challenges posed by cryptocurrencies and the Fed’s paper on central bank digital currencies didn’t answer any questions on if we will see a digital dollar or how they could work with stablecoins.
The majority of retail and institutional traders that got started in crypto in 2021 are now in the red and their patience may not be as long lasting as traders who are used to Bitcoin’s extreme volatility during major de-risking events. Bitcoin should have support ahead of the $30,000 level, but if that breaks it could be a freefall to $22,500.
Forex and Cryptocurrency Forecast
EUR/USD: FOMC Meeting: the Day the Markets Are Waiting For
The main event not only of the next week, but of the whole month will certainly be the meeting of the FOMC (Federal Open Market Committee) of the US Federal Reserve on January 26. Will the regulator raise interest rates now? Or in March? Or will it postpone the curtailment of incentives indefinitely? These questions remain unanswered.
Recall that the roadmap includes three main points at the moment: 1) curtailing the emergency stimulus program in March, 2) three increases in the key rate in 2022, the first of which may also occur in March, after which 3) the regulator will begin to normalize the balance. However, nothing lasts forever under the moon, the monetary policy of the Federal Reserve either. So, these points are not constant at all and can be changed.
Even ECB President Christine Lagarde said last week that the European Central bank has already begun to react and is ready to adjust its policy if facts and figures require it. Although it is not yet very clear what "it has already begun to react" is. And "ready" is a very loose concept.
According to the same Ms. Lagarde, a too rapid rate increase could slow down the growth of the Eurozone's GDP. So why then reduce monetary stimulus and raise the key rate, especially since, according to the bank's management, the surge in inflation is a temporary phenomenon? And inflation in the US is growing faster than in the Eurozone. So let the Fed have a headache about how to stop it. And the ECB can wait until 2023 to raise rates, and at the same time see how things go overseas.
A clear difference between the US Central Bank's hawkish stance and its European counterpart's dovish stance is a strong support for the dollar, pushing the EUR/USD down. However, there are times when the actions of investors are determined not by real economic and political factors, but by rumors spread by speculators.
Something similar seems to have happened on January 11th. Speaking in the US Congress that day, Jerome Powell stated once again that in order to combat the record for forty years inflation, the Fed is going to raise the refinancing rate at least twice this year, and that if necessary, it can be raised three times. That is, nothing new was actually said. But, thanks to rumors, the market for some reason was waiting for the number "four" and was disappointed because it did not sound. As a result, the DXY dollar index went into a deep peak, and the EUR/USD pair went north instead of moving south.
Due to inflation data in the US, the euro strengthened its positions even more the next day, January 12, and the EUR/USD pair went further up having broken through the border of the medium-term side channel 1.1220-1.1385. A nine-week high was reached on the morning of January 14 at 1.1482. After that, everything went back to normal. The market realized that there were no real reasons for the euro to strengthen, and the pair found itself within the 1.1220-1.1385 channel once again on Tuesday, January 18, reaching the local bottom at 1.1300 on January 21. The final chord was played at 1.1343.
At the time of writing, most (55%) of the D1 oscillators are red, 20% are green and 25% are neutral gray. Trend indicators have 90% red and only 10% green. Among experts, the majority (55%) support the strengthening of the dollar, 45% are for its fall. The nearest resistance zone is 1.1370-1.1385, then 1.1400-1.1435, 1.1480 and 1525. The nearest support zone is 1.1300-1.1315, then 1.1275 and 1.1220. This is followed by the November 24 low of last year at 1.1185 and the 1.1075-1.1100 zone.
As for the economic calendar for the upcoming week, besides the FOMC meeting of the US Federal Reserve and the subsequent press conference of its management, we can note the release of data on business activity in Germany and the Eurozone (Markit index) on Monday, January 24. Preliminary data on US GDP will be released on Thursday, January 27, as well as the volume of orders for capital goods and durable goods. (Since the purchase of such goods usually involves large investments, these data reflect the economic situation in the United States, including the inflationary component.) And, finally, data on German GDP will be published at the end of the working week, on January 28.
GBP/USD: Rate Up Bet
The dollar strengthened its position against the pound slightly over the past week. If the GBP/USD pair was at the height of 1.3748 on January 13, it fell to 1.3545 on the evening of January 21. According to some experts, it's all about he British currency being generally overbought. After the December decision of the Bank of England to raise the interest rate from 0.1% to 0.25% for the first time in three years, the pair showed an increase of about 575 points. So the current fall of 200 points may not mean a medium-term trend reversal, but only a temporary correction.
The pound has a lot of chances to return to growth, even despite the hawkish position of the US Federal Reserve. The CPI published on January 19 showed that inflation in the UK rose to its highs in more than 15 years, reaching 5.4% (previous reading 5.1%, forecast 5.2%). The continuing growth of inflationary pressure may force the regulator to raise the key rate as early as at the next meeting on February 03. It is possible that at the same time, against the backdrop of a moderate impact of the omicron strain on the economy of the United Kingdom, plans to reduce monetary stimulus (QE) introduced during the COVID-19 pandemic may also be revised.
A survey conducted by Reuters among 45 experts showed that most of them (65%) expect the Bank of England to raise rates again on February 03, to 0.5% this time. If this happens, then, according to Scotiabank strategists, the GBP/USD pair may return to levels around 1.3800.
More than 75% of analysts expect the rate to be raised to 0.5% by the end of March. Also, according to the median forecast, the British regulator will raise the rate by another 25 basis points in the Q3 (up to a quarter earlier than expected). After that, another increase will follow, up to 1.0%, approximately at the beginning of 2023.
However, as for the forecast for the next few days, 60% of experts side with the bears, expecting the pair to fall at least to the 1.3450-1.3500 zone. Most of the indicators on D1 agree with this forecast: 60% of oscillators point to sell (although 10% are already in the oversold zone), 20% recommend buying and 20% remain neutral. Among trend indicators, 40% look up, 60% look down.
The supports are located at 1.3525, 1.3480, 1.3430, 1.3375, the next strong support is 100 points lower. The levels and resistance zones are 1.3570-1.3600, 1.3640, 1.3700, 1.3750, 1.3835 and 1.3900.
The Bank of England meeting will only take place in early February, and there won't be much important macro data from the UK next week. The publication of the Markit business activity index may cause increased volatility on Tuesday, January 24. Although, most likely, investors will not pay much attention to it on the eve of the US Federal Reserve meeting.
USD/JPY: Yen as a Safe Haven
The meeting of another central bank, Japan, took place last week, on January 18. As expected, the key rate remained at the same negative level, minus 0.1%. As we wrote earlier, according to this regulator, the country does not need a strong currency, and a weak yen is more likely to help the economy, as it supports Japanese exports and corporate profits.
In general, last week's results for the USD/JPY pair can be assessed as neutral. First, it went up and rose to the height of 115.05 on Tuesday, January 18. Then the trend changed to a downtrend, and the pair dropped to where it was trading a week ago, to the zone of 113.60-114.00 by the end of the five-day period.
The Japanese currency was supported by the weakening of the risk appetite of the market. Investors began to abandon risky assets once again in favor of the yen, which plays the role of a "safe haven". The reasons for this change in sentiment were forecasts for rising inflation, uncertainty about the monetary policy of world central banks and the growth of geopolitical tensions.
The USD/JPY pair finished last week at 113.66, that is, within the trading range 113.40-114.40, where it has regularly been in the last three months. And although 60% of analysts vote for its growth, 25% for a fall and 15% for a sideways trend, the median forecast suggests that it will stay within this channel. Of course, provided that the US Federal Reserve does not present any surprises at its meeting. And you should not forget about the international political situation, there are also possible surprises, and very unpleasant ones at that.
Among the oscillators on D1, 100% are facing south, although 25% of them are already giving signals that the pair is oversold. Among trend indicators, 65% recommend selling, 35% recommend buying. Support levels are 113.50, 113.20, 112.55 and 112.70. The nearest resistance zone is 114.00-114.25, 114.40-114.65, then there are levels 115.00, 115.45, 116.00 and 116.35.
CRYPTOCURRENCIES: It Is Not Just Winter in the Crypto Market, It Is Polar Cold
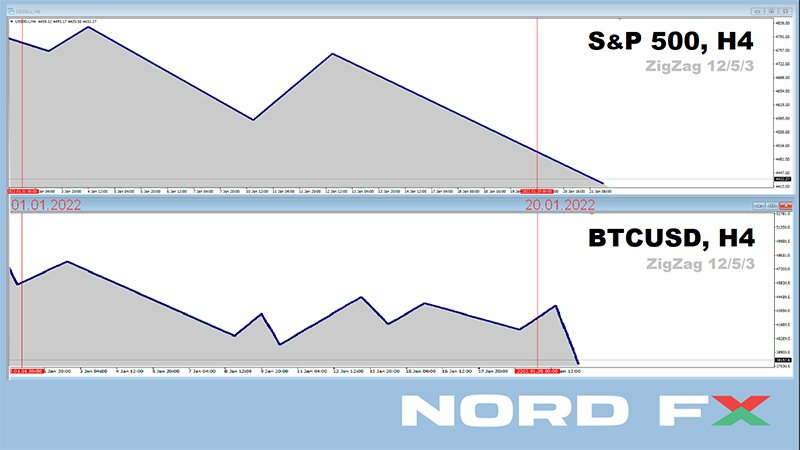
Quotes of risky assets remain under strong pressure in anticipation of the US Federal Reserve meeting. The Dow Jones, S&P500 and Nasdaq stock indices have been losing their positions for almost the entire month of January. But as for the top cryptocurrencies, they have been quite successful in repulsing bear attacks for the last two weeks. If we talk about bitcoin, buyers did their best to keep the BTC/USD pair quotes from reaching the psychologically important horizon of $40,000. However, the bears managed to break through the defense on Friday, January 21 and lower the pair to $36,160. The total capitalization of the crypto market flew down as well, falling to $1.72 trillion, and the Crypto Fear & Greed Index was firmly stuck in the Extreme Fear zone, dropping to 19 points.
The situation, according to a number of experts, does not bode well for cryptocurrencies at the moment. The bubble is deflating, so the bitcoin price may fall to $30,000. This opinion was expressed by specialists from the investment company Invesco, drawing an analogy with the crash of 1929.
The decline from the $69,000 highs is exactly in line with the bubble pattern, analysts say. This trajectory assumes that the asset will lose 45% of its value within 12 months after the peak. That is, according to their calculations, the price will fall to $34,000-$37,000 by the end of October and to $30,000 by the end of 2022.
At the same time, Invesco admitted that they made a mistake with the forecast for 2021, when they predicted a fall in the BTC price below $10,000. Analysts explained their mistake by saying that bitcoin seems to be going through not one, but a series of bubbles. (Although, perhaps, Invesco experts were just in a hurry, and this forecast will come true this year).
Popular analyst PlanB had made a mistake with his forecast for the past year as well. Recall that he developed a model for predicting the behavior of the bitcoin rate (S2F), the signals of which indicated the prospects for BTC to rise to $100,000 in 2021. Despite the fact that the S2F forecast did not come true, PlanB continues to stick to his theory. He is confident that bitcoin has not yet realized the potential laid in it by the 2020 halving. According to the analyst, the coin is now near local lows and is preparing to renew all-time highs in March. According to the analyst, the peak value of bitcoin within the current cycle can be recorded in July-August 2022.
Another unsuccessful predictor was TV presenter and former trader Max Kaiser. He explained In another interview why his forecast of $220,000 for bitcoin was not realized last year. "As for 2021, I said we would get to $220,000 per coin, which is a typical four-year cycle. What we had in 2021 was a massive mining collapse in China, the hash rate fell by 50%. We have recovered since then and are about to reach a new all-time record hash rate. That's why I'm moving my goal from 2021 to 2022."
"There is a price, there is a hash rate and there is a complexity setting: these are three things you need to keep in mind," Max Keiser explains. "I have always said that the price lags behind the hash rate, so once we see its new all-time highs, new all-time highs of the bitcoin price will follow."
Guido Buehler, CEO of SEBA cryptocurrency bank, calls a three times more modest goal. He believes that digital gold could rise to $75,000 by the end of 2022. "Our internal valuation models point to a price between $50,000 and $75,000. I am quite sure that we will see this level," he said, adding that the volatility of bitcoin will remain high, but the asset will be able to test new record levels, the only question is the timing.
Cryptocurrency analyst Justin Bennett's forecast can also be classified as optimistic, although the numbers here are even smaller. Bennett reviewed BTC historical price movement models that show that the asset is expected to rise by 20-30%. "It can be seen that starting from early 2021, bitcoin, finding the minimum below the liquidation level, then makes an upward movement. The average rate of such movement is about 63%, and the lowest was in April, about 27%. - the expert says. "If you take this data and look at the low around $40,000, then a minimum move of around 27% would take the market to around $50,000. This is highly likely given that the $50,000-53,000 range is very important, and sellers will defend this range as resistance.
There is no clear opinion on the future of ethereum either. Some still hope that the ETH/USD pair will meet 2023 around $7,000-10,000, while others expect the coin to crash after bitcoin. For example, Peter Brandt, a Wall Street trader with 45 years of experience, expects a further decline in the price of ethereum. In his opinion, from a technological point of view, this altcoin is "a very complex, costly, and user-inconvenient platform in terms of its use for NFTs, special tokens, and its involvement in the metaverse." Based on this, Brandt concludes that ETH will lose points in the eyes of investors, giving way to competitors.
Peter Brandt's forecast is quite controversial. Indeed, the slow protocol has led to delays in transactions and a significant increase in fees. Sometimes a transaction costs more than $50, which is very expensive compared to the competition. For example, the commission is less than a cent in Solana. However, due to its high decentralization, ethereum is still the first in terms of the use of smart contracts. At the moment, this altcoin dominates the rest of the blockchains in the DeFi sector with $157 billion of blocked funds or 66% of the total market. Its lead is even greater in the NFT sector: here ETH is almost a monopoly as its share exceeds 90%.
It is possible that its share will decrease over time due to competition, but many experts still promise a bright future for this altcoin. The transition to the proof-of-stake protocol and the subsequent network scaling should help it maintain its leading position. The "X hour" for these steps is scheduled for the Q2 2022 at the moment. However, there is a certain risk that the date will be postponed again. This does not seem to scare investors much though. According to the Glassnode platform, they are buying up coins despite the drop in their value.
Ethereum has already lost about 50% of its value in two months. At the same time, the number of ETH wallets with a non-zero balance has reached a new high of 73,025,019. Network activity is also increasing, which indicates the desire of investors to take advantage of the correction and buy as many tokens as possible. The average daily number of transactions on the blockchain exceeds 1.2 million at the moment.
According to Glassnode analysts, ETH will trade in a narrow range until a clear vector of movement for the US stock market is formed. If the capital goes into risky assets again, then the ethereum will resume the rise along with bitcoin.
But when will this happen?
And will it happen at all?
EUR/USD Weekly Outlook
EUR/USD dropped sharply last week but failed to break 1.1284 support. Initial bias remains neutral this week first. Price action from 1.1185 are seen as corrective move. Break of 1.1284 will argue that larger down trend from 1.2348 is ready to resume. Intraday bias will be back on the downside for retesting 1.1185 low first. Also, in case of another rise, upside should be limited by 38.2% retracement of 1.2265 to 1.1185 at 1.1598 eventually.
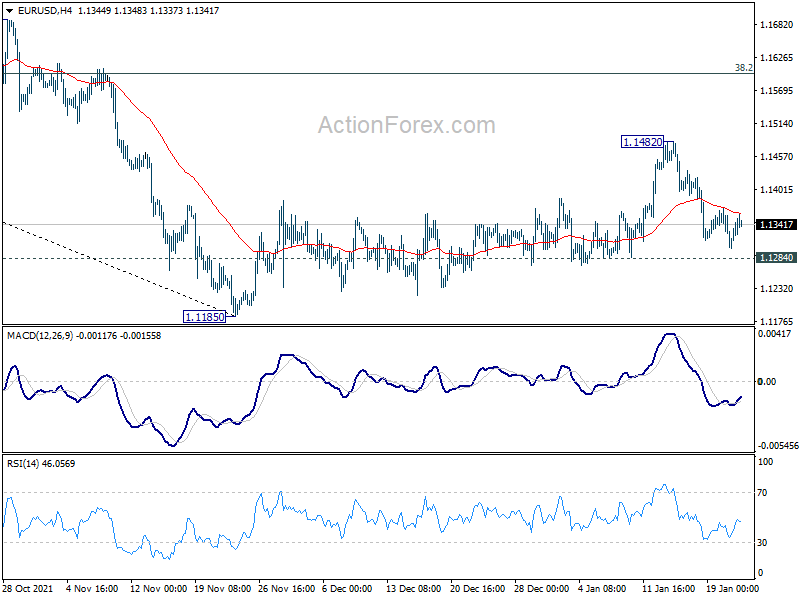
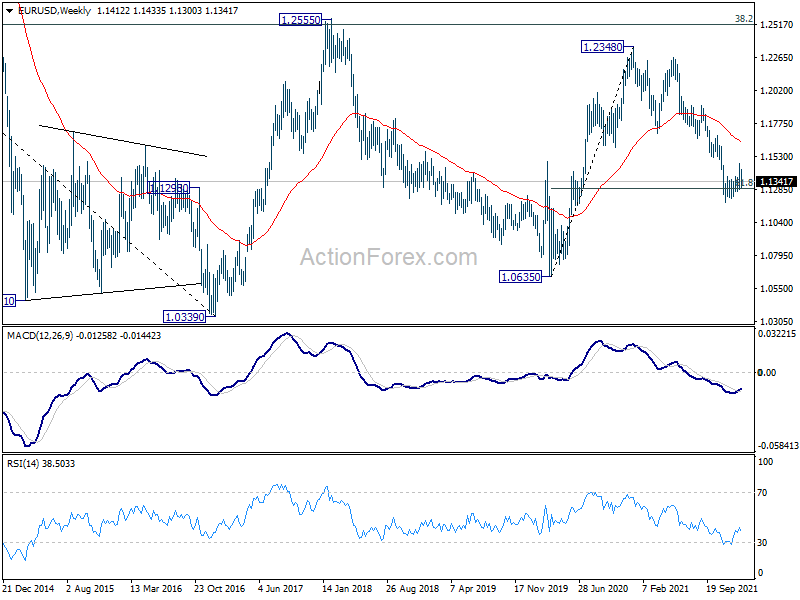
In the bigger picture, there are various ways of interpreting the fall from 1.2348 (2021 high). It could be a correction to rise from 1.0635 (2020 low), the fourth leg of a sideway pattern from 1.0339 (2017 low), or resuming long term down trend. In any case, outlook will now stay bearish as long as 1.1703 support turned resistance holds. Sustained break of 61.8% retracement of 1.0635 to 1.2348 at 1.1289 would pave the way back to 1.0635.
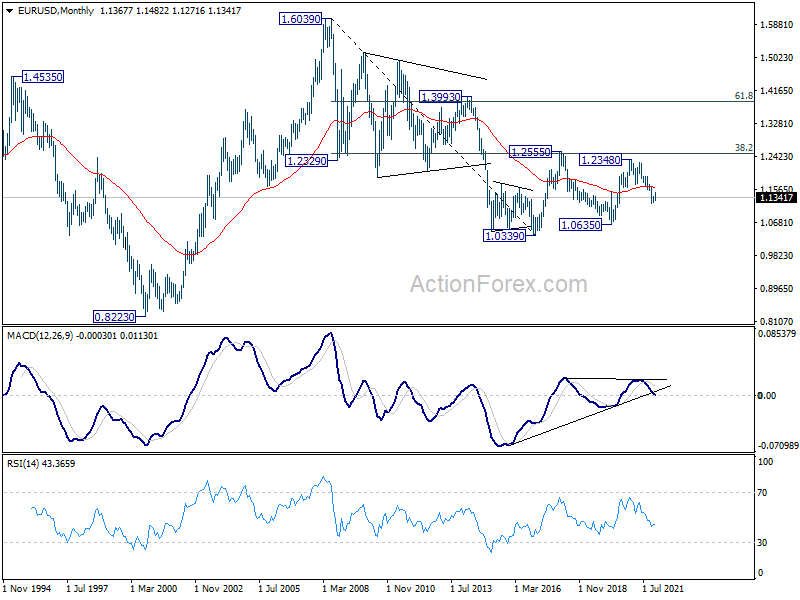
In the long term picture, EUR/USD has possibly failed 1.2555 cluster resistance (38.2% retracement of 1.6039 to 1.0339 at 1.2516) again. Long term outlook will remain neutral as sideway pattern from 1.0339 (2017 low) is extending with another medium term fall. For now, we'd hold back from assessing the chance of downside breakout, and monitor the momentum of the decline from 1.2348 first.
USD/JPY Weekly Outlook
Considering bearish divergence condition in in daily MACD, USD/JPY is probably already in correction to whole up trend from 102.58. Initial bias remains mildly on the downside this week. Break of 113.47 will target 112.52 support first, and then 38.2% retracement of 102.58 to 116.34 at 111.08. For now, risk will stay on the downside as long as 115.05 resistance holds, in case of recovery.
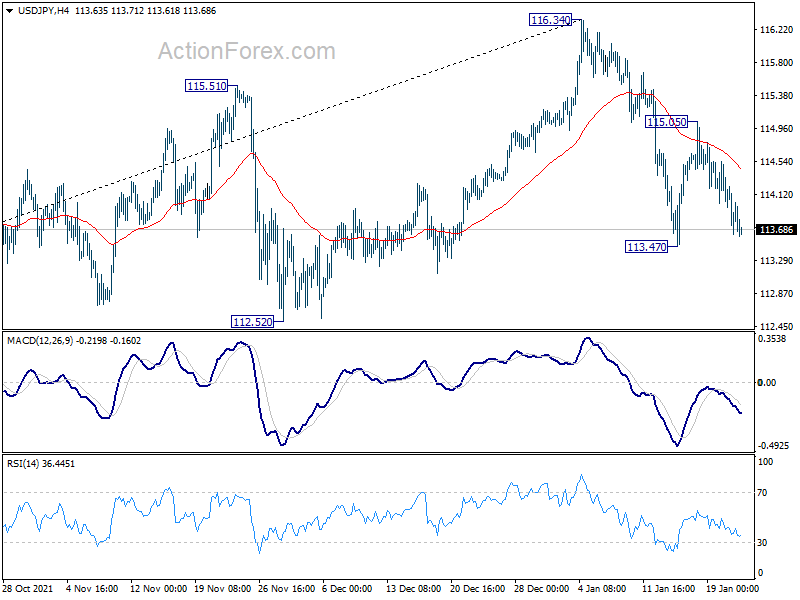
In the bigger picture, no change in the view that rise from 102.58 is the third leg of the up trend from 101.18 (2020 low). Such rally should target a test on 118.65 (2016 high). Sustained break there will pave the way to 120.85 (2015 high) and raise the chance of long term up trend resumption. This will remain the favored case as long as 55 week EMA (now at 110.91) holds.
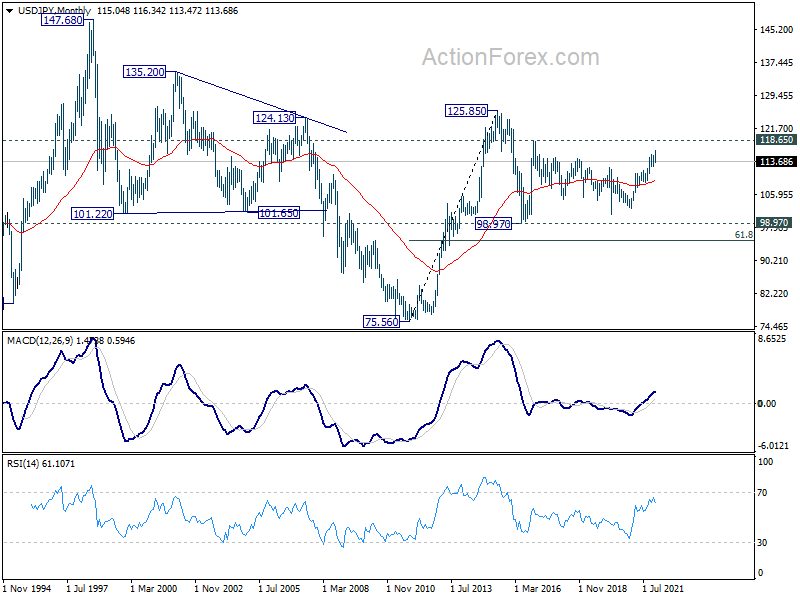
In the long term picture, the rise from 75.56 (2011 low) long term bottom to 125.85 (2015 high) is viewed as an impulsive move, no change in this view. Price actions from 125.85 are seen as a corrective pattern which could still extend. In case of deeper fall, downside should be contained by 61.8% retracement of 75.56 to 125.85 at 94.77. Up trend from 75.56 is expected to resume at a later stage for above 135.20/147.68 resistance zone.