Sample Category Title
US 500 Index Meets Resistance at 200-SMA; Bearish Outlook
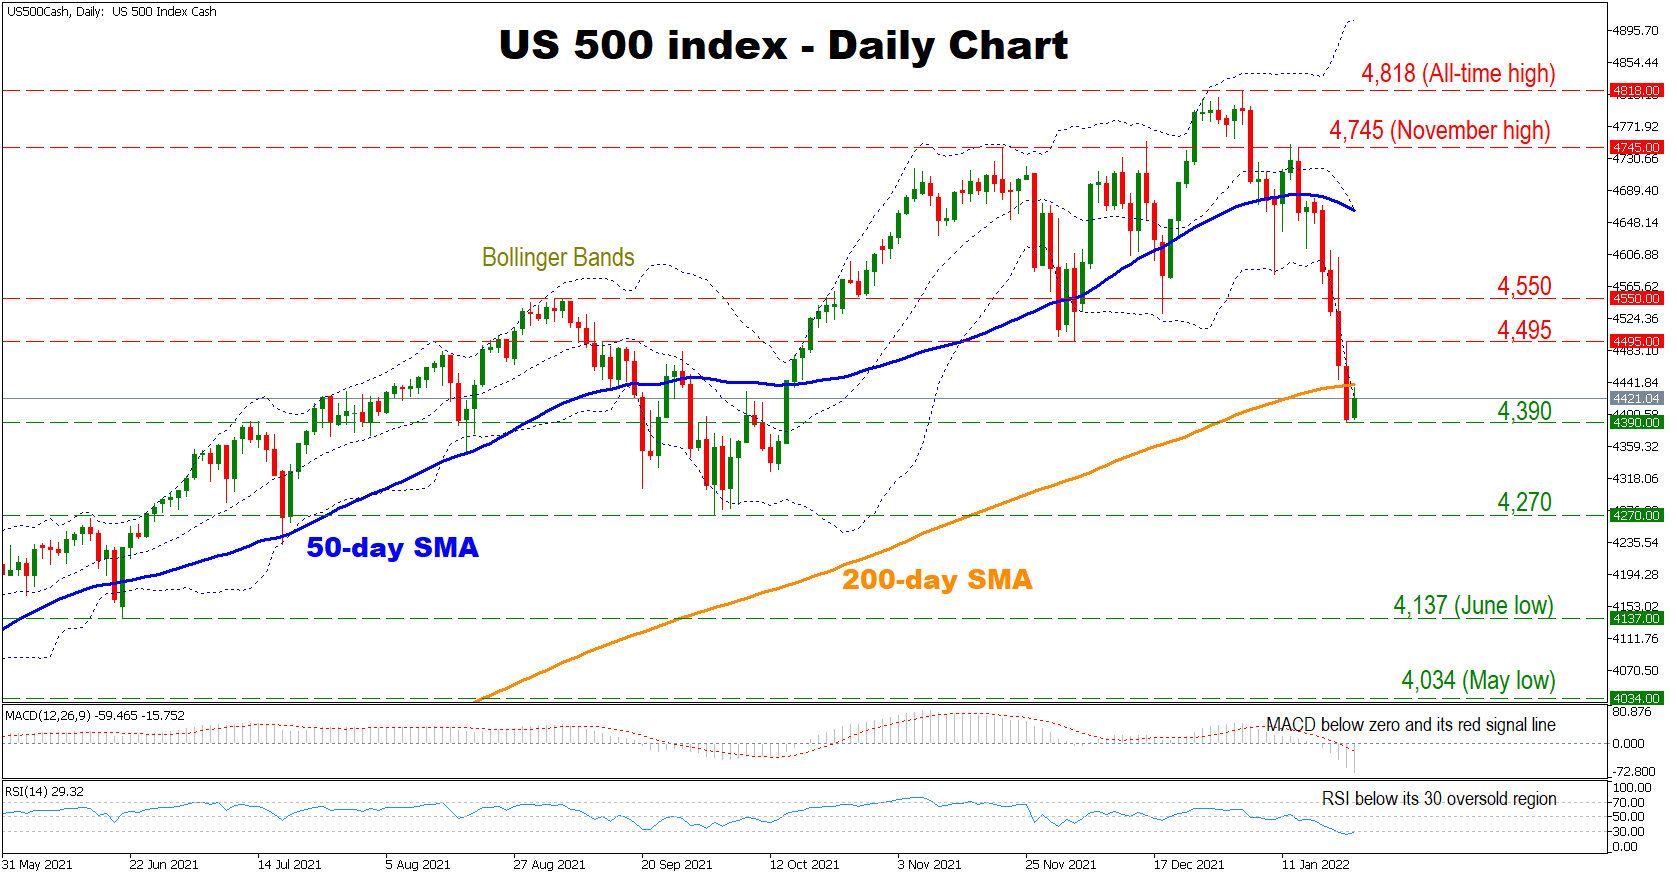
The US 500 cash index has witnessed a pullback from its all-time high, reaching a 3-month low amid increasing negative forces. The index has also crossed below its 50- and 200-day simple moving average (SMA), which points towards an overall bearish outlook. However, the price is currently trading below its lower Bollinger Band, indicating that an immediate upside movement should not be ruled out.
Short-term momentum indicators are reflecting a mixed picture for the index. The MACD is found below zero and its red signal line, suggesting that the negative forces might be gaining further traction. However, the RSI has entered its 30 oversold region indicating that an immediate upside movement is not out of the equation.
Should the bears maintain control, initial support might be found at the 4,390 level before sellers target the 4,270 hurdle. A break below the latter could intensify selling pressures, sending the price to test its June low at 4,137. Breaching below this point, could open the door towards the May low at 4,034.
On the flip side, if the price crosses above its 200-day SMA currently at 4,440, buyers might then shift their attention towards the 4,495 hurdle. Moving above from this point could send the price to test the 4,550 barrier before targeting the 50-day SMA currently at 4,670. A cross above the latter could turn the fortunes around for the pair, sending the index to test its November high at 4,745.
In brief, despite the fact that the latest downside move seems overextended, the short-term outlook for the pair is bearish. For sentiment to change, sellers would need to break above the 50-day SMA.
Investors Dump the Winners from the Pandemic
Last week was painful for investors, especially those with portfolios heavily tilted towards tech stocks and speculative assets like cryptocurrencies. The S&P 500 declined 5.7%, notching its third straight weekly loss, and closed below its 200-day moving average. Losses in the Nasdaq Composite deepened further after the index entered correction territory a week earlier and the index is now down 15.1% from the intraday peak recorded in November 2021. Both indices logged their biggest weekly declines since the onset of the pandemic in March 2020.
Stimulus withdrawal and expectations of tighter monetary policies are not the only reasons driving stocks lower; it’s the negative earnings surprises from some of the biggest firms that are worrying investors. Lockdown-beloved stocks are being punished the most, with Netflix plunging 21.8% on Friday after the streaming giant anticipated weak subscription growth as competition heated up from Disney and other players. A day earlier, shares of Peloton Interactive, the provider of at-home exercise equipment, lost 24% of its value after the company said it was reviewing the size of its workforce and other reports of halting production due to falling demand. Zoom, the video conferencing software maker, is now trading at a fraction of its 2020 peak, having lost 74% of its value since.
Again, cryptocurrencies failed to protect portfolios as a hedge against the market turmoil or higher inflation. Most digital assets have lost a quarter to a third of their value this year, with Bitcoin, the most prominent digital token dropping to a six-month low at $34,625.
However, the general outlook is not as gloomy as it appears in some asset classes. The weak results for companies that profited during the worst of the pandemic are a bullish signal for the public in general. Fears of Covid-19 and its variants have diminished incredibly over the past few weeks. Many countries are now scrapping most of their pandemic restrictions, with social distancing likely to be something of the past.
Companies benefitting from the reopening of economies like airlines, restaurants, and other hospitality firms may continue to benefit despite anticipation of higher interest rates and bond yields. Given that inflation is not going away anytime soon, investors should consider being overweight cyclical companies with high profit margins and reasonable valuations. Tech will remain a long-term play despite the current turmoil, but one needs to be selective and focus on firms with solid balance sheets, profit margins, and growth prospects.
This week, big players in the tech industry will release their Q4 2021 results, including Apple, Microsoft, Tesla, and IBM. Robust results are required to help equities recover from last week’s selloff. However, the Fed’s monetary policy meeting, which wraps up on Wednesday, remains the main event of the week.
Daily Technical Analysis
EUR/USD
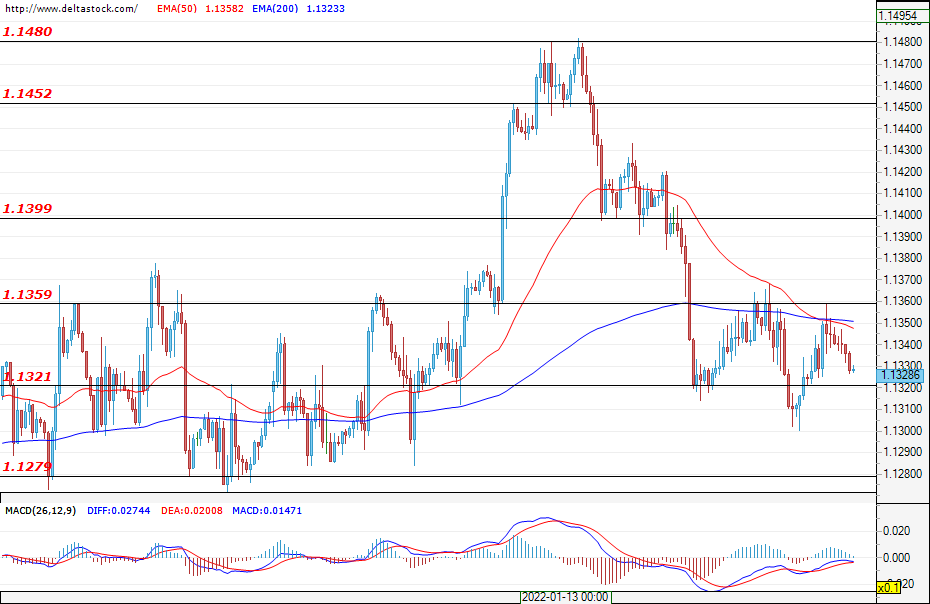
We still cannot witness a successful downward breach at the 1.1321 support zone as the bulls thwarted the breakout attempt during the previous trading session. At the time of writing, the currency pair is located just above the mentioned zone, and the most likely scenario is for another attempt at breaching it, followed by a test of the next significant support at 1.1279. This week, we are expecting a lot of long-awaited economic news that would affect the volatility of the currency pair. Among the most anticipated is the announcement of the Fed interest rate decision (Wednesday; 19:00 GMT), as well as the GDP data for the U.S. (Thursday; 13:30 GMT).
USD/JPY
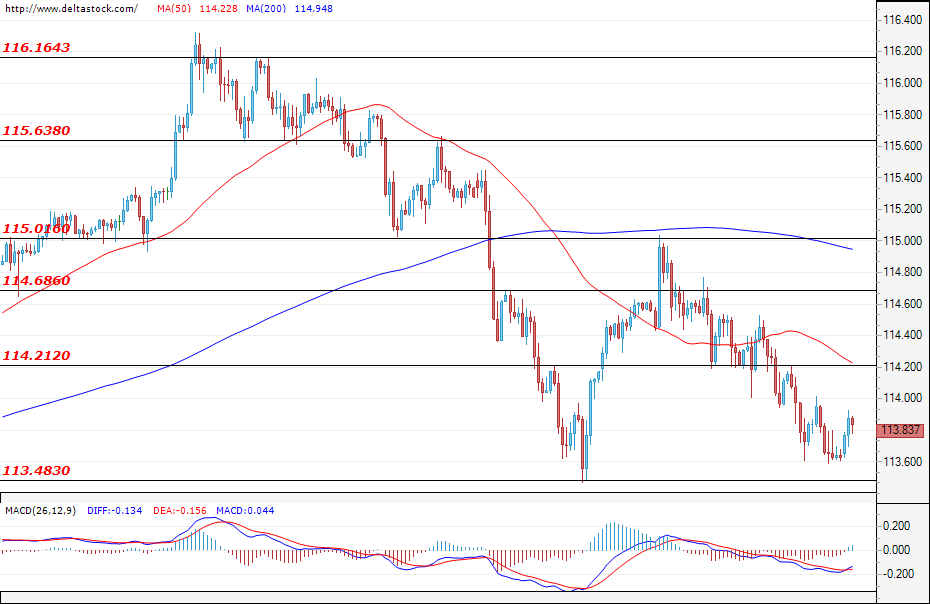
The bears failed to reach the support zone at 113.50 and, at the time of writing, the bulls are trying to take control. Their first goal is expected to be a test of the resistance zone at 114.21 and a successful breach here would strengthen the appreciation of the U.S. dollar against the Japanese yen, which could lead to an additional appreciation towards the local highs at around 116.00. On the other hand, if investors lose their confidence in the U.S. dollar, influenced by this week’s decision of the U.S. Federal Reserve, then we could witness a sharp decline towards the support zone at around 110.00.
GBP/USD
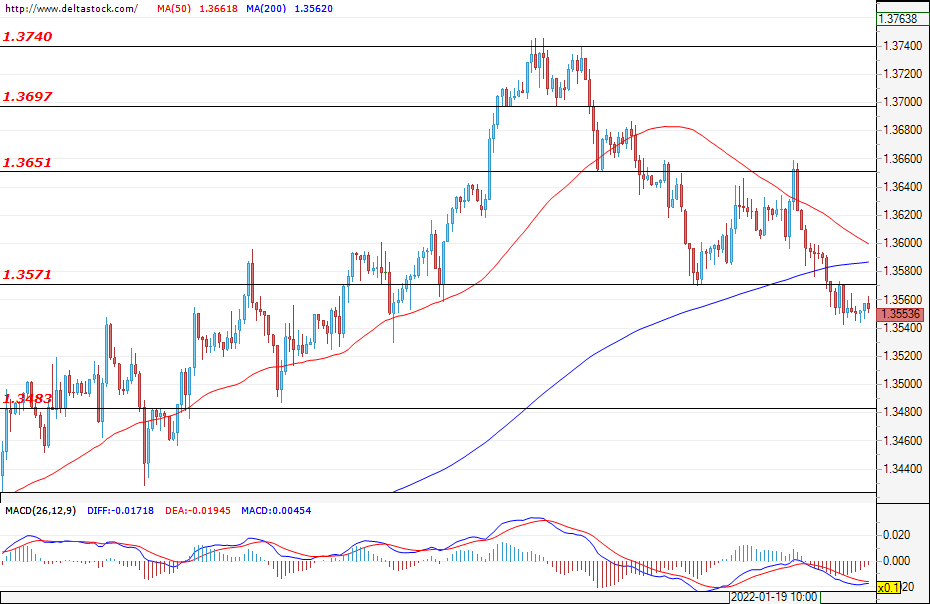
It seems that, during the last week, the bears managed to take full control, leading the pair towards the support area at around 1.3571, which completely disrupted the upward trend for the Cable. The consolidation phase under the mentioned support is likely to continue, with the potential to fall towards the next significant support area at 1.3483. The announcement of the Fed's interest rate decision (Wednesday; 19:00 GMT) will be crucial for the future of the currency pair.
EUGERMANY40
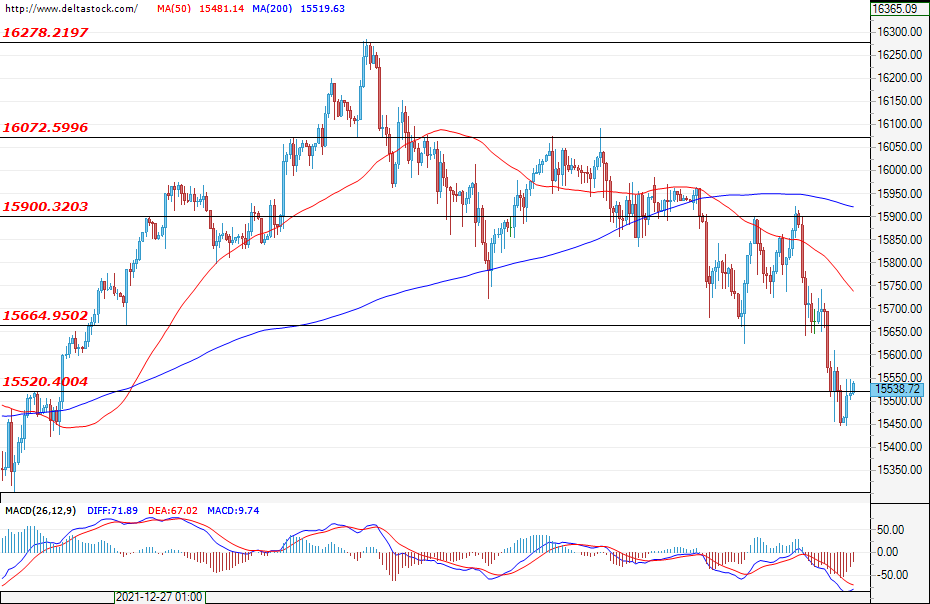
The sell-off for the German index was limited to just below the support level at 15500 and, at the time of writing, we are seeing consolidation around this level. It is quite possible that the decline will continue, but we should also not exclude a short-term upward correction here, which is likely to remain limited below the 15665 resistance zone. The implementation of this pessimistic scenario could signal the end for the upward trend of the EUGERMANY40 index. The next significant support is found at around 14800.
US30
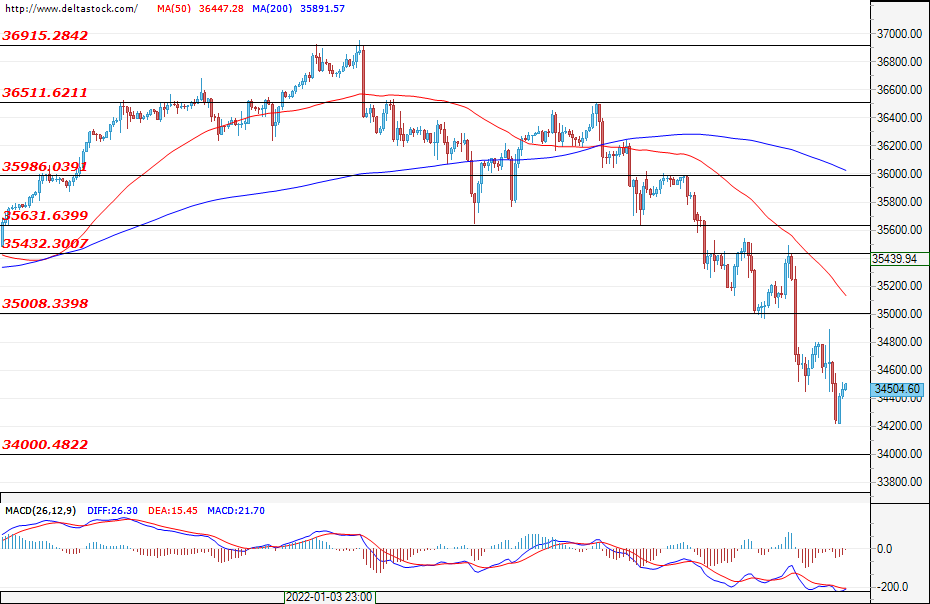
The downtrend for the U.S. blue-chip stock index continues, with the bulls currently managing to limit the sell-off to just above the support at 34000. We may see a short-term upward correction, after which the downtrend may continue. A breach of the support zone at 34000 would significantly boost the sell-off. The news, mentioned in the EUR/USD analysis, will be crucial for the future of the U.S. index.
USDJPY Slopes Downwards after Short-Term Rebound Falters
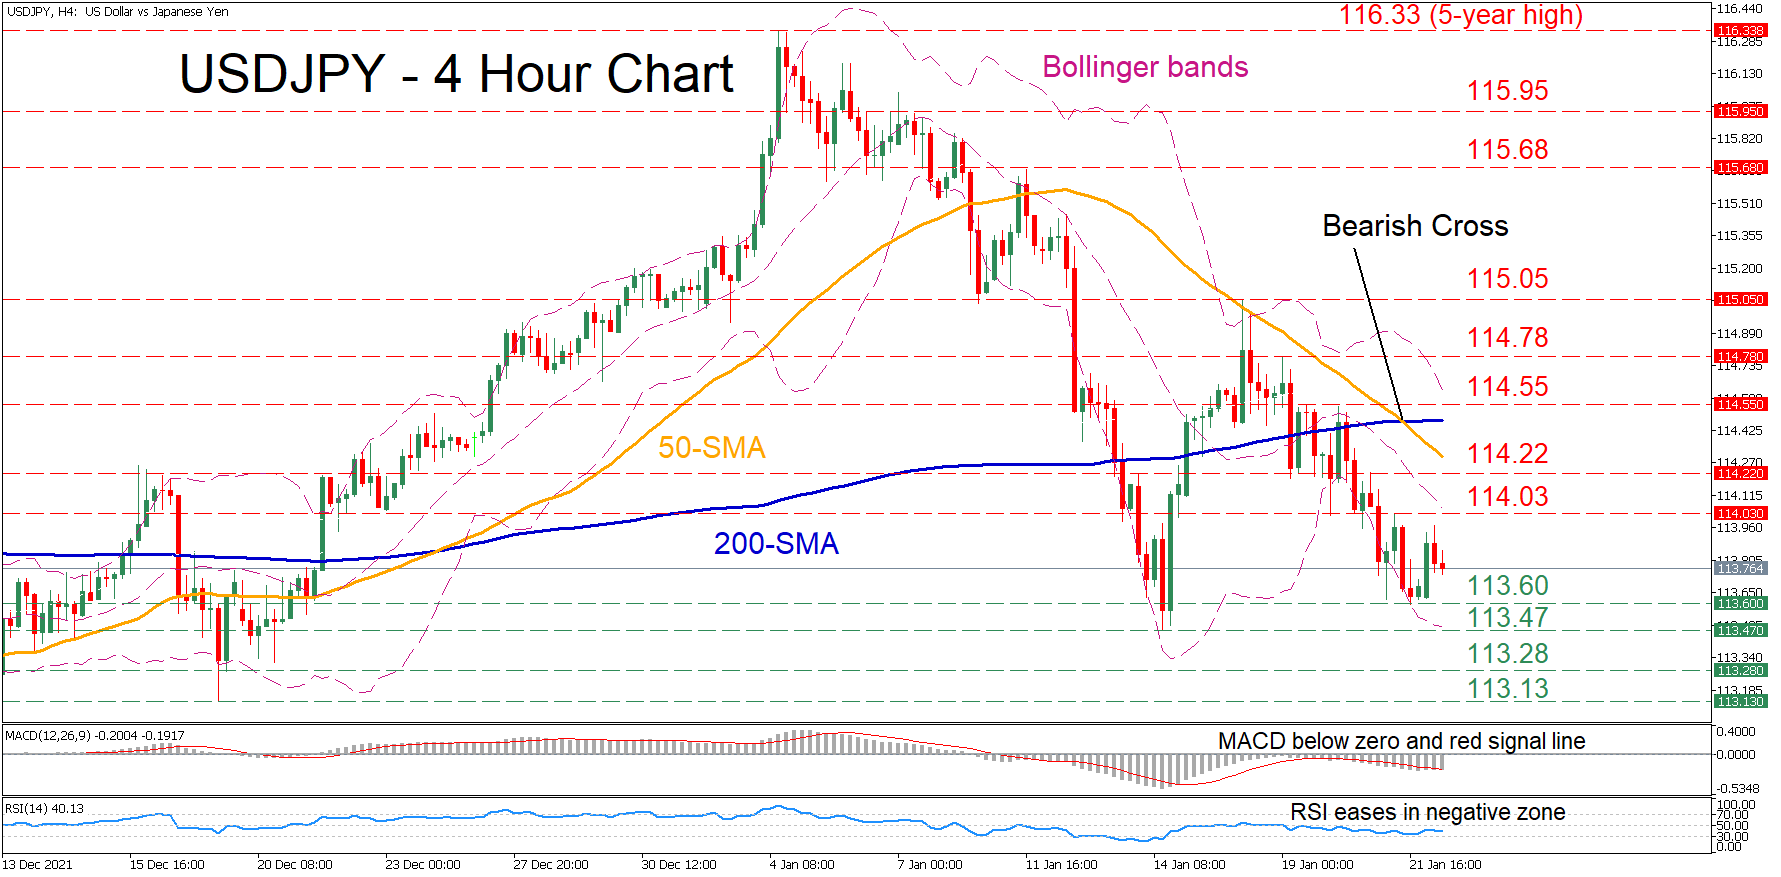
USDJPY has been plunging since early January when it recorded a five-year high of 116.33. Despite posting a moderate rebound after the pair found its feet at the 113.47 level, the price dipped again as positive momentum evaporated.
The decline is likely to resume as short-term oscillators indicate a bearish near-term bias. The MACD histogram is found beneath both zero and red signal line, while the RSI is flatlining in the negative territory. Moreover, the 50-period simple moving average (SMA) crossed beneath the 200-period SMA, endorsing the pair’s negative short-term outlook.
Should the negative momentum intensify further, the price might drop towards the recent low of 113.60. Breaching this barricade, the bears could then target the 113.47 region before the spotlight turns to 113.28. If downward pressure persists, the 113.13 hurdle could appear on the radar.
On the flipside, bullish actions may encounter initial resistance at the recent high of 114.03. Conquering this barricade, the price could ascend towards 114.22 or higher to test the 114.55 obstacle. Piercing through these resistance points, buyers might then aim for the 114.78 level.
Overall, the eventual resumption of the downside trajectory remains the most likely scenario for USDJPY. However, a profound break above 115.05 could alter its short-term picture back to positive.
Cryptocurrency and Stocks Futures Slump as Market Fears Rise
Cryptocurrency prices continued their sell-off during the weekend as investors continued focusing on multiple events. For example, there are worries about the rising bond yields in the United States. Just last week, the ten-year bond yields rose to a two-year high while the 2-year and the 10-year rose to a two-year high. Rising bond yields are a sign that investors expect the Federal Reserve will start hiking rates. They also declined as investors continued worrying about the regulatory environment. On Thursday, Bank of Russia warned that the country should ban cryptocurrencies.
American futures tilted lower on Monday as investors worried about the rising risks in the market. The losses accelerated after the weak quarterly results by the likes of Netflix and the weak announcement by Peloton. Later this week, US indices like the Dow Jones and S&P 500 will react to the latest results by most American giants. Some of the top companies that will publish their quarterly results this week are Microsoft, IBM, Verizon, Texas Instruments, and Raytheon, Tesla, Intel, and Abbott Labs. According to FactSet, the S&P 500 is likely to report earnings growth of more than 25% for the fourth quarter straight.
The economic calendar will have no major events today. The most important ones will be the flash manufacturing and services PMI data from several countries. Economists expect the data to show that business activity in key countries like the US, UK, and Europe bounced back in January as countries assessed the impacts of the omicron variant. Investors will also focus on the price of oil and natural gas as tensions between the US and Russia escalated.
EURUSD
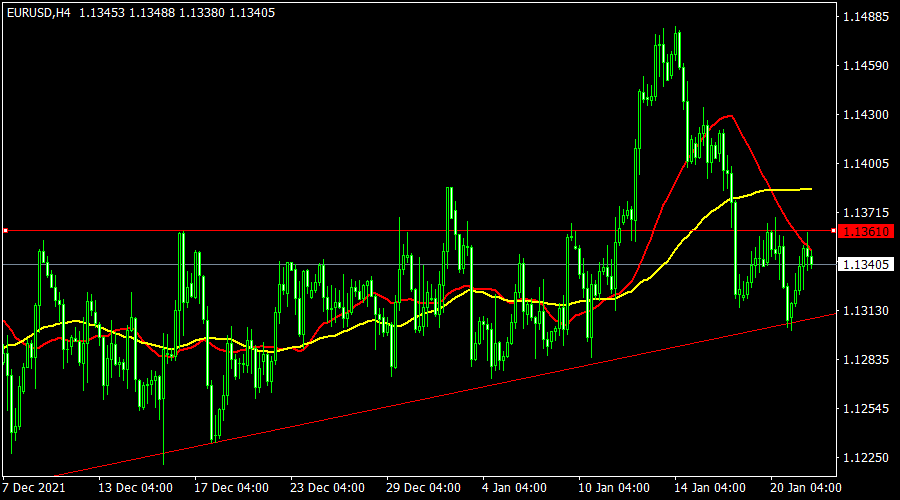
The EURUSD pair was little changed on Monday morning. The pair is trading at 1.1340, where it has been in the past few days. The pair is slightly above the ascending trendline that connects the lowest levels since December. It is also below the upper side of the ascending triangle pattern. The pair is along the 25-day and 50-day moving averages. Therefore, the pair will likely remain in this range today.
GBPUSD
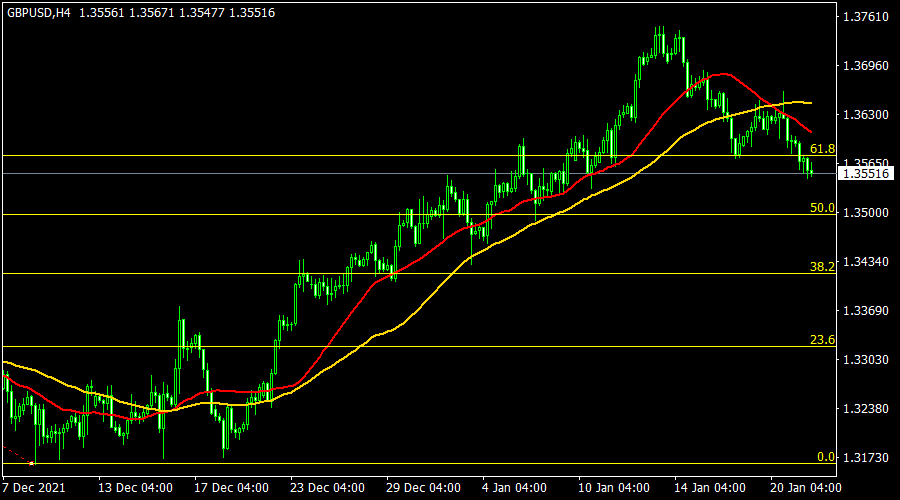
The GBPUSD pair continued its downward trend on Monday morning. It is trading at 1.3550, which was lower than this year’s high of 1.3748. It has moved below the 61.8% Fibonacci Retracement level. At the same time, the 25-day and 50-day moving averages have made a bearish crossover pattern. The Relative Strength Index (RSI) has also dropped. Therefore, the pair will likely keep falling as bears target the 50% retracement level at 1.3500.
CADJPY
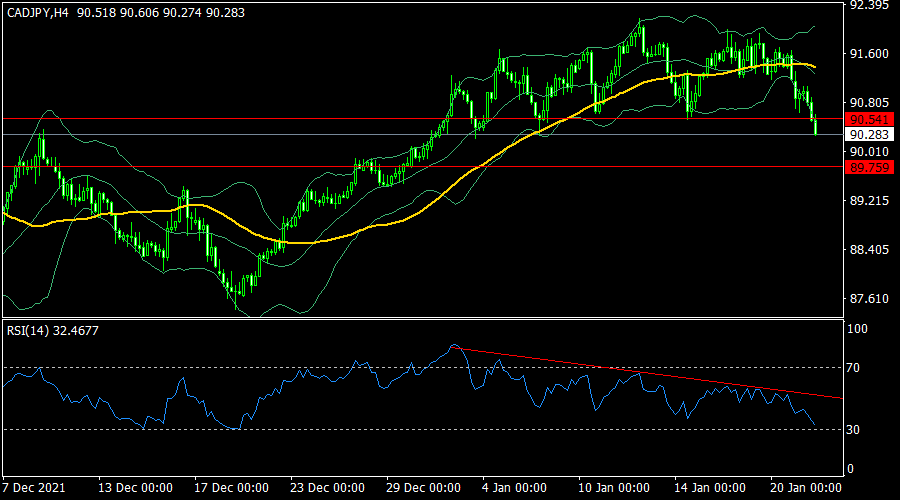
The CADJPY pair has been in a strong bearish trend in the past few days. The pair dropped to a low of 90.28, which was the lowest level since January 3. The pair managed to move below the key support at 90.55, which was the lowest level on January 14 while the Relative Strength Index has been in a bearish trend. Therefore, there is a likelihood that the pair will keep falling with the next target at 90.75.
AUD/USD Pair Moved into a Bearish Zone Below 0.7225
The Aussie Dollar started a fresh decline from well above 0.7270 against the US Dollar. The AUD/USD pair traded below the 0.7225 support to move into a bearish zone.
The pair even traded below the 0.7200 level and the 50 hourly simple moving average. A low was formed near 0.7170 and is currently consolidating losses. An immediate resistance on the upside is near the 0.7185 level.
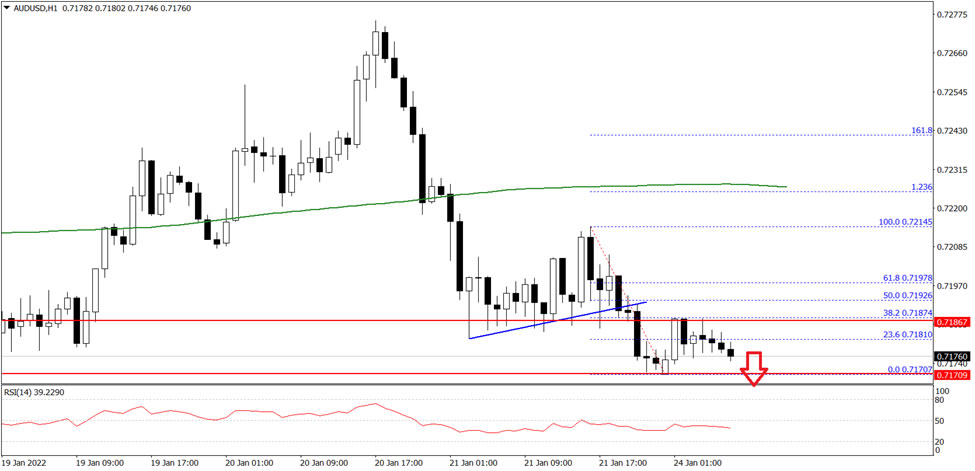
The next major resistance is near the 0.7200 level, above which the pair could rise steadily towards the 0.740 level in the near term. Any more gains could send the pair towards 0.7270 on FXOpen.
An immediate support on the downside is near the 0.7170 level. The next key support is near the 0.7150 level. A clear break below the 0.7150 support could lead the pair towards the 0.7100 support.
Rapidly Deteriorating Inflation Dynamics Probably Imply Risks Tilted to Hawkish Side
Markets
Key US equity indices lost another 2% on Friday and more importantly high-level support marks. The S&P fell below the neckline of a triple top formation at 4495, suggesting more downward potential towards the October low of 4279 with the final target of the technical formation even at 4172. The tech-index Nasdaq was already in correction modus (>10% from all-time top in November), but now lost the neckline of a huge double top formation which served as resistance in H1 2021 (14175). The move lower suggests more downward potential towards 12552 (38% retracement since March 2020) and even the low 12 000 area (final target double top).
The dominant reason for this year’s risk correction is obviously the surge in real rates because of the accelerated global push towards (central bank) policy normalization.
It automatically brings us to this week’s main event: Wednesday’s FOMC policy meeting. We expect the Fed to lay the groundwork for a 25 bps March rate hike/lift-off. Abruptly ending net asset purchases (normally tapered down to zero in March) is a wildcard. We currently take into account a scenario of four consecutive 25 bps rate hikes in the US central bank’s inflation battle, before allowing for a pause once the central bank puts in motion pillar two of its normalization process: shrinking the balance sheet at stealth pace. Rapidly deteriorating inflation dynamics probably imply that risks surrounding this scenario are probably tilted to the hawkish side. This means potentially more and/or bigger rate hikes and a sooner start to winding down the balance sheet Last week’s risk aversion ended the sell-off on bond markets who took up their role as safe haven assets. The US yield curve bull flattened with yields losing 2.2 bps (2-yr) to 4.5 bps (30-yr). German yields fell by around 4 bps across the curve. 10-yr yield spread changes vs Germany widened by up to 3 bps for Greece and Italy.
The trade-weighted dollar lost on points, closing at 95.64 from an 95.81 open. CHF, JPY and EUR were the main beneficiaries (in that order) from the risk-off spell. EUR/GBP was short squeezed higher to test first resistance at 0.8381 in combination with horrible December UK retail sales.
Today’s eco calendar contains January PMI numbers, but we doubt they’ll be able to steal the spotlight from risk sentiment and the approaching FOMC meeting. From the weekend, we retain comments by ECB governing council member Rehn in Handelsblatt saying that a 2023 rate hike would be the logical thing to do apart from any new economic disruptions.
News Headlines
Members of both houses of Italian Parliament and regional representatives start the potentially lengthy presidential election process today. To be appointed, a candidate needs a two-third majority in the first three rounds of the vote or a simple majority later in the process. The role of Italian President is mainly ceremonial, but the head of state controls key steps in the Italian political process including nominating the Prime Minister or dissolving parliament. PM Mario Draghi is in pole position to get the job. However, some of the parties currently supporting his government, said that Draghi leaving the post of PM would be a risk to political stability in the country. The vote is secret and some parties didn’t give public guidance. So, the outcome remains uncertain. Former PM Silvio Berlusconi this weekend stepped out of the race as a candidate for the job.
In response to questions posed by Bloomberg, Head of the National Bank of Poland Glapinski said that he wants to convince members of its MPC to take a more aggressive approach on inflation and to raise interest rates more than markets currently anticipate. The comments came after stronger than expected industrial production (16.7% Y/Y for December) and wage data (+11.2% Y/Y) on Friday. The Polish policy rate has been raised to 2.25% after four consecutive rate hikes as inflation accelerated faster than expected (8.6% Y/Y in December). Today, Polish retail sales data are scheduled for release. The zloty late on Friday reversed most of its intraday, risk-off driven losses after the Glapinski headlines hit the screens. EUR/PLN this morning trades in the 4.525 area.
Global Growth Momentum in Focus
Market movers today
Today's highlight will be the flash PMIs for January in the euro area, UK and US. Services activity will likely continue to be adversely affected by renewed COVID-19 headwinds, but it will be interesting to see whether the manufacturing sector is also slowing and price pressures continue to ease up.
Italy's presidential election kicks off today, but given the lack of clarity on candidates and broad public agreement among the parties, voting could well stretch over several days. There is a clear risk of political uncertainty returning over the longevity of Italy's unity government, if current Prime Minister Mario Draghi is elected as President.
Markets will also keep a close eye on the Russia-Ukraine developments. Later this week the FOMC meeting will be in market focus.
The 60 second overview
Russia Ukraine tensions: The meeting between Russian and US foreign ministers kept hopes for a diplomatic solution alive. The US has promised it will send a written response to Russian demands later this week. Over the weekend, the US foreign minister Anthony Blinken rejected pressure to immediately escalate sanctions on Russia as it would limit western options in the future. The US letter and the Russian reactions to it will be key in determining the future path of the conflict.
Natural gas prices have continued to decrease in recent days, also amid reports that China has sold LNG cargoes back to the market after it had stocked up enough supply to see it through the winter. FT meanwhile reports that the US is holding talks with Qatar and other large gas exporters to plan contingency measures in case a Russian invasion of Ukraine disrupts supplies to Europe. However, European reluctance to commit to fixed, long-term contracts and limited LNG terminal capacity could still create hurdles.
COVID-19: New cases remain extremely high in Europe and the US and moving sharply higher in some emerging markets and Japan. However, new cases seem to have peaked in the UK and US. If other countries soon follow suit, it supports our view that we are indeed at "peak restrictions". In mainland China, new cases remain record-high and although the government has eased its zero-covid policy slightly, the tolerance for local outbreaks is still very low, especially ahead of the Winter Olympics and Chinese New Year.
ECB: December minutes last week showed increasing divisions and uncertainty among the ECB Governing Council members about the inflation outlook. Over the weekend, Finland's Olli Rehn said an increase in borrowing costs in 2023 is logical, in the absence of "any new economic disruptions". Ireland's Gabriel Makhlouf is a bit more cautious, saying he does not expect any rate hikes, but noted that risks of second-round effects of inflation, such as wages rising without productivity increases, could prompt action.
Equities: The growth sell off stalled on Friday. Investors did not buy the dip, but continued to sell cyclicals rather than outright growth. S&P 500 closed down -1.9%, Nasdaq -2.7%, Dow -1.3% and Russell 2000 -1.8%. This marked the third straight week of declines (S&P -8% and Nasdaq -15% YTD). In sectors, consumer staples, real estate and utilities were most resilient, while materials, energy and financials fared the worst on Friday. In fact, the winners over the past week has not been the outright value sectors, but defensives.
FI: Global bond yields ended lower last week, with 10Y US Treasuries moving below 1.8% and 10Y German government bond ended in negative territory, after having tested the 0%-level last week. The US Treasury curve continues to flatten, as the market is expecting the Federal Reserve to move rate hikes forward and begin already in March.
FX: Scandies in the hands of risk sentiment. The FOMC meeting is the key event this week.
Credit: Last week ended on a negative tone with relatively large widening in credit spreads on Friday. The sell-off was driven by geopolitical tensions on the Russian-Ukrainian border coupled with mixed Q4 corporate earnings (i.e. Netflix and Siemens Gamesa). Itraxx main widened 1.7bp to 55.3bp while Xover widened 7.8bp to 269.5bp.
Technical Outlook and Review
DXY:
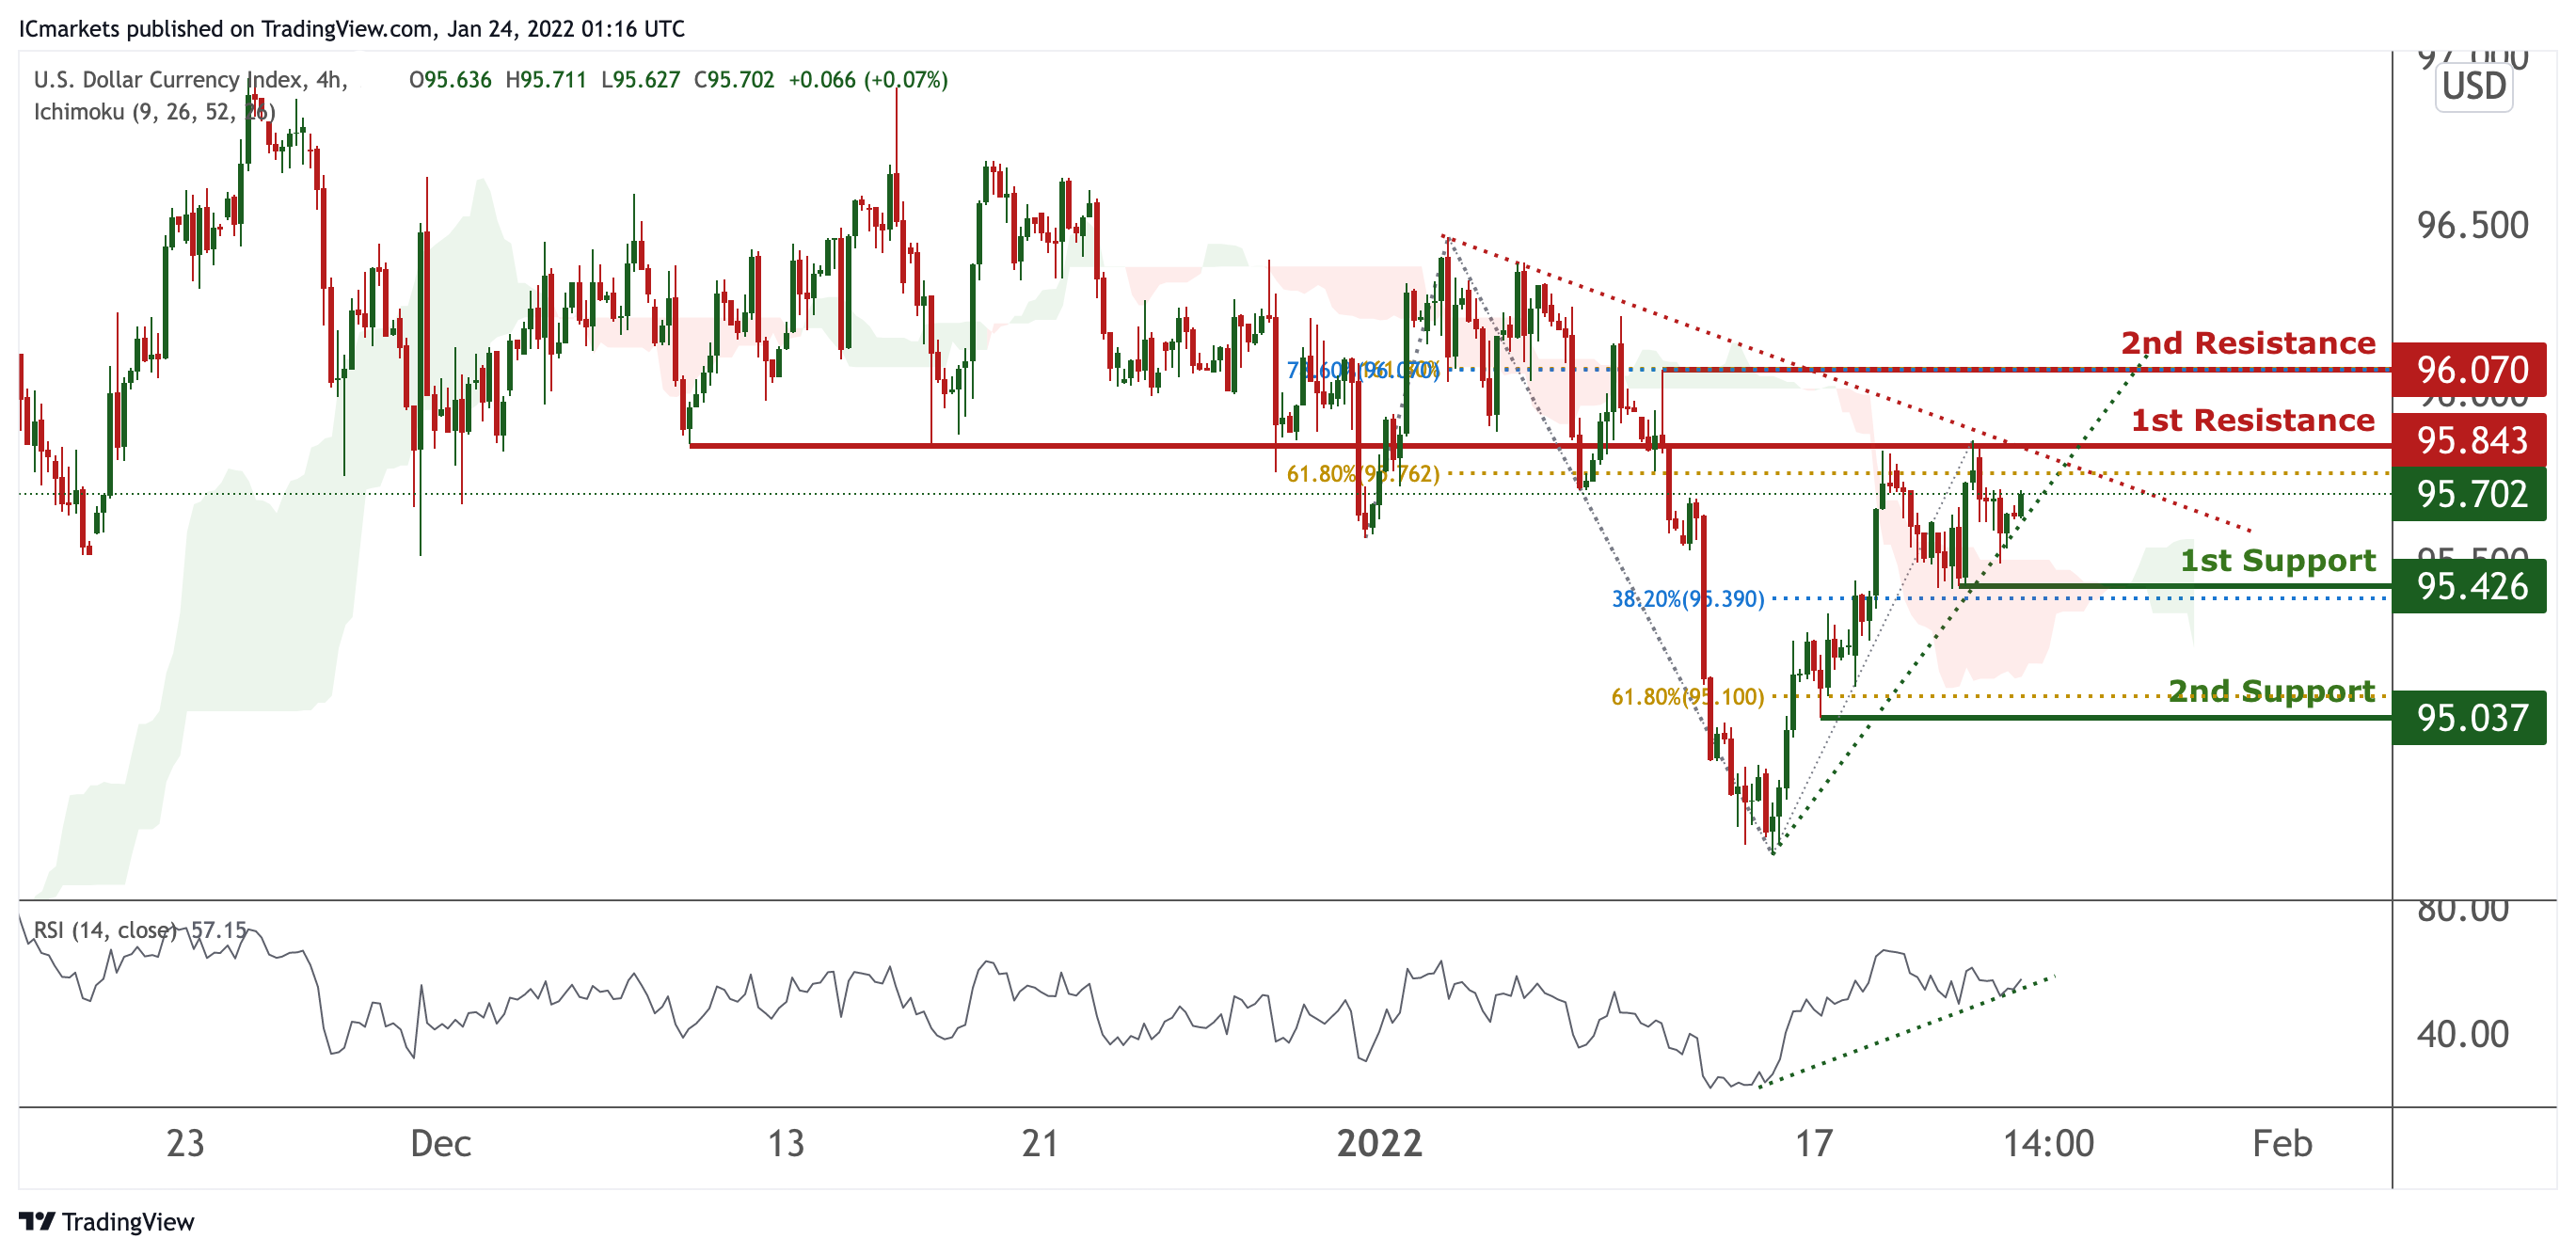
On the H4 timeframe, prices are consolidating in a triangle pattern and are on bullish momentum. We would expect potentially further bullish continuation from our 1st support at 95.426 in line with 38.2% Fibonacci retracement towards our 1st resistance at 95.843 in line with 61.8% Fibonacci retracement. RSI is showing bullish momentum and prices are trading above our Ichimoku clouds, further supporting our bullish bias.
Areas of consideration:
- H4 time frame, 1st resistance at 95.843
- H4 time frame, 1st support at 95.426
XAU/USD (GOLD):
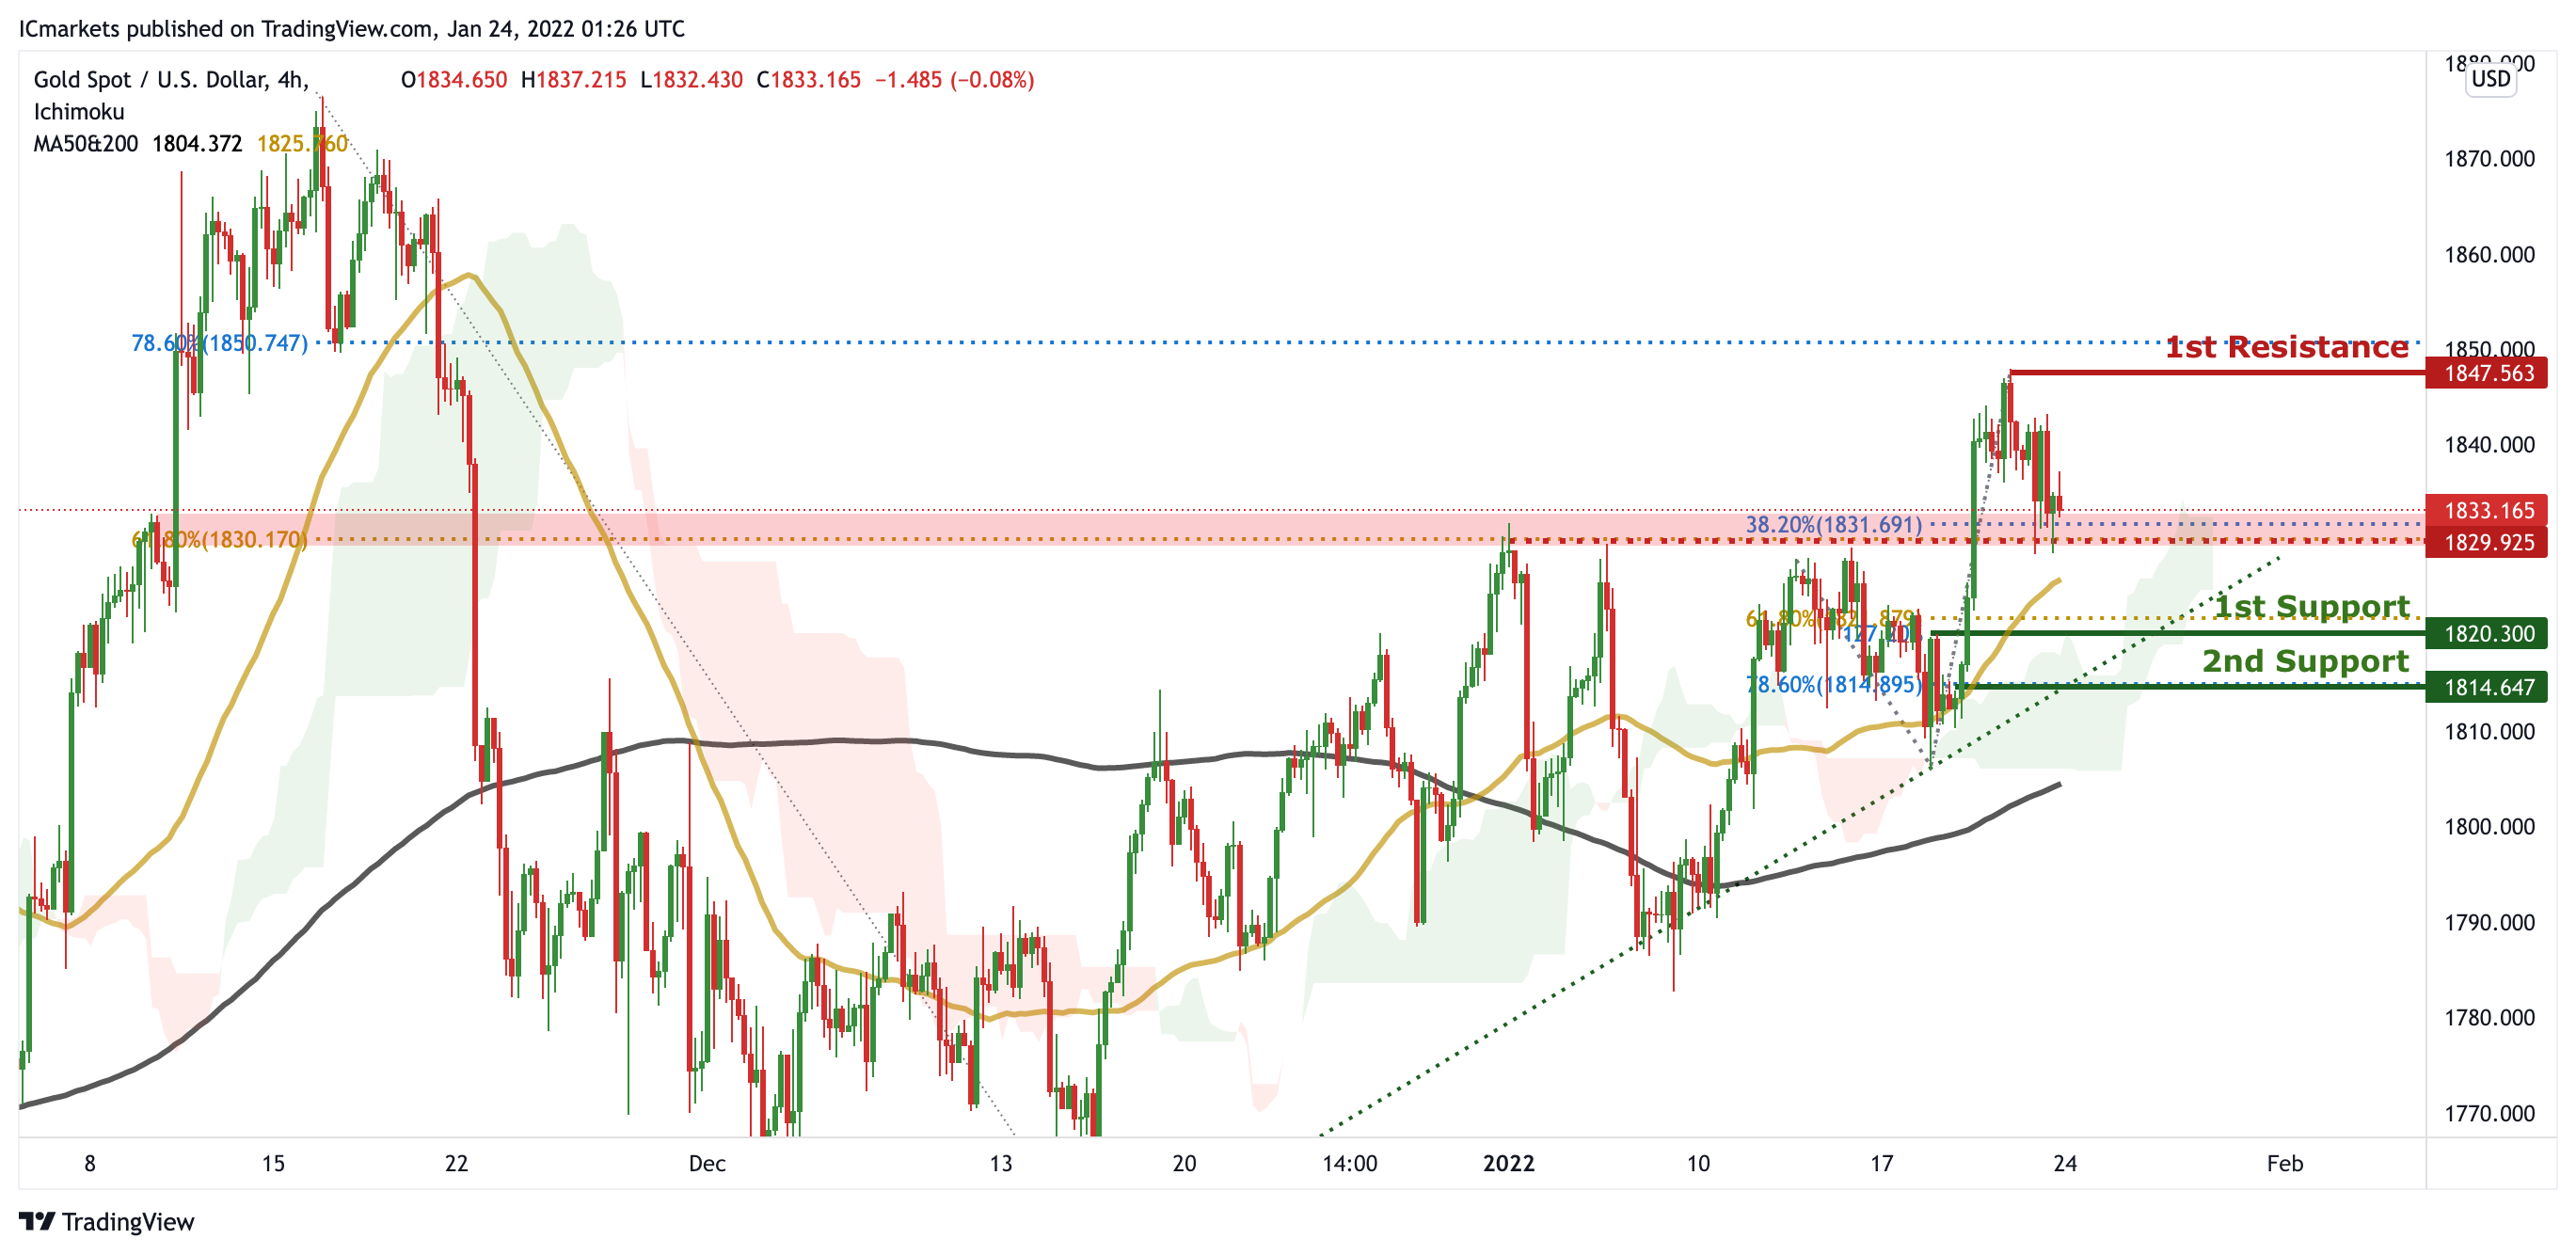
On the H4 chart, prices are on bullish momentum and abiding to our ascending trendline. We would watch for our intermediate level for confirmation in price action. If prices dips below our intermediate level, we would expect it to dip towards our 1st support at 1820.300 in line with 61.8% Fibonacci extension. Alternatively, prices may travel higher towards our 1st resistance at 1847.563 in line with 78.6% Fibonacci retracement. Our bullish bias is further supported by our MA 50 & 200 crosses as well as prices trading above our ichimoku cloud support.
Areas of consideration:
- 4h 1st support at 1820.300
- 4h intermediate resistance at 1829.925
GBP/USD
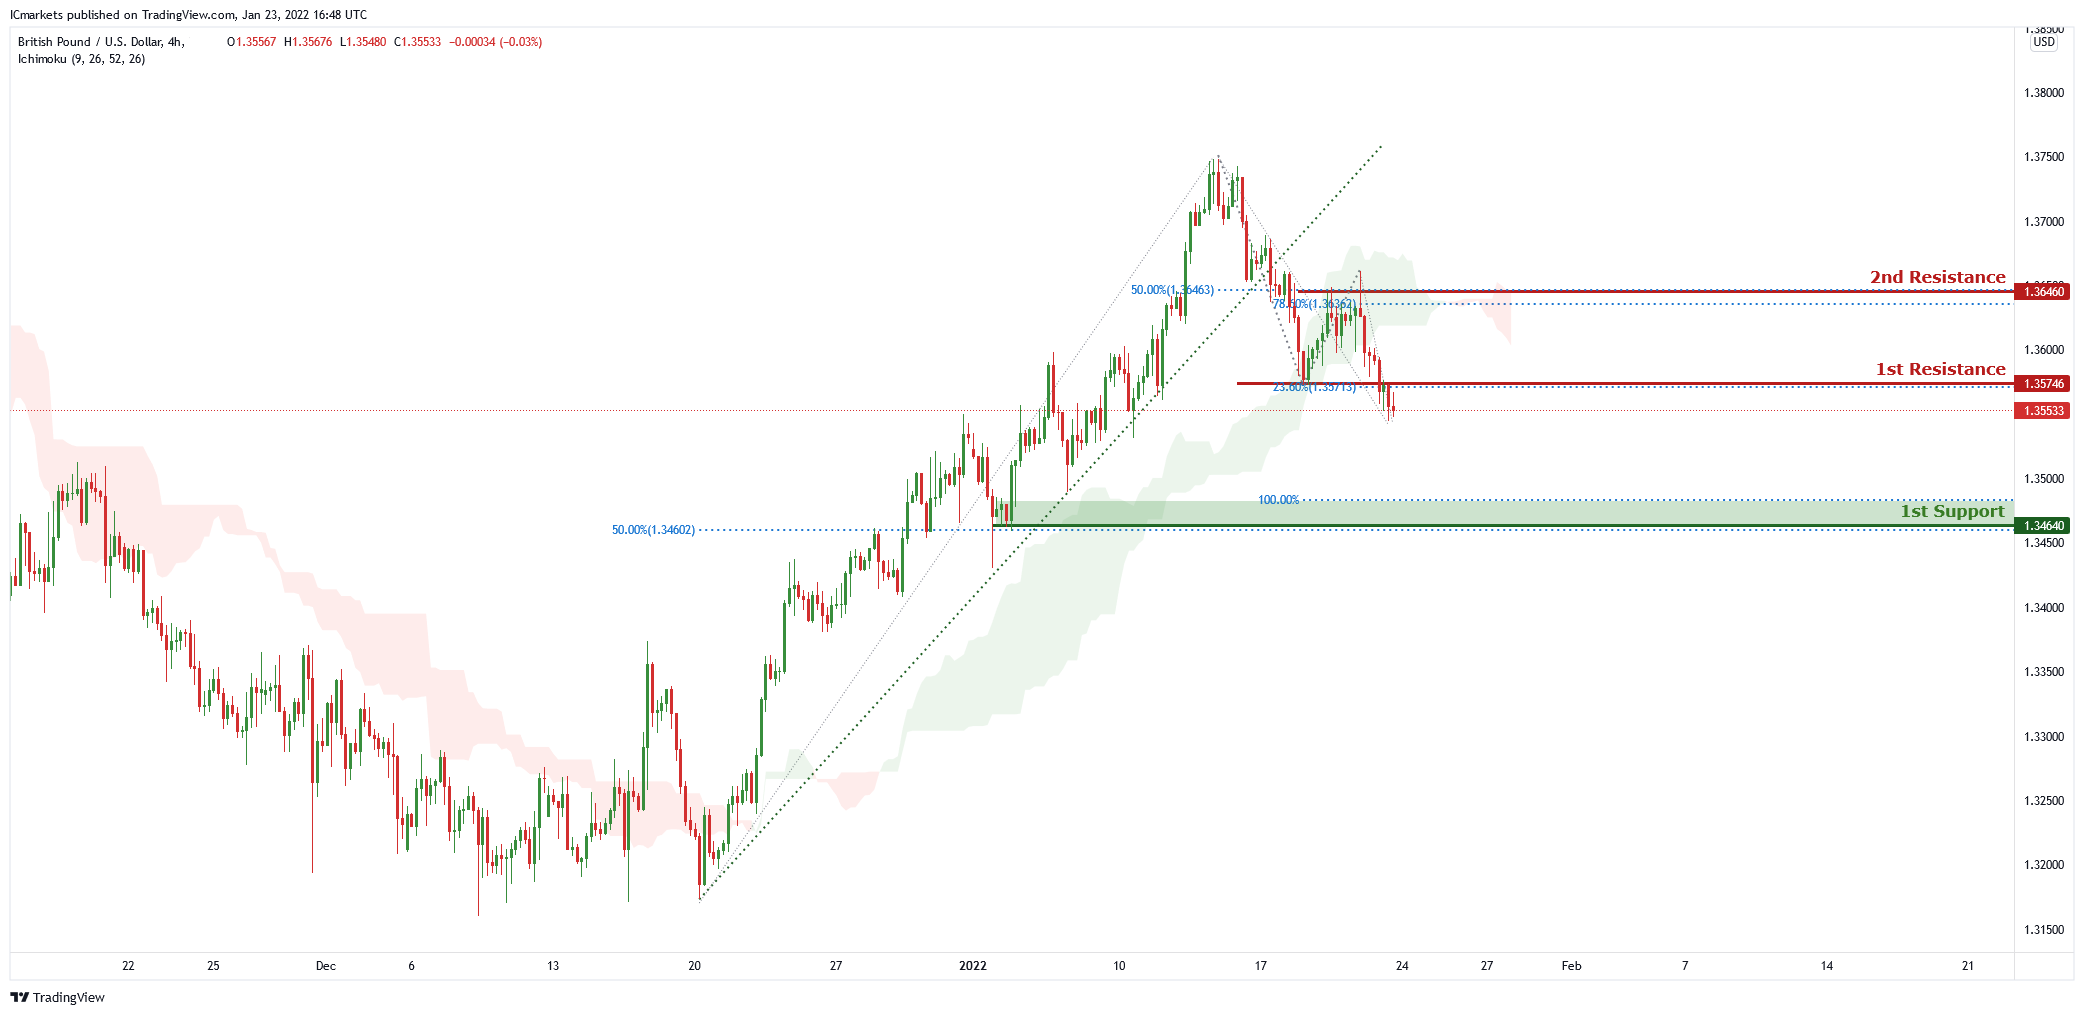
On the H4 chart price has recently broken out of the ascending trendline and near 1st resistance level of 1.35746 which is also 23.6% Fibonacci retracement. Price can potentially dip to the 1st support level of 1.34640 which is also 100% Fibonacci projection and 50% Fibonacci retracement. Our bearish bias is supported by the ichimoku cloud indicator as price is trading below it.
Areas of consideration:
- H4 1st resistance at 1.35746
- H4 1st support at 1.34640
USD/CHF:
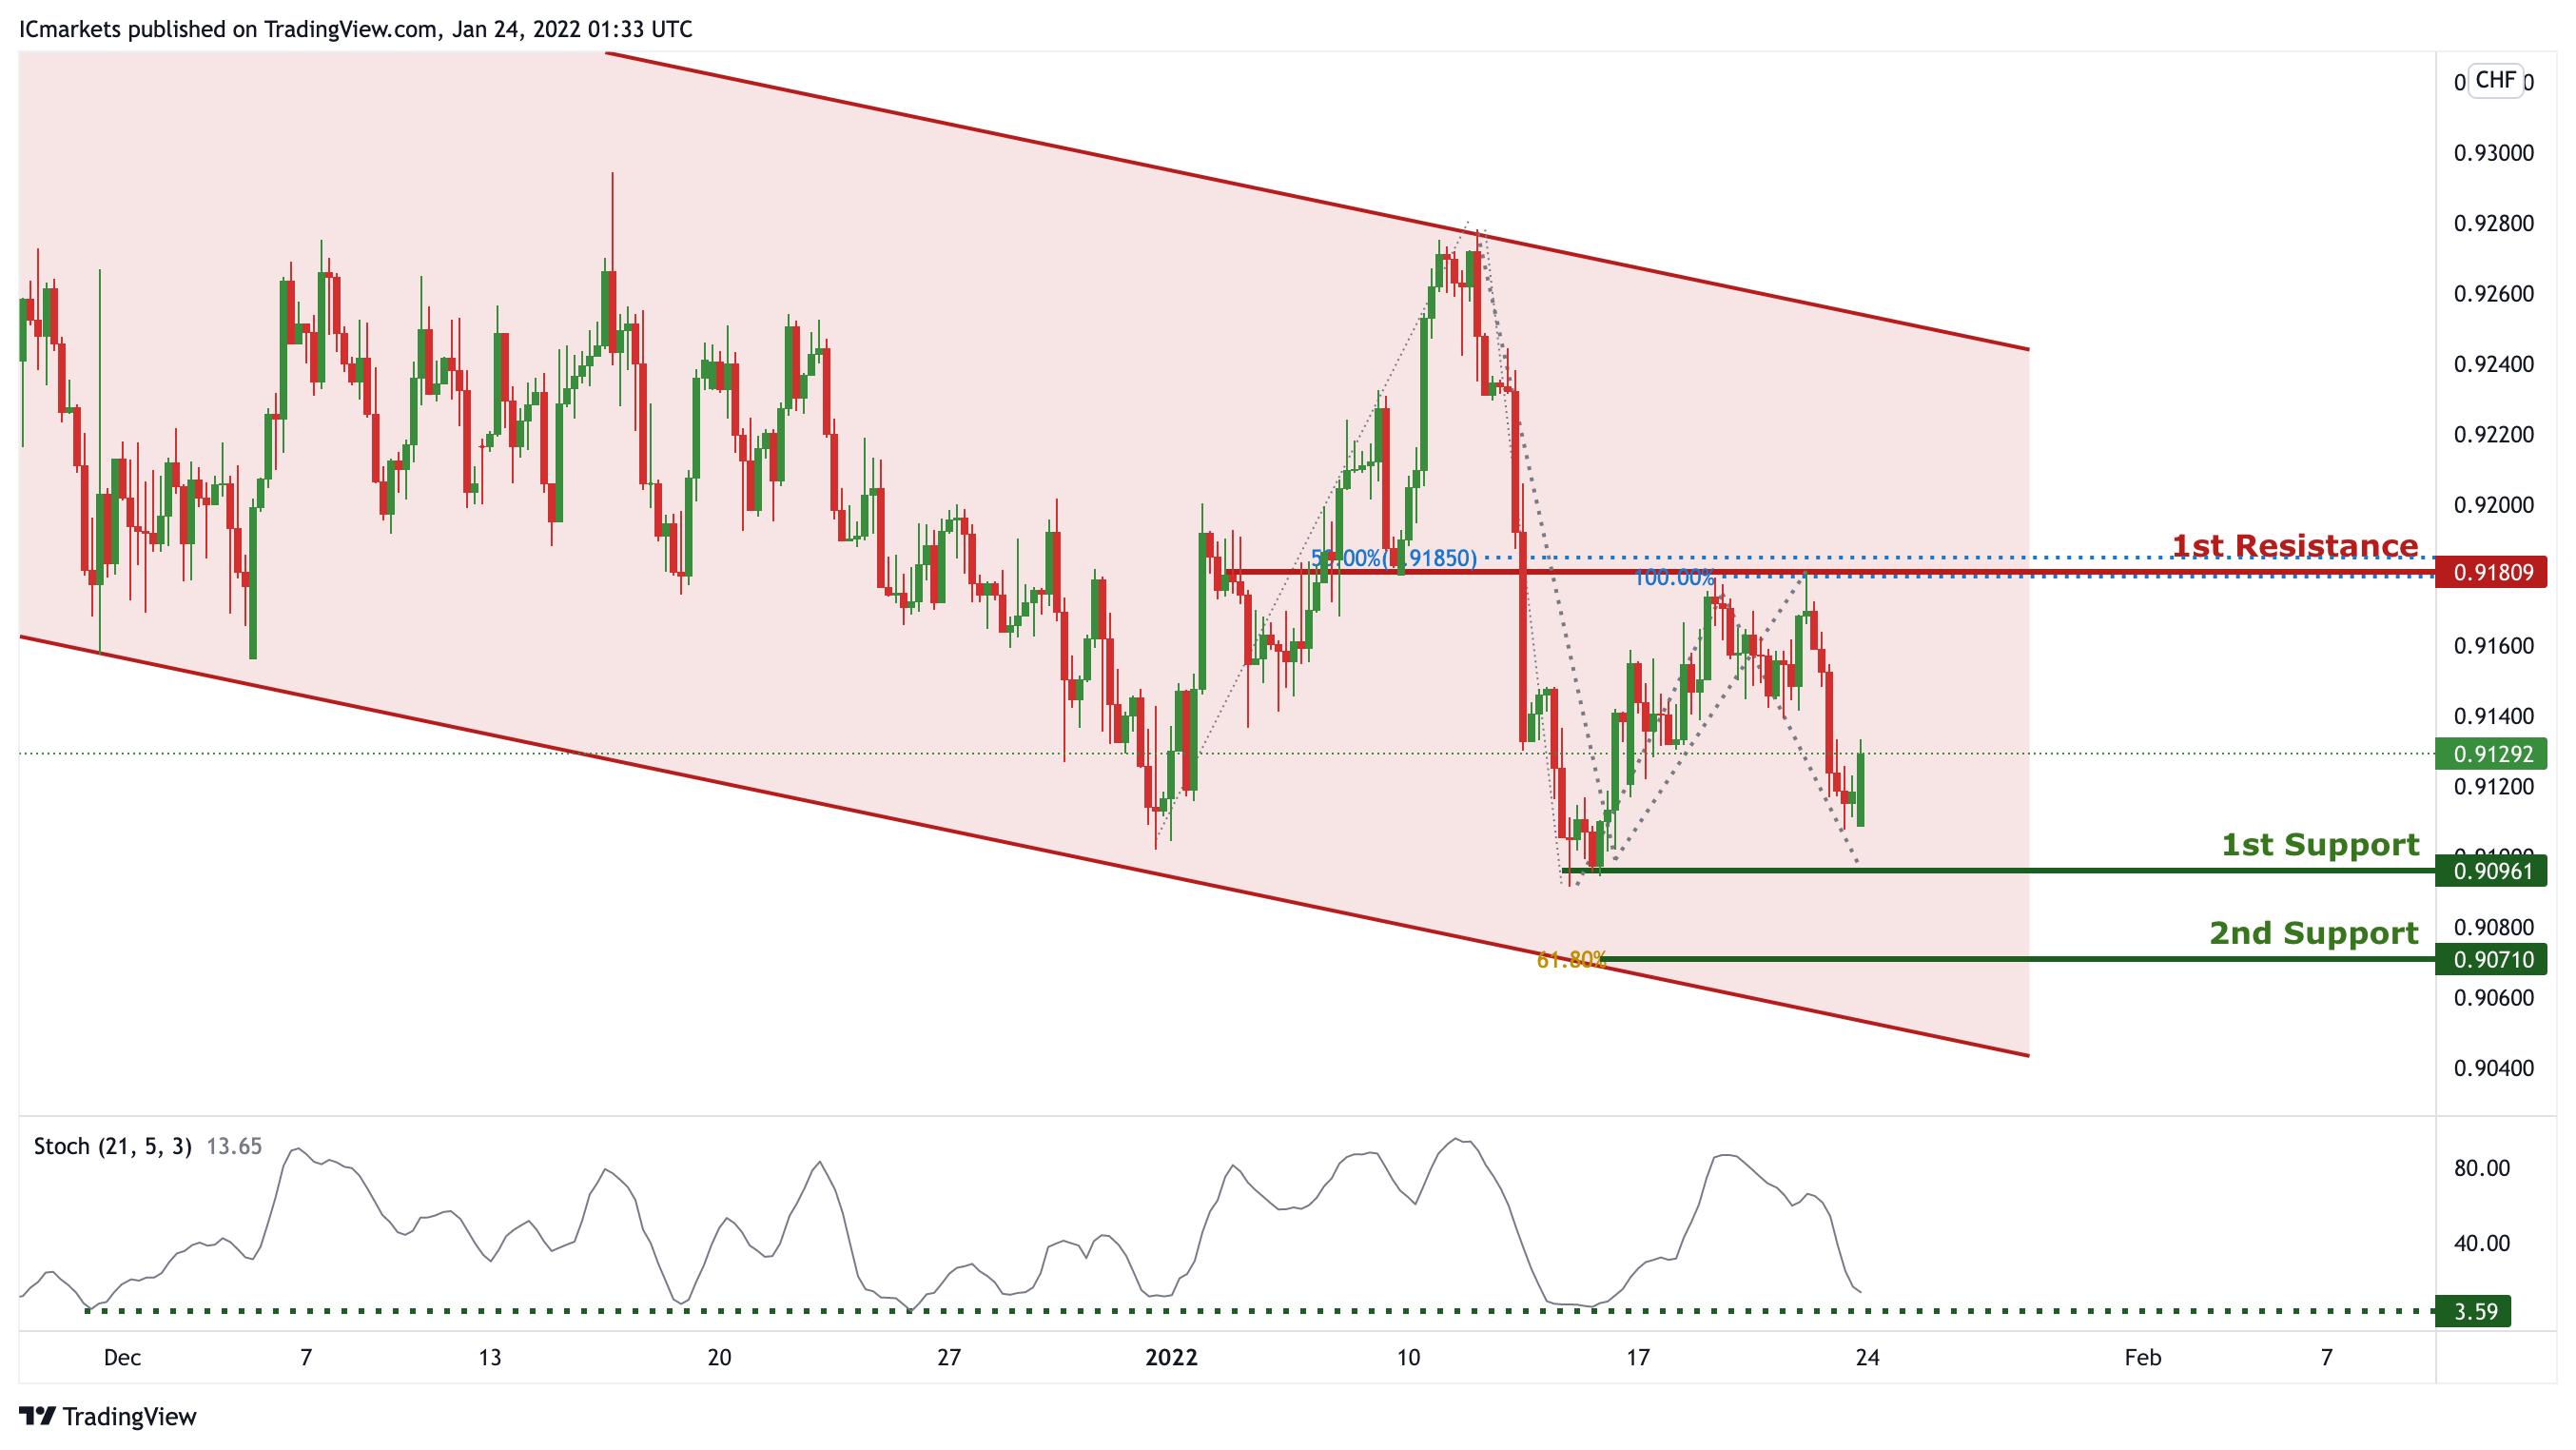
In reference to last week’s analysis, price indeed dropped from 1st Resistance and approaching 1st Support @ 0.90961. On the H4 timeframe, price is abiding to a descending channel, signifying a bearish momentum. However, we can expect price to make a short-term bullish bounce from 1st Support in line with previous swing low towards 1st Resistance in line with 100% Fibonacci projection and 50% Fibonacci retracement. Our short-term bullish bias is further supported by stochastic indicator where the %K line is approaching the support level.
Areas of consideration:
- Watch 1st Support at 0.90961
- Watch 1st Resistance at 0.91809
EUR/USD :
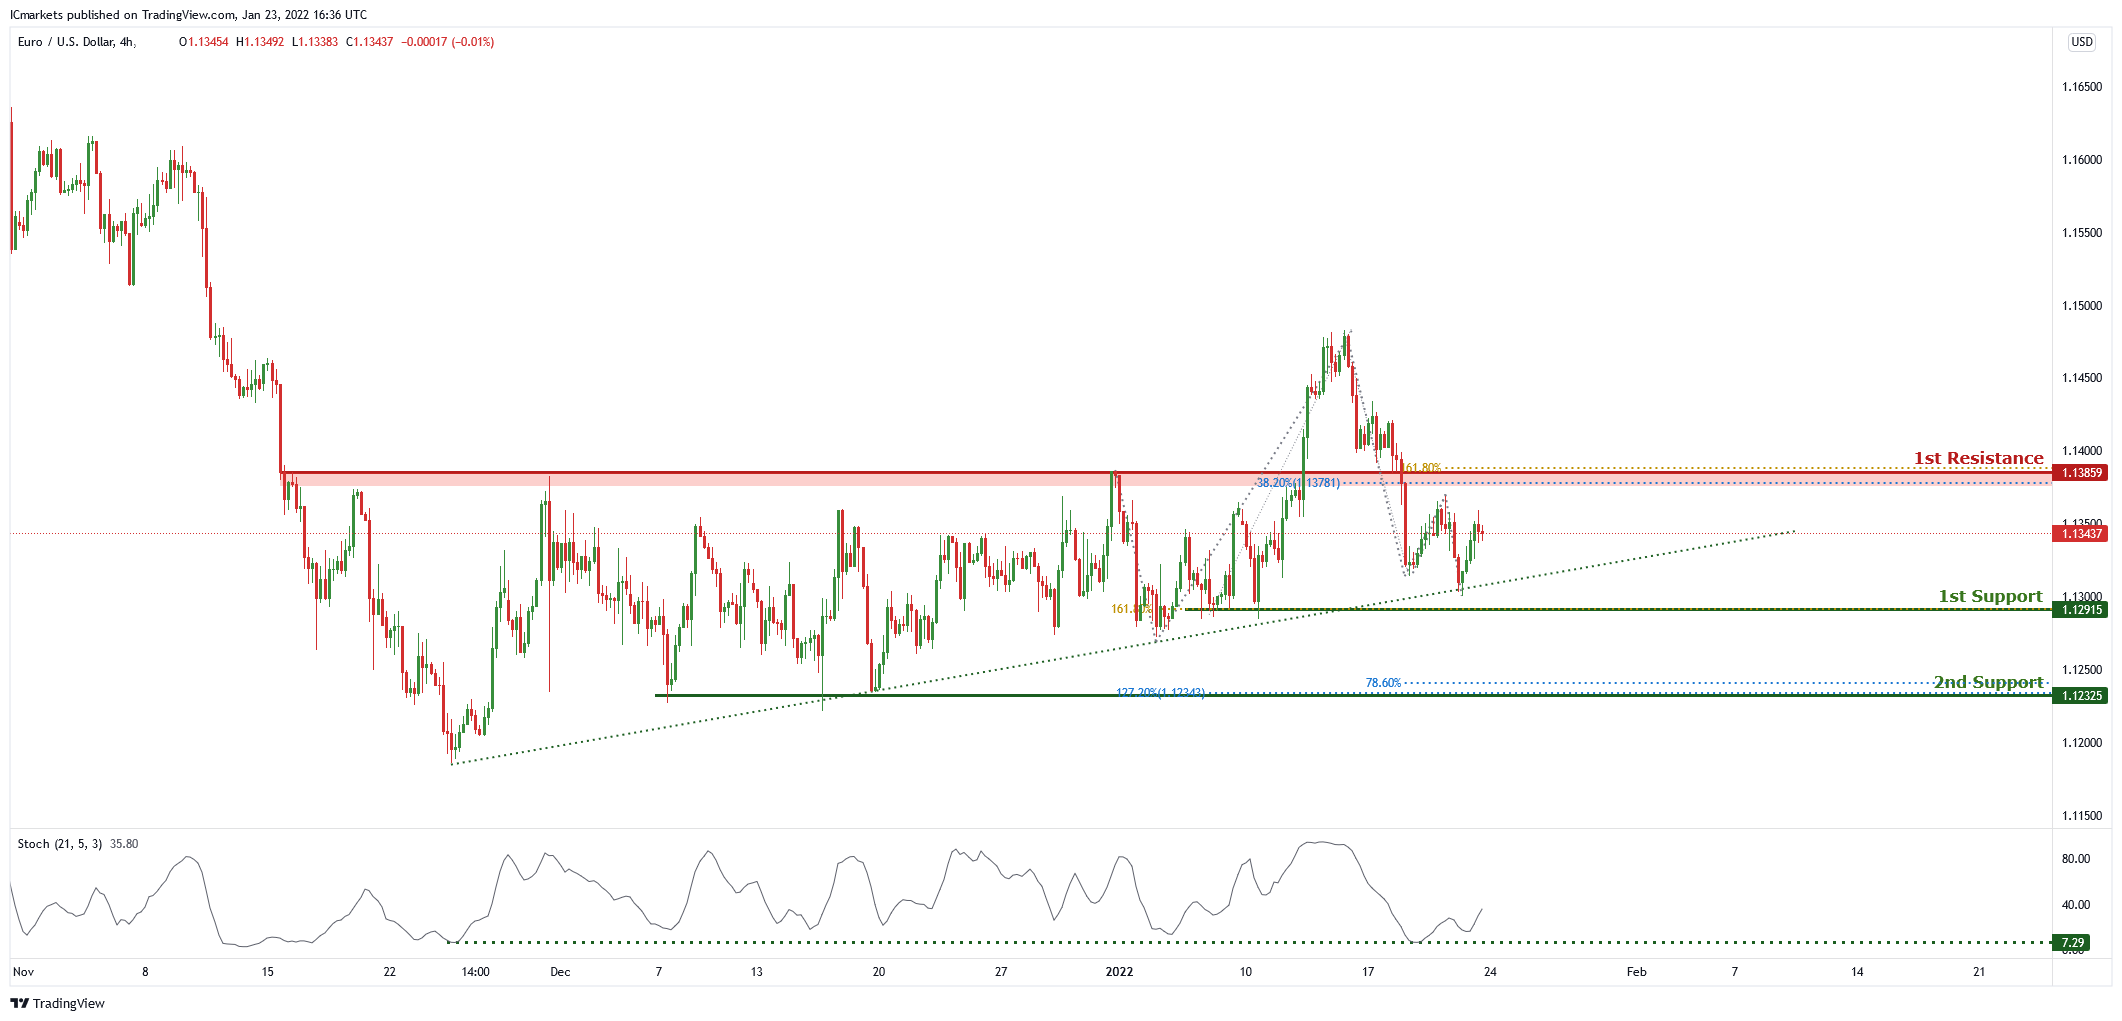
On the H4 chart , price is abiding by the ascending trendline and is in the middle of the 1st resistance of 1.13859 which is also 38.2% Fibonacci retracement, 61.8% Fibonacci projection and 1st support level of 1.12915 which is also 161.8% Fibonacci projection. Price can potentially go to the 1st resistance level. Our bullish bias is supported by the stochastic indicator as it is near support level.
Areas of consideration
- 1st resistance at 1.13859
- 1st support at 1.12915
USD/JPY:
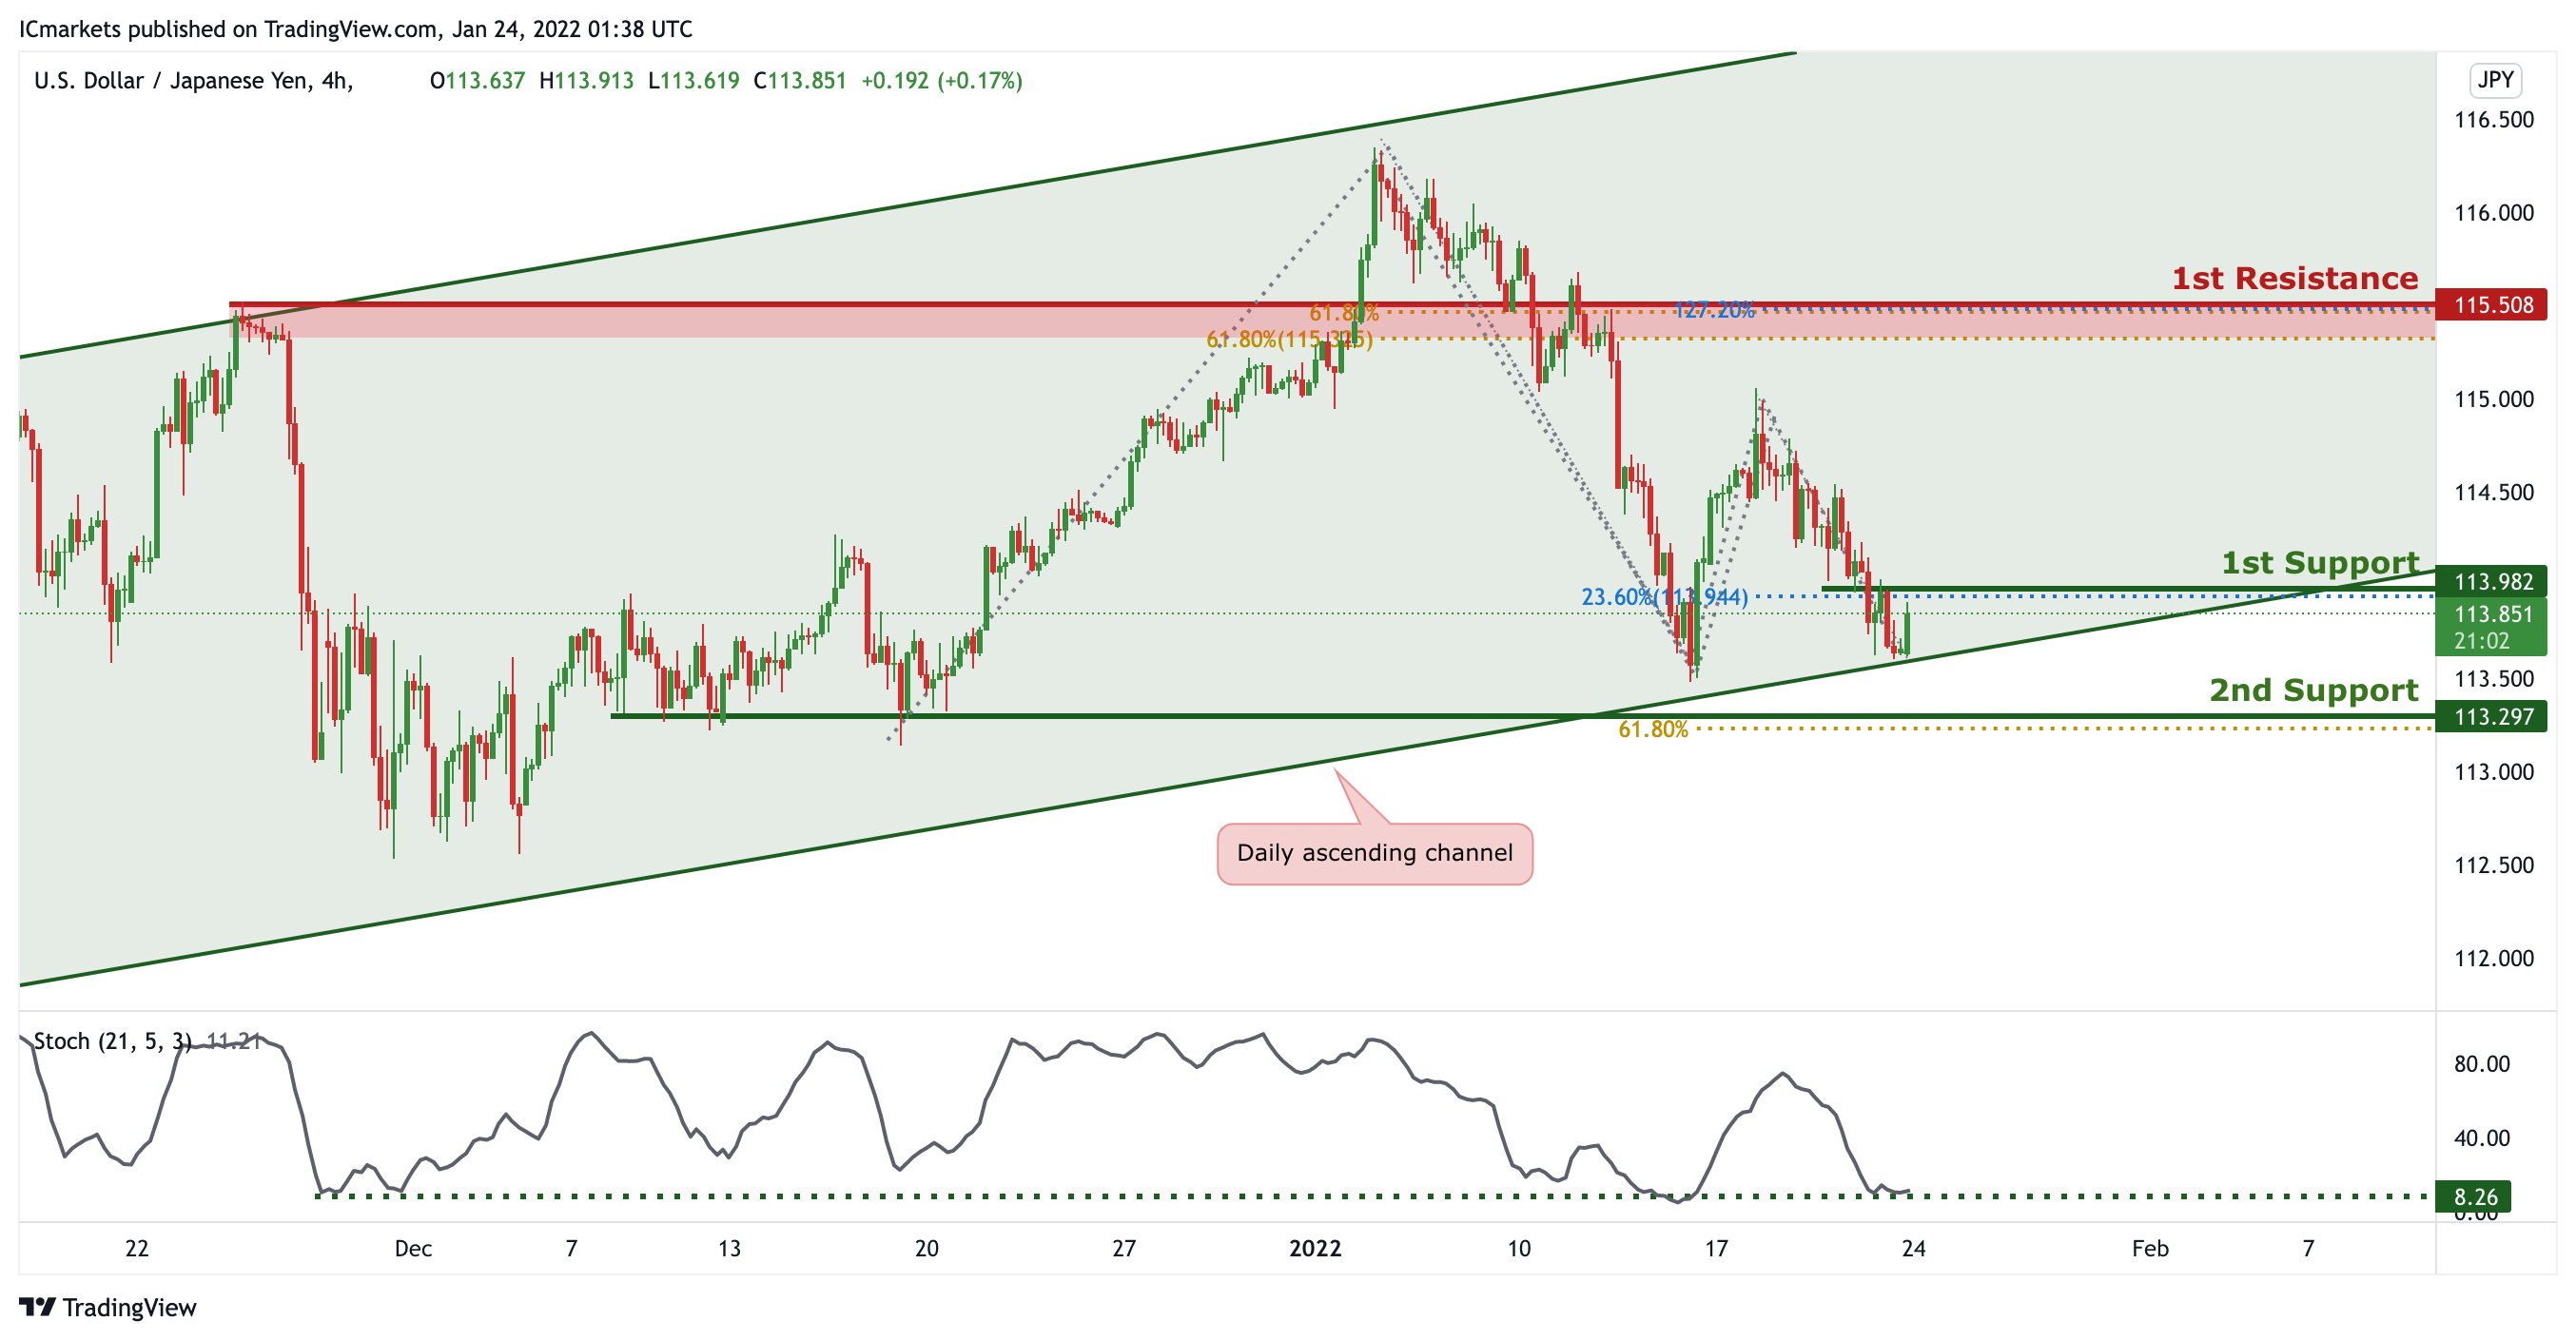
On the H4 timeframe, is abiding to the ascending channel on the daily, signifying an overall bullish momentum. We can now expect the price to bounce from 1st Support in line with 23.6% Fibonacci retracement towards 1st Resistance in line with 61.8% Fibonacci projection and 61.8% Fibonacci retracement. Our bullish bias is further supported by the stochastic indicator where the %K line is at the support level.
Areas of consideration:
- H4 1st resistance level 115.508
- H4 1st support level 113.982
AUD/USD:
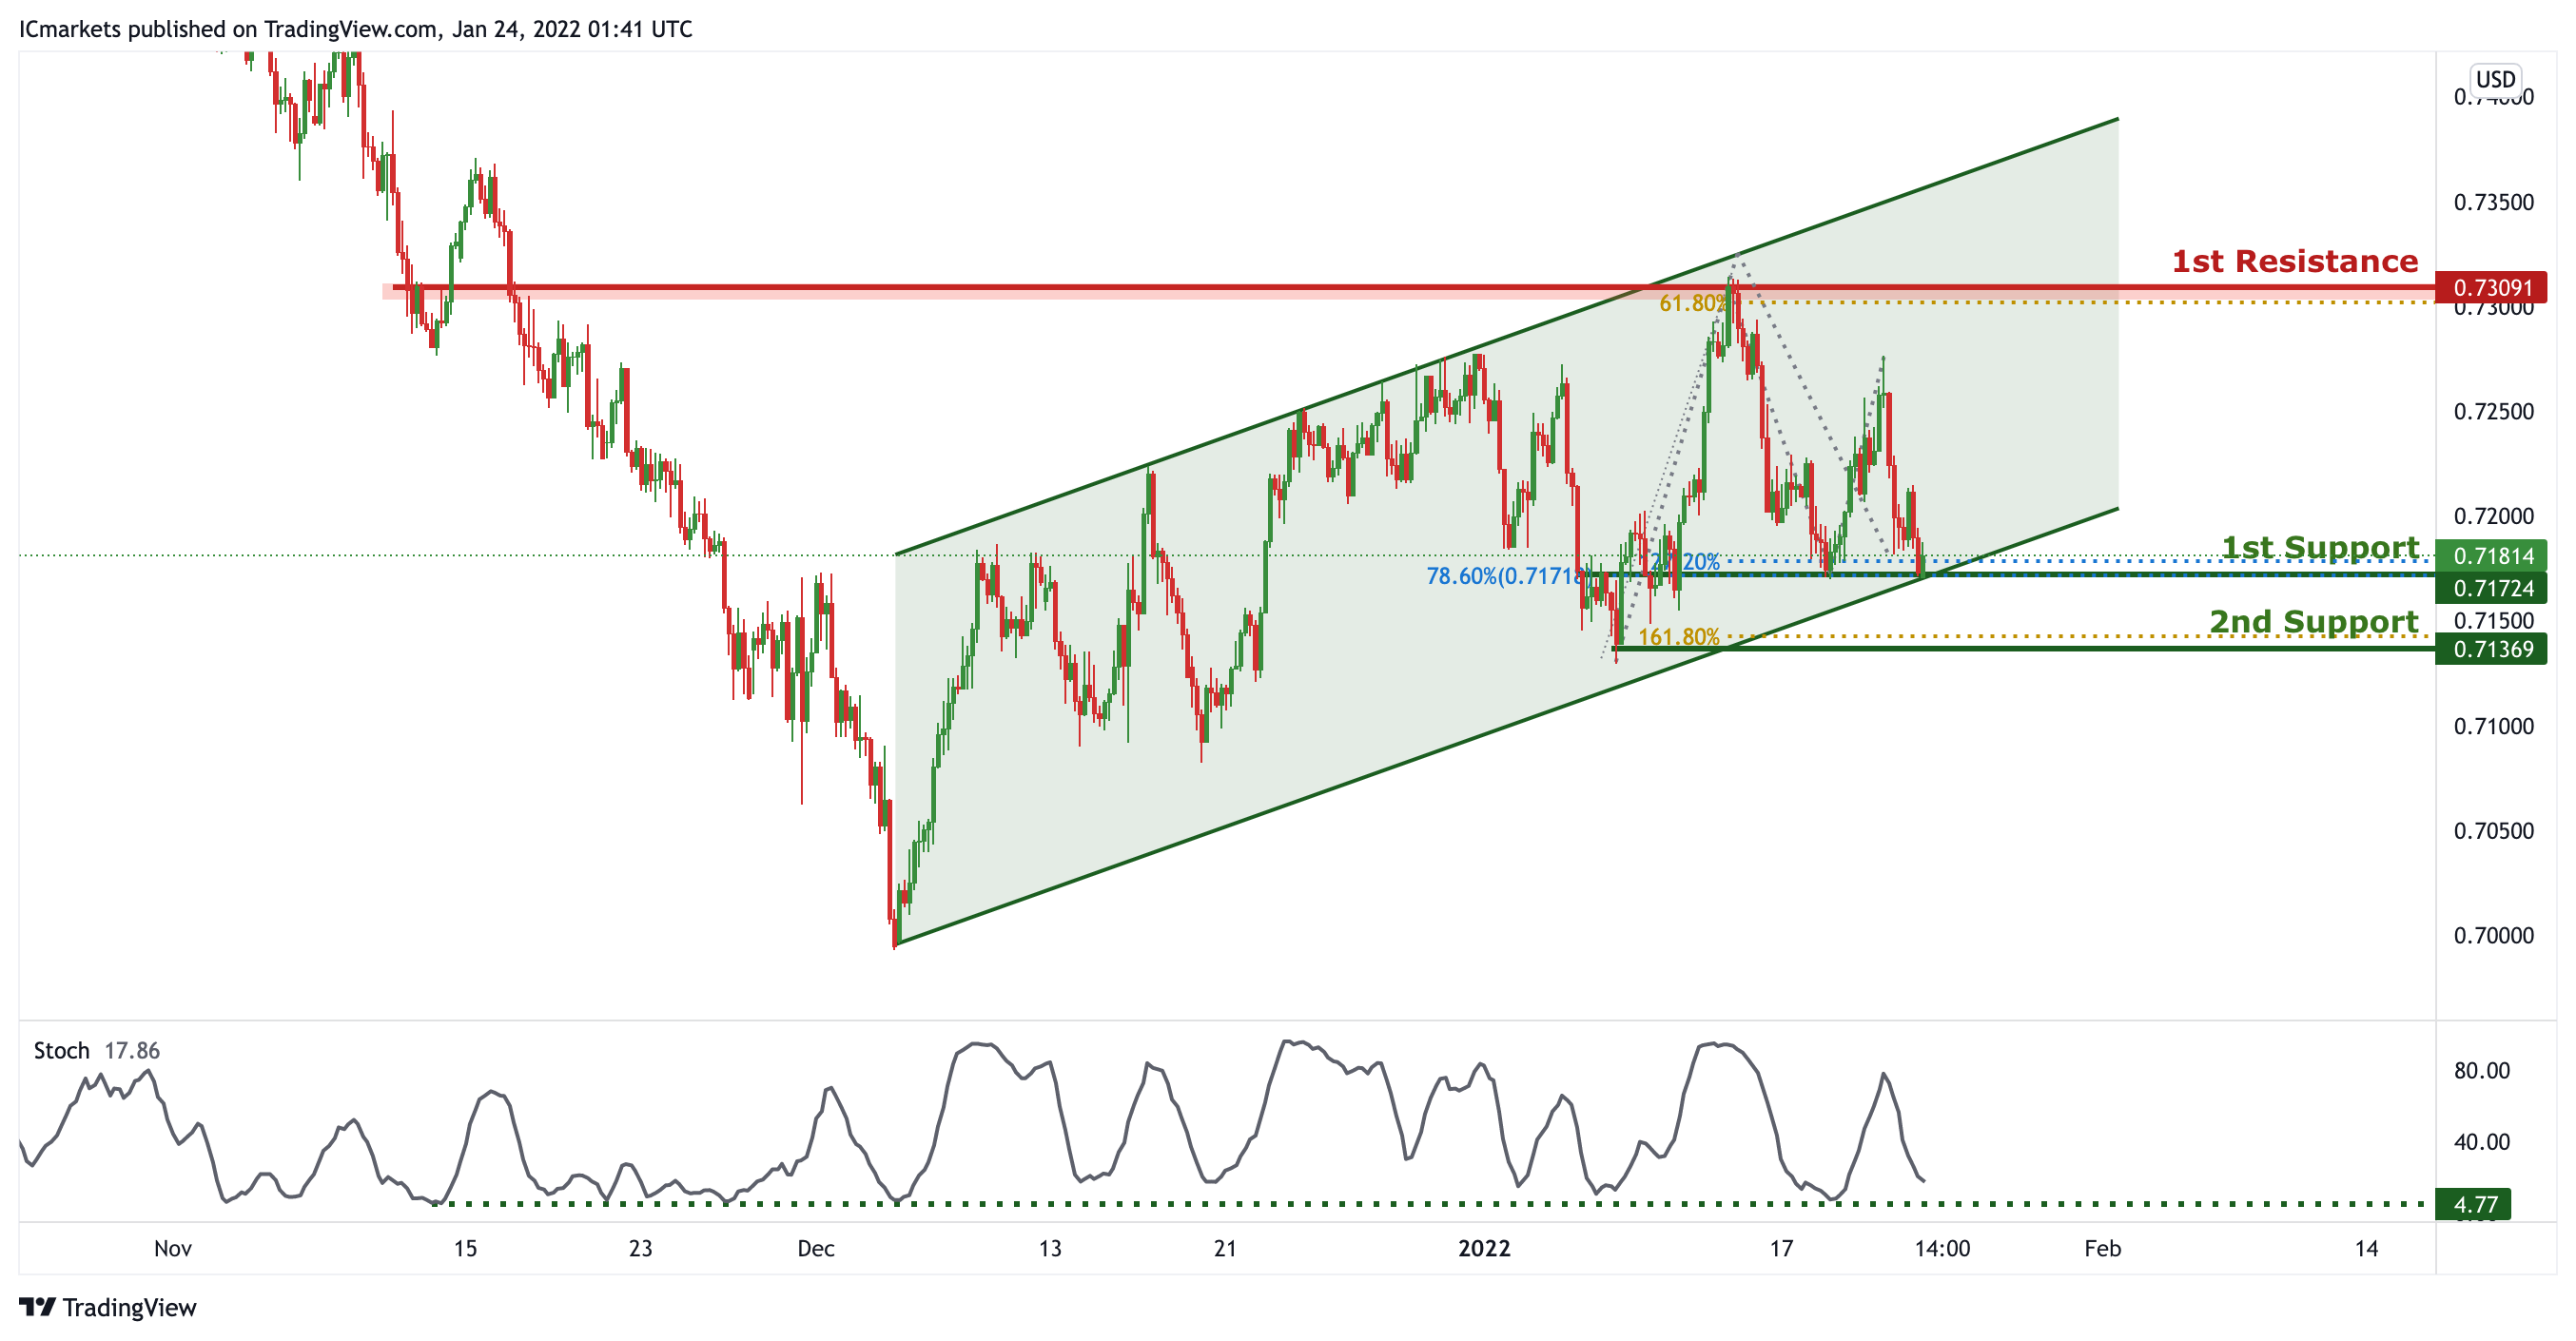
On the H4, price is reacting within the ascending channel, signifying an overall bullish momentum. Price is approaching the 1st Support, we can expect to see price make a bullish bounce from 1st Support in line with 127.2% Fibonacci projection, 78.6% Fibonacci retracement and ascending channel support towards 1st Resistance in line with previous swing high and 61.8% Fibonacci projection. Our short-term bearish bias is further supported by the RSI indicator where it is approaching the support level.
Areas of consideration:
- H4 1st Support level 0.71724
- H4 1st resistance level 0.73091
NZD/USD:
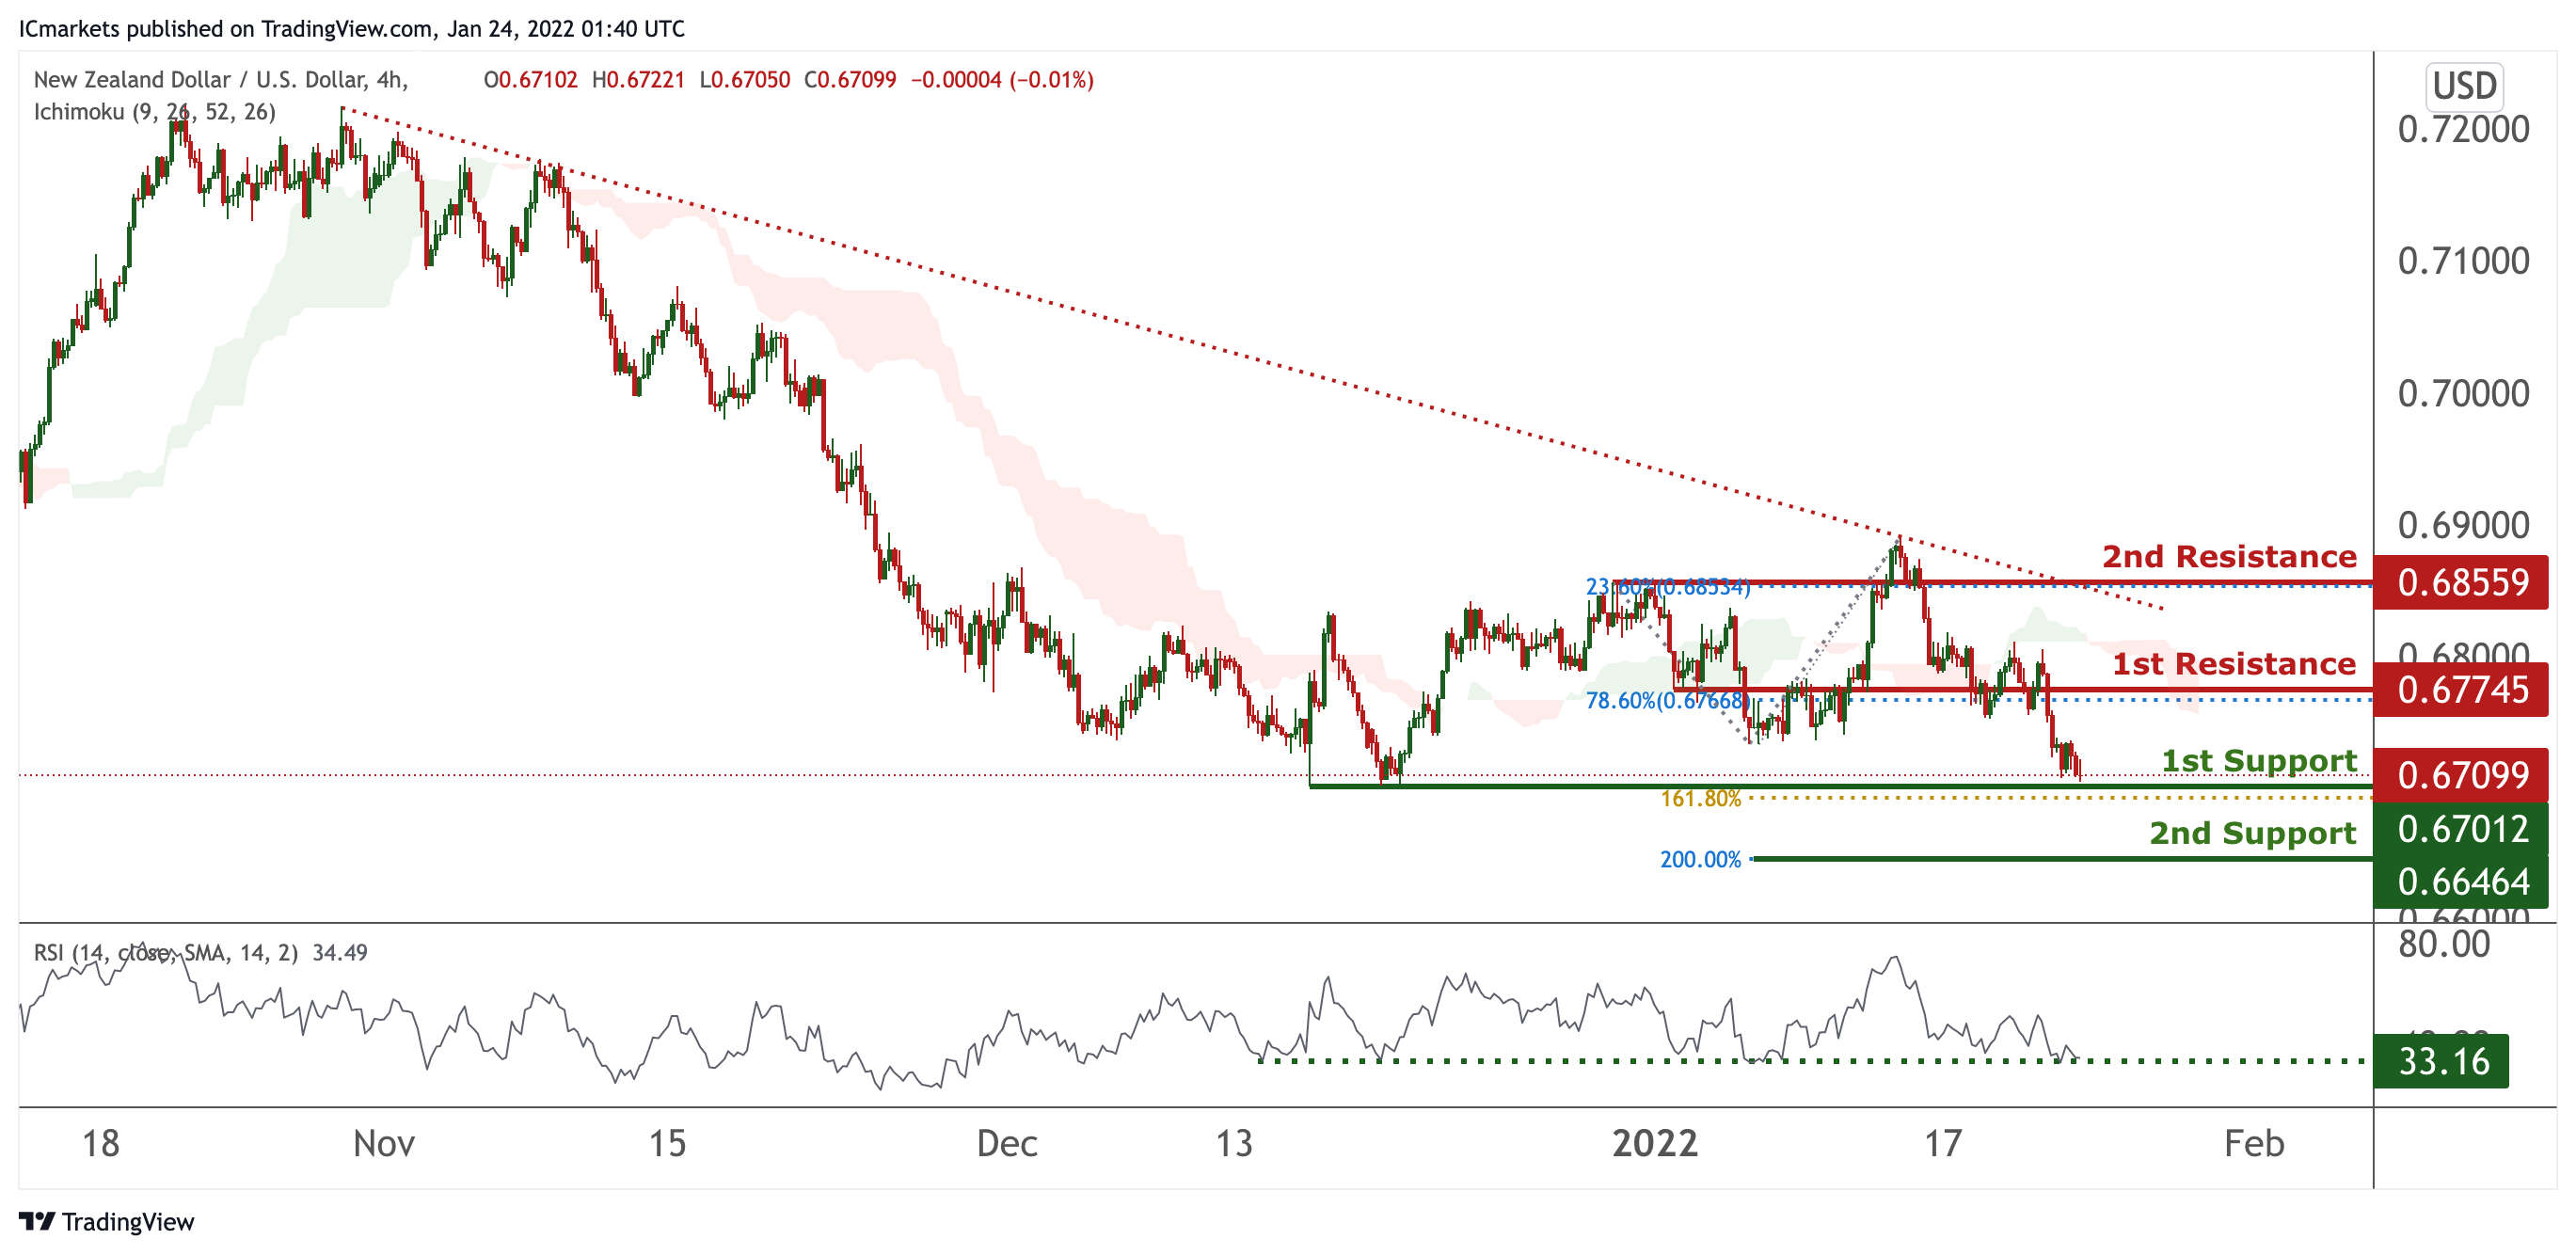
On the H4, prices are on bearish momentum and abiding to a bearish trendline. We see the potential for a bounce from our 1st support at 0.67012 in line with 161.8% Fibonacci projection towards our 1st resistance at 0.67745 in line with 78.6% Fibonacci retracement. RSI is at a level where bounces occurred previously. Alternatively, our stop loss will be placed at our 2nd support at 0.66464 in line with 200% Fibonacci Projection.
Areas of consideration:
- H4 time frame, 1st resistance at 0.67745
- H4 time frame, 1st support at 0.67012
USD/CAD:
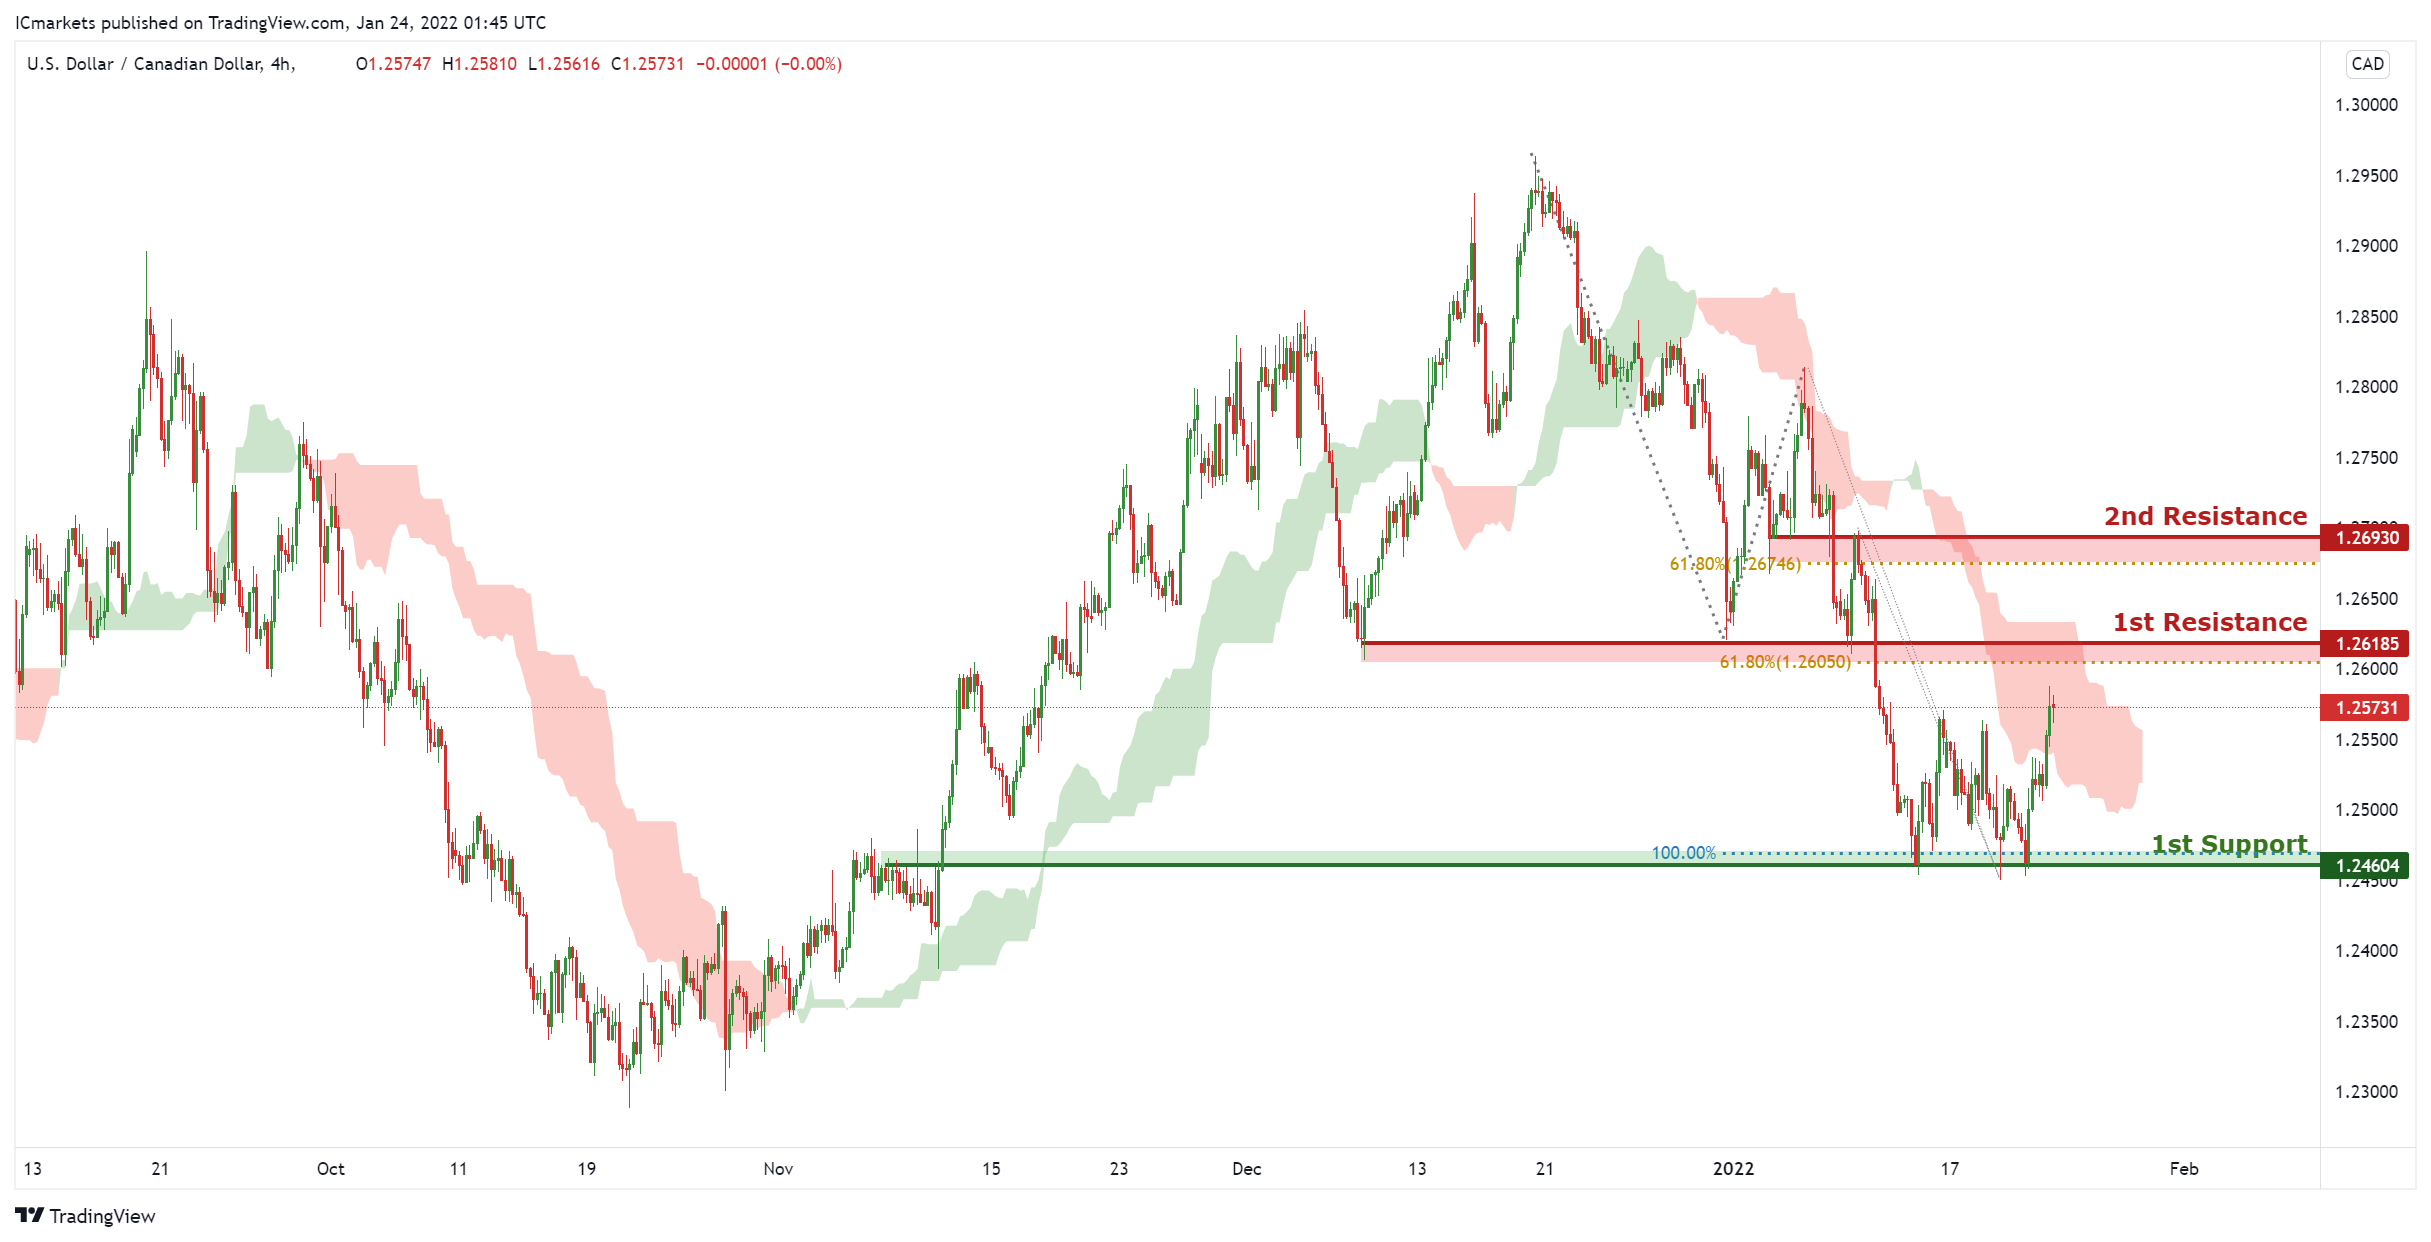
On the H4, with price approaching the resistance of the ichimoku cloud, we have a bearish bias that price will drop from our 1st resistance at 1.26185 which is in line with horizontal overlap resistance and 61,8% Fibonacci retracement to 1st support at 1.24604, which is in line with horizontal overlap support and 100% Fibonacci projection level. Alternatively, price may break 1st resistance structure and head for 2nd resistance at 1.26930, which coincides with horizontal overlap resistance and 61.8% Fibonacci retracement.
Areas of consideration:
- H4 time frame, 1st support at 1.24604
- H4 time frame, 1st resistance at 1.26185
OIL:
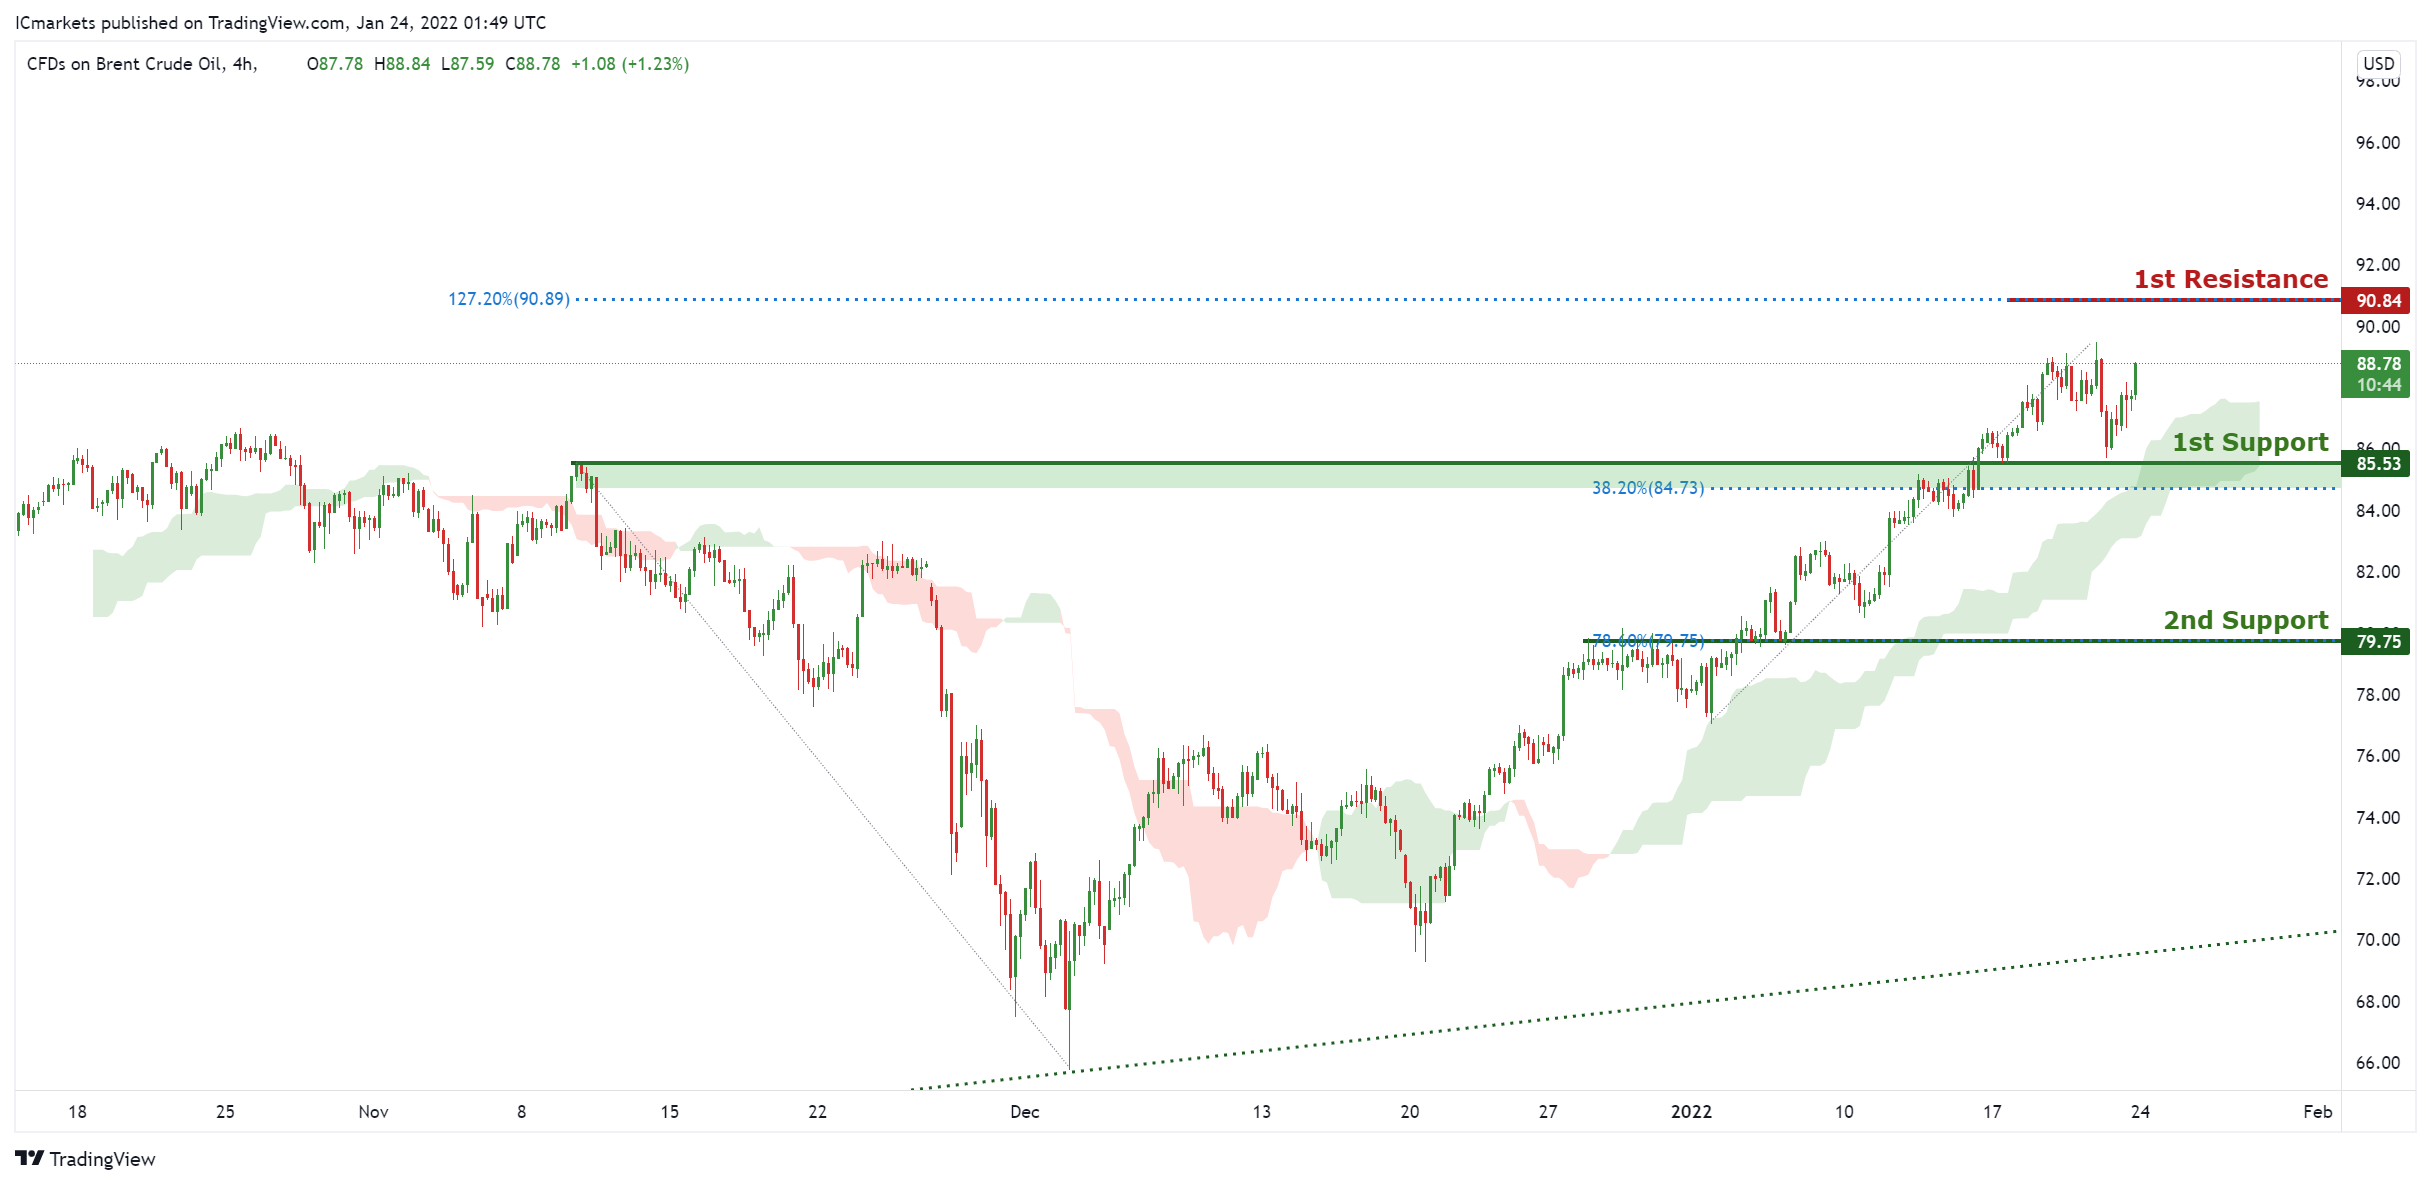
On the H4, with price moving above the ichimoku cloud, we have a bullish bias that price will rise to our 1st resistance at 90.84 which is in line with horizontal swing high resistance and 127.2% Fibonacci extension level from 1st support at 85.53, which is in line with horizontal overlap support and 32.8% Fibonacci retracement. Alternatively, price may break 1st support structure and head for 2nd support at 79.75, which coincides with horizontal overlap support and 78.6% Fibonacci retracement.
Areas of consideration:
- H4 time frame, 1st resistance of 90.84
- H4 time frame, 1st support of 85.53
Dow Jones Industrial Average:
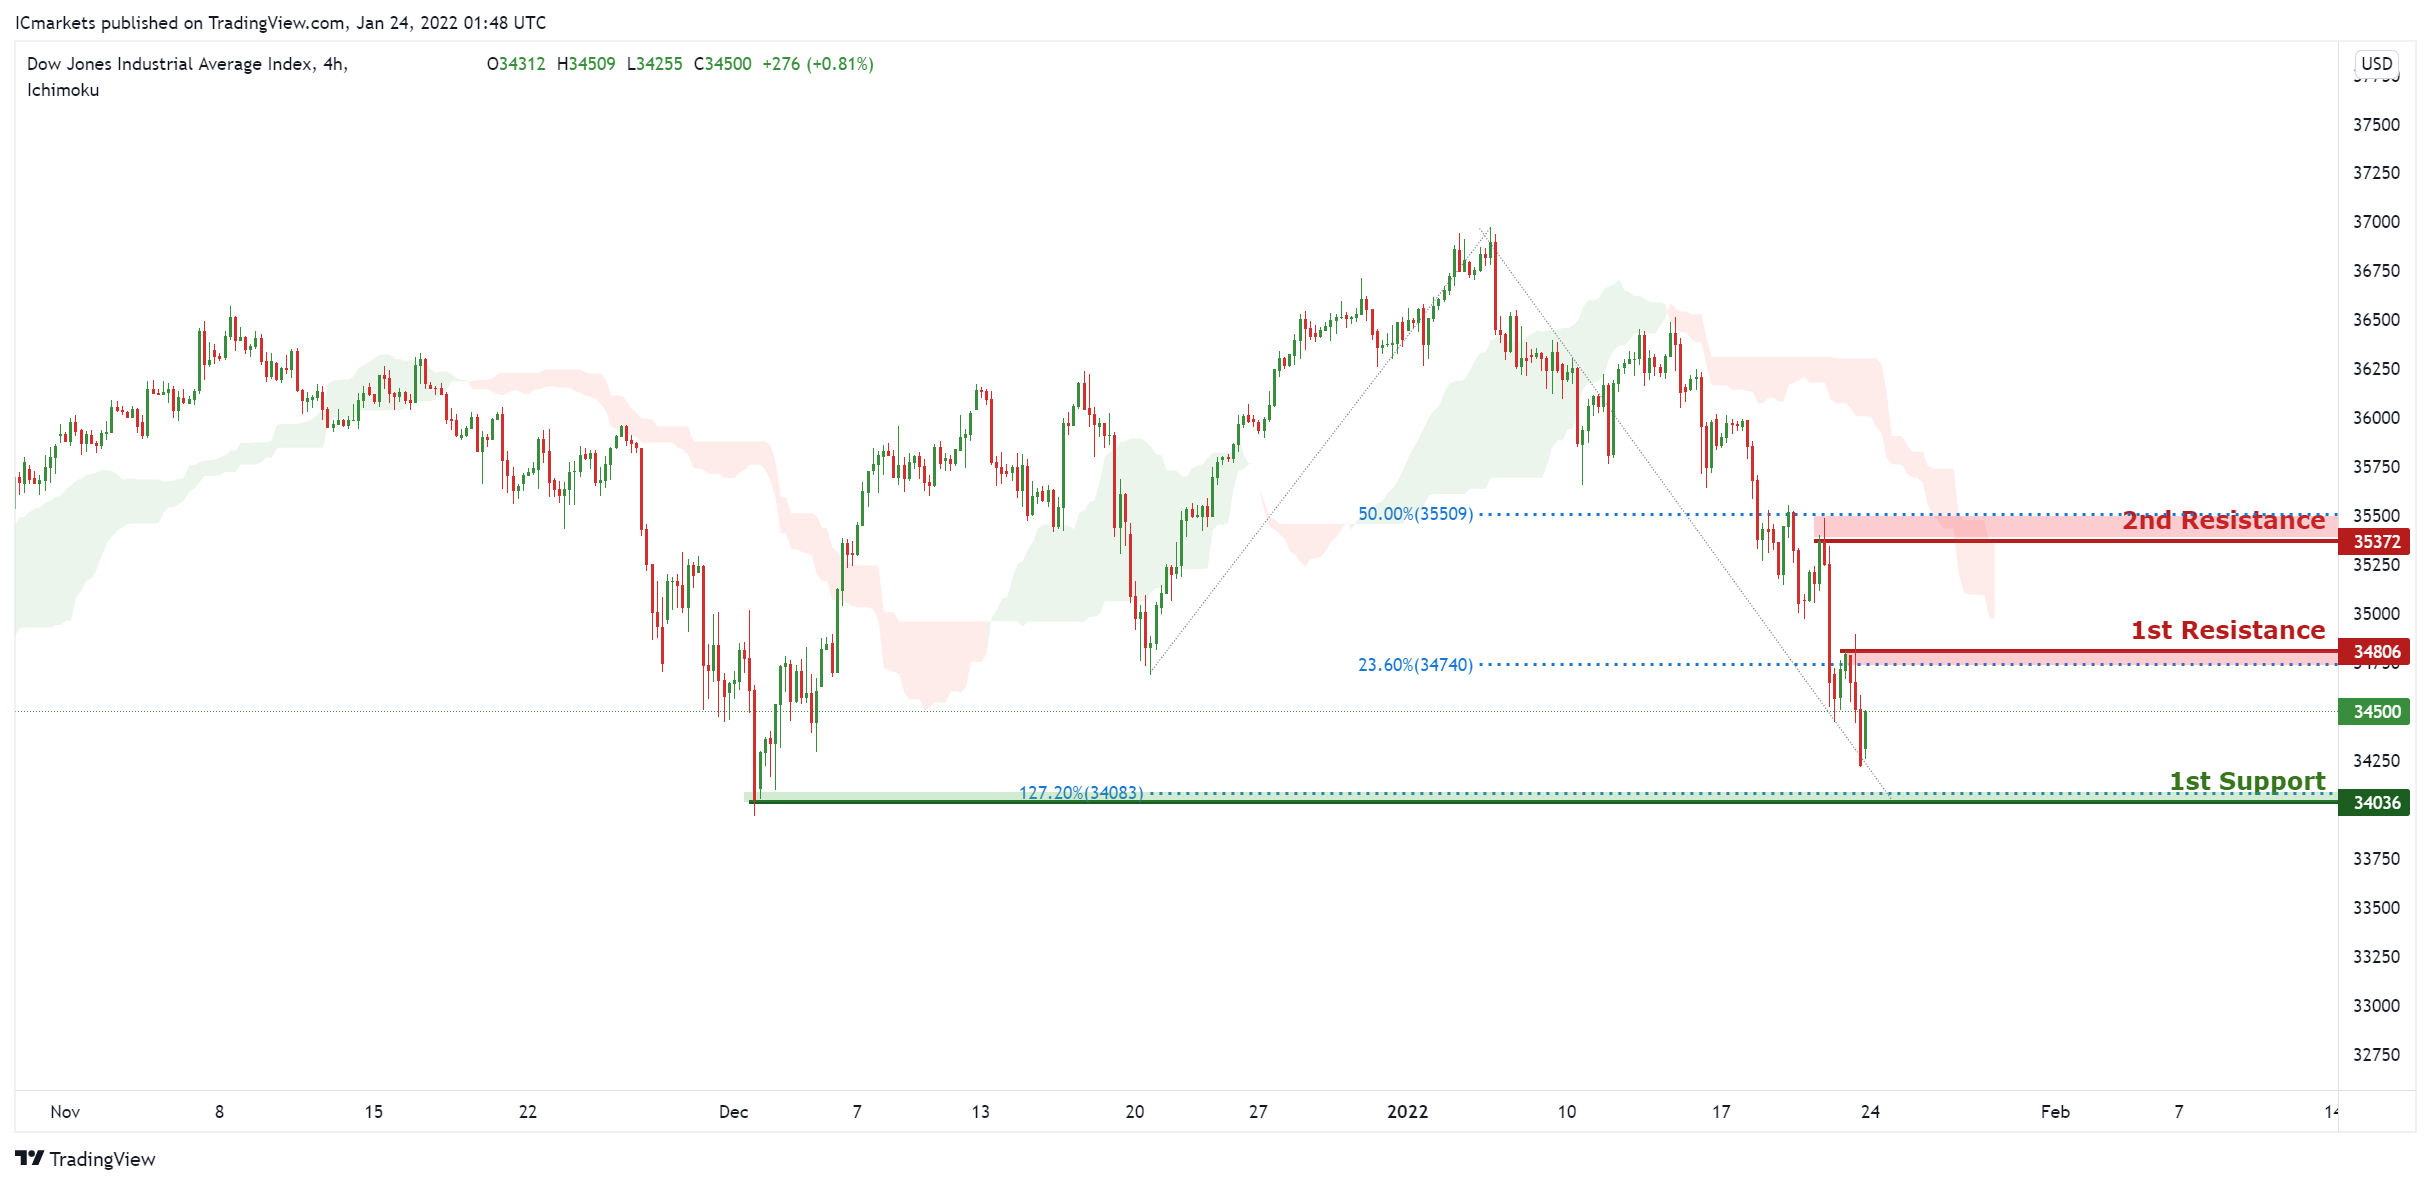
On the H4, with price moving below the ichimoku cloud, we have a bearish bias that price will from from our 1st resistance at 34806 which is in line with horizontal overlap resistance and 23.6% Fibonacci retracement to 1st support at 34036, which is in line with horizontal overlap support and 127.2% Fibonacci extension level. Alternatively, price may break 1st resistance structure and head for 2nd resistance at 35372, which coincides with horizontal swing high resistance and 50% Fibonacci retracement.
Areas of consideration:
- H4 time frame, 1st resistance of 34806
- H4 time frame, 1st support of 34036
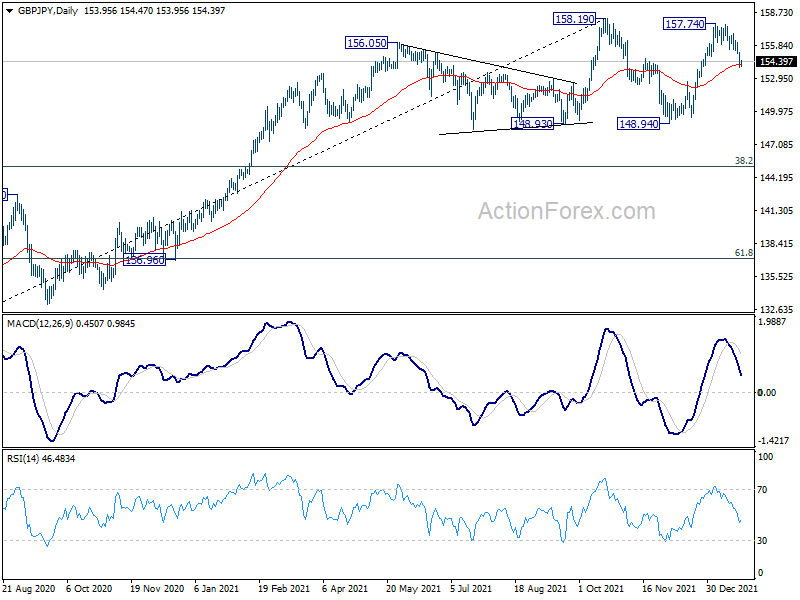
GBP/JPY Daily Outlook
Daily Pivots: (S1) 153.60; (P) 154.41; (R1) 154.91; More...
Intraday bias in GBP/JPY remains on the downside at this point. Fall from 157.74 is seen as the third leg of the consolidative pattern from 158.19. Sustained trading below 55 day EMA (now at 155.20) will target 148.94 support next. For now, risk will stay on the downside as long as 157.74 resistance holds, in case of recovery.
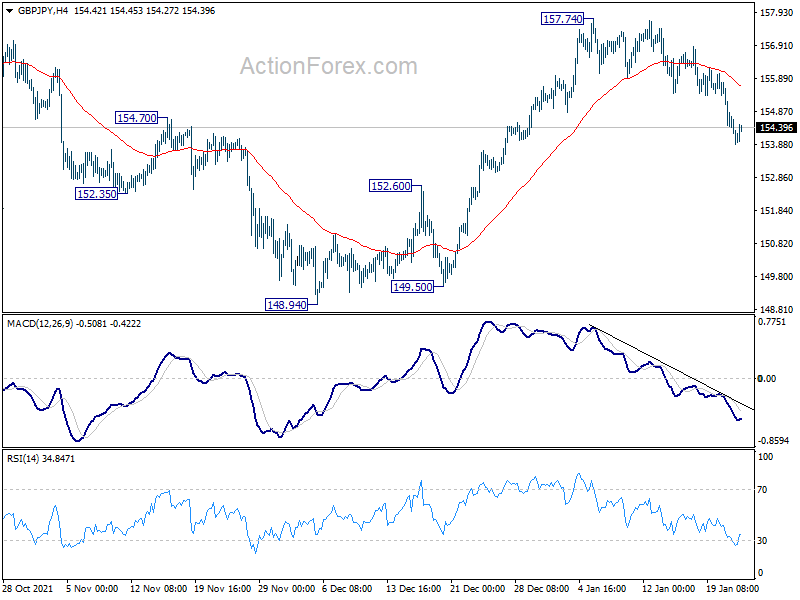
In the bigger picture, price actions from 158.19 are currently seen as developing into a consolidation pattern to up trend from 123.94 (2020 low). Downside should be contained by 123.94 to 158.19 at 145.10 to bring rebound. Firm break of 158.19 will resume the up trend to long term fibonacci level at 167.93. However, sustained break of 145.10 will raise the chance of trend reversal and target 61.8% retracement at 137.02.