Sample Category Title
Canadian Dollar Extends Slide
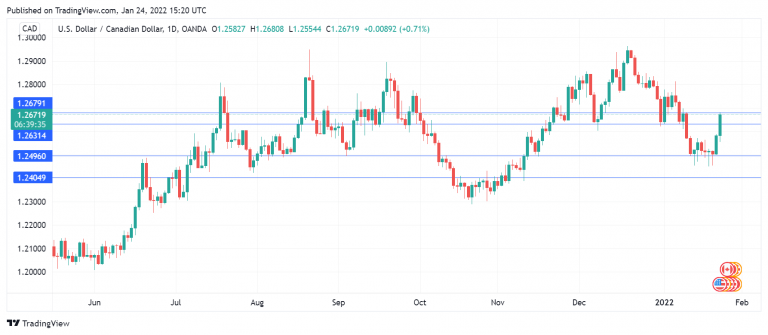
The Canadian dollar has started the week with losses, continuing the downswing we saw on Friday. USD/CAD is up over 1% since Thursday, as the US dollar is broadly higher against the major currencies.
The week ended on a sour note for the Canadian dollar, due to weak Canadian data. November retail sales were weaker than expected. The headline reading came in at 0.7% (1.2% exp.) and core retail sales rose 1.1% (1.3% exp.). As well, the New Housing Price Index slipped from 0.8% to 0.2% and missed the forecast of 1.0%.
If you’re guessing that these weak numbers will inhibit the Bank of Canada, guess again. The markets have priced in a whopping 85% likelihood of a rate hike at the bank’s Wednesday meeting. The drivers behind the expected hike are the usual suspects, employment and inflation. Employment is at a record level of 19.4 million and the unemployment rate fell below 6% in December, for the first time since the Covid crisis began.
Inflation is red-hot and has climbed to its highest level in 30 years, as December CPI rose 4.8% in December YoY. A recent BoC survey found that consumers and businesses expect inflation to remain high, and inflation expectations often manifest into actual inflation. A rate hike is close to a certainty, even though the BoC is expected to revise downwards its growth forecast for the first quarter.
This week’s highlight out of the US is the FOMC policy meeting on Wednesday. With inflation running at its highest level in almost 40 years, the Fed is poised to commence a series of rate hikes, with the likelihood of a March hike at 88%, according to FedWatch. The markets have priced in four rate hikes this year, but the Fed may have more in store. Goldman Sachs sent out a note on Saturday saying that its baseline forecast stands at four hikes, but the surge in inflation could push the Fed to respond with even more rate hikes this year.
USD/CAD Technical
- There is support at 1.2495 and 1.2405
- USD/CAD is testing resistance at 1.2632. Above, there is resistance at 1.2679
Sunset Market Commentary
Markets
Markets finished last week in a classical risk-off setting. This morning in Asian trading, there were tentative signs that the risk-off could slow. However, European markets almost immediately returned to last week’s habits. Mounting risks with respect to the Russia-Ukraine conflict and markets pondering what path the Fed will outline on more aggressive and faster policy normalization later this week continue to haunt investors in riskier assets. Selling in the EuroStoxx 50 accelerated after the index last week dropped below the 4231 neckline. The Euro zone January PMI showed a mixed picture. The headline composite index eased for the second consecutive month from 53.3 to 52.4, slightly lower than expected. The spread of the omicron variant according to Markit took an increasing toll on the region’s economy. Especially activity in the services sector slowed (from 53.1 to 52.1). Even so, Markit still denominates the setback due to omicron as rather muted. On the other hand, alleviating supply chain delays provided a welcome support to manufacturing (59.0 from 58.0). Average selling prices across in both manufacturing and services matched the survey’s historic all-time high. At the same time, input prices in manufacturing show signs of cooling raw material costs. Regarding individual countries, activity in Germany surprisingly accelerated from 49.9 to 54.3 (composite) with both manufacturing and services improving. Still, the data weren’t able to change a downbeat investor mood. Selling on equity markets even gain traction when US traders got involved. The EuroStoxx 50 is losing 3.75%. US indices show open with additional losses of up to 2.30% (Nasdaq). The risk-off is keeping core bond markets better bid despite expectations for faster Fed tightening. US yields decline with the belly (5 & 10-y declining >4 bps) outperforming the wings (2.5 bps and 1.6 bp for the 30-y and 2-y respectively). German yields are ceding 3.5/4.0 bps across the curve. The 10-y yield is revisiting the -0.10% support area. Until now intra-EMU spreads are little affected by the global risk-off trade. This also applies to Italy, where the Parliament is will decide whether premier Draghi will be appointed as President (10-y Italian spread vs Germany 1 bp wider, in line with the rest of Europe). After opening stronger Brent crude oil also eases off recent cycle highs currently trading in the mid $ 86 area.
FX markets don’t fully return to a standard risk-off reaction function. The yen outperformed early in European dealings but the dollar easily restored the balance with USD/JPY currently even trading in positive territory (113.90). The DXY trade-weighted index jumped back above 96. The euro suffers. Near 1.13, EUR/USD is at risk of falling below a STupward sloping trend channel. The Swiss franc initially was the preferred European safe haven. EUR/CHF tested the 1.03 big figure, but rebounded. Is the SNB (finally) coming to the fore? CE currencies (CZK, and even more PLN and HUF) all face growing headwinds despite expectations for more interest rate support.
News Headlines
Polish (real) retail sales rose by 14.8% M/M and 8% Y/Y in December, falling somewhat short of consensus (14.9% M/M and 9.6% Y/Y). The largest increase came from textiles, clothing and footwear sales. After eliminating for seasonal factors, retail sales at constant prices in December 2021 were 3.4% lower in comparison to November 2021. The Polish zloty lost significant ground today, but that’s mainly due to the risk-off market environment. Hawkish comments by NBP governor Glapinski over the weekend can’t fight that context. EUR/PLN surges from 4.53 to 4.56+.
The January UK composite PMI unexpectedly fell from 53.6 to 53.4 while consensus expected an increase to 54. Both manufacturing (57.9 to 56.9) and services (53.6 to 53.3) indices declined and came in below forecasts. The Omicron wave meant a third steep downturn for the hospitality sector, but this one should be brief with restrictions now easing. Business confidence in the outlook picked up, driving sustained solid jobs growth. Inflationary pressures remain elevated at near-record levels, boosting the probability of follow-up BoE rate hikes. EUR/GBP again tested 0.8381 resistance in today’s hostile risk environment.
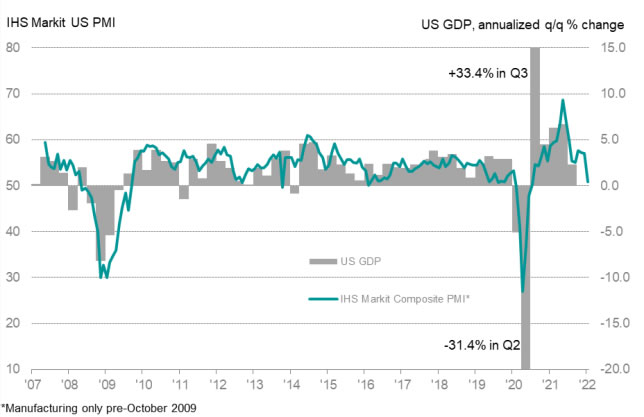
US PMI composite tumbled to 50.8, 18-month low
US PMI Manufacturing dropped from 57.7 to 55.0 in January, a 15-month low. PMI Services dropped from 57.6 to 50.9, an 18-month low. PMI Composite dropped from 57.0 to 50.8, also an 18-month low.
Chris Williamson, Chief Business Economist at IHS Markit, said: "Soaring virus cases have brought the US economy to a near standstill at the start of the year, with businesses disrupted by worsening supply chain delays and staff shortages, with new restrictions to control the spread of Omicron adding to firms' headwinds.
"However, output has been affected by Omicron much more than demand, with robust growth of new business inflows hinting that growth will pick up again once restrictions are relaxed. Furthermore, although supply chain delays continued to prove a persistent drag on the pace of economic growth, linked to port congestion and shipping shortages, the overall rate of supply chain deterioration has eased compared to that seen throughout much of the second half of last year. This has in turn helped lift manufacturing optimism about the year ahead to the highest for over a year, and has also helped bring the rate of raw material price inflation down sharply. Thus, despite the survey signalling a disappointing start to the year, there are some encouraging signals for the near-term outlook "
AUDJPY Bearish Trajectory Strengthens With Dip Below 81
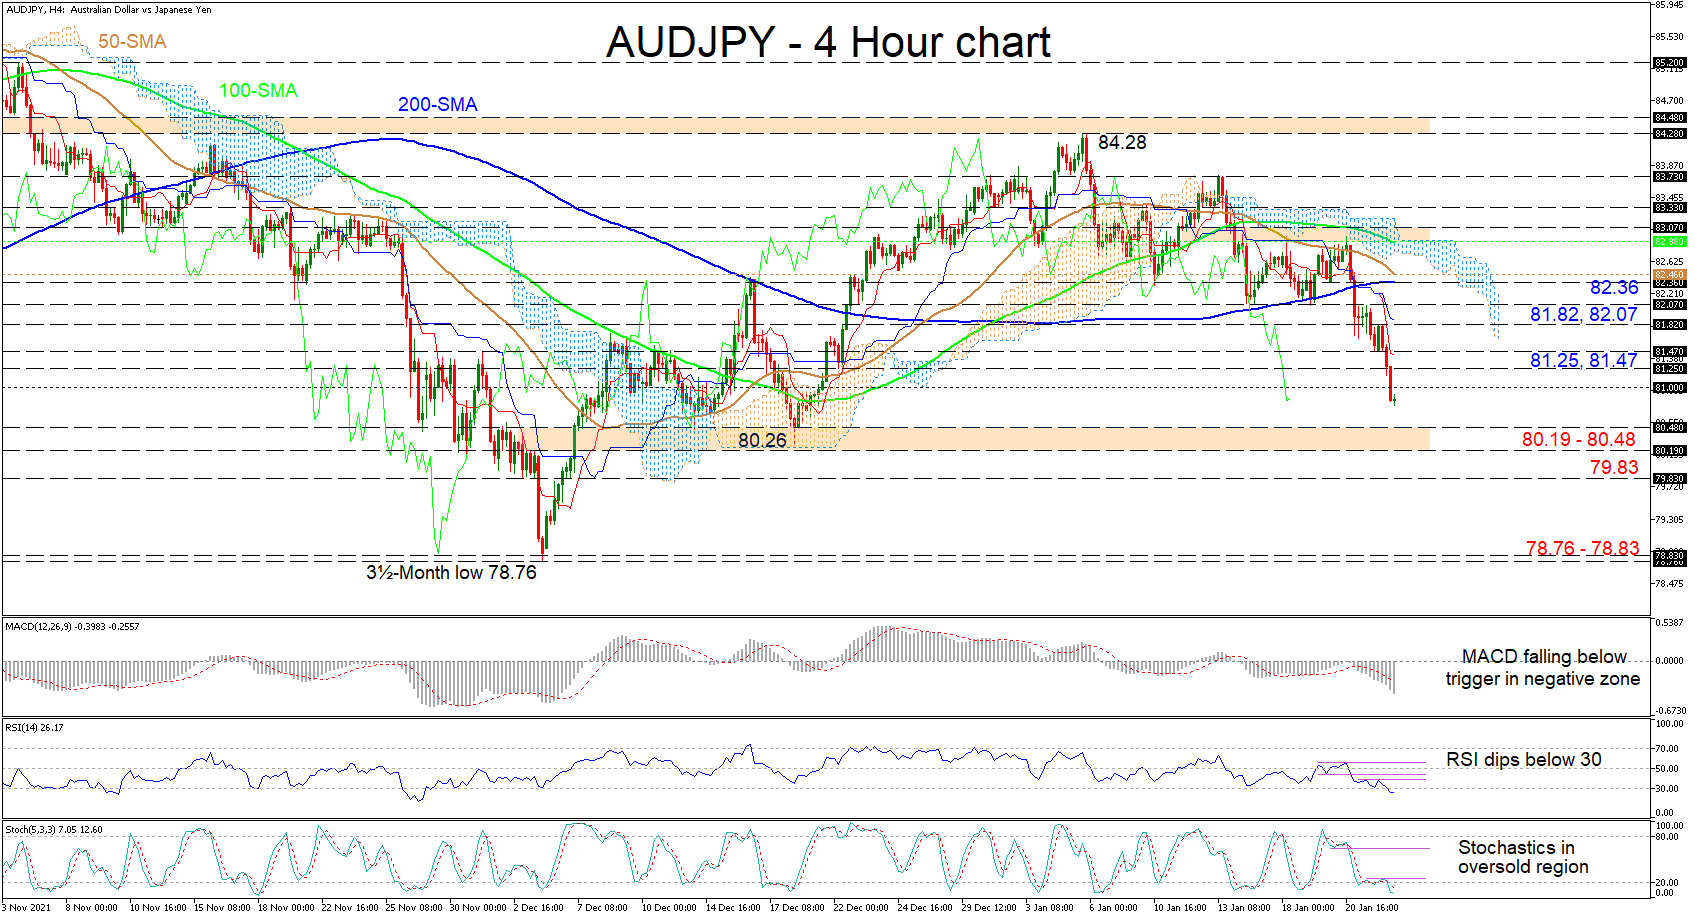
AUDJPY’s recent selloff, which started just below the 83.00 level has extended below the 81.00 handle. The bearish 50- and 100-period simple moving averages (SMAs) are endorsing the drop in the pair. Additionally, a negative crossover of the 200-period SMA by the 50-period one would be another bearish signal, which could confirm elevated selling in the pair.
The diving Ichimoku lines are indicating selling forces are dominating, while the short-term oscillators are skewed to the downside, but are reflecting a minor pause in downward impetus. The MACD, in the negative region, is declining beneath its red trigger line, while the downward drive in the RSI and stochastic lines, which freshly dipped into their oversold territories, is stalling a tad.
If the current price direction persists, the 80.19-80.48 support section could attempt to provide buyers with footing. However, should this boundary fail to dismiss extra loss of ground, the pair may meet the 79.83 barrier. In the event this obstacle breaks down too, traders’ eyes could then turn to the 78.76-78.83 support belt, which is connected to the September and December 2021 troughs.
If buyers re-emerge and step over the 81.00 hurdle, initial upside constraints could evolve around the 81.25 and 81.47 levels. If buying interest persists, the 81.82 and 82.07 highs could come under fire. From here, buyers would need to push north of the converging 200- and 50-period SMAs at 82.36 and 82.46 in order to tackle the Ichimoku cloud and try and reignite upside momentum.
Summarizing, AUDJPY is exhibiting a bearish tone beneath the SMAs and the 81.82 high. A break below the 80.19-80.48 border could reinforce negative tendencies, while a price climb beyond the region of highs between the 100-period SMA and the 83.07 level, would be necessary to reinstate a neutral-to-bullish demeanour in the pair.
USD May Be in Demand
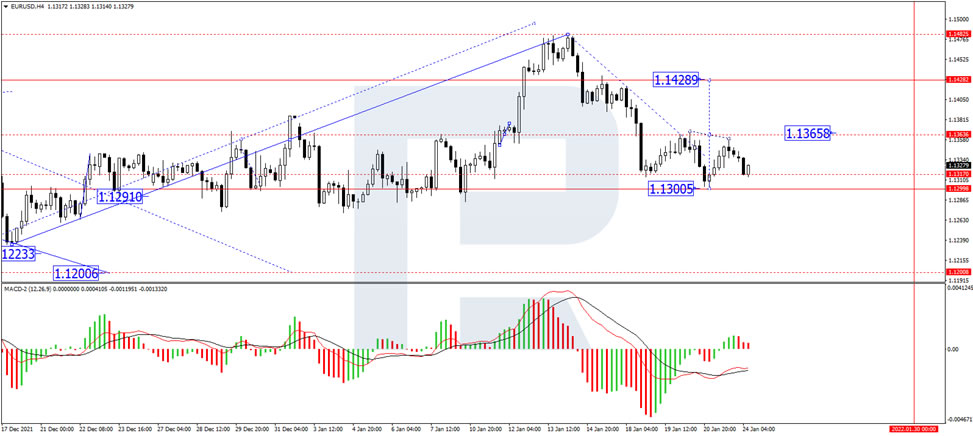
EUR/USD is starting the final week of January with a decline towards 1.1320. The American currency is in demand due to investors’ interest in “safe haven” assets: the external background is looking rather pessimistic.
This week, market players will focus their attention on the US Fed session. It would be hard to overestimate the importance of this event. The entire financial world is expecting the American regulator to provide any hints at what the Fed is planning to do in March: raise the benchmark interest rate, announce the number of rate hikes in 2022, speak about the time of its balance reduction.
One may assume that in anticipation of the Fed’s comments and decisions investors will save their strengths and remain calm.
In the H4 chart, EUR/USD has finished another ascending wave at 1.1390; right now, it is correcting towards 1.1317 and may later form a new consolidation range near the lows. After that, the instrument may break the range to the upside and form one more ascending structure towards 1.1358 or even higher, to reach the first target at 1.1428. From the technical point of view, this scenario is confirmed by MACD Oscillator: its signal line is moving towards 0. After breaking this level, it may continue trading to reach new highs.
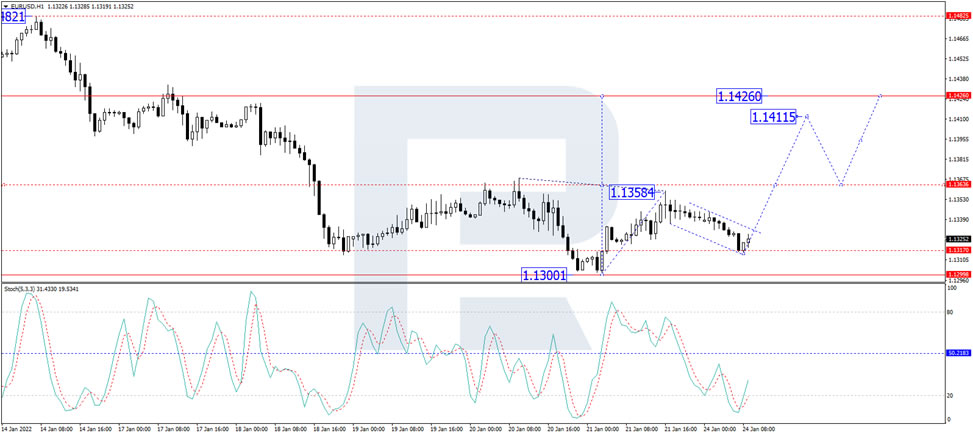
As we can see in the H1 chart, after completing the descending correction at 1.1317, EUR/USD is consolidating around this level. If later the price breaks this range to the upside, the market may form another ascending structure to break 1.1358. After that, the instrument may continue trading upwards with the short-term target at 1.1411. From the technical point of view, this idea is confirmed by the Stochastic Oscillator: after breaking 20, its signal line is growing to reach and break 50, thus boosting the price growth in the price chart.
EUR/GBP Mid-Day Outlook
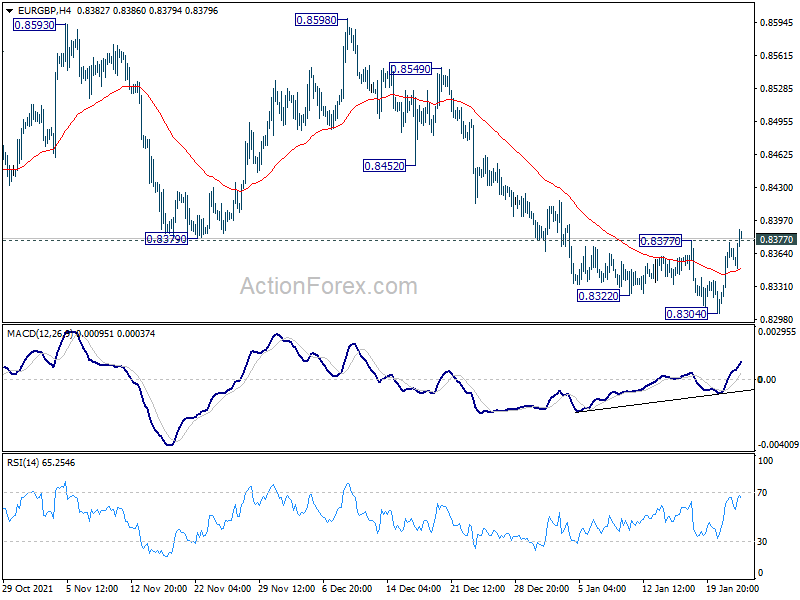
Daily Pivots: (S1) 0.8332; (P) 0.8354; (R1) 0.8393; More...
EUR/GBP's break of 0.8377 resistance indicates short term bottoming at 0.8304, on bullish convergence condition in 4 hour MACD, ahead of 0.8276 low. Intraday bias is back on the upside for 55 day EMA (now at 0.8422). Sustained break there will pave the way back to 0.8598 key structural resistance next. For now, risk will be mildly on the upside as long as 0.8304 support holds, in case of retreat.
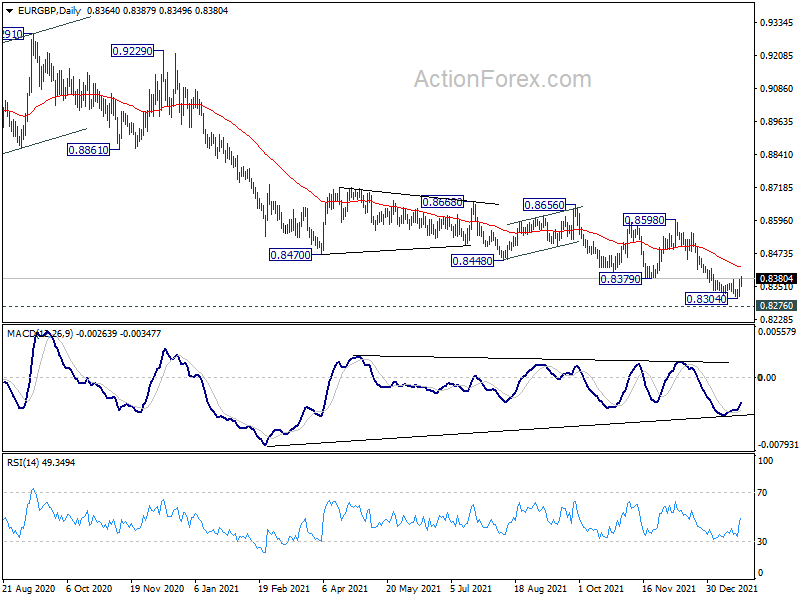
In the bigger picture, price actions from 0.9499 (2020 high) are still seen as developing into a corrective pattern. Deeper fall could be seen as long as 0.8598 resistance holds, towards long term support at 0.8276. We'd look for bottoming signal around there to bring reversal. Meanwhile, firm break of 0.8598 will now be an early sign of medium term bottoming and bring stronger rebound. However, sustained break of 0.8276 will argue that the long term trend has reversed.
EUR/USD Mid-Day Outlook
Daily Pivots: (S1) 1.1309; (P) 1.1335; (R1) 1.1368; More...
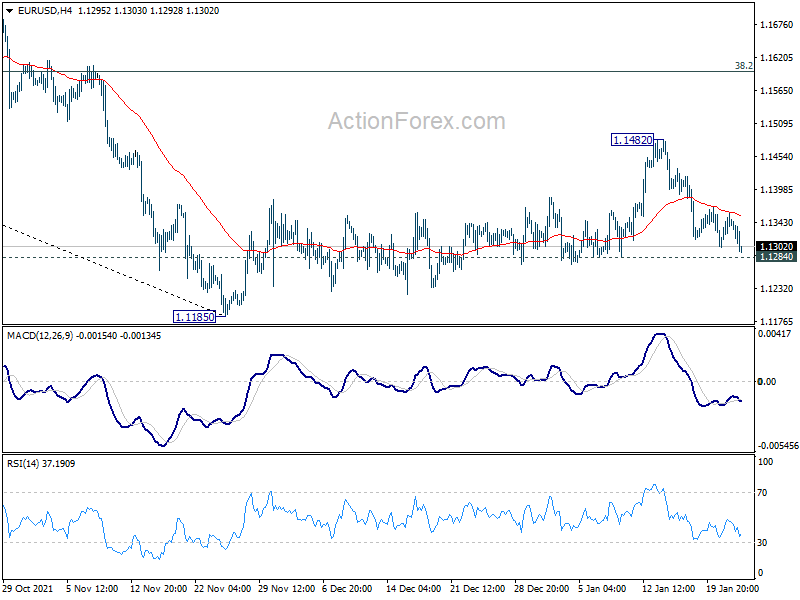
Intraday bias in EUR/USD remains neutral and outlook is unchanged. Price action from 1.1185 are seen as corrective move. Break of 1.1284 will argue that larger down trend from 1.2348 is ready to resume. Intraday bias will be back on the downside for retesting 1.1185 low first. Also, in case of another rise, upside should be limited by 38.2% retracement of 1.2265 to 1.1185 at 1.1598 eventually.
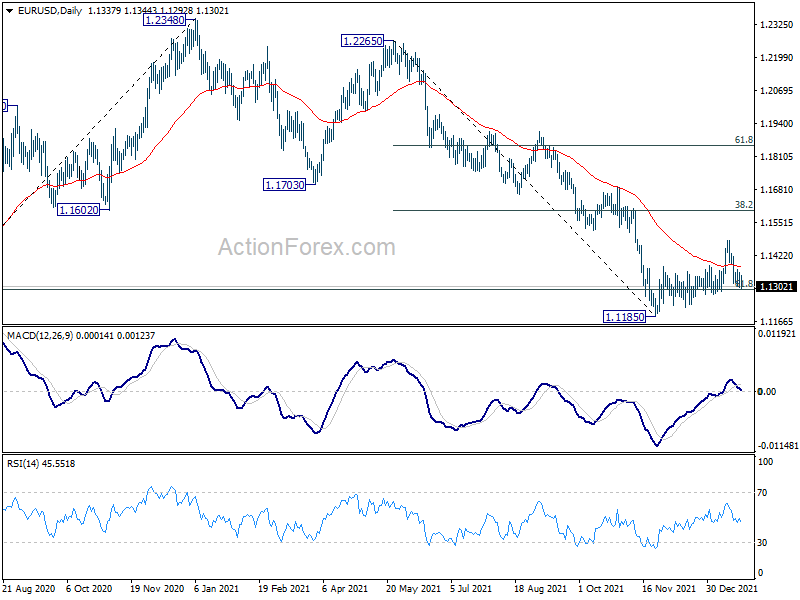
In the bigger picture, there are various ways of interpreting the fall from 1.2348 (2021 high). It could be a correction to rise from 1.0635 (2020 low), the fourth leg of a sideway pattern from 1.0339 (2017 low), or resuming long term down trend. In any case, outlook will now stay bearish as long as 1.1703 support turned resistance holds. Sustained break of 61.8% retracement of 1.0635 to 1.2348 at 1.1289 would pave the way back to 1.0635.
GBP/USD Mid-Day Outlook
Daily Pivots: (S1) 1.3532; (P) 1.3567; (R1) 1.3589; More...
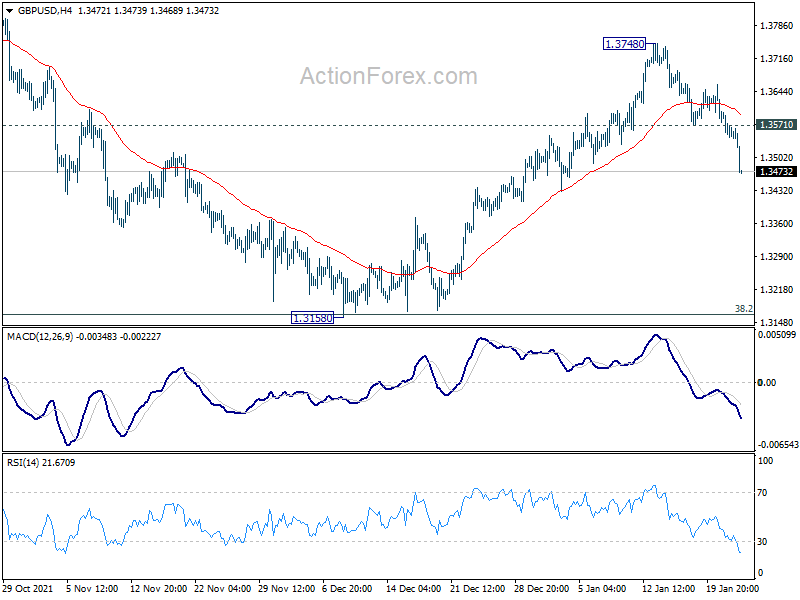
GBP/USD's break of 1.3489 support and 55 day EMA dampened our original bullish view. Rebound from 1.3158 is completed at 1.3748, and larger fall from 1.4282 is not over. Intraday bias is back on the downside for retesting 1.3158 low first. On the upside, though, above 1.3571 minor resistance will turn bias back to the upside for retesting 1.3748.
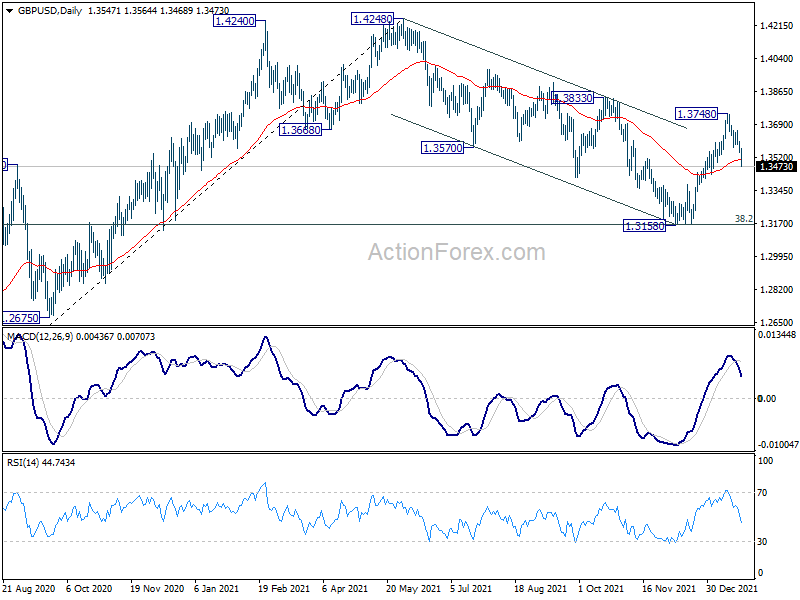
In the bigger picture, strong support was seen from 38.2% retracement of 1.1409 to 1.4248 at 1.3164. The development suggests that up trend from 1.1409 (2020 low) is still in progress. On resumption, next target will be 38.2% retracement of 2.1161 to 1.1409 at 1.5134. Nevertheless sustained break of 1.3164 will argue that whole rise from 1.1409 has completed and bring deeper fall to 61.8% retracement at 1.2493.
USD/CHF Mid-Day Outlook
Daily Pivots: (S1) 0.9095; (P) 0.9134; (R1) 0.9161; More....
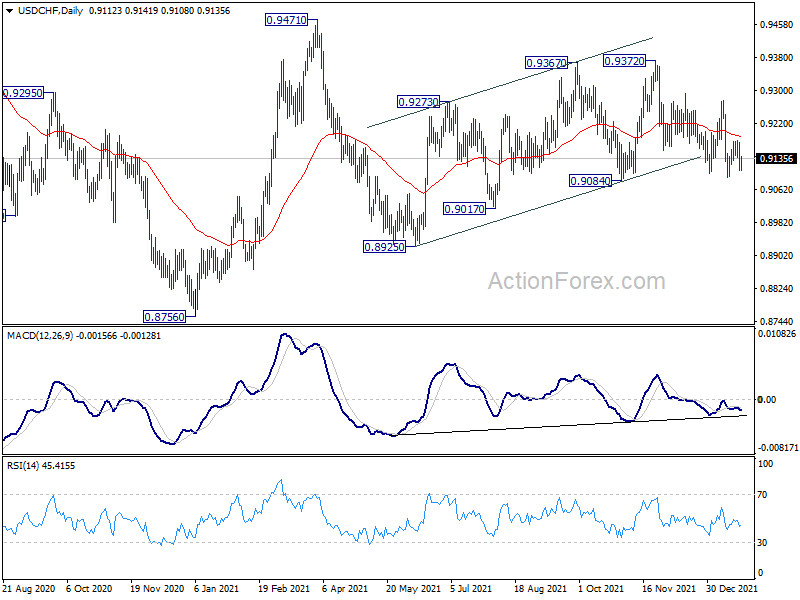
Range trading continues in USD/CHF and intraday bias remains neutral first. On the downside, firm break of 0.9084 support will argue that choppy rise from 0.8925 has completed. Fall from 0.9471 might be ready to resuming. Further decline would be seen back to 0.8925 support first. On the upside, above 0.9276 will target 0.9372 resistance instead.
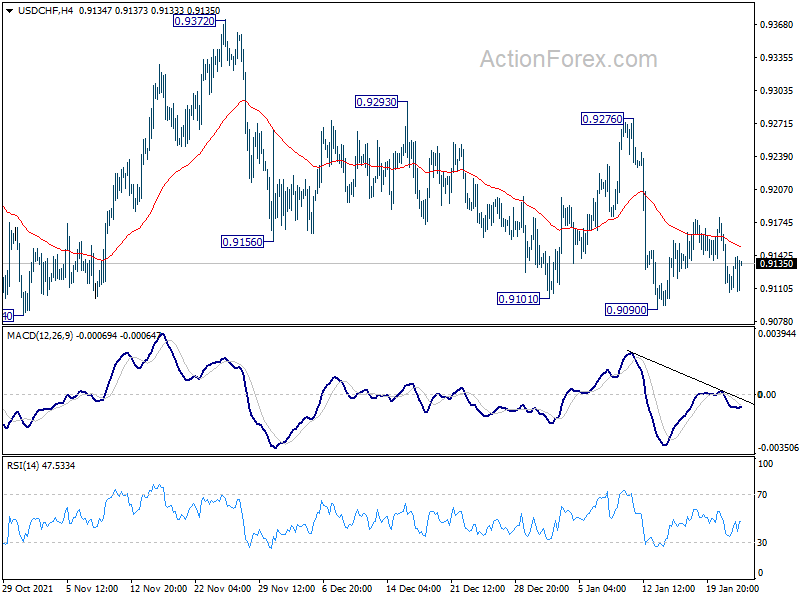
In the bigger picture, the corrective structure of the rebound from 0.8925 argues that fall from 0.9471 is not complete yet. It could either be the second leg of pattern from 0.8756 (2021 low), or resuming larger down trend from 1.0237 (2018 high). We'd pay attention to the downside momentum and assess the odds later. But for now, medium term outlook will be neutral at best as long as 0.9471 resistance holds.