

Sample Category Title
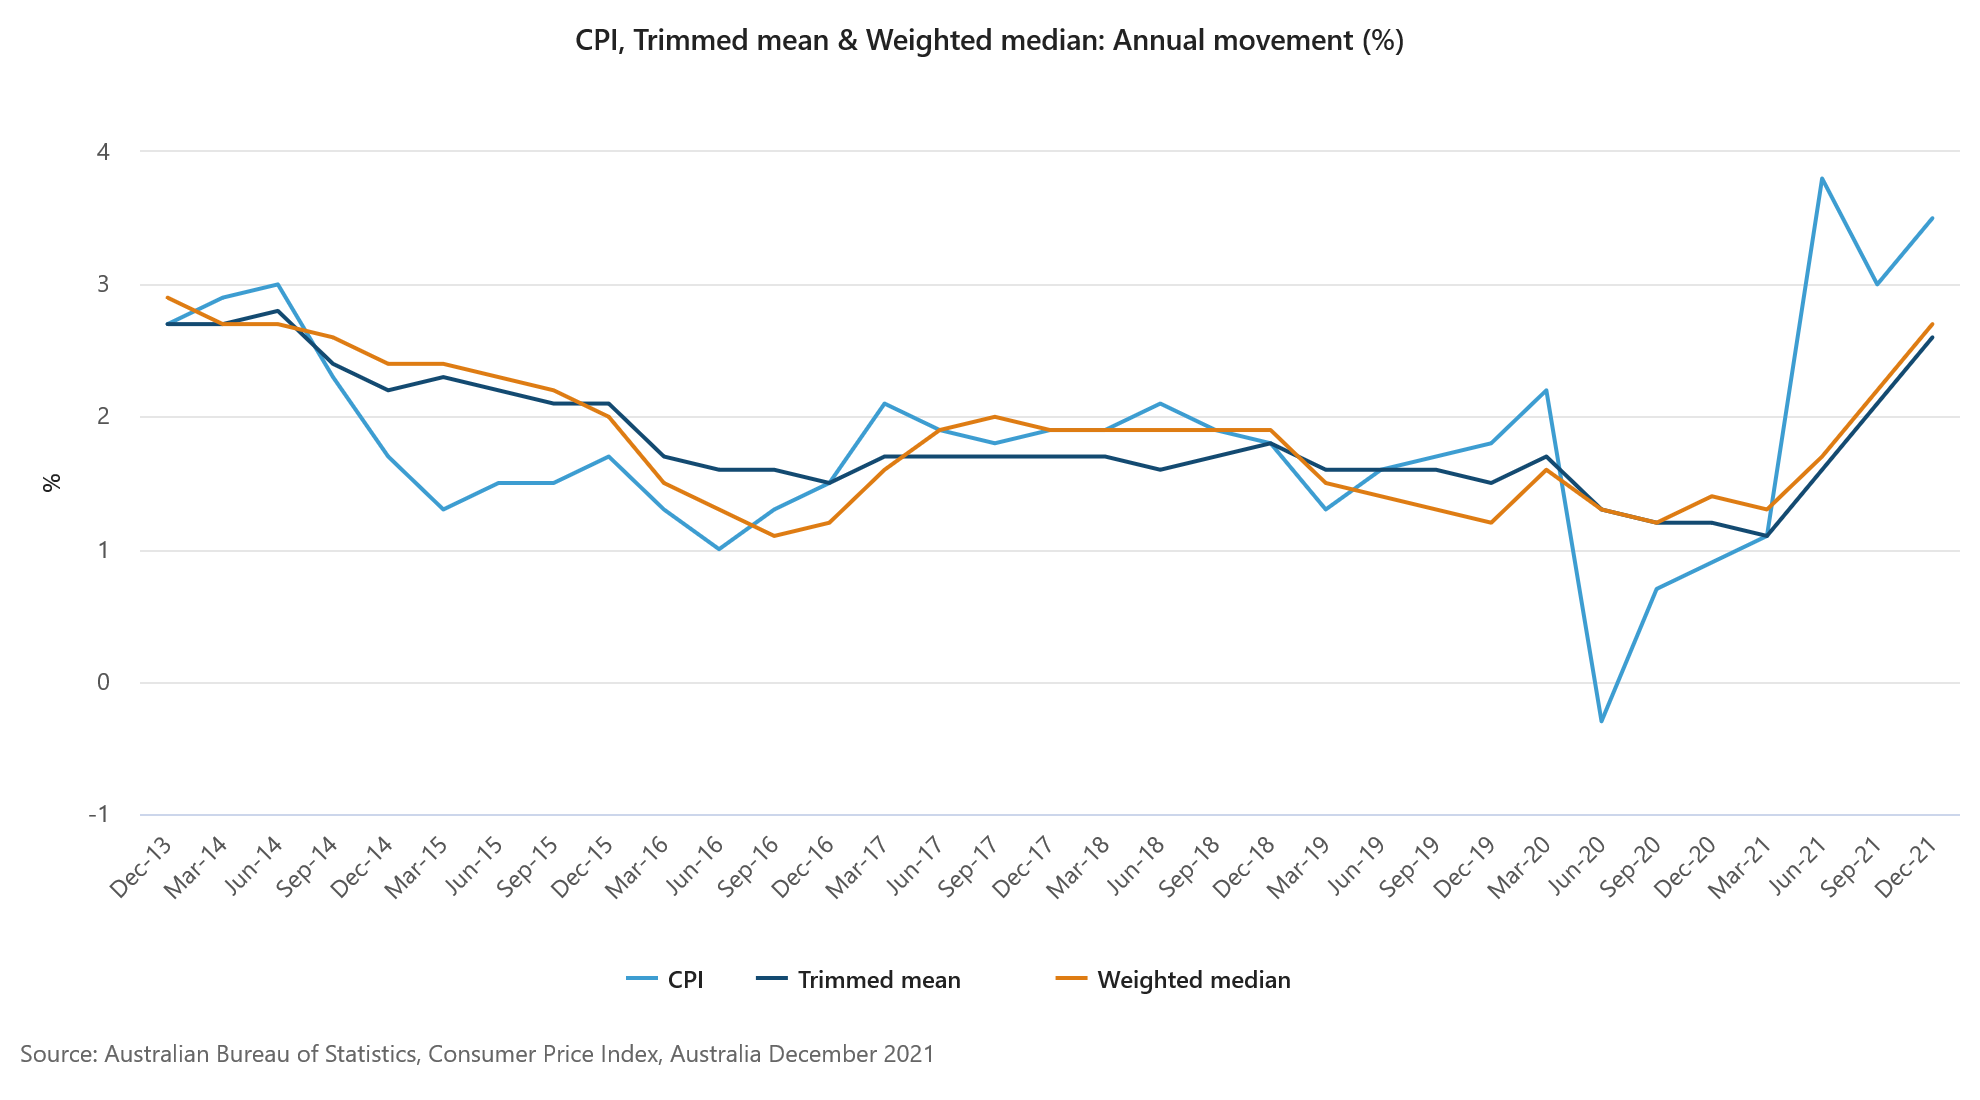
Australia CPI surged to 3.5% yoy in Q4, trimmed mean CPI at 7-yr high
Australia CPI rose 1.3% qoq, 3.5% yoy in Q4, well above expectation of 1.0% qoq, 3.2% yoy. RBA trimmed mean CPI rose 1.0% qoq, 2.6% yoy, also above expectation of 0.7% qoq, 2.4% yoy. The 2.6% yoy rise was the highest since June 2014.
Head of Prices Statistics at the ABS, Michelle Marquardt, said the most significant price rises in the December quarter were new dwellings (+4.2%) and automotive fuel (+6.6%).
Marquardt said: "Annual trimmed mean inflation is the highest since 2014, reflecting the broad-based nature of price increases, particularly for goods."
BoJ Kuroda keeps an eye on inflation risks while maintaining ultra-easy policy
BoJ Governor Haruhiko Kuroda told the parliament today, "the BOJ will continue its ultra-easy policy so improvements in corporate profits and the economy prop up wages and gradually accelerate consumer inflation."
"We remain vigilant to the risk prices may shoot up before wages begin to rise, or how (rising raw material costs) could hurt smaller firms. We must keep an eye out on these risks, while maintaining our current easy monetary policy," Kuroda said.
Meanwhile, Prime Minister Fumio Kishida said, "it's desirable to create an environment in which companies can pass on rising costs and raise wages, so that increasing consumption spurs economic growth and inflation."
GBP/USD Nosedives, Upsides Could Be Capped
Key Highlights
- GBP/USD started a fresh decline below the 1.3600 support.
- A key bearish trend line is forming with resistance near 1.3520 on the 4-hours chart.
- EUR/USD declined below the 1.1320 support, with risk of more downsides.
- USD/JPY is struggling to recover above the 114.20 and 114.30 levels.
GBP/USD Technical Analysis
The British Pound started a fresh decline from the 1.3750 zone against the US Dollar. GBP/USD traded below many important supports near 1.3620 to enter a bearish zone.
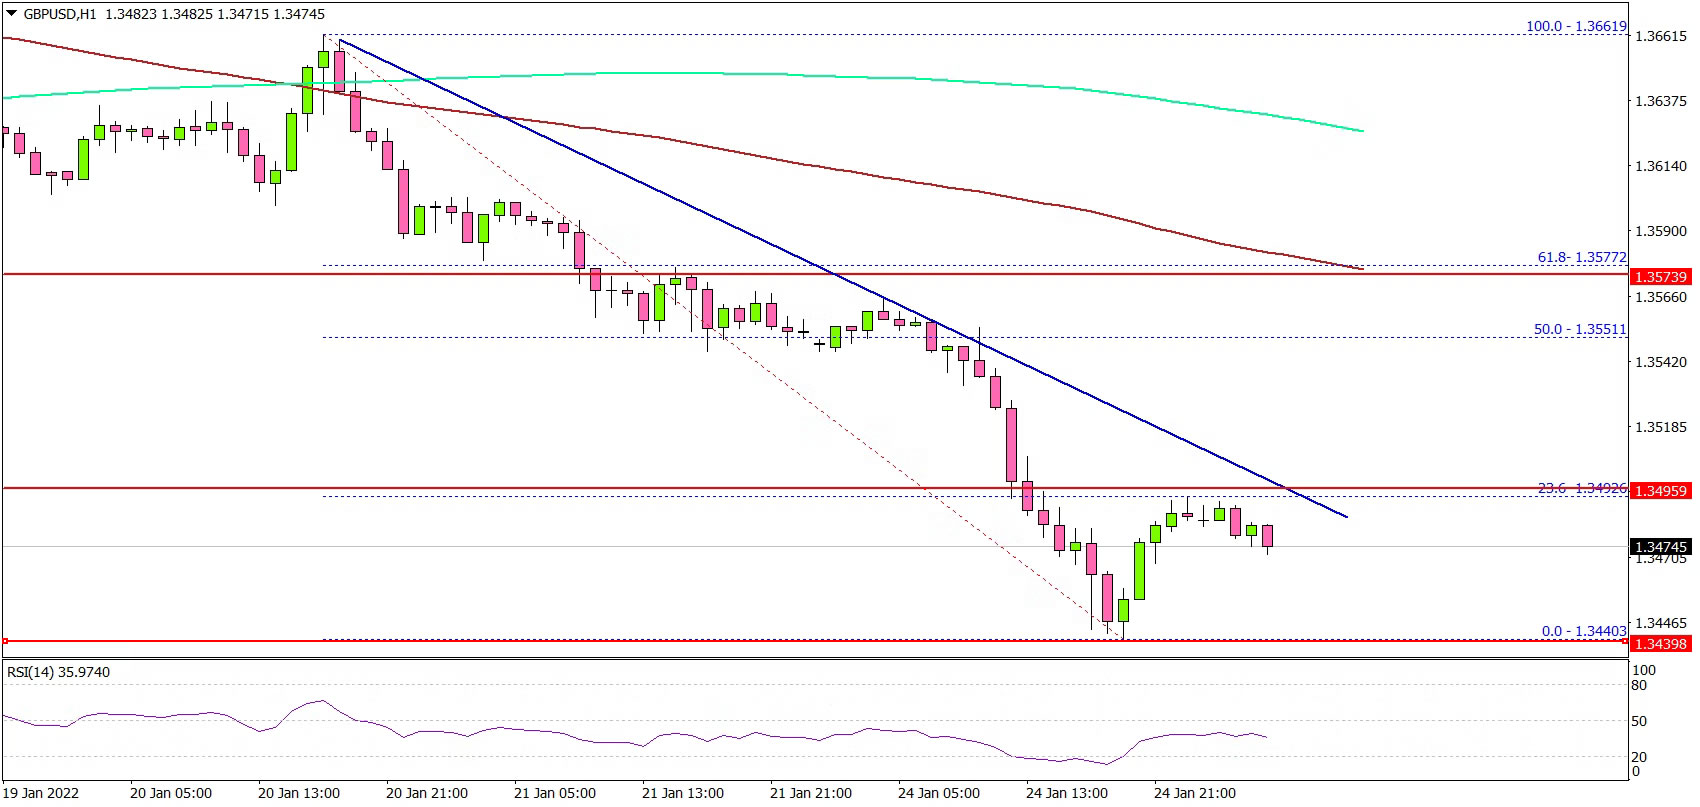
Looking at the 4-hours chart, the pair settled below the 1.3600 level and the 100 simple moving average (red, 4-hours). The pair even traded below the 1.3500 support and the 200 simple moving average (green, 4-hours).
It traded as low as 1.3444 and currently consolidating losses. On the upside, the pair is facing resistance near 1.3490 and 1.3500 levels.
Besides, there is a key bearish trend line forming with resistance near 1.3520 on the same chart. The next major resistance is near the 1.3550 level. It is near the 50% Fib retracement level of the downward move from the 1.3661 swing high to 1.3444 low.
If there is a fresh increase above 1.3550, the pair could rise above 1.3600. If not, there is a risk of more downsides below the 1.3440 level. The next major support sits near the 1.3320 level.
Looking at EUR/USD, the pair traded below the 1.1320 support and seems like there is a risk of more downsides below 1.1300 in the near term.
Economic Releases
- German IFO Business Climate Index for Jan 2022 – Forecast 94.7, versus 94.7 previous.
- US House Price Index for Nov 2021 (MoM) - Forecast +1%, versus +1.1% previous.
Aust Q4 CPI – Core Inflation Already Exceeds Peak in RBA’s Forecasts
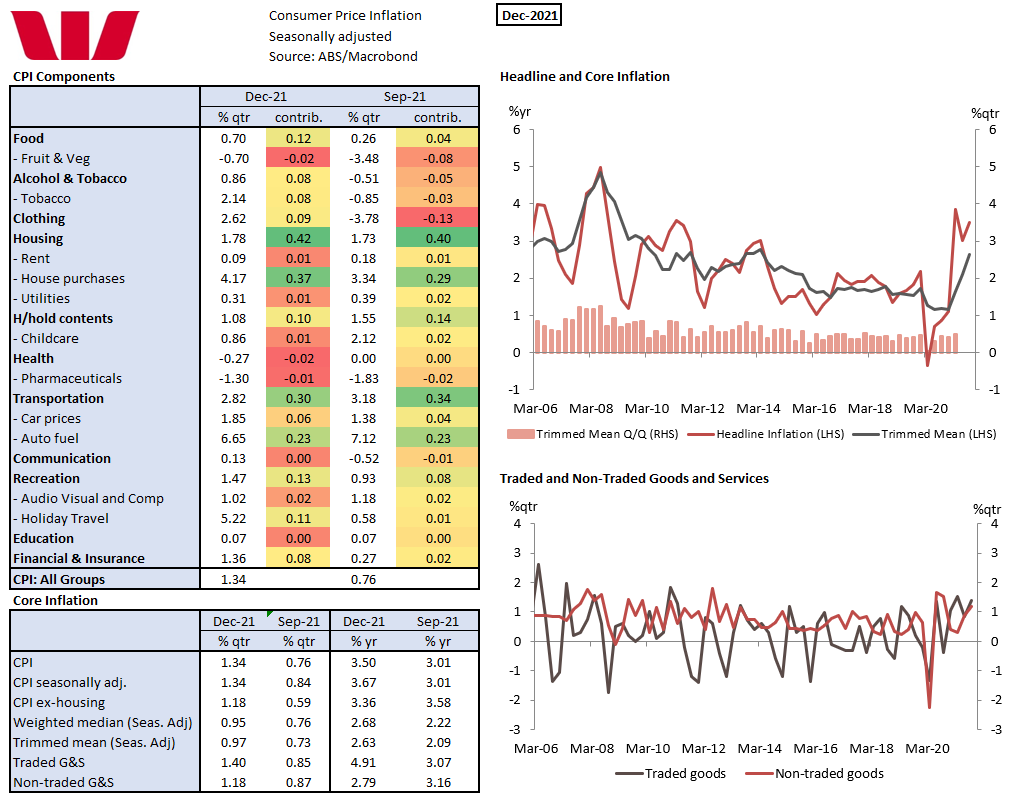
Headline CPI 1.3%qtr/3.5%yr; trimmed mean 0.97%qtr/2.6%yr, weighted median 0.95%qtr/2.7%yr. Core inflation is now above the mid-point of the RBA’s inflation target, not something the RBA was expecting in its forecast profile this early nor of this magnitude.
Headline inflation came in stronger than expected at 1.3% exceeding the top of the range forecast at 1.2%. Westpac and the market were forecasting 1.1%. At two decimal places it was 1.34% % so a solid 1.3%. The annual pace lifted from 3.0% to 3.5% not too far off the June 2021 12yr high of 3.8%.
As we noted in the June CPI update, the acceleration to almost 4%yr was due to base effects of the negative prints in 2020 due to government grants and subsidies. As such, this was expected to be a transitory blip in inflation. This time the ending of the HomeBuilder grants are part, but not all, of the inflation story.
The big surprise was the 1.0% rise in the trimmed mean, well exceeding the market expectation of 0.7%, highlighting the broad spread of this inflation surprise. The 1.0% was the largest quarterly rise in the trimmed mean since 1.2% in September 2008 taking the annual pace to 2.6%yr, the fastest pace of core inflation since June 2014. At two decimal places the trimmed mean rose 0.97%; for note the weighted median gained 0.9% for 2.7%yr.
The ABS reports that most significant price rises were for new dwelling purchase by owner-occupiers (4.2% vs 4.8% forecast) and automotive fuel (6.6% vs 6.7% forecast) and domestic holidays (4.8% vs 5.1% forecast).
The ABS noted that high levels of building construction activity combined with shortages of materials and labour contributed to two consecutive quarters of the largest rise in new dwelling prices since the introduction of the GST in September 2020. As we noted in our preview, fewer payments of HomeBuilder grants compared to the previous quarter also contributed to the rise. These grants have the effect of reducing out of pocket expenses for new dwellings being purchased.
The strong rise in auto fuel was due to post lockdown surge in global demand and constrained supplies while domestic holiday travel & accommodation prices lifted as border closures eased leading to increased demand for domestic air travel and accommodation.
In our preview we argued there was a high degree of uncertainty about how the Black Friday and Boxing Day sales would unfold this year. Black Friday Sales are growing in their significance for Australian retailers but the December quarter was when the economy reopened in NSW and Victoria and retail sales surged as a result. As such there were solid gains in clothing & footwear (2.6% vs 0.1% forecast), household contents & services (1.1% vs flat forecast) and audio visual & computing (1.0% vs 0.3% forecast).
The ABS is also now publishing a wider series of analytical indexes to help understand the drivers of inflation. The ABS noted that the rise in automotive fuel and new dwelling prices were the main contributors to goods inflation. As noted earlier there were also increased across a broad range of other goods with strong demand and supply disruptions leading to price rises for goods such as furniture and motor vehicles. Goods inflation is running at a 4.3%yr pace, services at a 2.3%yr pace. There is the exact reverse of the trend we have seen for the past few decades.
The ABS also noted that non-discretionary inflation (4.5%yr) is higher than the CPI (3.5%) and more than twice the rate of discretionary inflation (1.9%yr). Non-discretionary inflation includes goods and services that households are less likely to reduce their consumption of, such as food, automotive fuel, housing and health costs.
We will process all this data and review of near-term CPI forecasts based on this new information. While we don’t know what the overall impact will be it is clear that at 3.5%yr the current pace of inflation is running ahead of where we thought it would be at the end of 2021 (3.2%yr for headline, 2.4%yr for the trimmed mean) pointing to upside risk to our June 2022 forecasts of 3.3%yr of the CPI, 2.9%yr for the trimmed mean.
Fed meeting: Will Asset Purchases End Early?
The main event this week will be the Fed’s policy decision at 19:00 GMT Wednesday. No action is expected, but with the markets pricing in four rate increases for this year, the central bank is likely to signal that normalization is imminent. There is also some speculation that asset purchases could come to an immediate end. That will likely decide the reaction in the dollar.
Economic boom
The US economic recovery has been very impressive. The economy is already much larger than it was before the crisis, the labor market is tight by several metrics, consumption is strong, and inflation is running at the fastest pace in four decades.
Wages have also started to fire up as companies compete to attract workers. That’s crucial for the Fed because it implies that inflationary pressures might not cool by themselves once supply chains normalize and energy prices stabilize.
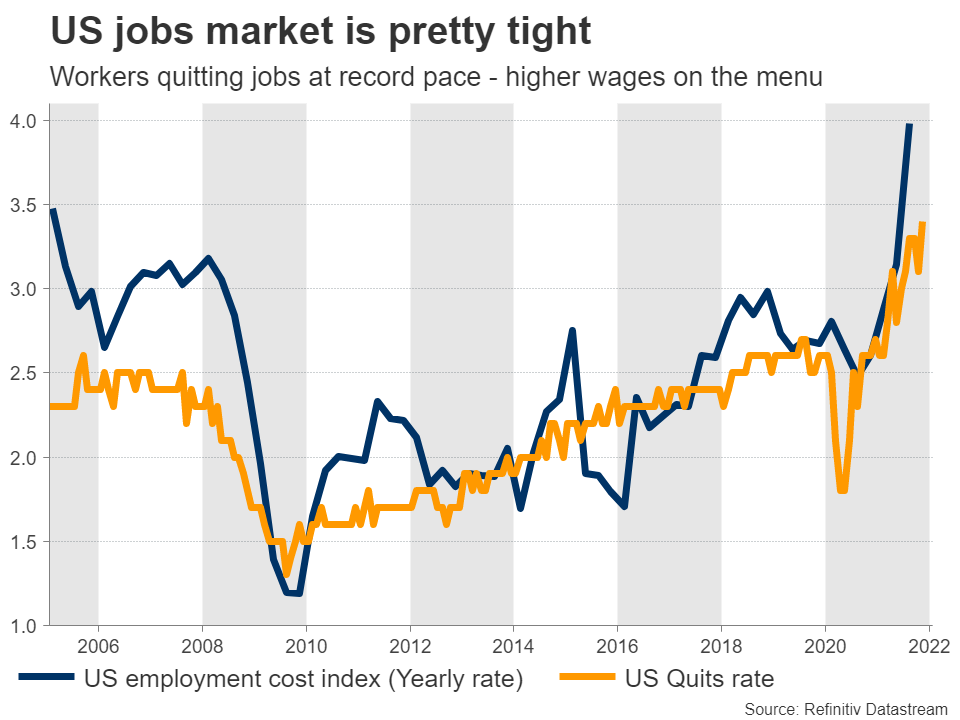
As a result, market participants are betting the Fed will step on the brakes, currently pricing in four rate increases for this year. Beyond rate hikes, another crucial variable for traders is when and how aggressively the Fed will begin shrinking its balance sheet.
Meeting playbook
Turning to this week’s meeting, no action is anticipated. Instead, the central bank is merely expected to signal that rate hikes are on the menu soon, essentially preparing the ground for liftoff in March.
The twist is that some strategists are calling for asset purchases to come to an immediate halt. At its previous meeting the Fed said it would stop them in March, but with the US economy being so strong and inflation roaring, many argue there’s no real benefit in continuing to buy Treasuries and mortgage-backed securities.
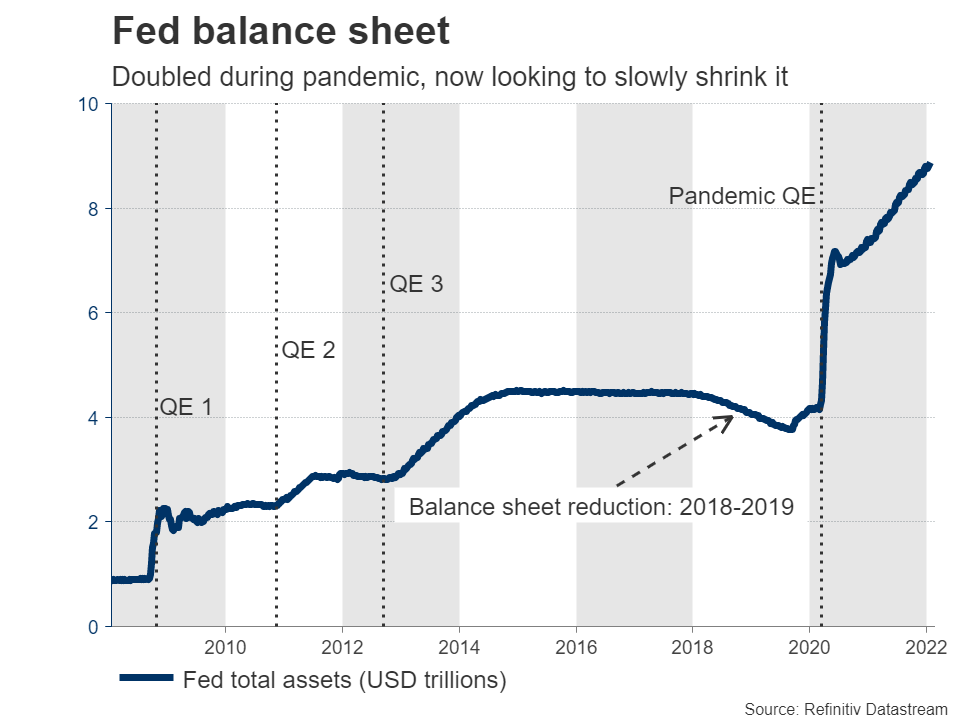
While that is true, the Fed also doesn’t want to shock financial markets. Even though equity markets have declined substantially and Treasury yields have soared in the past few weeks as traders priced in much of what the Fed will do this year, there hasn’t been any sense of panic selling.
The Fed wants to keep it that way. Ending asset purchases one month early would only stoke panic, without delivering any meaningful benefits in fighting inflation. Such a move wouldn’t make much sense from a risk management perspective.
Therefore, if the Fed sticks to its current plan to end asset purchases in March, the initial reaction in the dollar may be slightly negative as those looking for an early stop are left disappointed.
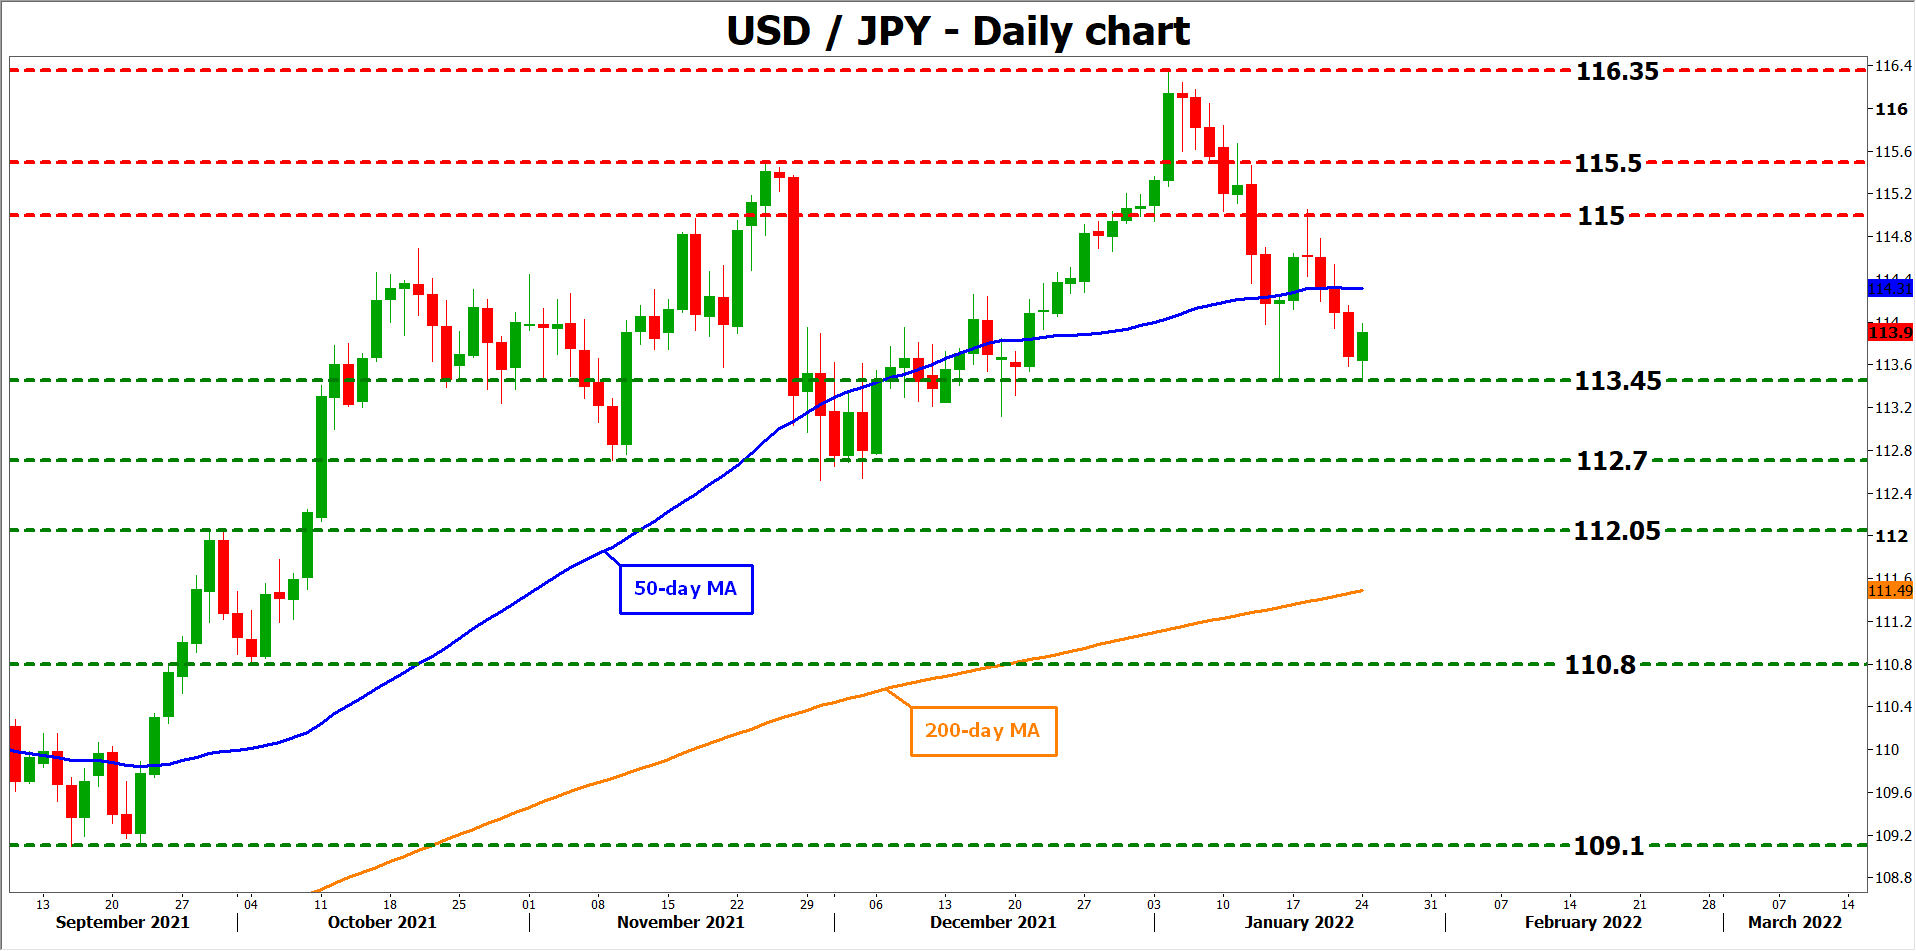
Looking at dollar/yen from a technical perspective, the pair could encounter immediate support near the 113.45 level, a violation of which would turn the focus towards 112.70.
On the upside, the first target for the bulls may be the 115.00 region.
Dollar still attractive overall
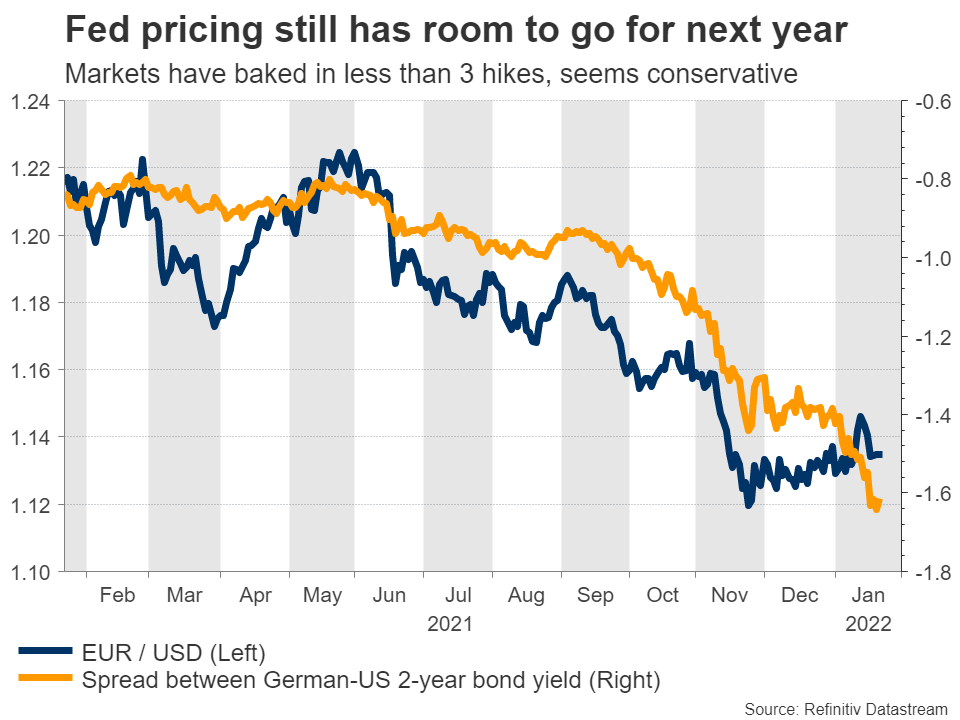
In the bigger picture, the outlook for the dollar remains favorable over the next few months. The US economy is booming and although the markets have already priced in much of what the Fed will do this year, the pricing for next year still has some room to grow.
Money markets are currently pricing in less than three hikes for next year, which may turn out to be too conservative. Hence, Treasury yields can still move higher, widening the dollar’s interest rate advantage.
Likewise, the dollar tends to perform well during periods of market stress thanks to its status as the reserve currency, which may come in handy if the rest of the year is as volatile as January has been.
The main risk to this view would be any signs of ‘peak inflation’ in the coming months. If investors sense that the wild days of inflation are behind us already, they could dial back bets for aggressive Fed tightening. However, that’s probably a story for March or even later.
Finally, note that beyond the Fed meeting, there’s also a barrage of US data releases this week, including the first estimate of GDP for the last quarter on Thursday.
NZDUSD : Forecasting The Decline After Elliott Wave Zig Zag
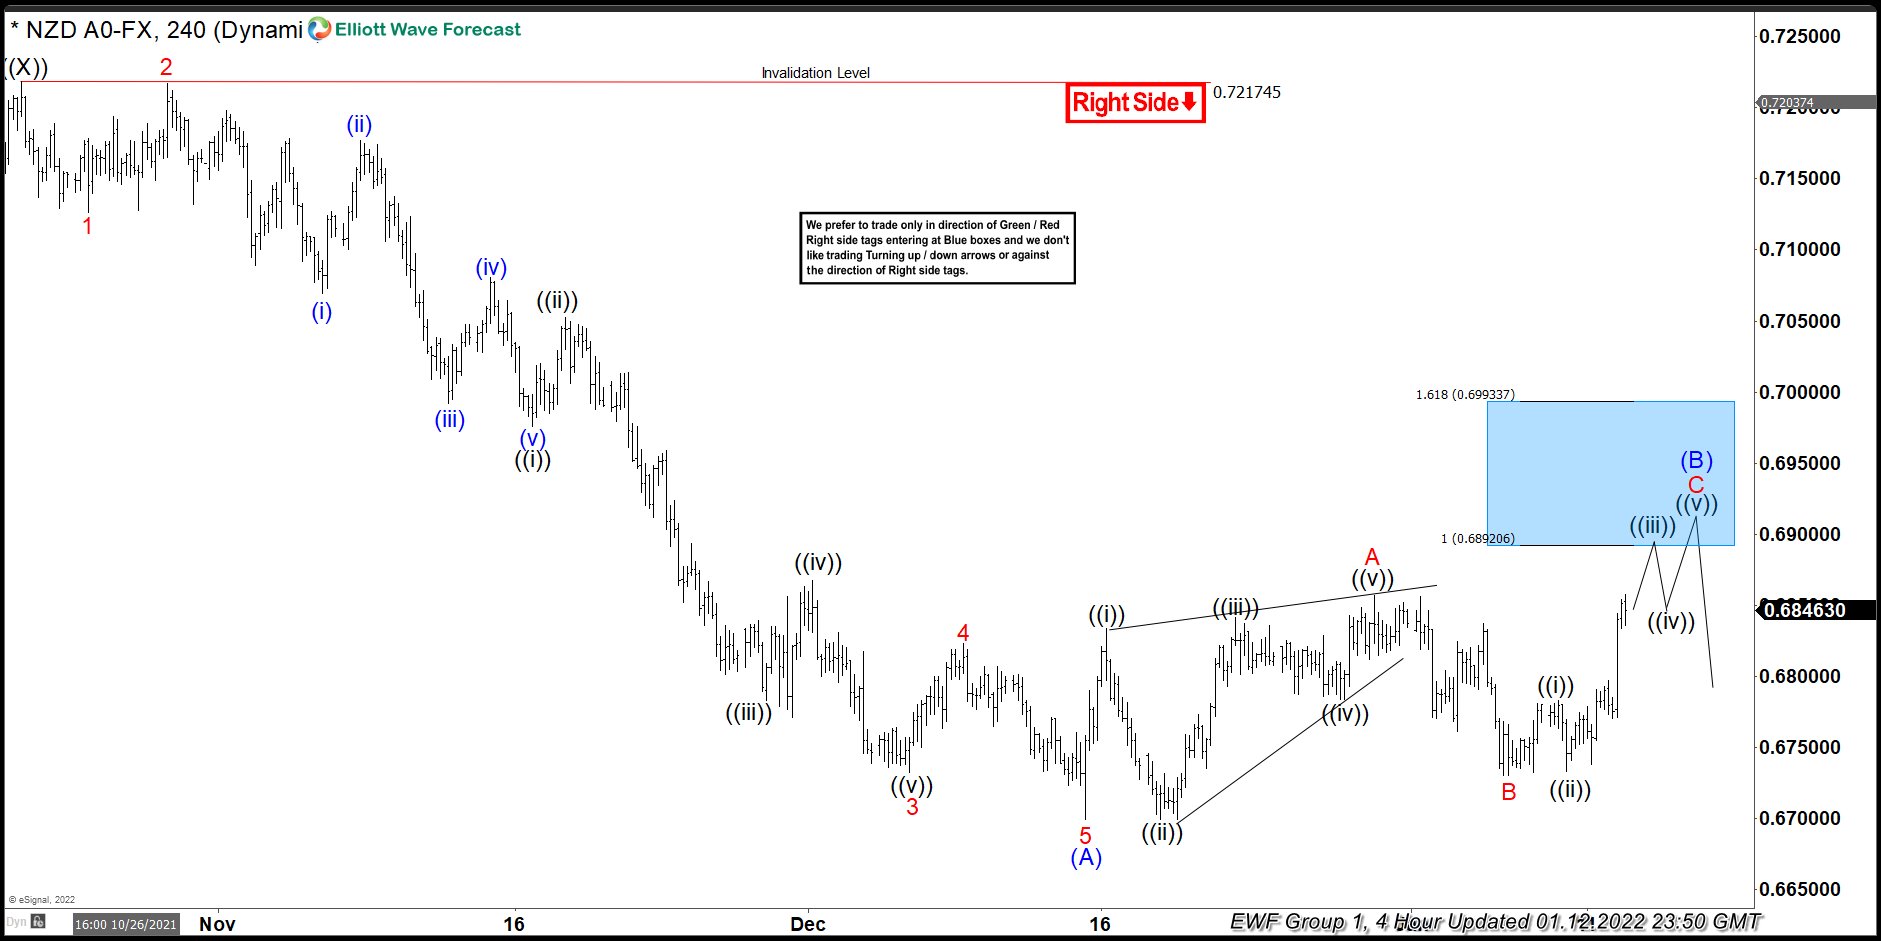
Hello fellow traders. In this technical blog we’re going to take a quick look at the Elliott Wave charts of NZDUSD. As our members know, NZDUSD is showing incomplete bearish sequences in the cycle from the February 2021 peak. Recently the pair gave us 3 waves bounce against the 0.7217 peak. Recovery unfolded as Elliott Wave Zig Zag pattern ABC. Once the price reached equal legs A-B sellers appeared and we got the turn lower. In the further text we are going to explain the Elliott Wave Pattern and the Forecast.
Before we take a look at the real market example, let’s explain Elliott Wave Zigzag pattern.
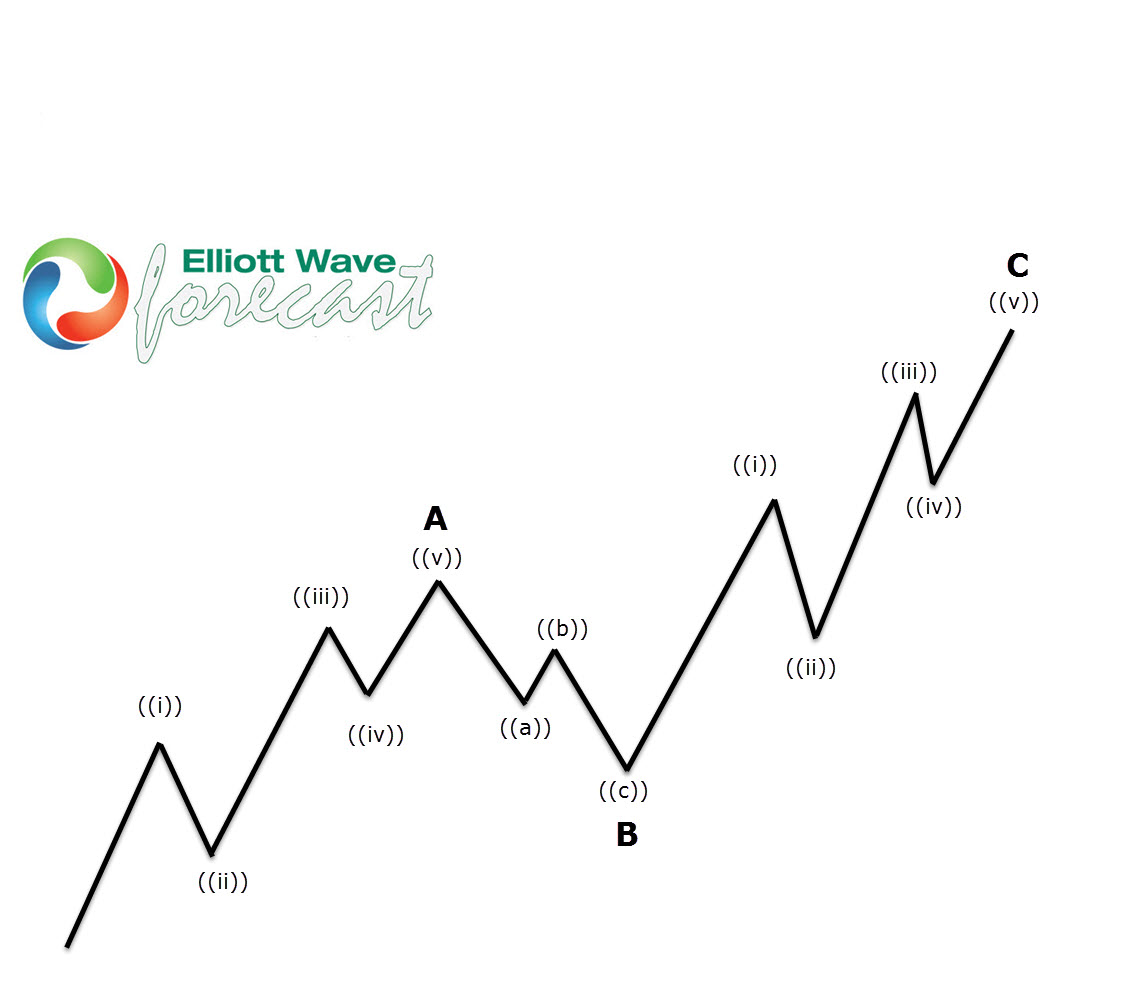
Elliott Wave Zigzag is the most popular corrective pattern in Elliott Wave theory . It’s made of 3 swings which have 5-3-5 inner structure. Inner swings are labeled as A,B,C where A =5 waves, B=3 waves and C=5 waves. That means A and C can be either impulsive waves or diagonals. (Leading Diagonal in case of wave A or Ending in case of wave C) . Waves A and C must meet all conditions of being 5 wave structure, such as: having RSI divergency between wave subdivisions, ideal Fibonacci extensions and ideal retracements.
NZDUSD H4 Elliott Wave Analysis 01.12.2022
NZDUSD is correcting the cycle from the 0.72174 peak. Recovery looks incomplete at the moment. So far we got 5 waves up from the lows, which is uggesting we have ended only first leg of potential Elliott Wave Zig Zag Pattern . Consequently we are calling for another leg up toward 0.6892 + area to complete (B) blue recovery as Elliott Wave Zig Zag pattern. Proposed leg up which should be also made out of 5 waves.We don’t recommend buying the pair and favor the short side from higher levels once (B) recovery reaches its extremes. ( blue box)
As our members know Blue Boxes are no enemy areas , giving us 85% chance to get a pull back.
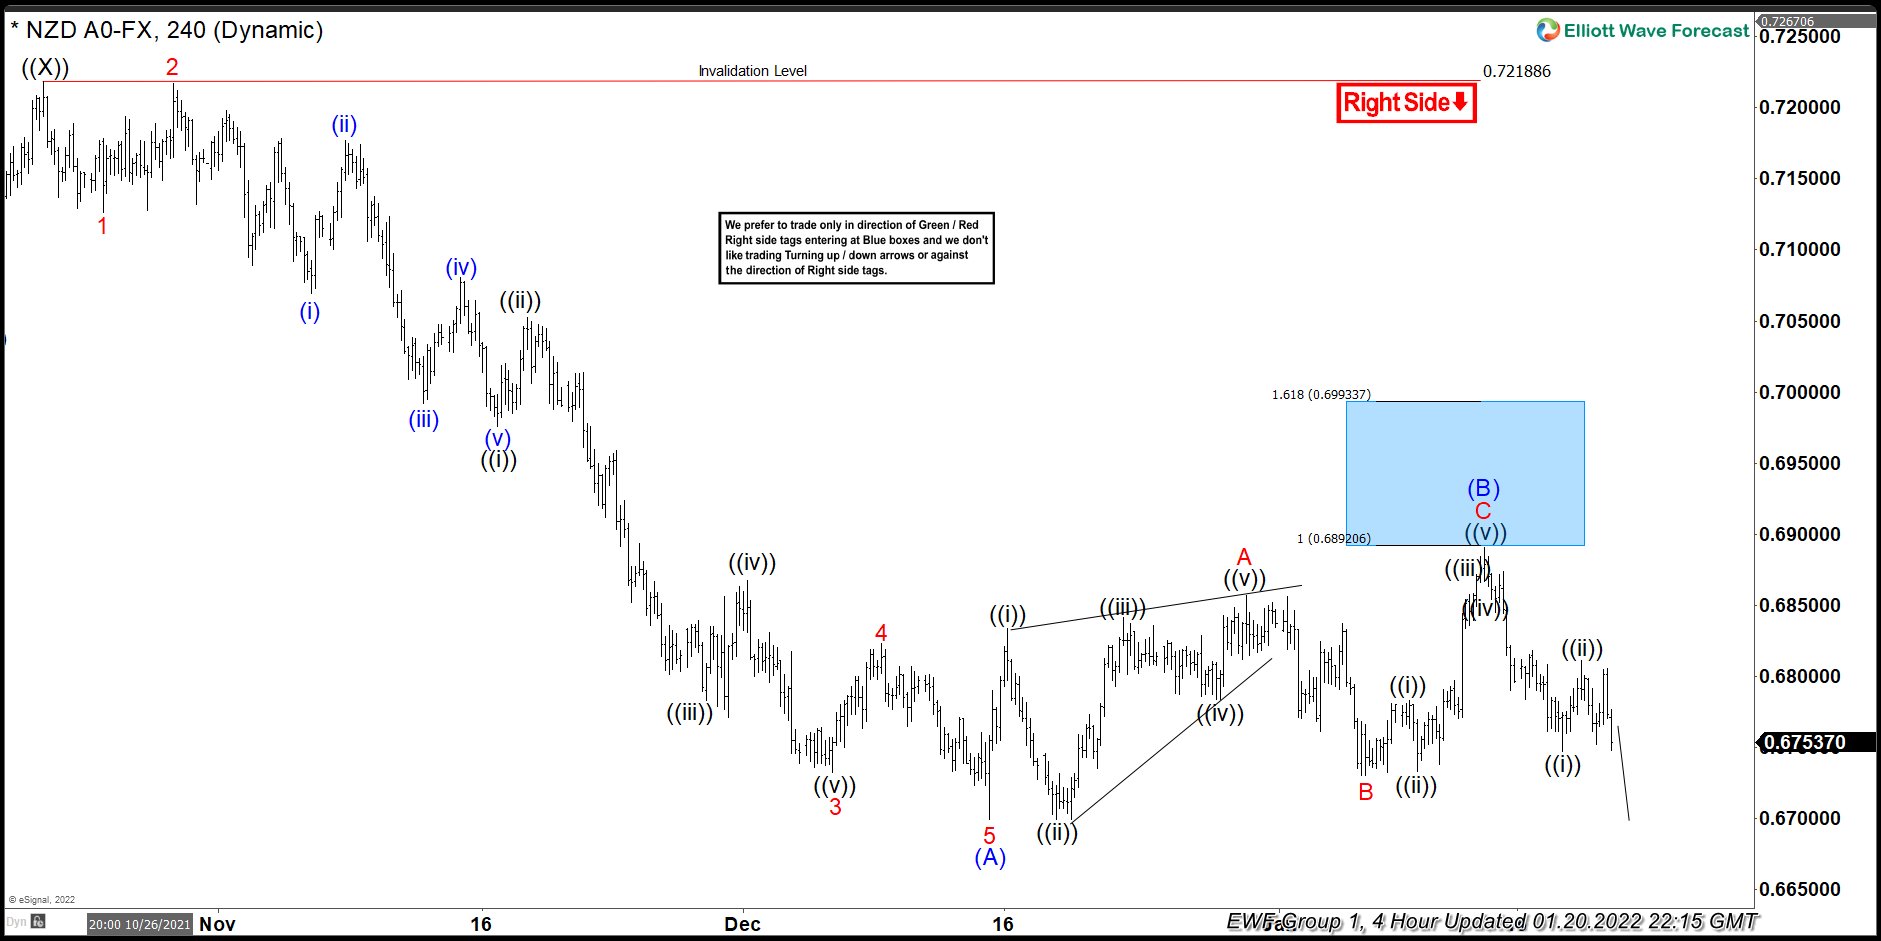
NZDUSD H4 Elliott Wave Analysis 01.12.2022
The price almost reached equal legs area at 0.6892 ( blue box) and made turn lower from there. Entry zone was missed by a few pips. At this stage we are calling recovery completed at 0.68912 high. Now we would like to see further extension down and break below (A) blue low – 12/15 low which would be confirmation wave (C) is in progress.
Keep in mind market is dynamic and presented view could have changed in the mean time. You can check most recent charts in the membership area of the site. Best instruments to trade are those having incomplete bullish or bearish swings sequences.We put them in Sequence Report and best among them are shown in the Live Trading Room.
Bitcoin – Brief Respite or Recovery?
Rollercoaster start to the week
It’s been an awful couple of months for bitcoin , plunging more than 50% from its highs and looking extremely vulnerable to further losses.
What started as a correction in the cryptocurrency has morphed into part of a broader sell-off that’s pummelled bitcoin along with other risk assets. The concerning thing for bitcoin is that there is still plenty of anxiety in the markets and it is not far away from a massive support level .
Some may be encouraged by the rebound in the second half of today’s session but it’s still early days. Risk assets have taken a beating and this rebound only erases a small portion.
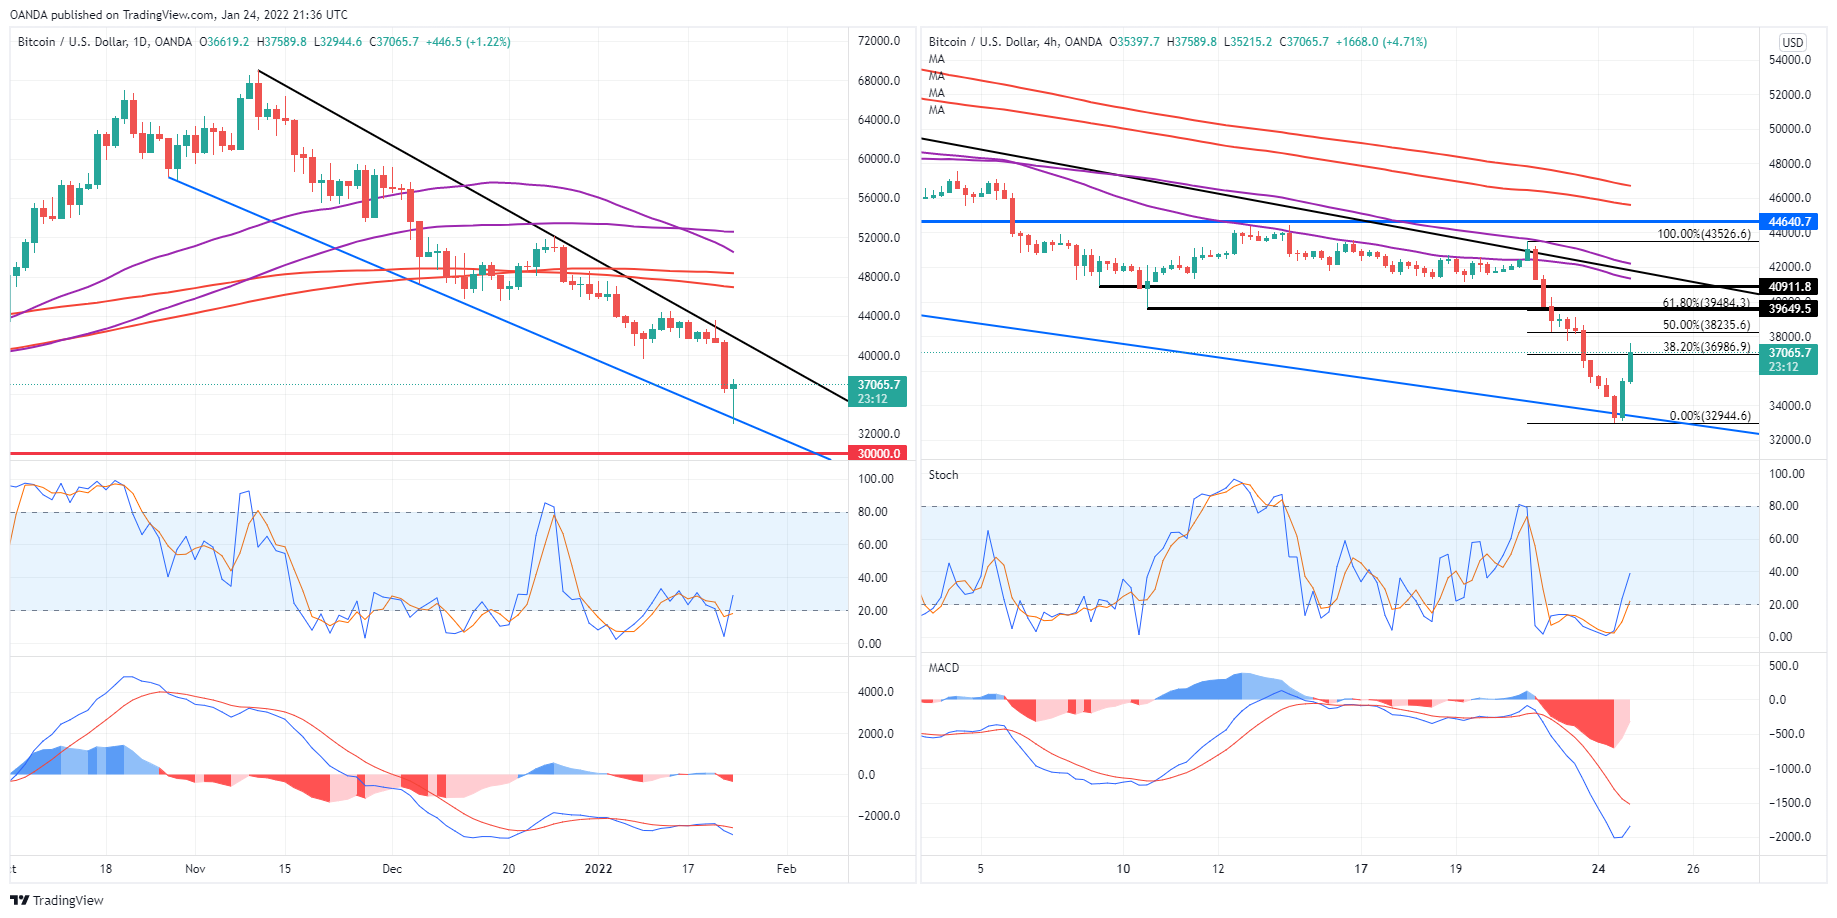
What’s more, prior to the rebound there was still plenty of momentum in the sell-off, as you can see on the 4-hour chart. What will be telling is how the momentum indicators react to the next move lower.
In the meantime, the rebound brings some relief. But I’m not sure the anxiety in the markets has passed. There’s a lot to come this week that will influence risk appetite – the Fed on Wednesday, tech earnings , developments in Ukraine.
By the end of the week, we should have a much better grasp of whether the worst is behind us or there’s more pain to come. In the interim, the key level is $30,000. A major barrier of support for the last 12 months and if that falls, things could get much worse and fast.
Stocks, Crypto Losses Overdone?
After a brighter start to the new week, it was more of the same since the European markets opened. US index futures have turned negative, along with European indices as investors continue to shun risk. Indeed, it is not just stocks that are taking a hammering. Cryptos, commodity dollars and emerging market currencies were also sharply lower.
The key question is this: will the sentiment turn positive any time soon? It is impossible to say, but we do have the Fed meeting this week and there is a chance Jay Powell may talk down the prospects of aggressive tightening. What’s more, the upcoming tech earnings could lift the mood after what has so far been a weak start to the reporting season. Additionally, the spread of omicron in Europe appears to be slowing and governments have reduced travel restrictions, while workers in the UK have been encouraged to go back to the office. So, we may see some improvement in the economy in the months ahead.
But for now, the trend is clearly negative. The loss of appetite for risk comes on the back of overindulgence last year. This year, investors have realised that the era of zero-interest rate policy is coming to an end faster because inflation is soaring. On Wednesday, the Fed is widely expected to provide the clearest signal yet that the first rate hike since 2018 will be coming our way in March.
What’s more, tensions around Ukraine and a relatively poor start to the US fourth quarter reporting season have not helped sentiment whatsoever. It is unquestionable that the sell-off has been turbo-charged because of technical selling as more and more support levels have broken down in popular stocks or indices.
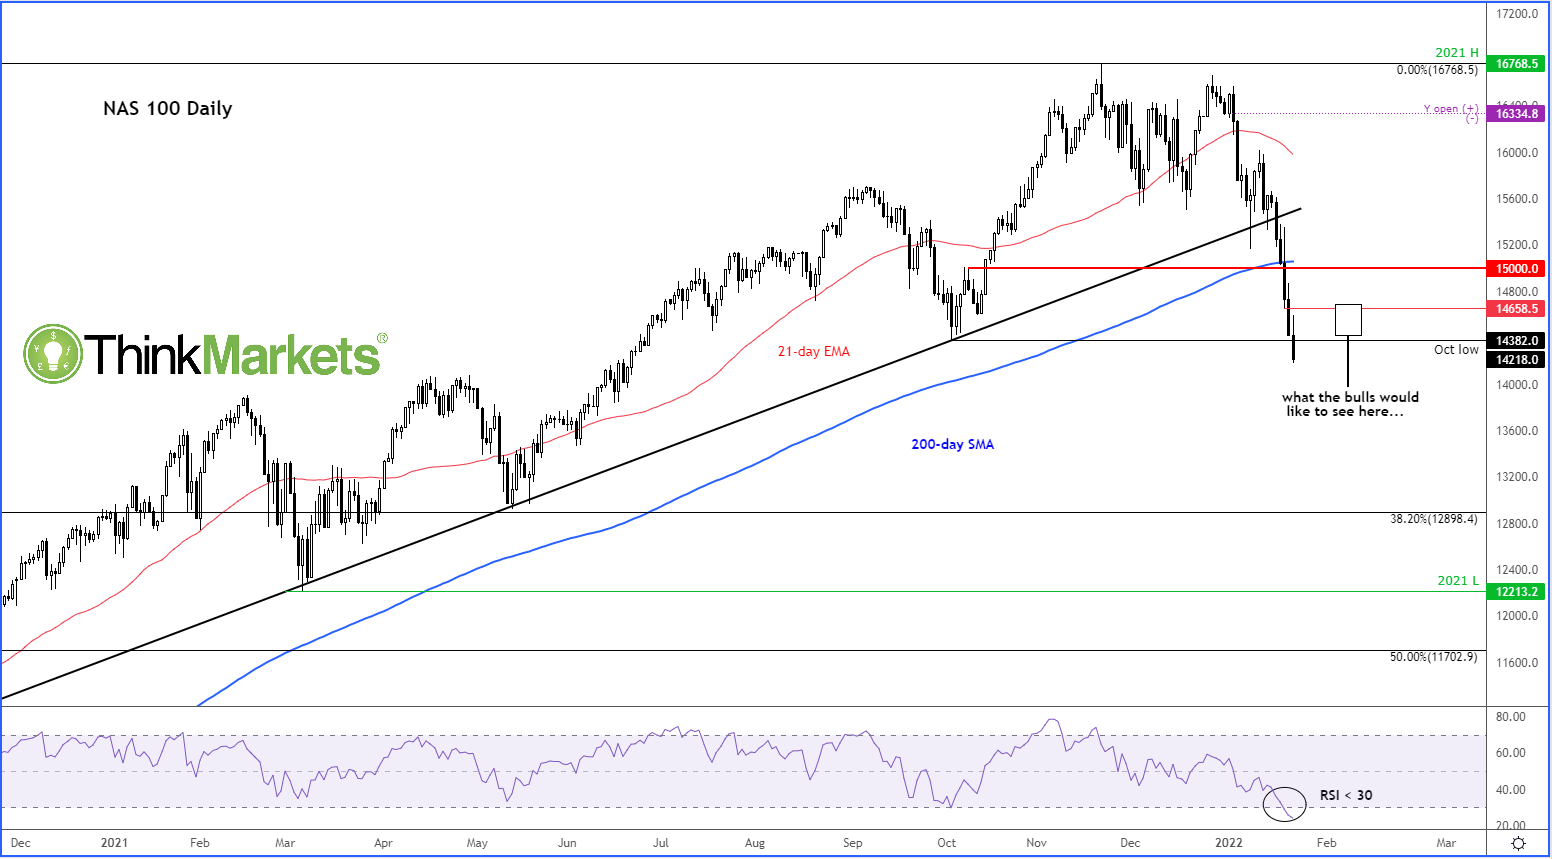
Speaking of which, the Nasdaq has just broken below yet another support: the October 2021 low of 14380ish ahead of earnings from Microsoft, Tesla and Apple:
NasdaqSource: ThinkMarkets and TradingView.com
With the Relative Strength Index at oversold levels of sub 30, I wouldn’t be surprised to see some “bargain hunting,” possibly as early as today or this week.
If we do see the indices such as the DAX and Nasdaq come back strongly here, I would like to see the formation of a strong hammer candle such as the one I have drawn on the chart.
EURGBP Wave Analysis
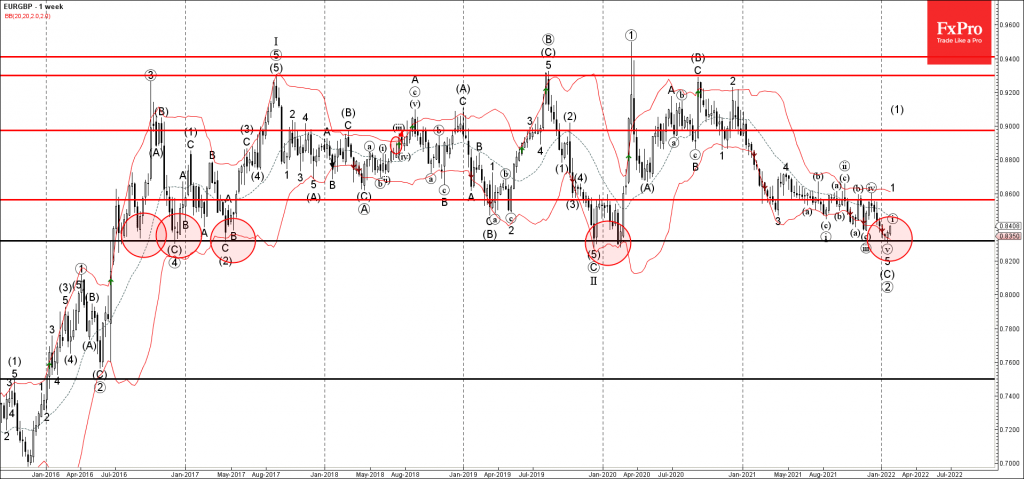
- EURGBP reversed from long-term support level 0.835
- Likely to rise to resistance level 0.6800
EURGBP currency pair recently reversed up from the long-term support level 0.835 (which has been steadily reversing the pair from 2016), strengthened by the lower weekly Bollinger Band.
The upward reversal from the support level 0.835 stopped the previous downward impulse waves 5 and (C).
Given the strength of the term support level 0.835 – EURGBP currency pair can be expected to rise further toward the next resistance level 0.6800.
Cryptocurrencies are Far from Support
The cryptocurrency fear and greed index was down to 11 on Sunday and slightly up to 13 by early Monday. Crypto market capitalisation lost another 1.1% overnight to $1.61 trillion, the lowest since August.
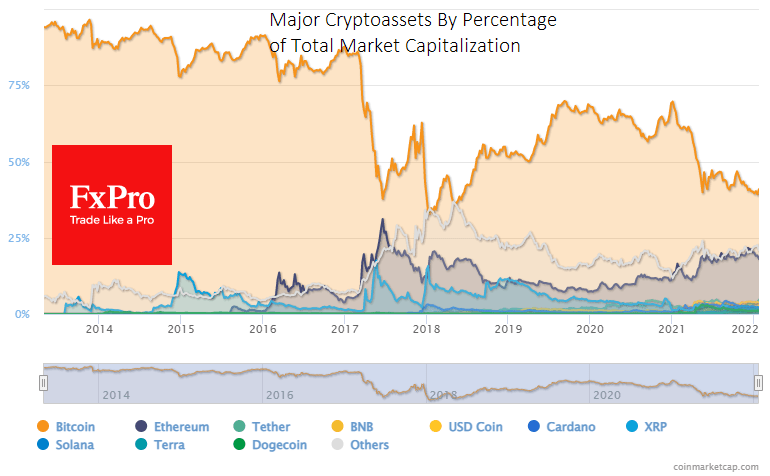
As is often the case with prolonged sell-offs, altcoins are falling with acceleration to the first cryptocurrency, causing BTC’s share gains, which already stands at 41.3% against lows of 39.3% in mid-January. Bitcoin’s share of 40% seems like a turning point, twice triggering a correction in the crypto market.
This level stood like an informal threshold that optimism about altcoins had gone too far.
However, the rise in bitcoin’s share does little to help its price. We saw the sixth consecutive bearish daily candlestick on Monday morning, and the price rolled back to $35K. The bears may well be able to sell the price down to $32.5K, closing the gap of July and returning the rate to last summer’s support area.
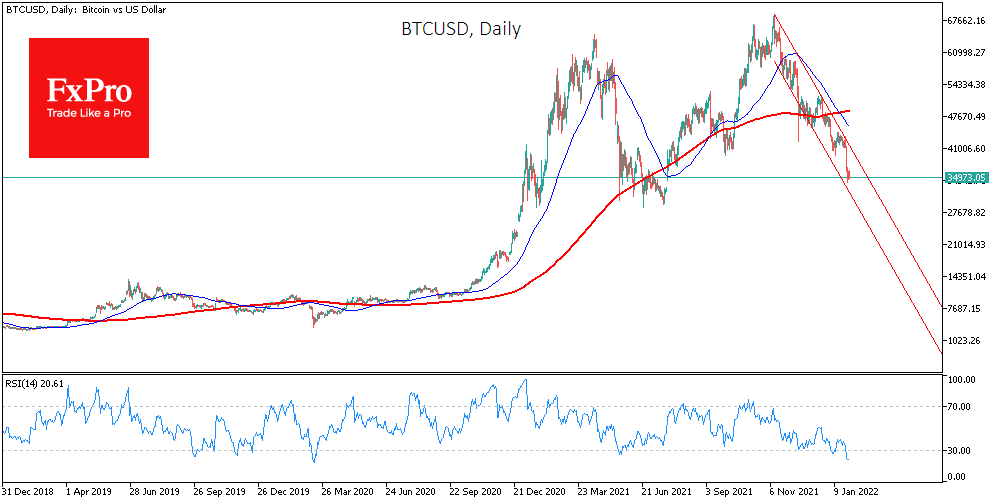
Alarmingly, the sharp reversal on Friday was not followed by any meaningful bounce. Some observers point out that this is a worrying signal, suggesting further market declines, as we have not seen a final capitulation. Without capitulation, the markets will remain with an overhang of sellers.
The price of ether has fallen to $2400, which is less than half of its peak price in November.
Events are developing in a bearish scenario, so far broadly repeating what we saw in 2018 in terms of overall sentiment. Long-term buyers can avoid buying at prices above 30k for bitcoin and 2k for ether.
We believe long-term investors will look out for purchases in the 20-30k per bitcoin area. Whether these purchases will be at the upper or lower boundary depends, among other things, on the situation in the stock markets. The return of buyers there will support the demand for risk among institutional investors. But as long as we see only steady selling from them, it is too early to talk about buying.