Sample Category Title
USD/CAD Daily Outlook
Daily Pivots: (S1) 1.2560; (P) 1.2631; (R1) 1.2707; More...
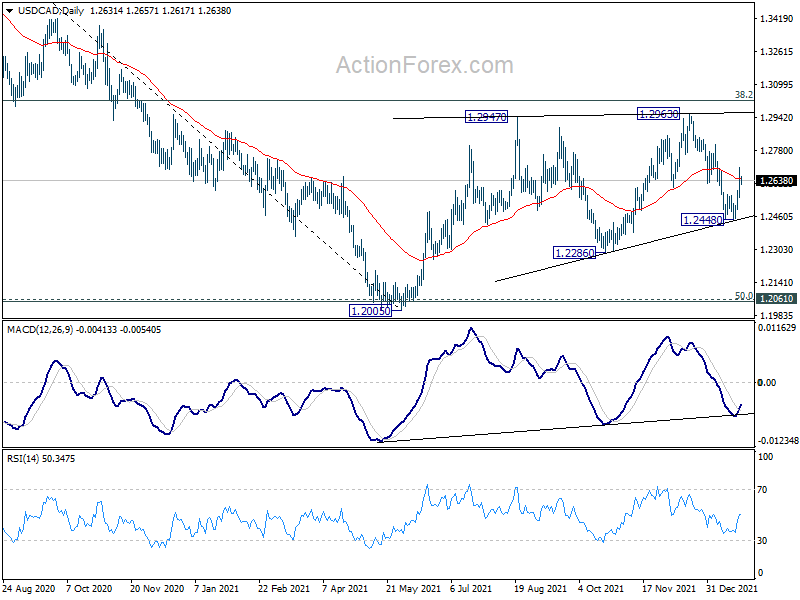
Intraday bias in USD/CAD remains mildly on the upside at this point. Pull back from 1.2964 should have completed with three waves down to 1.2448. Further rally would be seen to 1.2812 resistance first, and then 1.2963. On the downside, below 1.2553 minor support will mix up the near term outlook and turn intraday bias neutral.
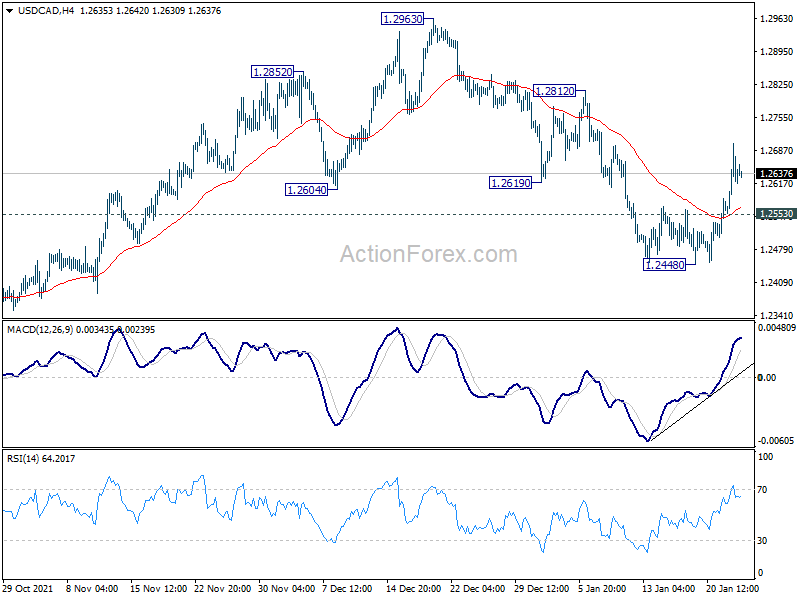
In the bigger picture, focus stays on 38.2% retracement of 1.4667 (2020 high) to 1.2005 (2021 low) at 1.3022. Sustained break there should confirm that the down trend from 1.4667 has completed after defending 1.2061 long term cluster support. Further rise would then be seen towards 61.8% retracement at 1.3650. However, rejection by 1.3022 will maintain medium term bearishness. Break of 1.2005 will resume the down trend form 1.4667 and that carries larger bearish implications too.
EUR/AUD Daily Outlook
Daily Pivots: (S1) 1.5765; (P) 1.5855; (R1) 1.5941; More...
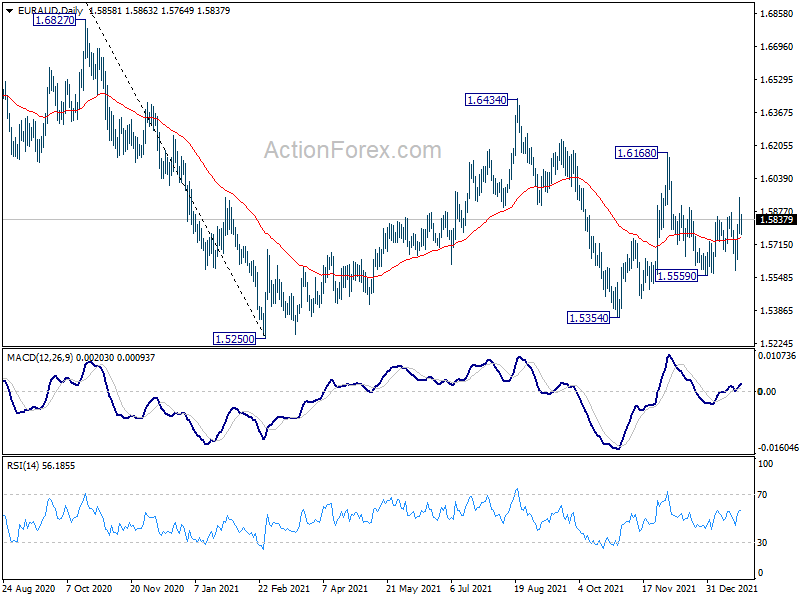
EUR/AUD spiked higher to 1.5944 but quickly retreated. Intraday bias stays neutral first. On the upside break of 1.5944 will resume the rise from 1.5559 to 1.6168 first. On the downside, break of 1.5559 will resume the fall from 1.6168 to retest 1.5250/5354 support zone.
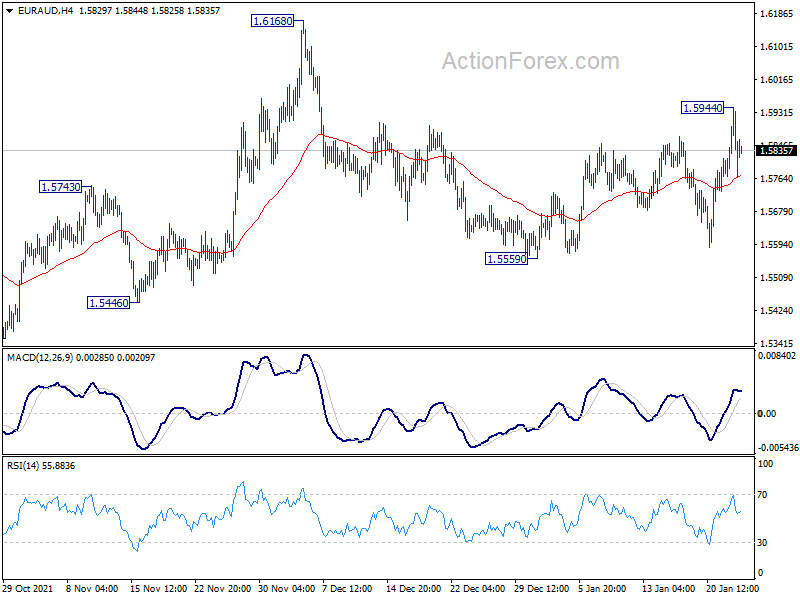
In the bigger picture, rise from 1.5354 is seen as the third leg of the corrective pattern from 1.5250 low. Further rise cannot be ruled out, but even in that case, strong resistance should be seen at 38.2% retracement of 1.9799 to 1.5250 at 1.6988. Larger down trend from 1.9799 is in favor to extend through 1.5250 at a later stage.
EUR/GBP Daily Outlook
Daily Pivots: (S1) 0.8356; (P) 0.8390; (R1) 0.8427; More...
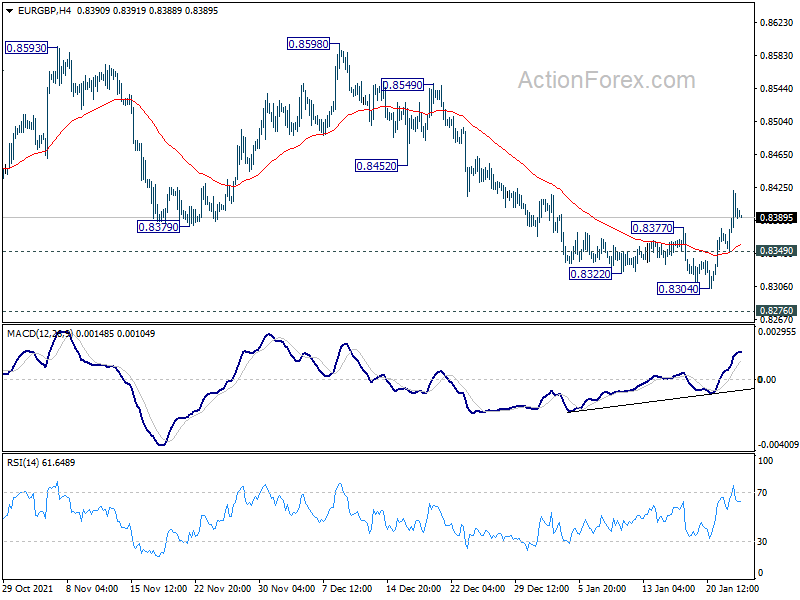
Intraday bias in EUR/GBP remains mildly on the upside at this point. Rebound from 0.8304 is still in progress. Sustained break of 55 day EMA (now at 0.8421) will pave pave the way back to 0.8598 key structural resistance next. On the downside, however, break of 0.8349 will turn bias back to the downside for 0.8304 low instead.
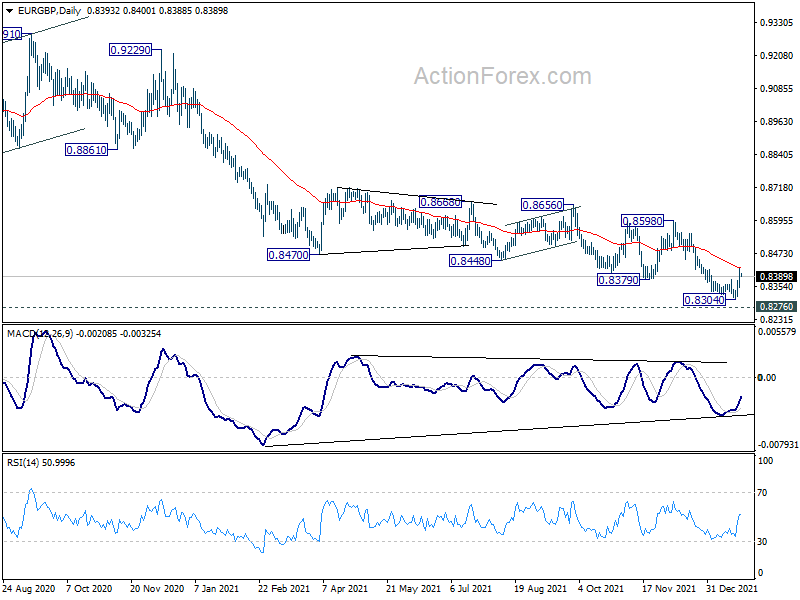
In the bigger picture, price actions from 0.9499 (2020 high) are still seen as developing into a corrective pattern. Deeper fall could be seen as long as 0.8598 resistance holds, towards long term support at 0.8276. We'd look for bottoming signal around there to bring reversal. Meanwhile, firm break of 0.8598 will now be an early sign of medium term bottoming and bring stronger rebound. However, sustained break of 0.8276 will argue that the long term trend has reversed.
EUR/CHF Daily Outlook
Daily Pivots: (S1) 1.0315; (P) 1.0337; (R1) 1.0374; More....
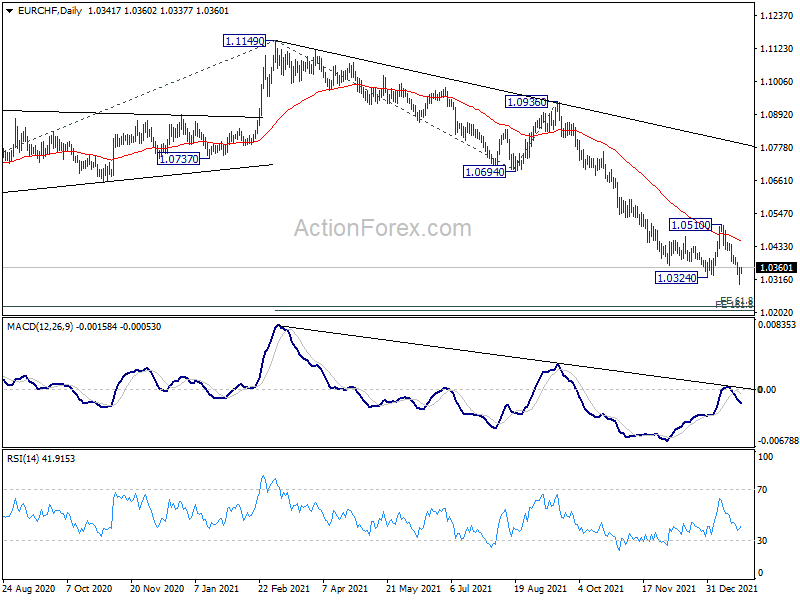
EUR/CHF's down trend resumed by taking out 1.0324 and hit as low as 1.0298. But a temporary low was quickly formed and intraday bias is turned neutral again first. Upside of recovery should be limited below 1.0510 resistance to bring another fall. Break of 1.0298 will resume the down trend from 1.1149 and target 161.8% projection of 1.1149 to 1.0694 from 1.0936 at 1.0200 next.
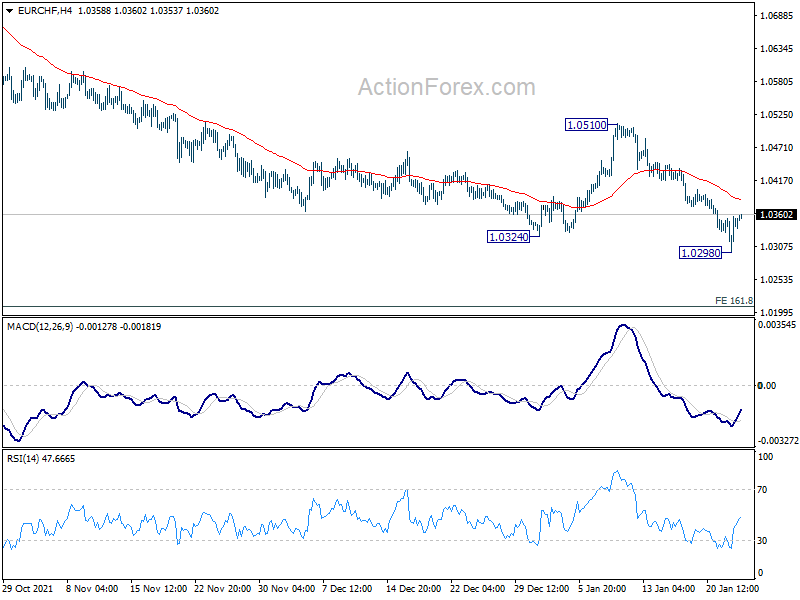
In the bigger picture, long term down trend from 1.2004 (2018 high) is still in progress. Next target is 61.8% projection of 1.2004 to 1.0505 to 1.1149 at 1.0223. On the upside, firm break of 1.0505 support turned resistance is needed to be the first sign of medium term bottoming. Otherwise, outlook will remain bearish even in case of rebound.
EUR/JPY Daily Outlook
Daily Pivots: (S1) 128.61; (P) 128.89; (R1) 129.36; More....
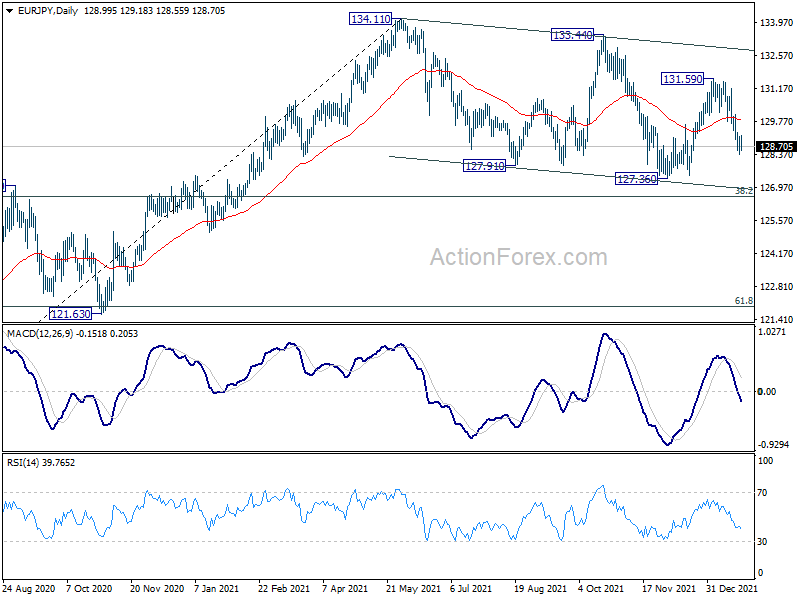
Intraday bias in EUR/JPY remains on the downside for the moment. Consolidation pattern from 134.11 is extending with another leg. Deeper decline would be seen to 127.36, and possibly further to 126.58 fibonacci level. On the upside, above 130.07 minor resistance will turn bias back to the upside to 131.59 resistance instead.
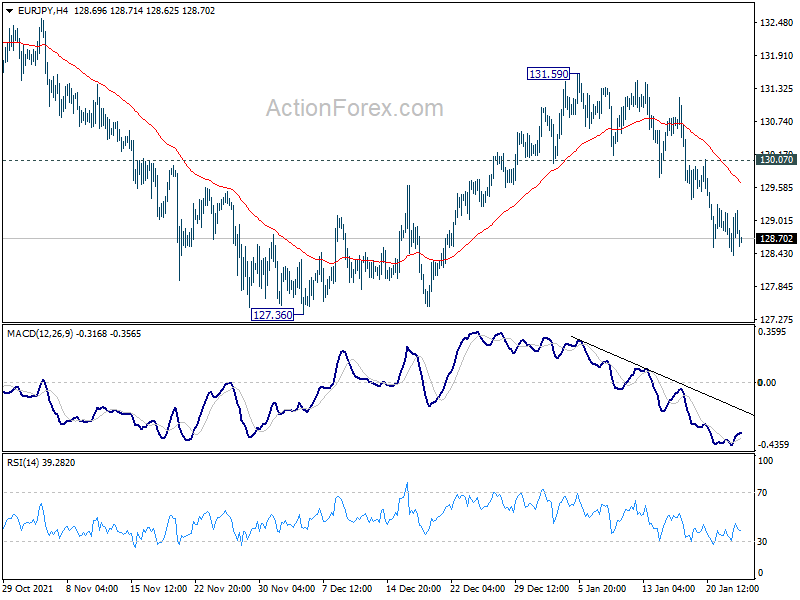
In the bigger picture, price actions from 134.11 are currently seen as a consolidation pattern only. As long as 38.2% retracement of 114.42 (2020 low) to 134.11 at 126.58 holds, up trend from 114.42 is still in favor to continue. Break of 134.11 will target long term resistance at 137.49 (2018 high). However, sustained break of 126.58 will raise the chance of medium term bearish reversal. In this case, deeper decline would be seen to 61.8% retracement at 121.94, and possibly below.
Elliott Wave View: 5 Swing Sequence in USDJPY Favors More Downside
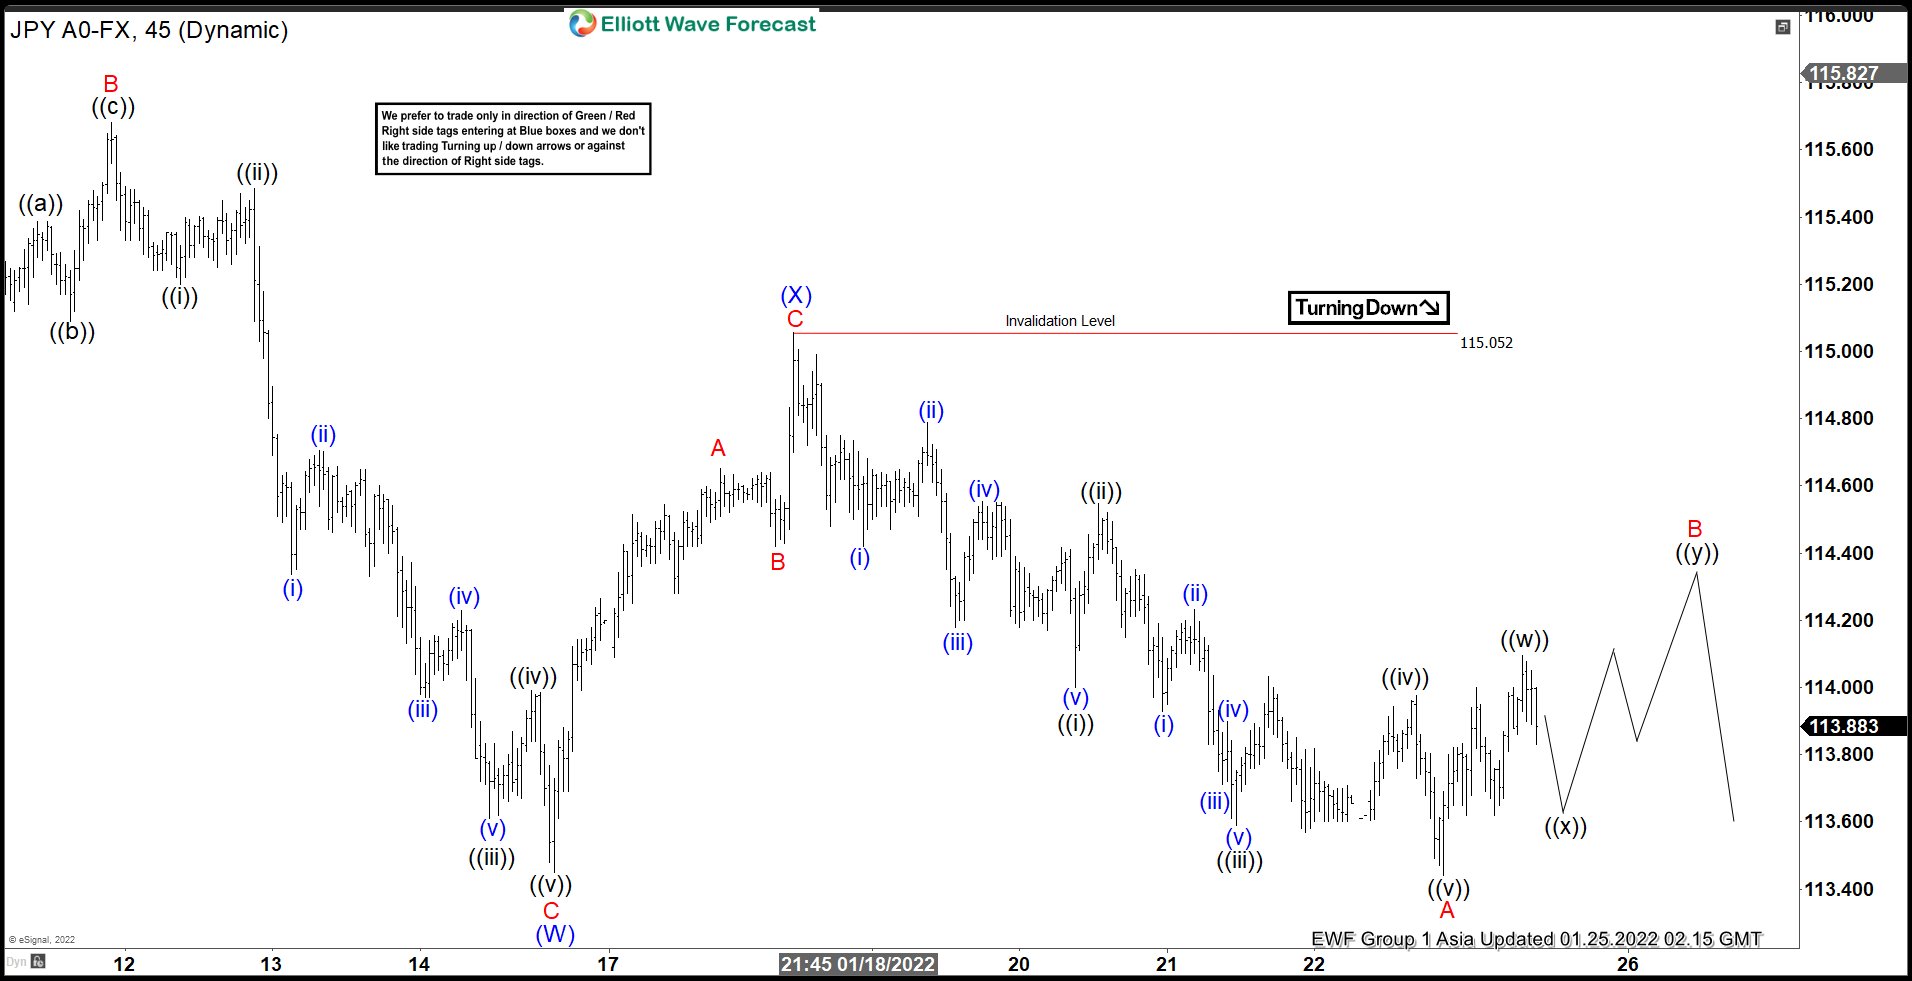
Short Term Elliott Wave view in USDJPY suggests the decline from January 4, 2022 high is unfolding as a double three Elliott Wave structure. Down from January 4, wave A ended at 115 and rally in wave B ended at 115.68. Pair then resumed lower in wave C towards 113.45. This completed wave (W) in higher degree. Rally in wave (X) ended at 115.06 with internal subdivision as a zigzag. Up from wave (W), wave A ended at 114.65, wave B ended at 114.42, and wave C ended at 115.05. This completed wave (X) in higher degree.
Pair has resumed lower in wave (Y) an broken below wave (W) at 113.45. This suggests the next leg lower has started. The internal subdivision of wave (Y) is in progress as another zigzag in lesser degree. Down from wave (X), wave A ended at 113.44 as an impulse. Wave B corrective rally is in progress to correct cycle from January 18, 2022 high before the decline resumes. Near term, as far as pivot at 115.05 high stays intact, expect rally to fail in the sequence of 3, 7, or 11 swing for further downside. Potential target lower is 100% – 123.6% Fibonacci extension from January 4, 2022 high which comes at 110.4 – 112.1 area.
USDJPY 45 Minutes Elliott Wave Chart
Technical Outlook and Review
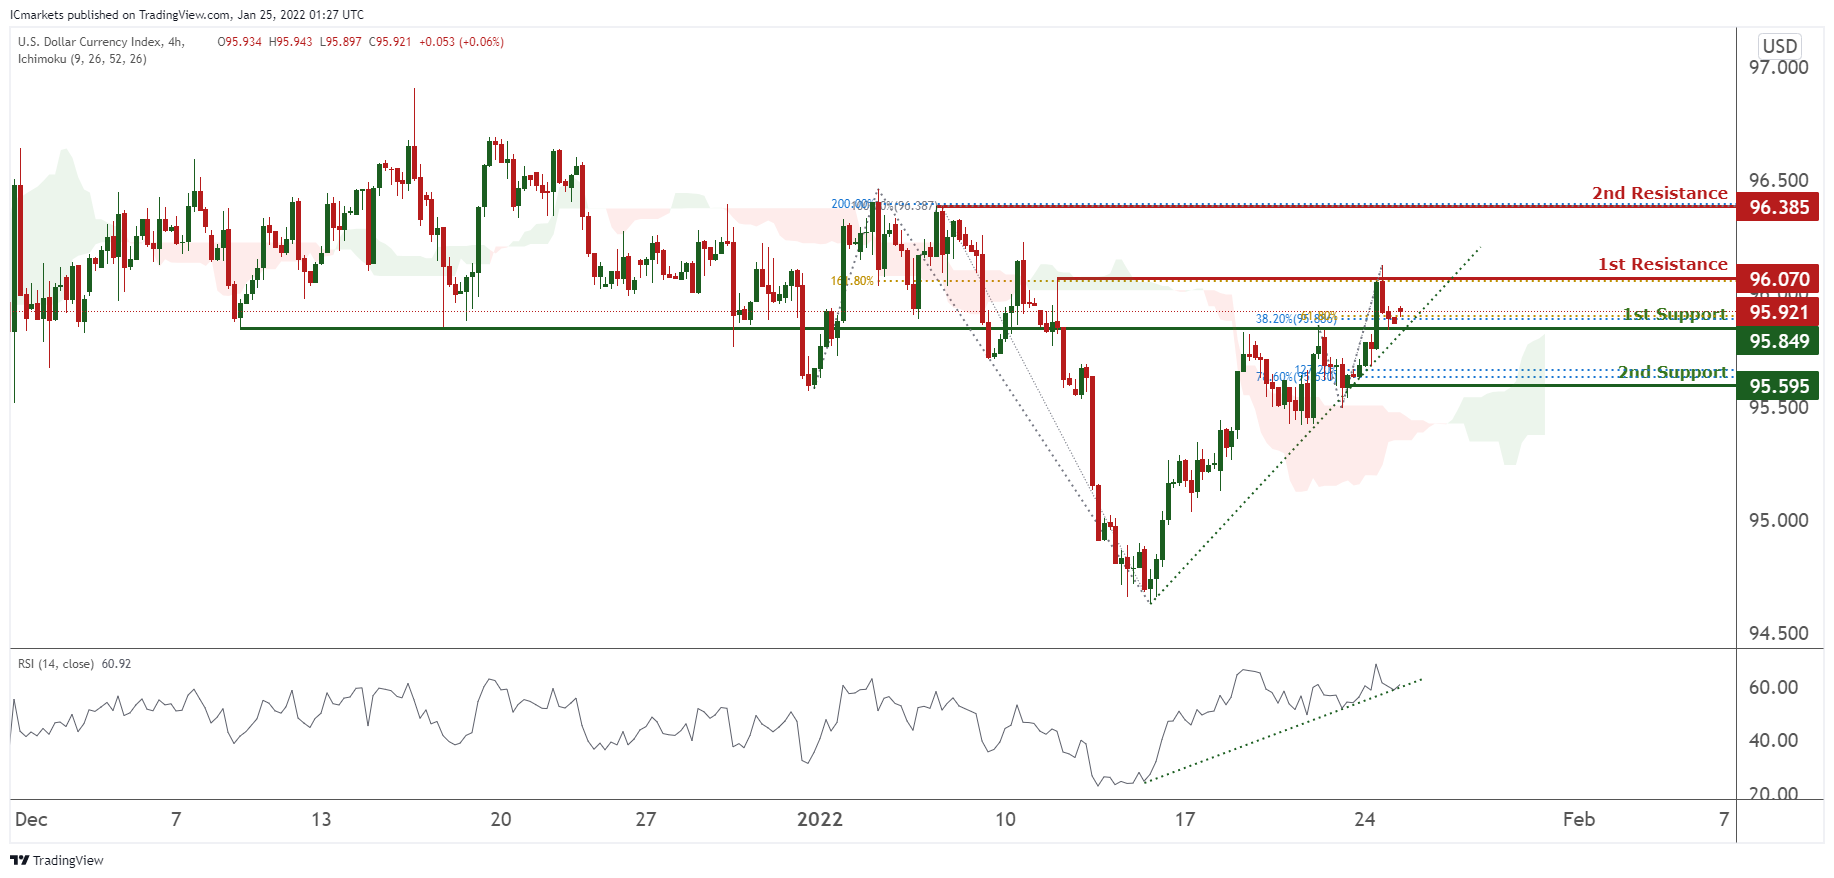
DXY:
On the H4 timeframe, prices are on bullish momentum and abiding to our ascending trendline. We would expect potentially a bounce from our 1st support at 95.921 in line with 38.2% Fibonacci retracement and 61.8% Fibonacci extension towards our 1st resistance at 96.070 in line with 161.8% Fibonacci projection. RSI is showing bullish momentum and prices are trading above our Ichimoku clouds, further supporting our bullish bias.
Areas of consideration:
- H4 time frame, 1st resistance at 96.070
- H4 time frame, 1st support at 95.849
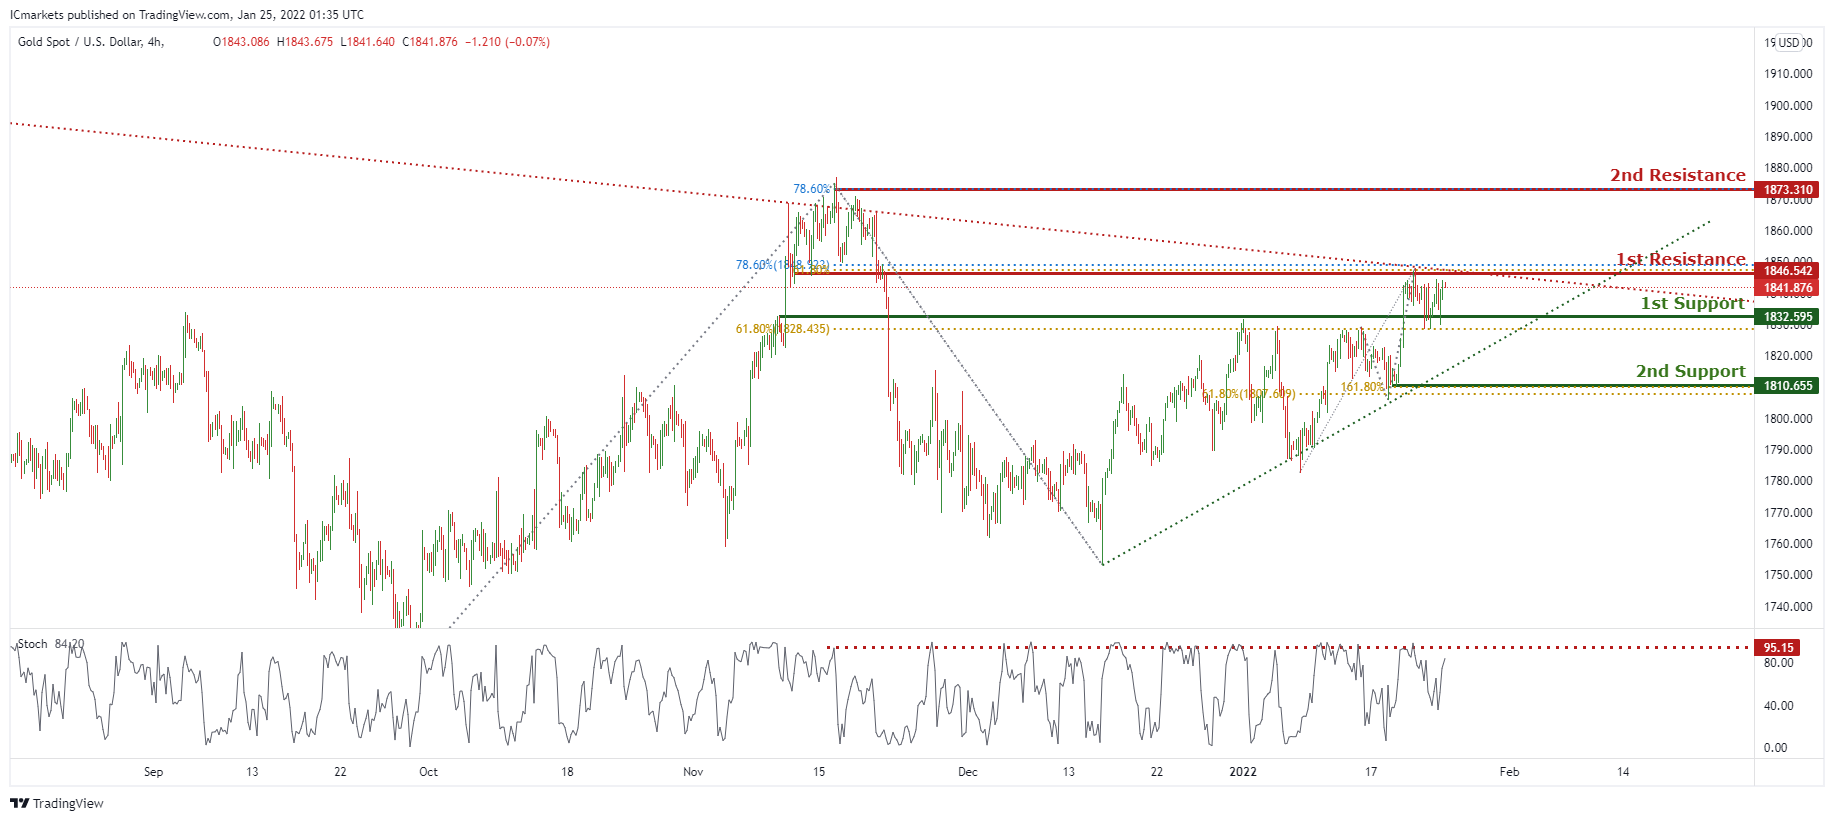
XAU/USD (GOLD):
On the H4 chart, prices are on bullish momentum and consolidating in a triangle pattern. We see a potential for a dip from our 1st resistance at 1846.542 in line with 78.6% Fibonacci extensions and 61.8% Fibonacci retracement towards our 1st support at 1832.595 in line with 61.8% Fibonacci retracement. Stochastics are close to a level where dips previously occurred.
Areas of consideration:
- 4h 1st support at 1832.595
- 4h 1st resistance at 1846.542
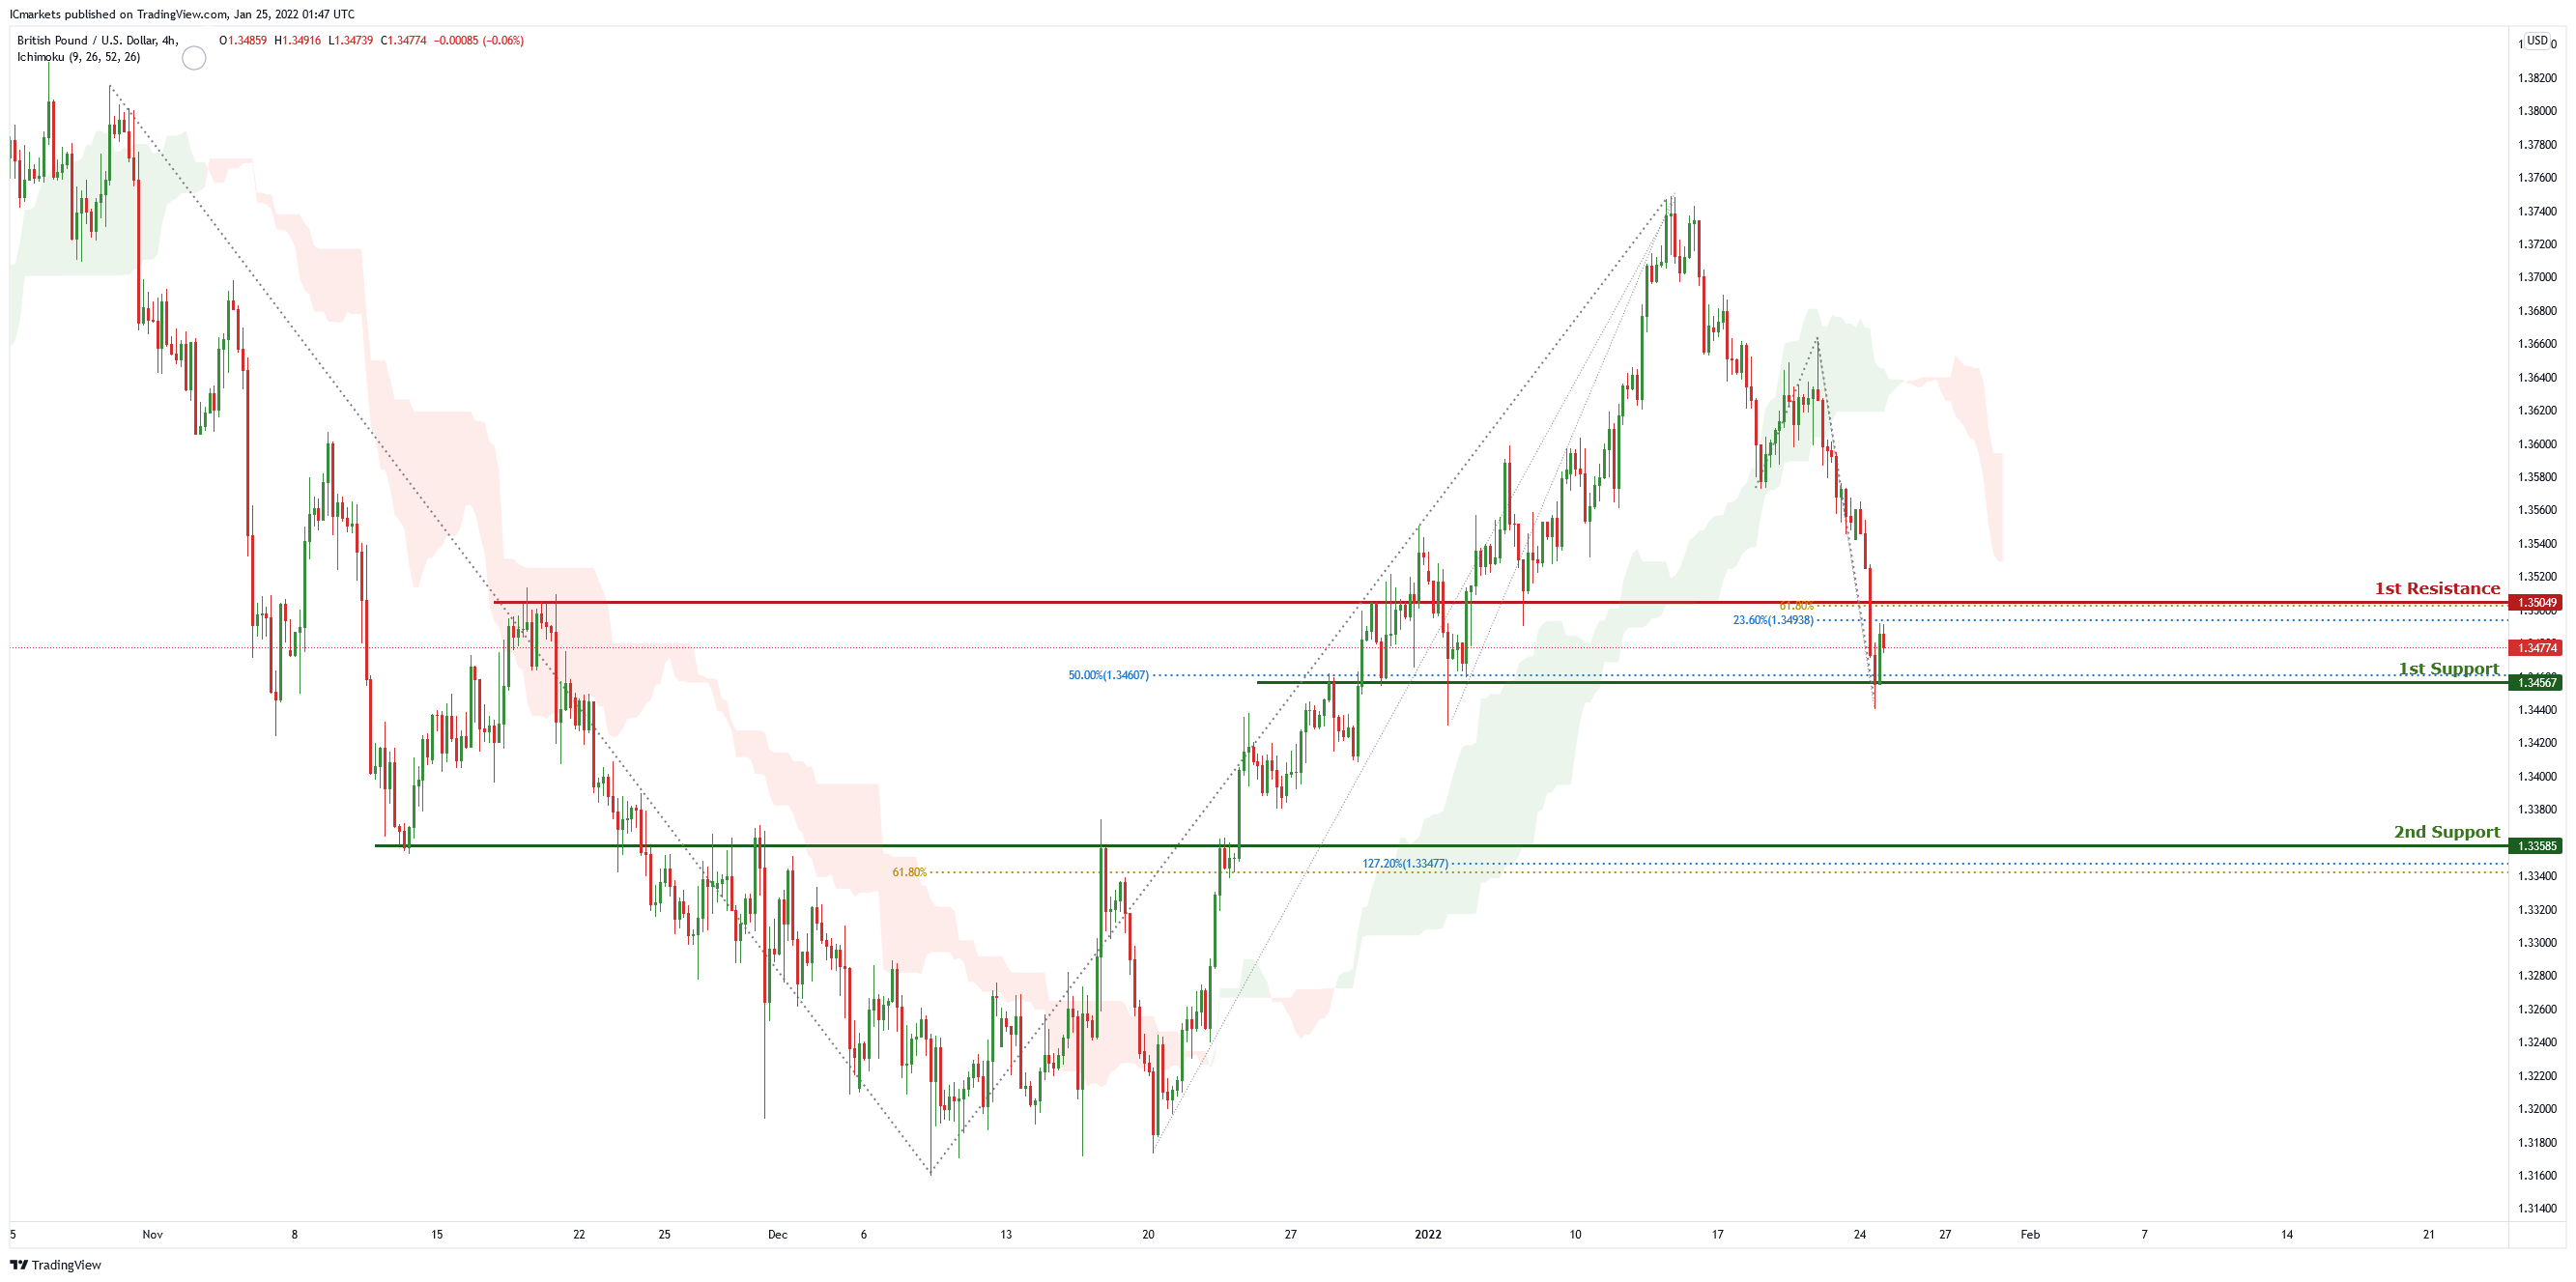
GBP/USD
On the H4 chart price is near 1st support level of 1.34567 which is also 50% Fibonacci retracement. Price can potentially dip to the 2nd support level of 1.33585 which is also 127.2% Fibonacci retracement and 61.8% Fibonacci projection. Our bearish bias is supported by the ichimoku cloud indicator as price is trading below it.
Areas of consideration
- H4 1st support 1.34567
- H4 2nd support 1.33585
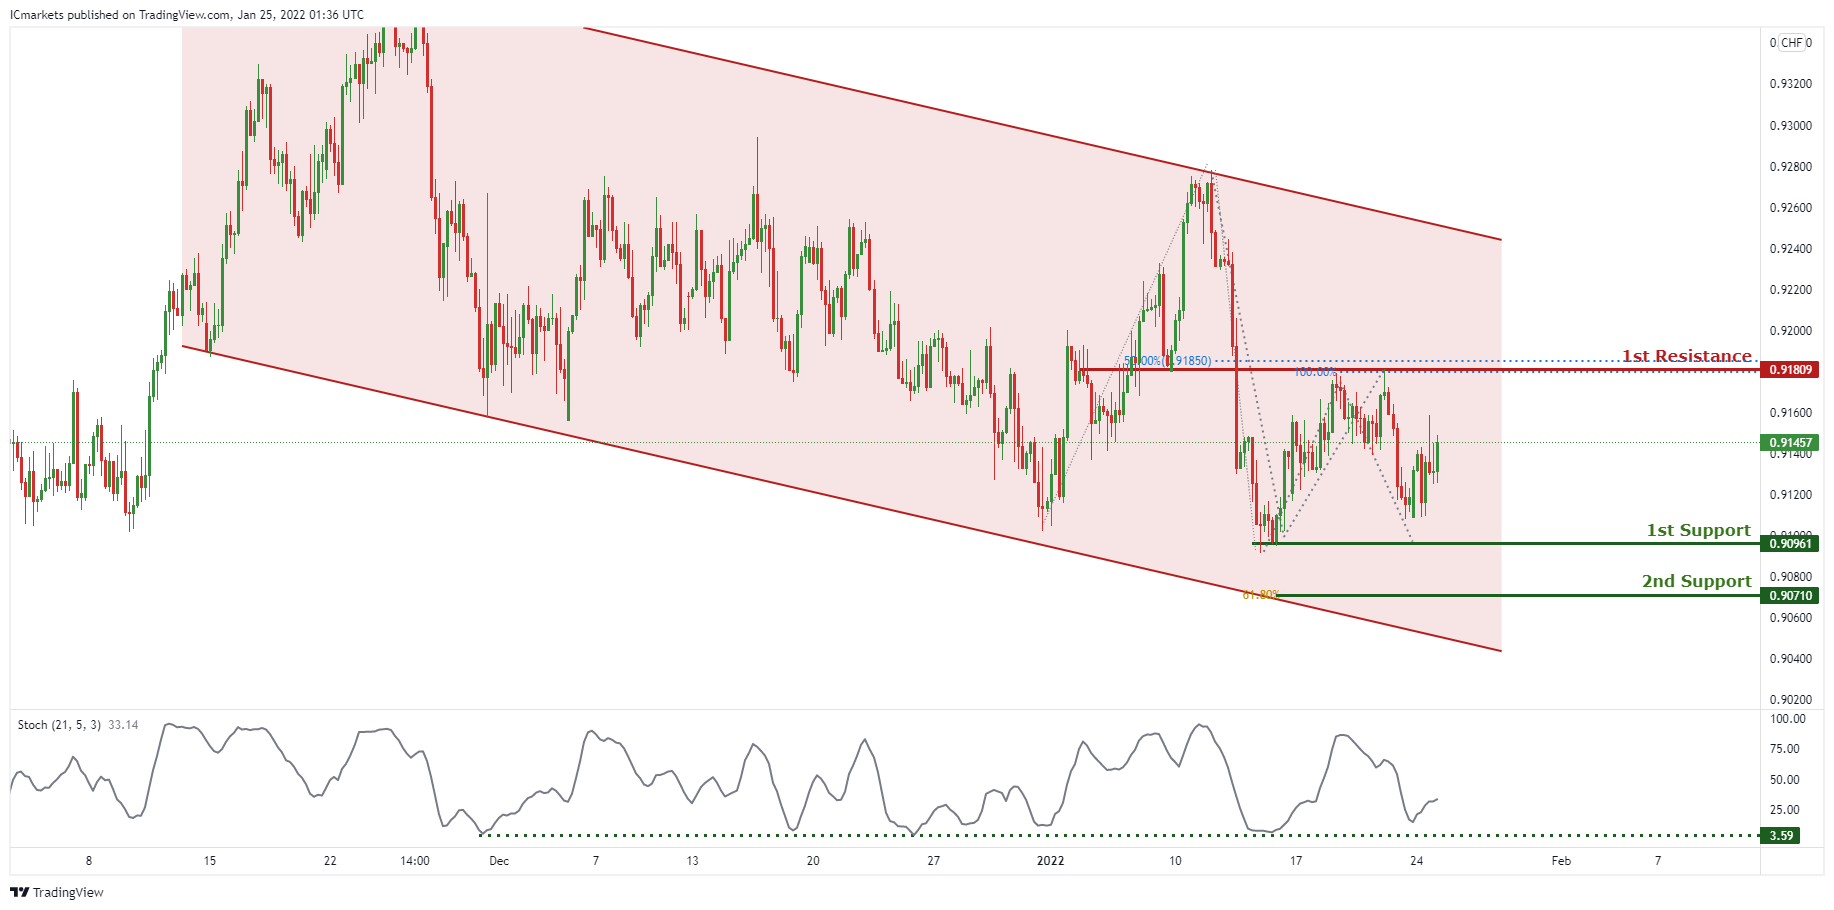
USD/CHF:
In reference to last week’s analysis, price indeed dropped from 1st Resistance and approaching 1st Support @ 0.90961. On the H4 timeframe, price is abiding to a descending channel, signifying a bearish momentum. However, we can expect price to make a short-term bullish bounce from 1st Support in line with previous swing low towards 1st Resistance in line with 100% Fibonacci projection and 50% Fibonacci retracement. Our short-term bullish bias is further supported by stochastic indicator where the %K line is approaching the support level. Traders can wait for prices to swing higher or lower before entering.
Areas of consideration:
- Watch 1st Support at 0.90961
- Watch 1st Resistance at 0.91809
EUR/USD :
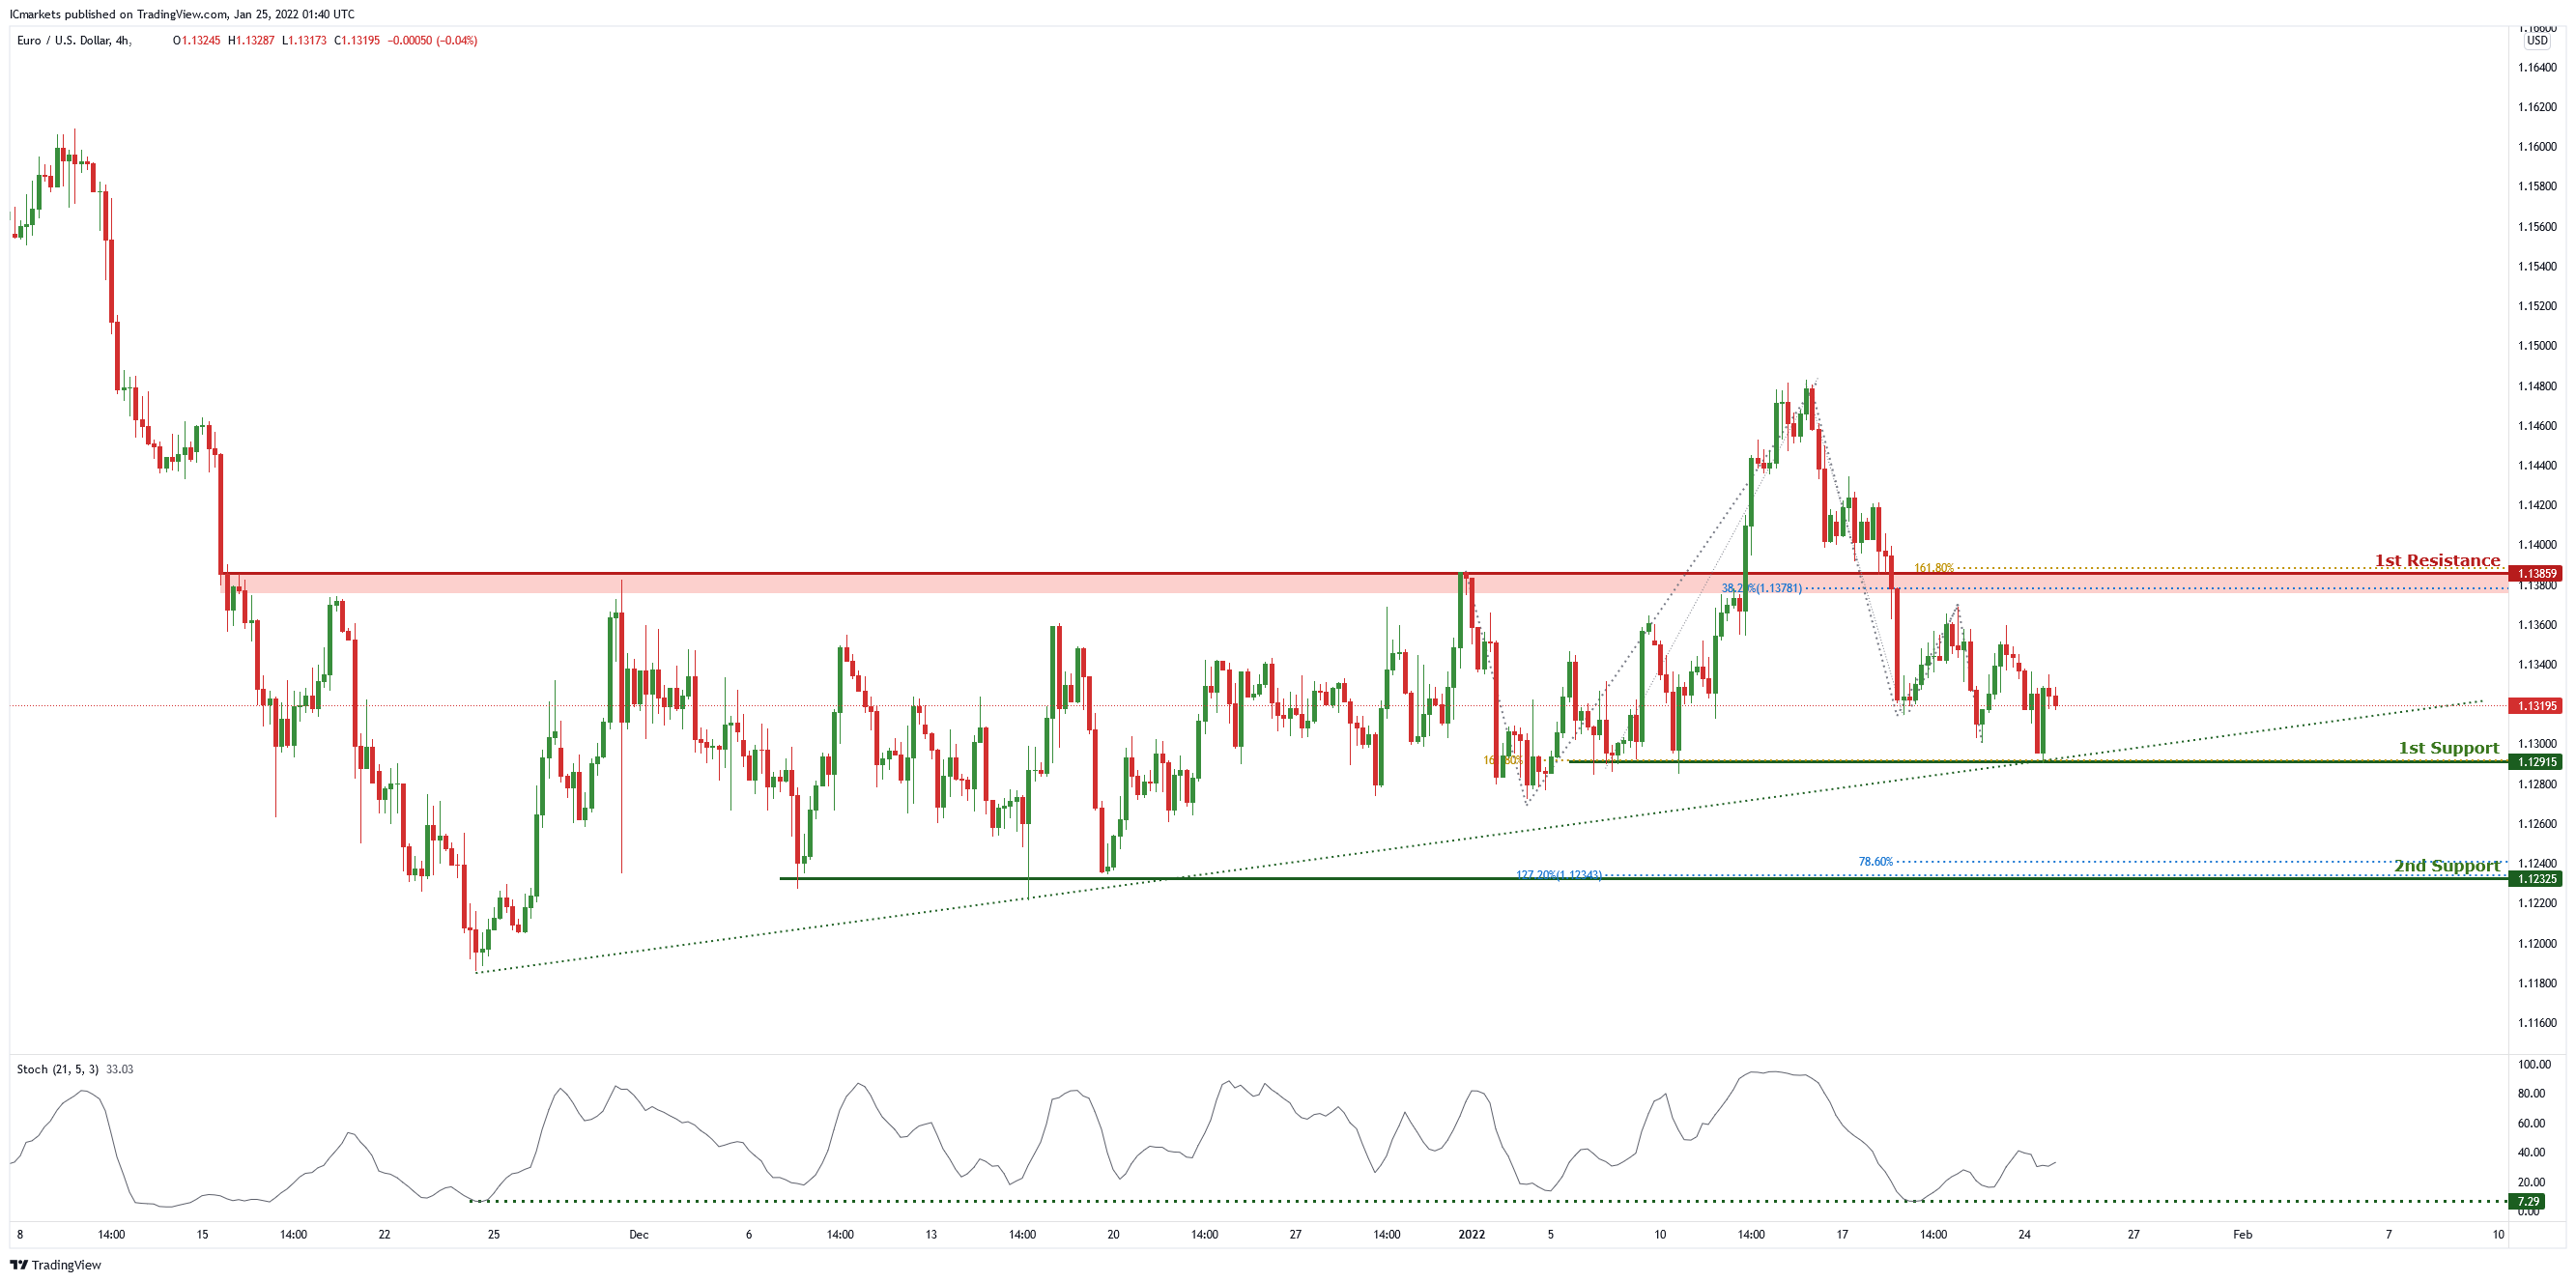
On the H4 chart , price is abiding by the ascending trendline and is in the middle of the 1st resistance of 1.13859 which is also 38.2% Fibonacci retracement, 61.8% Fibonacci projection and 1st support level of 1.12915 which is also 161.8% Fibonacci projection. Price can potentially go to the 1st resistance level. Our bullish bias is supported by the stochastic indicator as it is near support level.
Areas of consideration
- 1st resistance at 1.13859
- 1st support at 1.12915
USD/JPY:
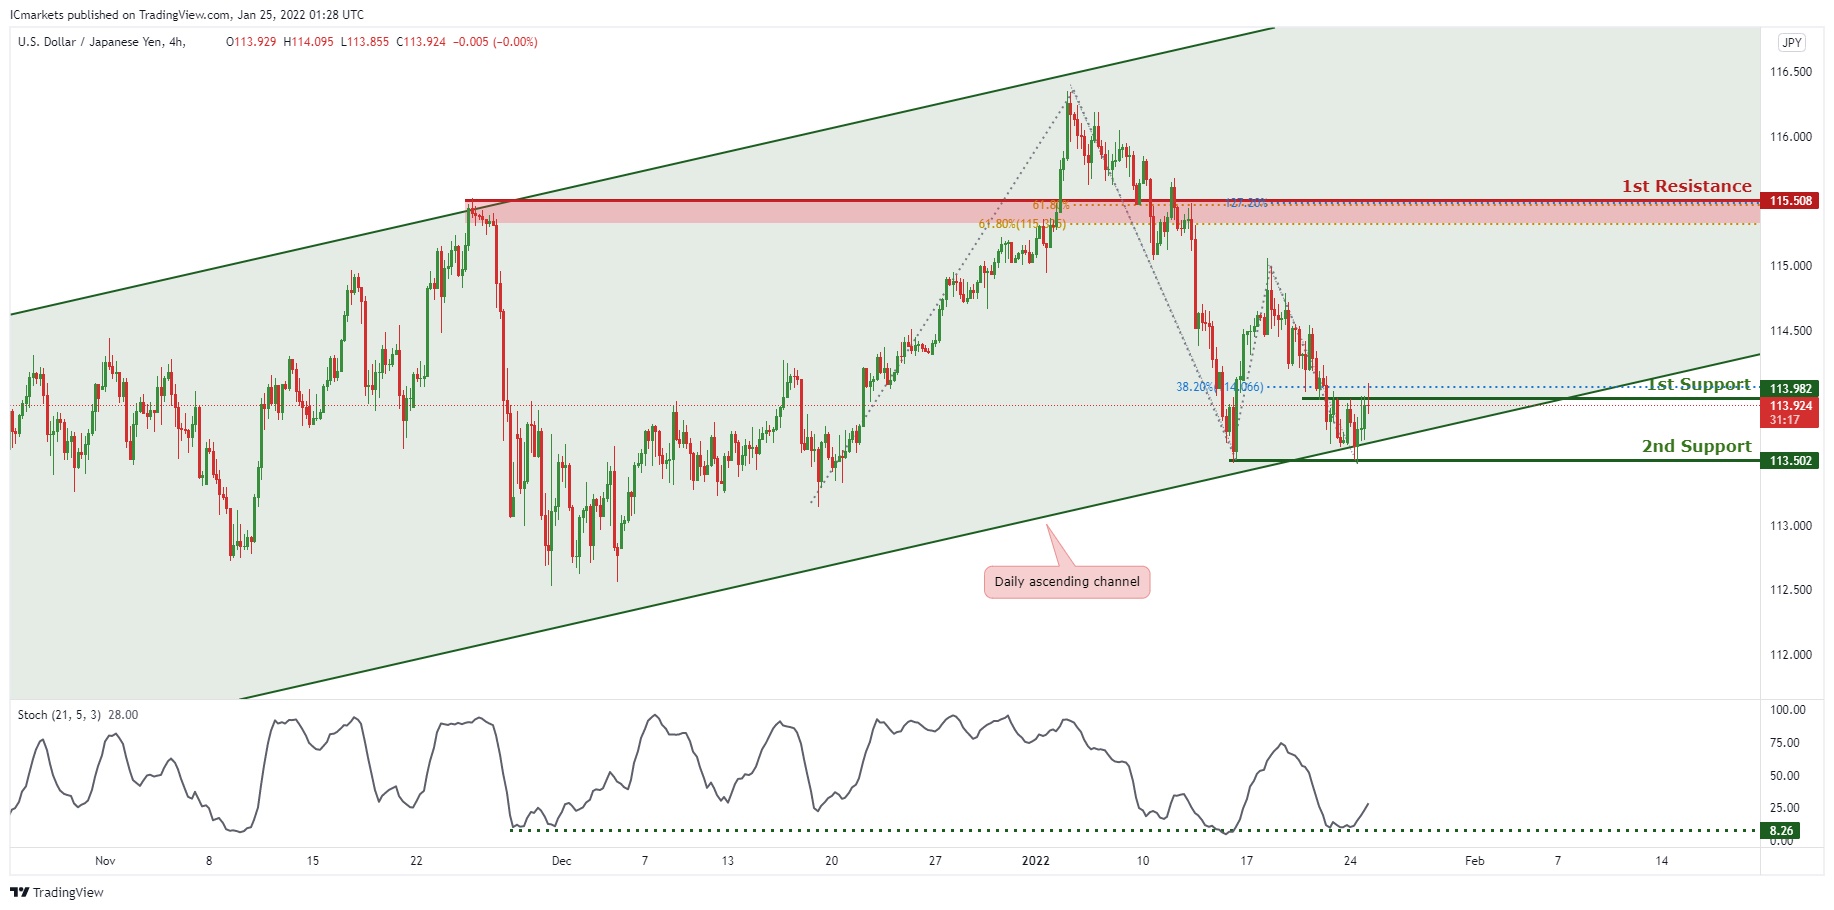
On the H4 timeframe, is abiding to the ascending channel on the daily, signifying an overall bullish momentum. We can now expect the price to bounce from 1st Support in line with 38.2% Fibonacci retracement towards 1st Resistance in line with 61.8% Fibonacci projection and 61.8% Fibonacci retracement. Our bullish bias is further supported by the stochastic indicator where the %K line is at the support level.
Areas of consideration:
- H4 1st resistance level 115.508
- H4 1st support level 113.982
AUD/USD:
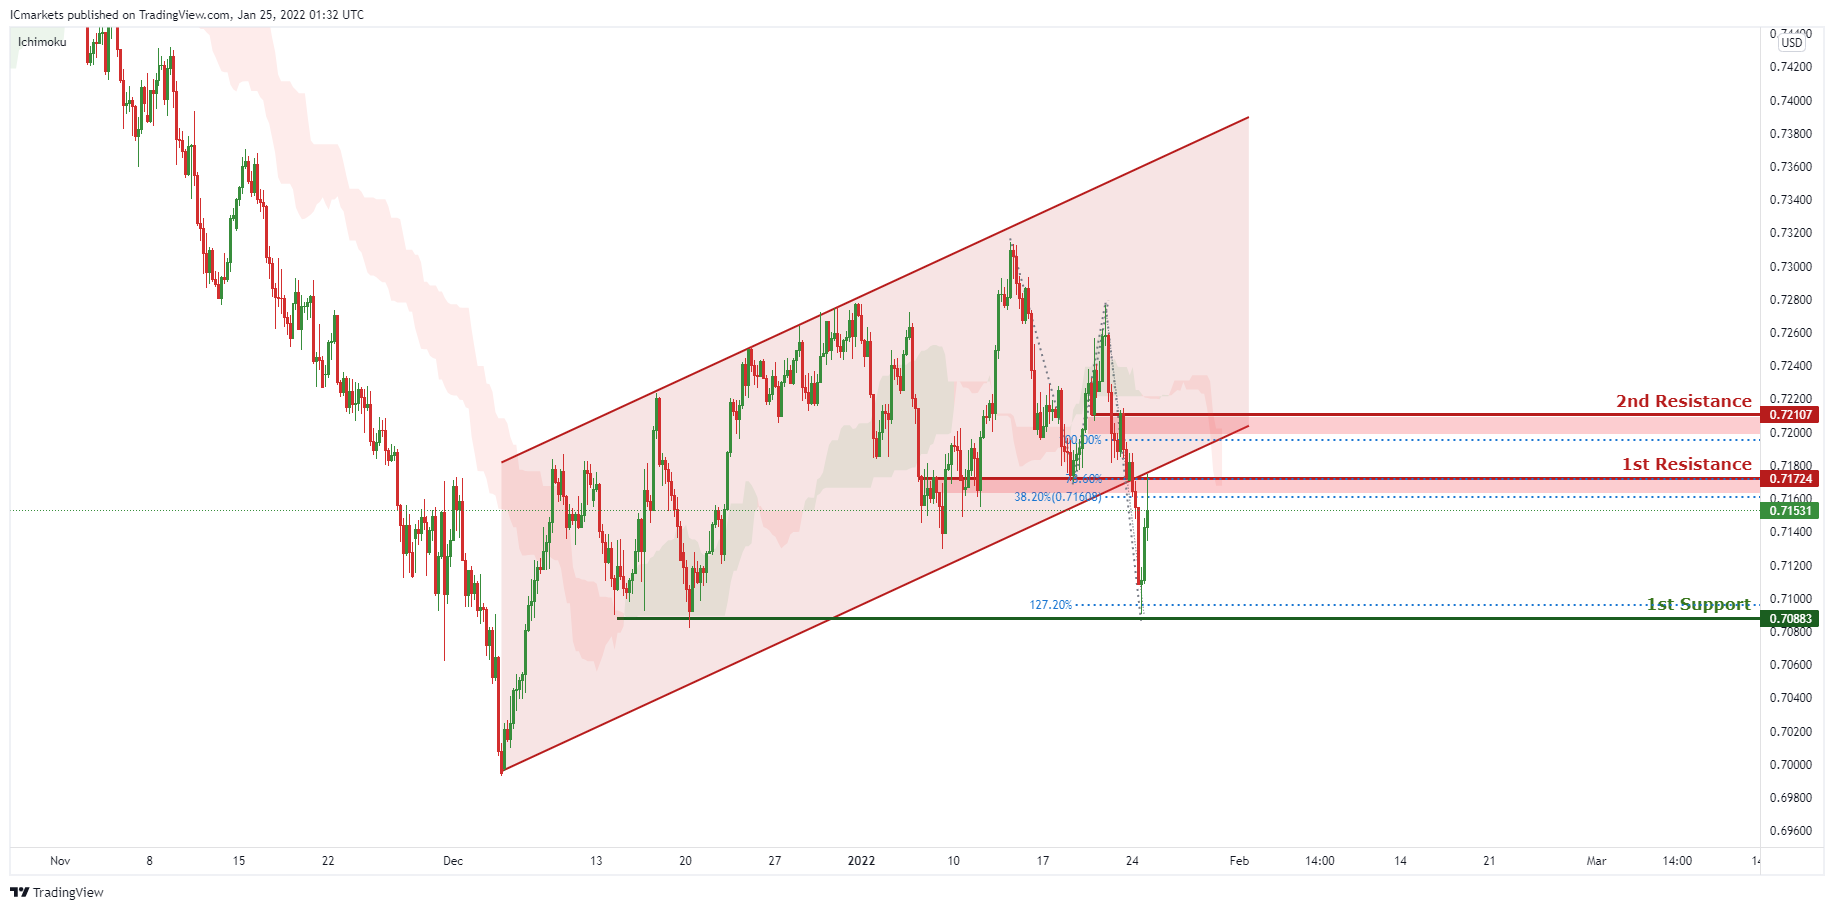
On the H4, price broke out of the ascending channel, signifying an overall bearish momentum. We can expect price to drop from 1st Resistance in line with 78.6% Fibonacci projection and 38.2% Fibonacci retracement towards 1st Support in line with graphical support level and 127.2% Fibonacci projection. Our bearish bias is further supported by the Ichimoku cloud indicator where the price is holding below it.
Areas of consideration:
- H4 1st Support level 0.70883
- H4 1st resistance level 0.71724
NZD/USD:
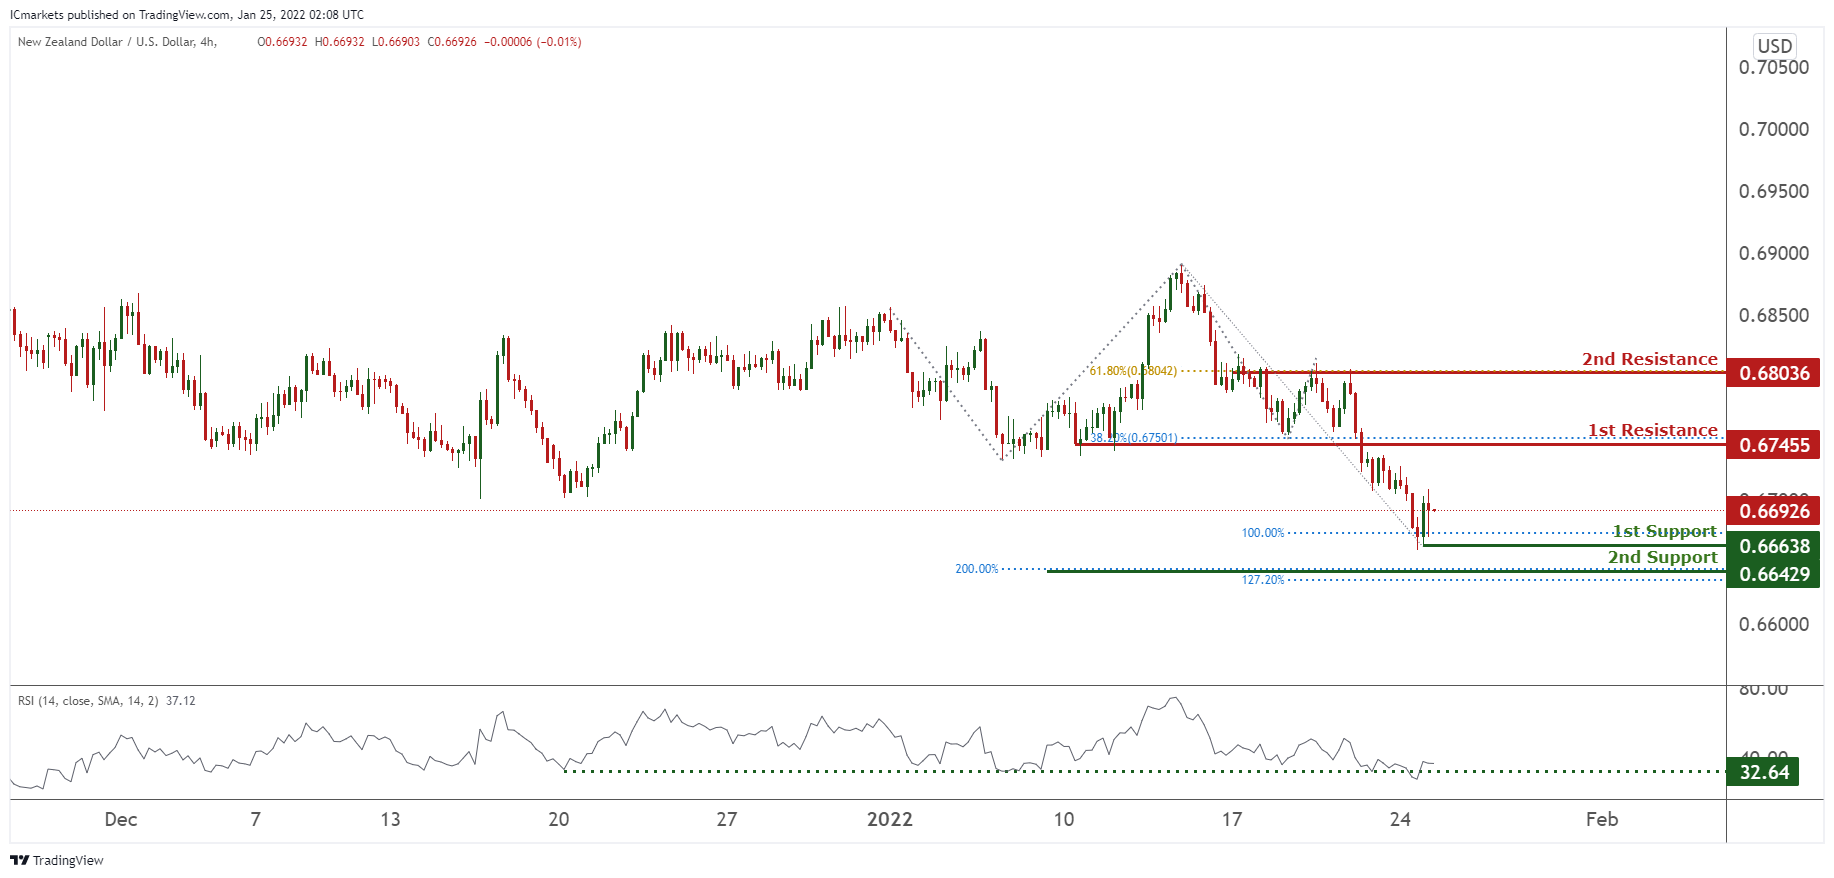
On the H4, prices are at a pivot at 0.67455 in line with 38.2% Fibonacci retracement. We see the potential for a bounce from our 1st support at 0.66638 in line with 100% Fibonacci extension towards our 1st resistance at 0.67455 in line with 38.2% Fibonacci retracement. RSI is at a level where bounces occurred previously. Alternatively, our stop loss will be placed at our 2nd support at 0.66429 in line with 200% Fibonacci Projection and 127.2% Fibonacci extension.
Areas of consideration:
- H4 time frame, 1st resistance at 0.67455
- H4 time frame, 1st support at 0.66638
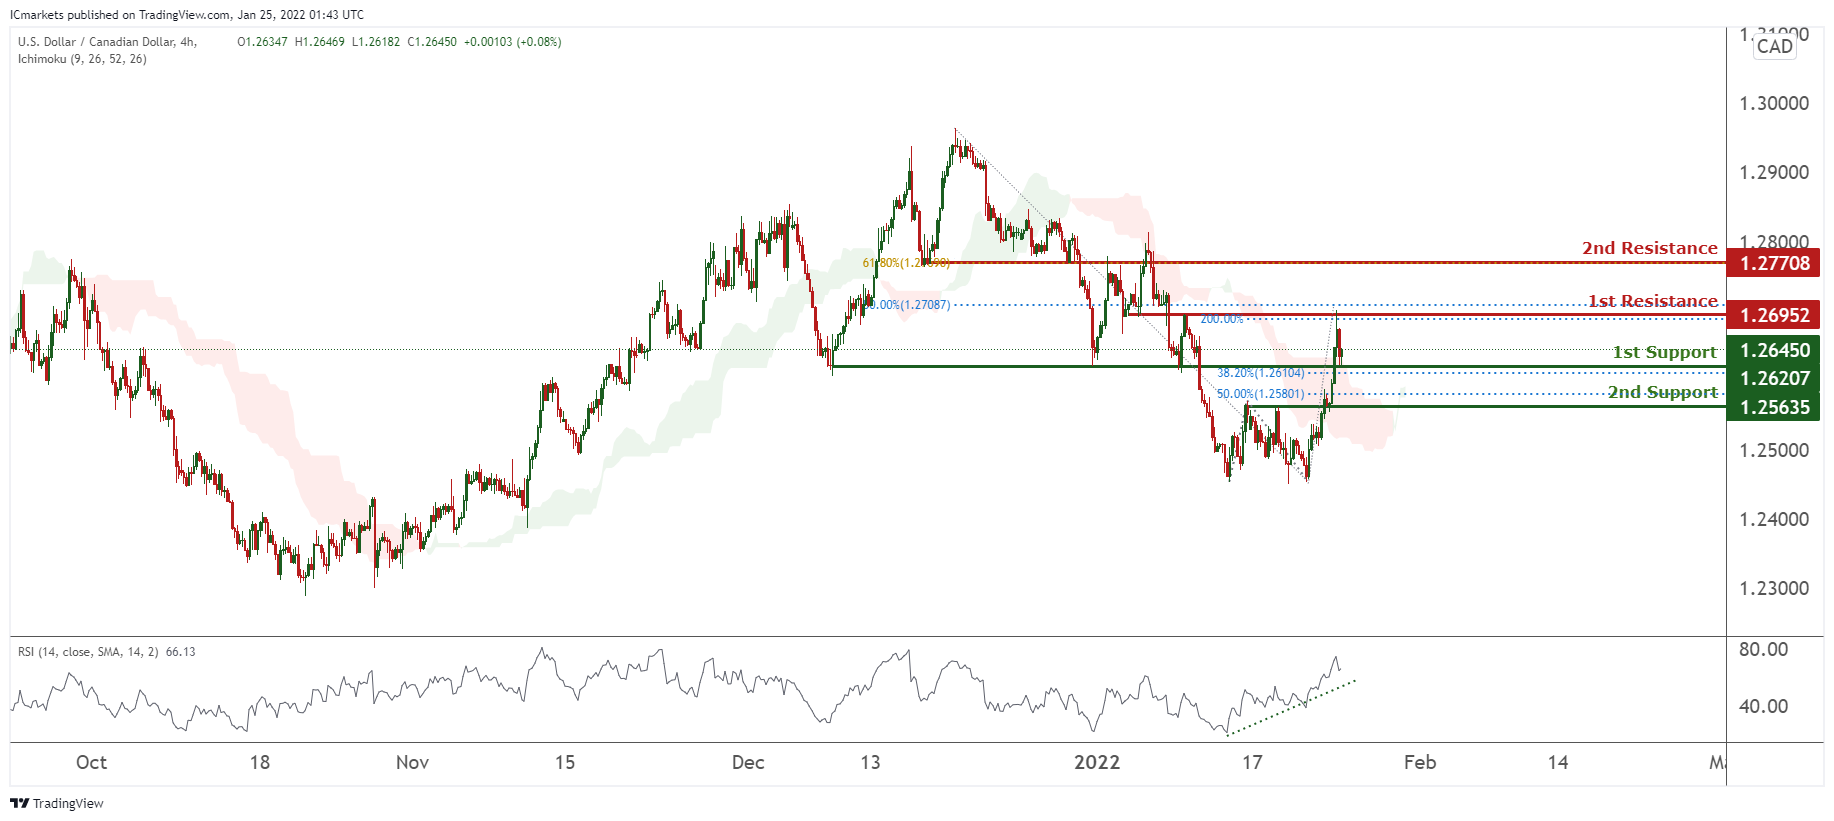
USD/CAD:
On the H4, with prices currently resting on the ichimoku cloud support, we foresee potentially a bullish bounce that price will bounce from our 1st support at 1.26207 which is in line with horizontal overlap resistance and 38.2% Fibonacci retracement to 1st resistance at 1.26952 in line with 200% Fibonacci Projection and 50% Fibonacci retracement, which is a horizontal overlap resistance. Alternatively, price may break 1st support structure and head for 2nd support at 1.25635, in line with 50% Fibonacci retracement. RSI is showing bullish momentum.
Areas of consideration:
- H4 time frame, 1st support at 1.26207
- H4 time frame, 1st resistance at 1.26952
OIL:
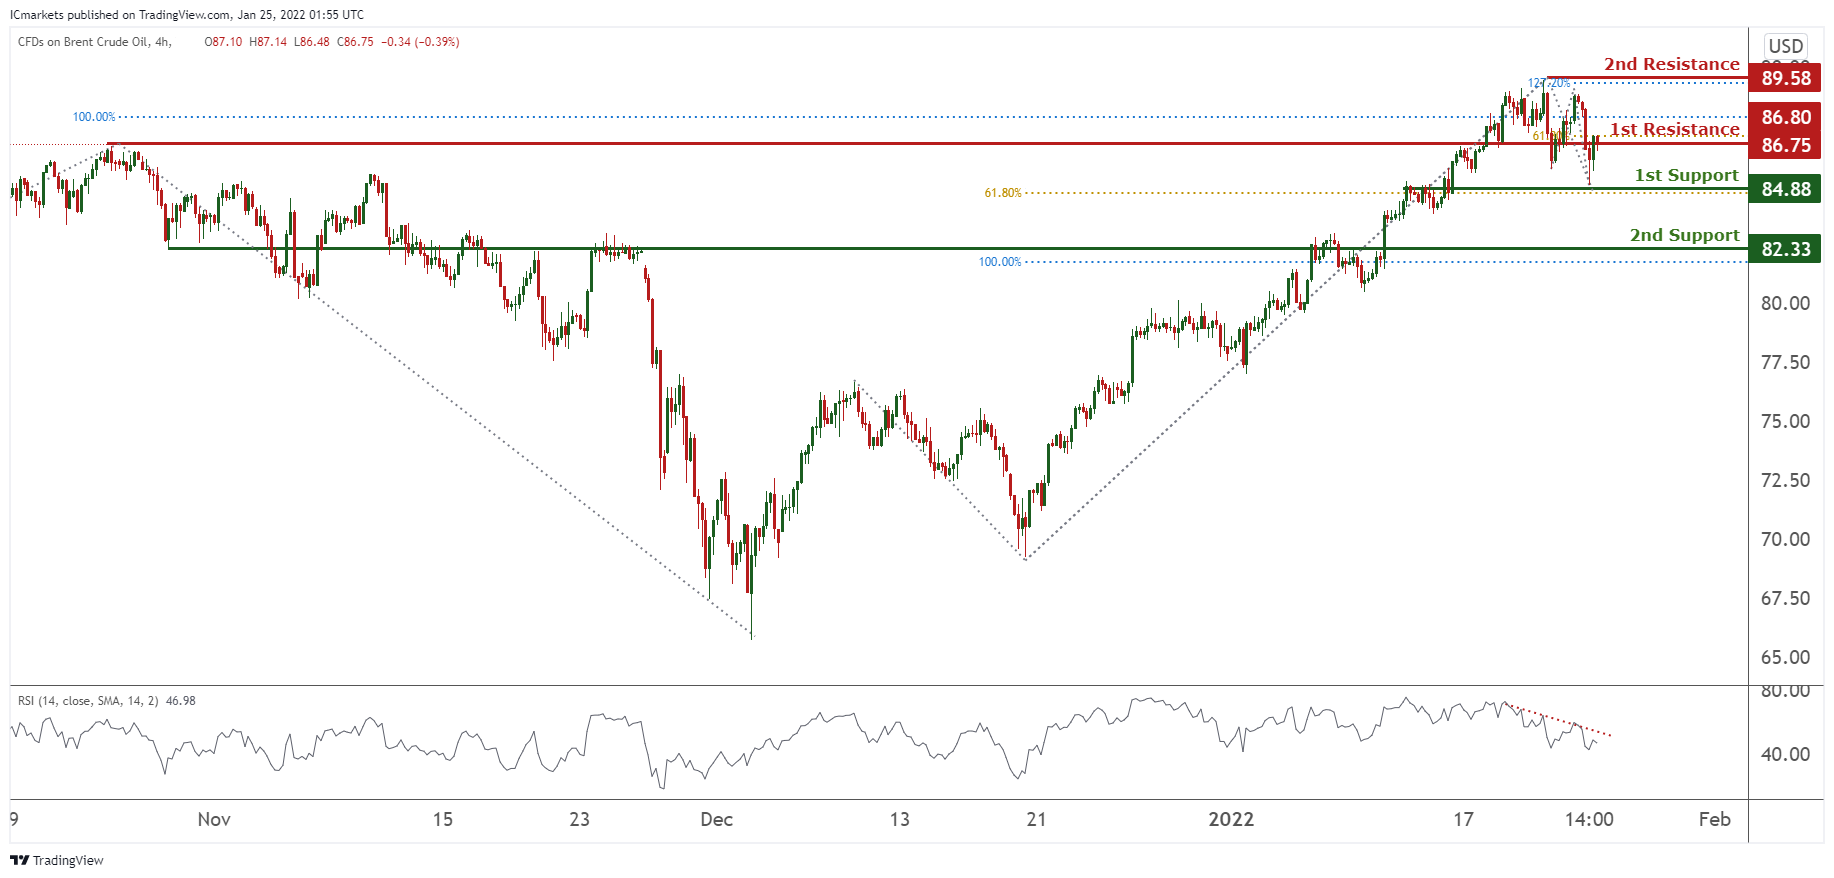
On the H4, prices are at an all time high. We expect potentially a trend reversal, and a dip from our 1st resistance at 86.71 in line with 61.8% Fibonacci extension towards our 1st support at 84.88 in line with 61.8% Fibonacci extension. Alternatively, price may break 1st resistance structure and head for 2nd resistance at 89.58, which is graphically swing high and in line with 127.2% Fibonacci extension. RSI is showing bearish momentum.
Areas of consideration:
- H4 time frame, 1st resistance of 86.71
- H4 time frame, 1st support of 84.88
Dow Jones Industrial Average:
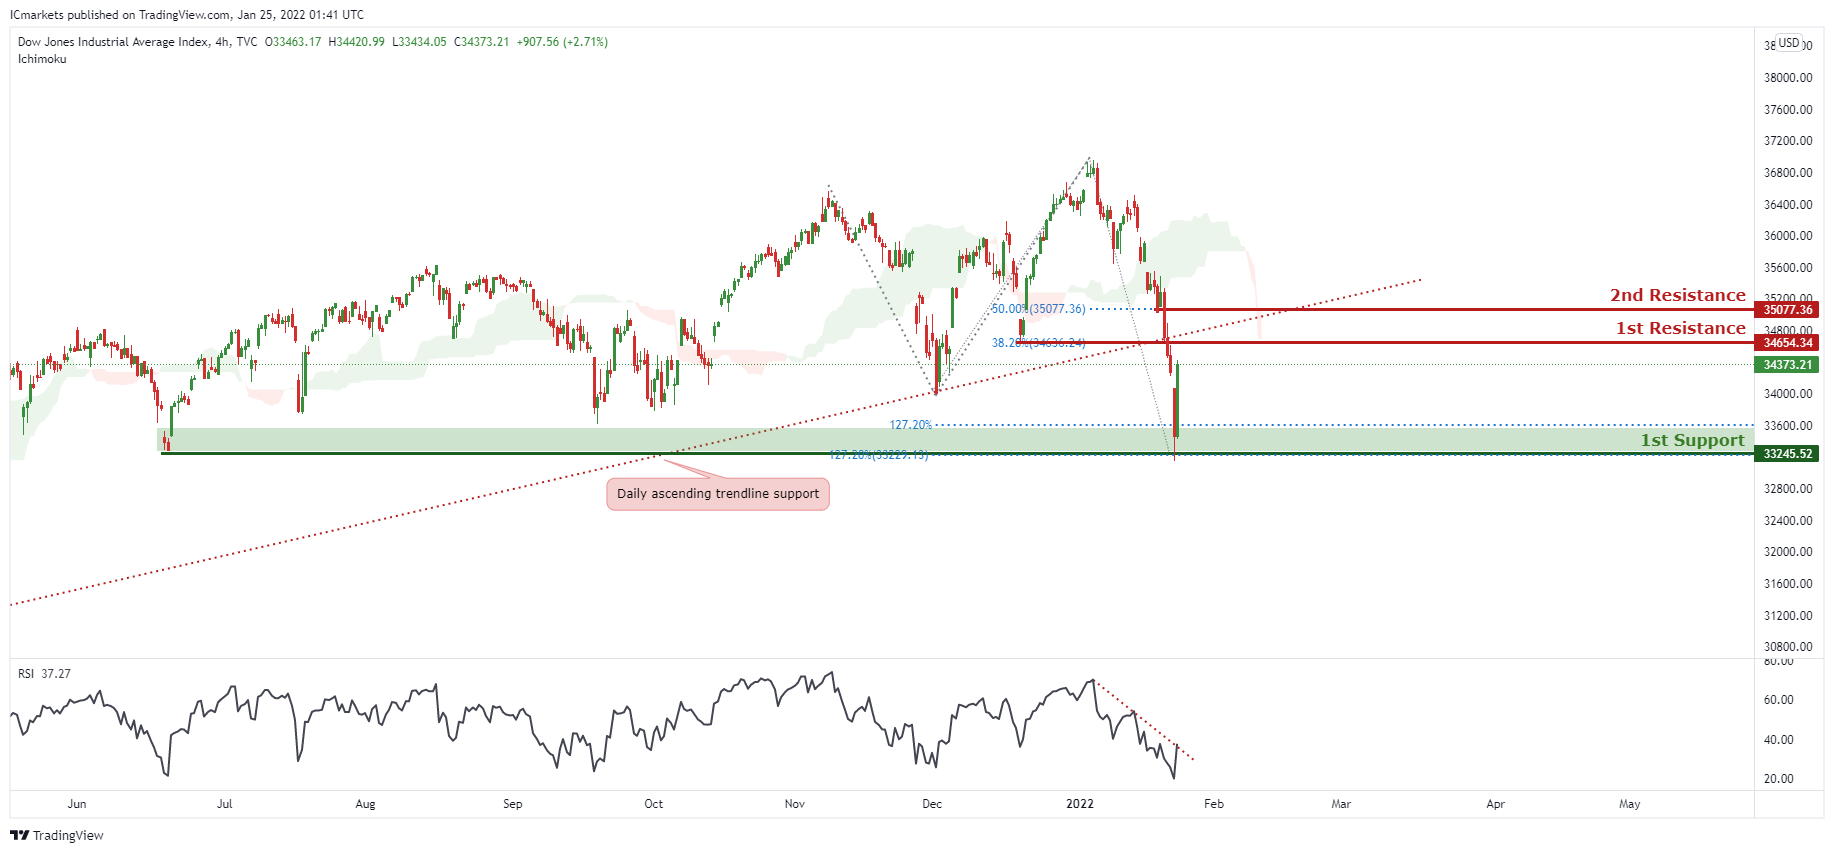
On the H4, price broke out of the ascending trendline support,signifying an overall bearish momentum. We can expect price to drop from our 1st resistance in line horizontal graphical overlap and 38.2% Fibonacci retracement towards 1st support in line with horizontal overlap support ,127.2% Fibonacci extension level and 127.2% Fibonacci projection. Alternatively, price may break 1st resistance structure and head for 2nd resistance, which coincides with 50% Fibonacci retracement.
Areas of consideration:
- H4 time frame, 1st resistance of 34654.34
- H4 time frame, 1st support of 33245.52
GBP/JPY Daily Outlook
Daily Pivots: (S1) 152.96; (P) 153.73; (R1) 154.54; More...
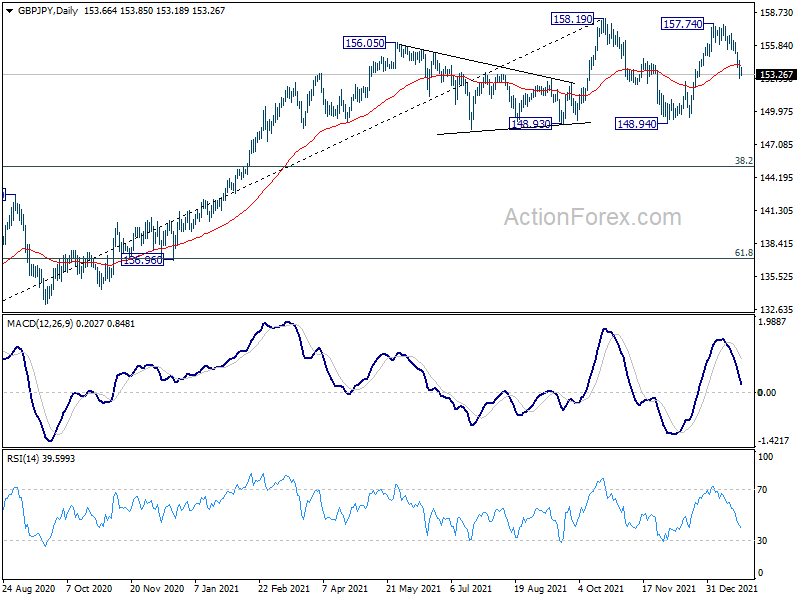
Intraday bias in GBP/JPY remains on the downside as fall from 157.74 is in progress. Such decline is seen as the third leg of the consolidative pattern from 158.19. Deeper fall would be seen to 148.94 support next. On the upside, above 155.38 minor resistance will flip bias back to the upside for 157.74/158.19 resistance zone instead.
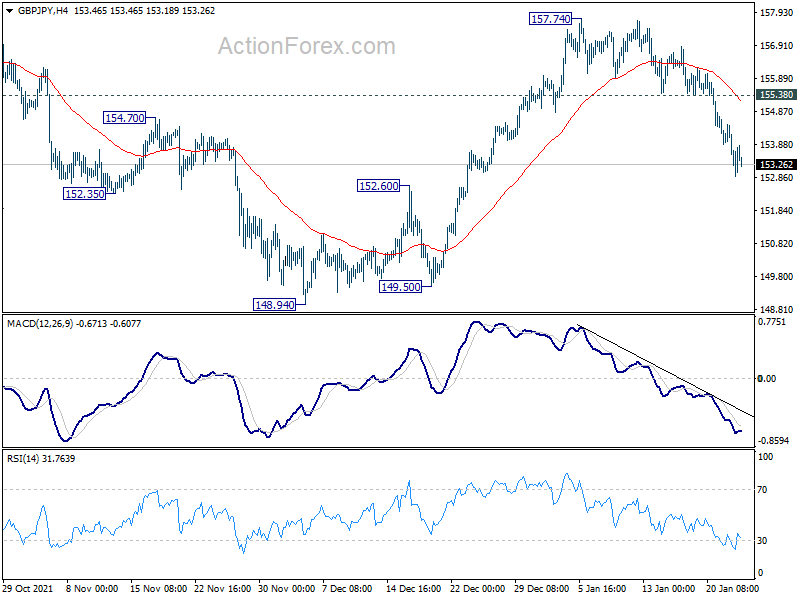
In the bigger picture, price actions from 158.19 are currently seen as developing into a consolidation pattern to up trend from 123.94 (2020 low). Downside should be contained by 123.94 to 158.19 at 145.10 to bring rebound. Firm break of 158.19 will resume the up trend to long term fibonacci level at 167.93. However, sustained break of 145.10 will raise the chance of trend reversal and target 61.8% retracement at 137.02.
Sentiment Still Weak Despite Big U-Turn in US Stocks, Dollar Firm With Yen
US stocks staged a strong comeback overnight, with DOW staging the first-ever 1000-point-plus intraday U-turn. It's down -1100 pts at initially trading but closed up 11 pts eventually. Yet, risk-off sentiment remains dominant in Asia. Dollar is currently the strongest, followed by Yen. Sterling is the worst performer, followed by Kiwi and Loonie. Aussie managed to pare back some losses after much stronger than expected consumer inflation reading. Overall, sentiment would remain vulnerable on developments surrounding Ukraine.
Technically, we'll keep our eyes on EUR/USD, USD/CHF and USD/JPY, which are still range bound. We're talking about 1.1284/1482 in EUR/USD, 0.9090/9276 in USD/CHF and 113.47/115.05 in USD/JPY. The breakouts will reveal much about the underlying dynamics in both Dollar and Yen.
In Asia, at the time of writing, Nikkei is down -1.82%. Hong Kong HSI is down -1.32%. China Shanghai SSE is down -1.12%. Singapore Strait Times is down -1.04%. Japan 10-year JGB yield is down -0.005 at 0.134. Overnight, DOW rose 0.29%. S&P 500 rose 0.28%. NASDAQ rose 0.63%. 10-year yield dropped -0.012 to 1.735.
Australia CPI surged to 3.5% yoy in Q4, trimmed mean CPI at 7-yr high
Australia CPI rose 1.3% qoq, 3.5% yoy in Q4, well above expectation of 1.0% qoq, 3.2% yoy. RBA trimmed mean CPI rose 1.0% qoq, 2.6% yoy, also above expectation of 0.7% qoq, 2.4% yoy. The 2.6% yoy rise was the highest since June 2014.
Head of Prices Statistics at the ABS, Michelle Marquardt, said the most significant price rises in the December quarter were new dwellings (+4.2%) and automotive fuel (+6.6%).
Marquardt said: "Annual trimmed mean inflation is the highest since 2014, reflecting the broad-based nature of price increases, particularly for goods."
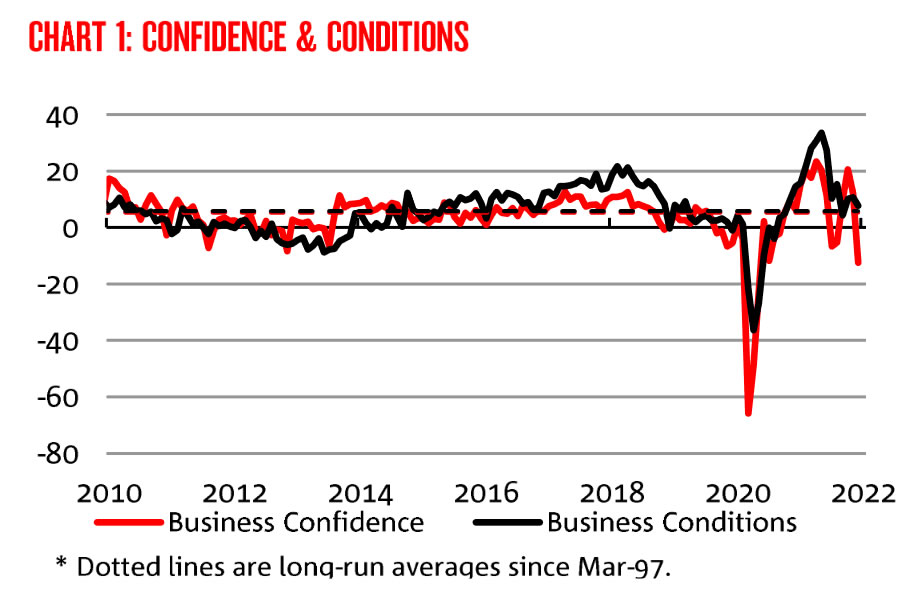
Australia NAB business confidence dropped sharply to -12
Australia NAB business confidence dropped sharply from 12 to -12 in December. Business conditions dropped from 11 to 8. Trading conditions was unchanged at 14. Profitability conditions rose from 8 to 10. Employment conditions dropped from 11 to 2.
"Overall, the December survey results are consistent with an economy that's starting to slow, with some similarities to the data when NSW and Victoria were first entering lockdown," said NAB Chief Economist Alan Oster. "That probably means conditions will fall in early 2022. However, we don't expect the Omicron variant to derail the recovery longer-term."
BoJ Kuroda keeps an eye on inflation risks while maintaining ultra-easy policy
BoJ Governor Haruhiko Kuroda told the parliament today, "the BOJ will continue its ultra-easy policy so improvements in corporate profits and the economy prop up wages and gradually accelerate consumer inflation."
"We remain vigilant to the risk prices may shoot up before wages begin to rise, or how (rising raw material costs) could hurt smaller firms. We must keep an eye out on these risks, while maintaining our current easy monetary policy," Kuroda said.
Meanwhile, Prime Minister Fumio Kishida said, "it's desirable to create an environment in which companies can pass on rising costs and raise wages, so that increasing consumption spurs economic growth and inflation."
Looking ahead
Germany Ifo business climate will be the main focus in European session. UK will release public sector net borrowing. Later in the day, US will release consumer confidence and house price index.
GBP/JPY Daily Outlook
Daily Pivots: (S1) 152.96; (P) 153.73; (R1) 154.54; More...
Intraday bias in GBP/JPY remains on the downside as fall from 157.74 is in progress. Such decline is seen as the third leg of the consolidative pattern from 158.19. Deeper fall would be seen to 148.94 support next. On the upside, above 155.38 minor resistance will flip bias back to the upside for 157.74/158.19 resistance zone instead.
In the bigger picture, price actions from 158.19 are currently seen as developing into a consolidation pattern to up trend from 123.94 (2020 low). Downside should be contained by 123.94 to 158.19 at 145.10 to bring rebound. Firm break of 158.19 will resume the up trend to long term fibonacci level at 167.93. However, sustained break of 145.10 will raise the chance of trend reversal and target 61.8% retracement at 137.02.
Economic Indicators Update
| GMT | Ccy | Events | Actual | Forecast | Previous | Revised |
|---|---|---|---|---|---|---|
| 00:30 | AUD | NAB Business Confidence Dec | -12 | 12 | ||
| 00:30 | AUD | NAB Business Conditions Dec | 8 | 12 | ||
| 00:30 | AUD | CPI Q/Q Q4 | 1.30% | 1.00% | 0.80% | |
| 00:30 | AUD | CPI Y/Y Q4 | 3.50% | 3.20% | 3.00% | |
| 00:30 | AUD | RBA Trimmed Mean CPI Q/Q Q4 | 1.00% | 0.70% | 0.70% | |
| 00:30 | AUD | RBA Trimmed Mean CPI Y/Y Q4 | 2.60% | 2.40% | 2.10% | |
| 07:00 | GBP | Public Sector Net Borrowing (GBP) Dec | 14.5B | 16.6B | ||
| 09:00 | EUR | Germany IFO Business Climate Jan | 94.7 | 94.7 | ||
| 09:00 | EUR | Germany IFO Current Assessment Jan | 96.1 | 96.9 | ||
| 09:00 | EUR | Germany IFO Expectations Jan | 93 | 92.6 | ||
| 14:00 | USD | S&P/Case-Shiller Home Price Indices Y/Y Nov | 17.80% | 18.40% | ||
| 14:00 | USD | Housing Price Index M/M Nov | 1.00% | 1.10% | ||
| 15:00 | USD | Consumer Confidence Jan | 112.3 | 115.8 |
Australia NAB business confidence dropped sharply to -12
Australia NAB business confidence dropped sharply from 12 to -12 in December. Business conditions dropped from 11 to 8. Trading conditions was unchanged at 14. Profitability conditions rose from 8 to 10. Employment conditions dropped from 11 to 2.
"Overall, the December survey results are consistent with an economy that's starting to slow, with some similarities to the data when NSW and Victoria were first entering lockdown," said NAB Chief Economist Alan Oster. "That probably means conditions will fall in early 2022. However, we don't expect the Omicron variant to derail the recovery longer-term."