Sample Category Title
EURJPY Eyes Double Correction While Bulls Stay in Control
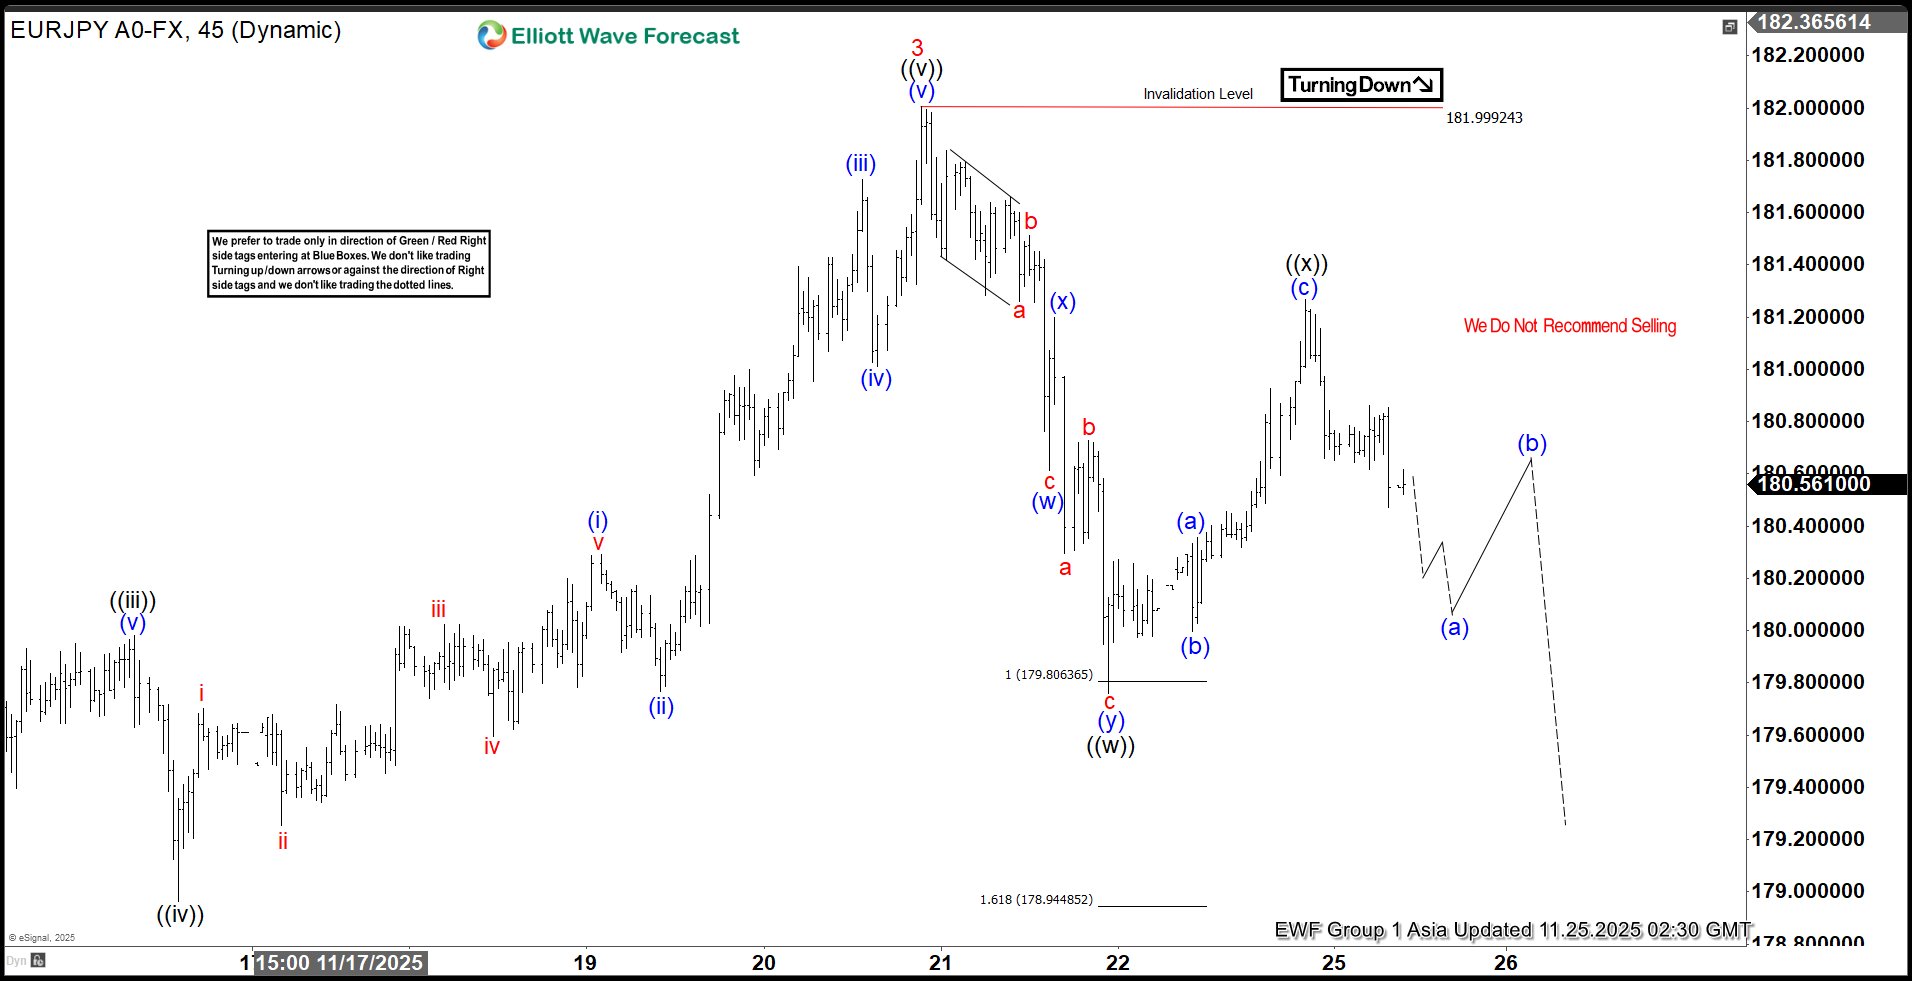
The short-term Elliott Wave outlook for EURJPY indicates that the cycle from the 17 October 2025 low remains in progress as a structured five-wave impulse. From that low, wave 1 advanced and concluded at 178.82f. A corrective pullback in wave 2 then followed, which ended at 175.69. The pair then resumed its upward trajectory, with wave 3 reaching 182, as reflected in the 45‑minute chart. At present, wave 4 is unfolding, serving to correct the cycle from the 5 November low, and its internal subdivision is developing in the form of a double three pattern.
Down from wave 3, wave (w) ended at 180.61 and rally in wave (x) ended at 181.2. Pair resumed lower in wave (y) towards 179.76 which completed wave ((w)) in higher degree. Rally in wave ((x)) ended at 181.26 with internal subdivision as a zigzag. Pair has turned lower in wave ((y)) but still need to break below wave ((w)) at 179.76 to confirm this view. Near term, as far as pivot at 182 high stays intact, expect pair to extend lower. Potential target lower is 100% – 161.8% Fibonacci extension of wave ((w)) towards 177.6 – 179.02.
EURJPY 45-Minute Elliott Wave Chart From 11.25.2025
EURJPY Elliott Wave Video
https://www.youtube.com/watch?v=AFaNxtlkZ5A
Two-way risks for AUD/NZD as RBNZ cut meets rising Australia CPI
AUD/NZD is shaping up for an active week, with two major catalysts—RBNZ’s rate announcement and Australia’s monthly CPI—set to hit on Wednesday.
RBNZ is widely expected to cut the OCR by 25bps to 2.25%. The NZIER Monetary Policy Shadow Board also endorsed a quarter-point reduction, arguing that although the economy is beginning to recover from a low base, excess capacity remains and a small additional cut is justified. Some members, however, warned against pushing stimulus too far, citing the risk of reigniting inflation—highlighting a cautious undercurrent within the broader policy debate.
On the medium-term path, the Shadow Board’s views clustered around an OCR of 2.25%–2.50% in a year, implying broad consensus that only limited easing will be required beyond November. While a minority still consider the risk of a larger, front-loaded cut—particularly given the long three-month gap until the next meeting—the Board’s recommendations may help stabilize expectations at a standard 25bps move.
In Australia, CPI is expected to rise again, from 3.5% to 3.6% for October, the fourth consecutive acceleration from June’s trough of 1.9%. A trend like this keeps the RBA firmly on hold for the remainder of the year, with any upside surprise diminishing the likelihood of a February rate cut. Sticky inflation would strengthen AUD by reinforcing Australia’s higher-for-longer stance relative to New Zealand’s easing cycle.
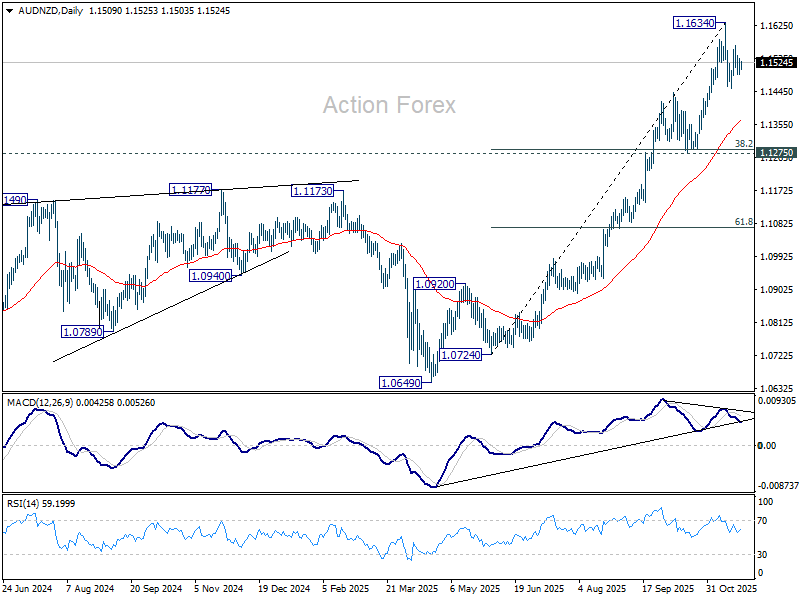
Technically, AUD/NZD carved out a short-term top at 1.1634 earlier this month and has since turned sideway. For now, it's seen as in a brief near term correction. Break of 1.1570 minor resistance will solidify this case and bring retest of 11634 high.
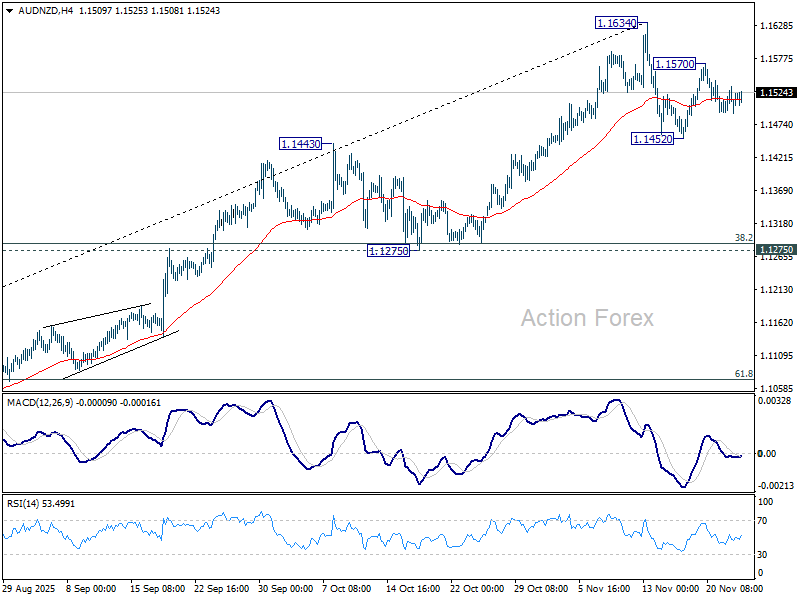
However, on the downside, break of 1.1452 support will indicate that deeper decline is underway, as fall from 1.1634 could be correcting whole rise from 1.0724. But even so, downside should be contained by 1.1275 cluster support (38.2% retracement of 1.0724 to 1.1634 at 1.1286) or even higher at 55 D EMA (now at 1.1362).
There should be one more up leg through 1.1634 before the whole five-wave up trend from 1.0649 (April low) completes.
AUD/USD Attempts Bounce, But Bulls Face Tough Test Ahead
Key Highlights
- AUD/USD started a fresh decline and traded below 0.6500.
- A bearish trend line is forming with resistance at 0.6470 on the 4-hour chart.
- EUR/USD is consolidating losses above the 1.1480 support.
- GBP/USD is facing a major hurdle near 1.3120 and 1.3140.
AUD/USD Technical Analysis
The Aussie Dollar declined below 0.6550 and 0.6500 against the US Dollar. AUD/USD tested the 0.6420 zone and is currently attempting to recover.
Looking at the 4-hour chart, the pair recovered a few pips and climbed above 0.6450. There was a move above the 23.6% Fib retracement level of the downward move from the 0.6580 swing high to the 0.6421 low.
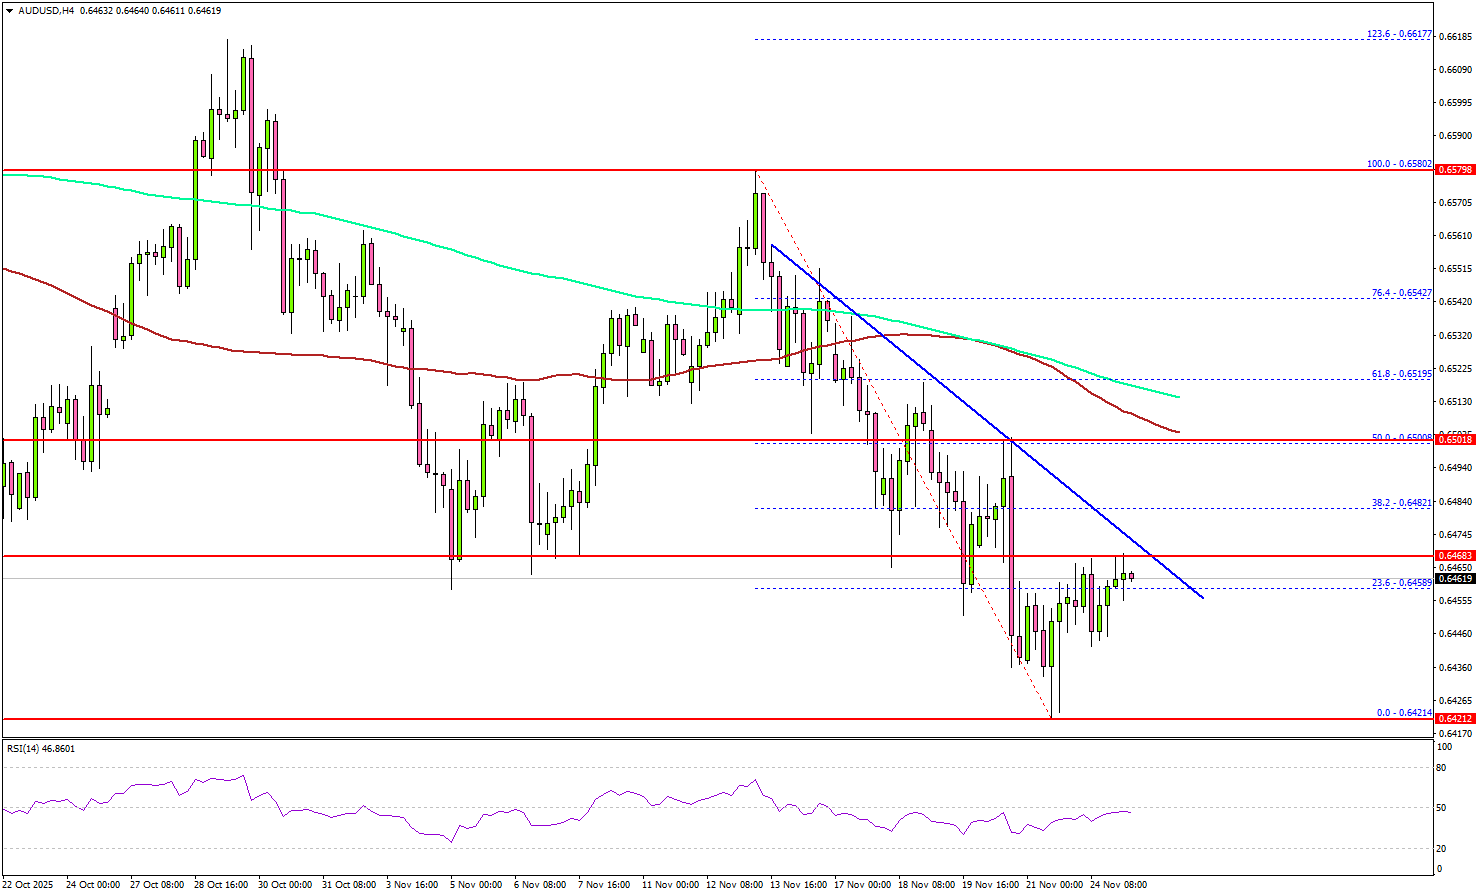
However, the pair is still below the 100 simple moving average (red, 4-hour) and the 200 simple moving average (green, 4-hour). Besides, there is a bearish trend line forming with resistance at 0.6470.
A close above the trend line resistance might call for a steady increase. The first key hurdle sits at 0.6500 and the 50% Fib retracement level of the downward move from the 0.6580 swing high to the 0.6421 low. The next resistance could be 0.6520. Any more gains could set the pace for a steady increase toward 0.6550.
On the downside, there is a key support at 0.6420. The next support is 0.6400, below which the pair could start a steady decline to 0.6365. A close below 0.6365 could start a pullback toward 0.6320.
Looking at EUR/USD, the pair failed to recover steadily and is now at risk of another decline, possibly below the 1.1480 support.
Upcoming Key Economic Events:
- US Pending Home Sales for Feb 2025 (YoY) - Forecast +2.1%, versus -2.8% previous.
- US Retail Sales for Oct 2025 (MoM) – Forecast +0.1%, versus 0% previous.
Gold rises towards 4244 as dovish Fed signals drive yields lower
Gold pushed higher this week as markets continued to recalibrate toward a December Fed rate cut. The move come in tandem with notable falling 10-year yield, which provide some tailwinds to the precious metal too. More upside is expected in Gold in the near term, even though a new record is still expected next year, rather than this.
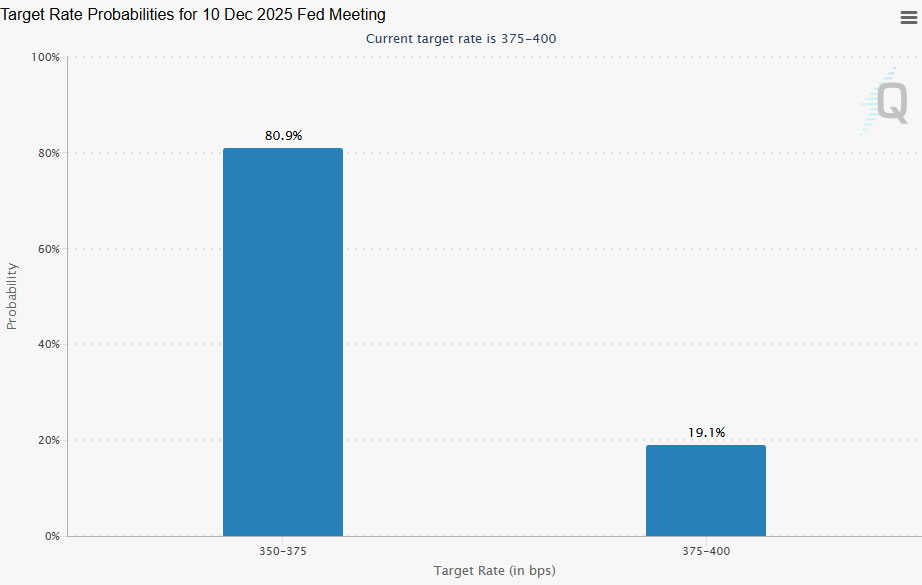
The Fed’s internal balance has moved noticeably toward the dovish camp. Mary Daly, in her WSJ interview, argued that labor-market fragility now poses a greater risk than inflation and said she supports easing next month. While not a vote, her comments—combined with John Williams’ earlier pivot—validates that the center of the Fed’s spectrum has shifted meaningfully towards easing. That has driven expectations for a December cut to around 80%.
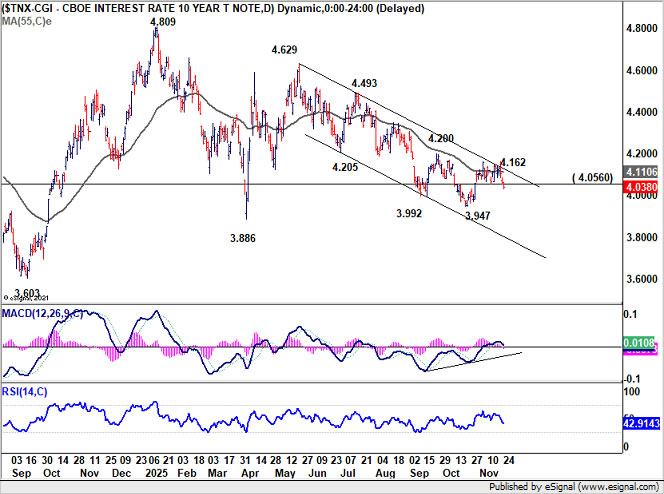
Technically, 10-year yield's break of 4.056 support suggests that corrective rebound from 3.947 has completed at 4.162, after hitting falling channel resistance that started at 4.629 (May high). Further decline would now be seen towards 3.947 low.
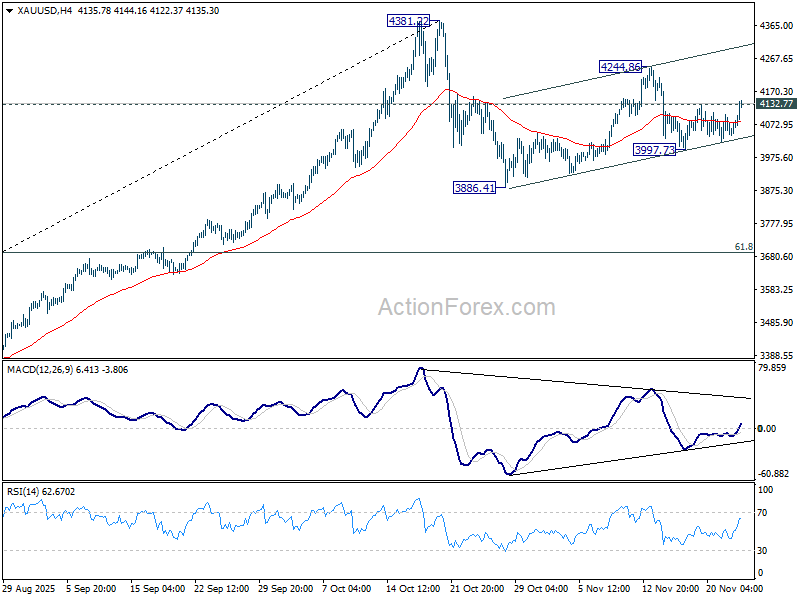
Gold’s breakout above 4,132.77 indicates that pullback from 4,244.86 bottomed at 3,997.73. The rally from 3,886.41, as the second leg of the broader corrective pattern from 4,381.22, remains in progress. Further rise is expected to 4,244.86 and higher, as support by weakness in yield. But strong resistance should emerge from 4,381.22 high to cap upside to bring the third leg of the pattern.
Fed’s Daly backs December cut, warns job market risks outweigh inflation
San Francisco Fed President Mary Daly signaled clear support for a rate cut at next month’s FOMC meeting, telling the Wall Street Journal that the Fed now faces greater risk from a sudden deterioration in the labor market than from another inflation flare-up.
She said the job market is “vulnerable enough now” that the risk of a sharp, "nonlinear" weakening is rising, leaving policymakers with less room to react if they wait too long. Daly emphasized that she no longer feels confident the Fed can “get ahead of” labor-market weakening, arguing that the damage from a sudden drop in hiring would be harder to manage than moderating inflation.
On inflation, Daly said the chance of a meaningful reacceleration appears limited, pointing to softer-than-expected tariff-related cost increases this year.
Crypto Bloodbath Stalls: Is a Bottom In?
The relentless crypto bloodbath appears to have finally stalled, and signs suggest the market may have already posted a definitive bottom.
Bearish acceleration had driven prices to stark troughs, with Bitcoin grazing the $80,000 level and altcoins suffering even steeper declines. XRP plunged below $2.00, Ethereum tested levels near $2,800, and Solana dropped to trade near $125.
However, as key technical areas and Fibonacci retracements triggered interest from both opportunistic investors and algorithms, dip-buying has brought the Crypto Market higher to start the week. Bitcoin is now testing the $88,000 level, while Ethereum is climbing back towards the $3,000 psychological level.
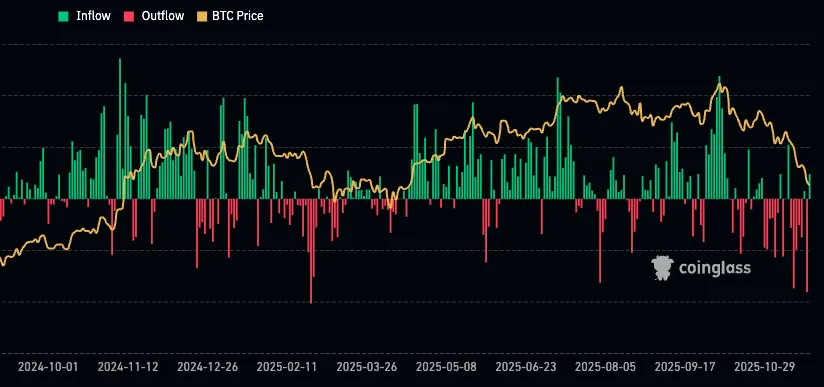
ETF Inflows and Outflows in 2025 – Source: Coinglass
Crucially, institutional flows are signaling a shift. Bitcoin and Ethereum ETFs are seeing their first renewed inflows after a painful 6-week streak of net outflows that reflected general deleveraging across digital assets.
The Total Market Cap, which posted lows around $2.74T just last Friday, is also staging a recovery.
Buoyed by a broadly more positive mood in markets—fueled by a dovish repricing for the Fed's December meeting, strong beats on Nvidia earnings, and potential trade reopening talks with China—the total valuation is once again breaking back above the pivotal $3T mark.
This level will be extremely important to hold as it equates to the 2021 Bull Market peak.
Screenshot 2025-11-24 at 2.28.05 PM
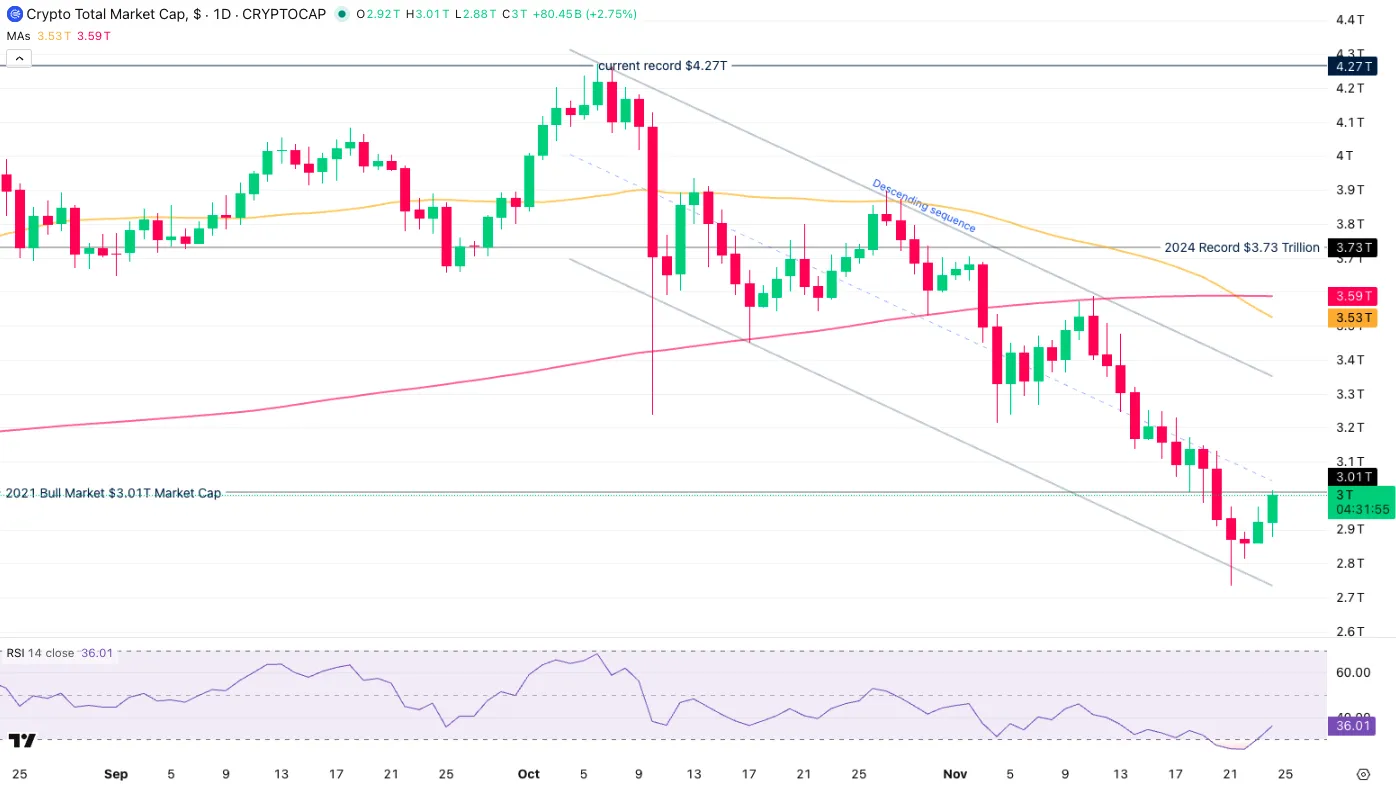
Crypto Total Market Cap – Bouncing at the lows of its Channel. November 24, 2025 – Source: TradingView
The Picture is Green after many Red days
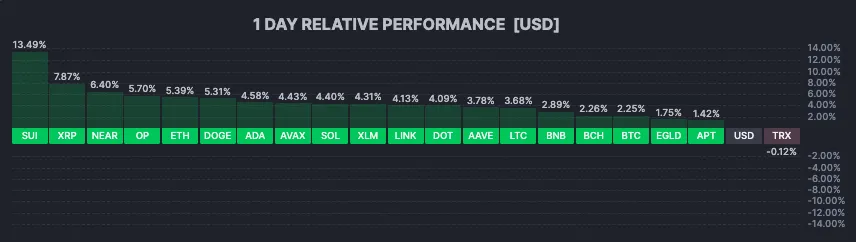
Daily overview of the Crypto Market (14:30 ET), November 24, 2025 – Source: Finviz
Bitcoin and Ethereum 2-timeframe Analysis
Bitcoin Weekly Chart
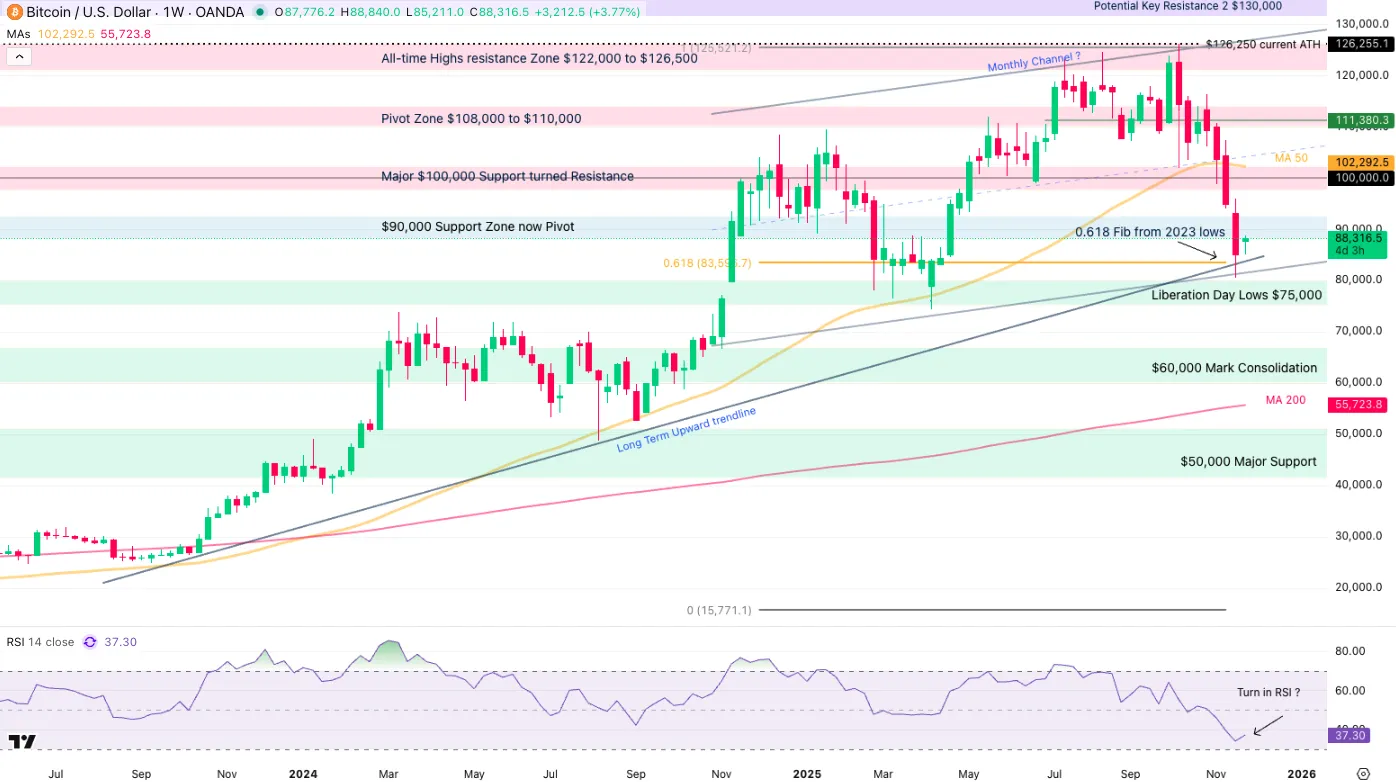
Bitcoin (BTC) Weekly Chart, November 24, 2025 – Source: TradingView
A ruthless 37% descent for the pioneer Crypto has taken a break as multiple confluences of Technical Supports are coming through.
The 61.8% retracement of the entire move from the 2023 ($15,500!) lows has brought some interest, as this Fibonacci level tends to generate traction among Traders and Investors.
This also comes at an imperfect touch of the 2023 trendline, which presents one of the most important technical support on the long-run.
Breaking this line will let the $75,000 Liberation Day as an emergency lifeline but after that, there isn't much before the $60,000 Monthly Support.
Bitcoin Intraday (8H) Chart and Technical Levels
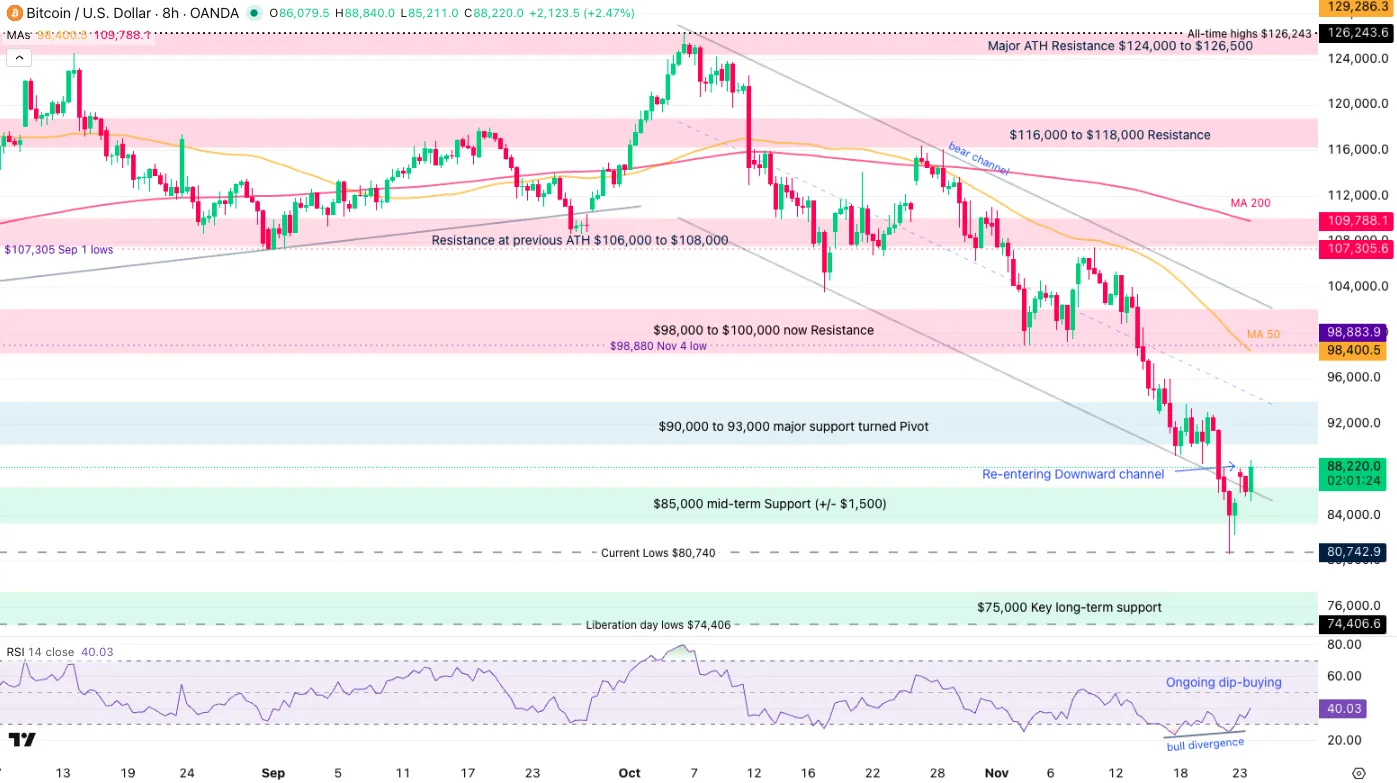
Bitcoin (BTC) 8H Chart, November 24, 2025 – Source: TradingView
A Bullish divergence on the 8H Timeframe also helped the shorter-timeframe buyers to step in quite aggressively.
A precedingly downside-broken Bear Channel pointed to extreme fear which wasn't followed by momentum accumulation, which tends to create Bullish divergences on the RSI.
These are strong setups for mean-reversion, however not much says for how long things will rebound.
Therefore, keep an eye on the Channel lows for Short-term support (if it breaks, more bearish).
On the other hand, holding the Channel after a fakeout could lead to a $102,000 higher bound test.
Levels of interest for BTC trading:
Support Levels:
- $90,000 to 93,000 major support turned Pivot
- Current Weekly Lows $89,340
- $85,000 mid-term Support (+/- $1,500)
- $75,000 Key long-term support
Resistance Levels:
- $90,000 to 93,000 major support turned Pivot
- $98,000 to $100,000 Main Support, now Pivot (MA 50 at $100,000)
- $102,000 Bear Channel Highs
- Resistance at previous ATH $106,000 to $108,000
- Current ATH Resistance $124,000 to $126,000
Ethereum (ETH) Weekly Chart
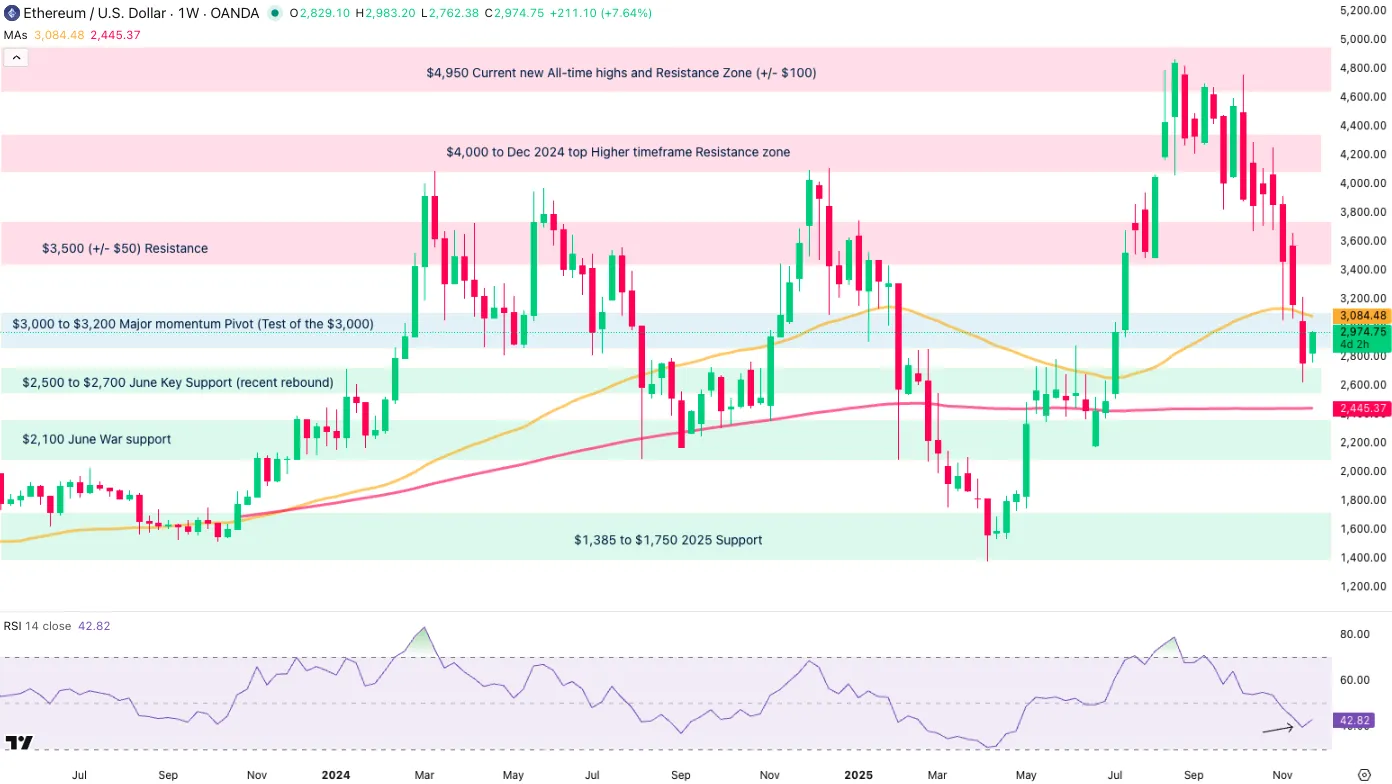
Ethereum (ETH) Weekly Chart, November 24, 2025 – Source: TradingView
The $2,700 Level mentioned in our very recent ETH analysis was used as a trampoline for Buyers.
The next test will be to break and hold above $3,000, which also corresponds with the mid-lane of the Channel. Above this, breakout odds greatly increase.
Ethereum Intraday (8H) Chart and Technical Levels
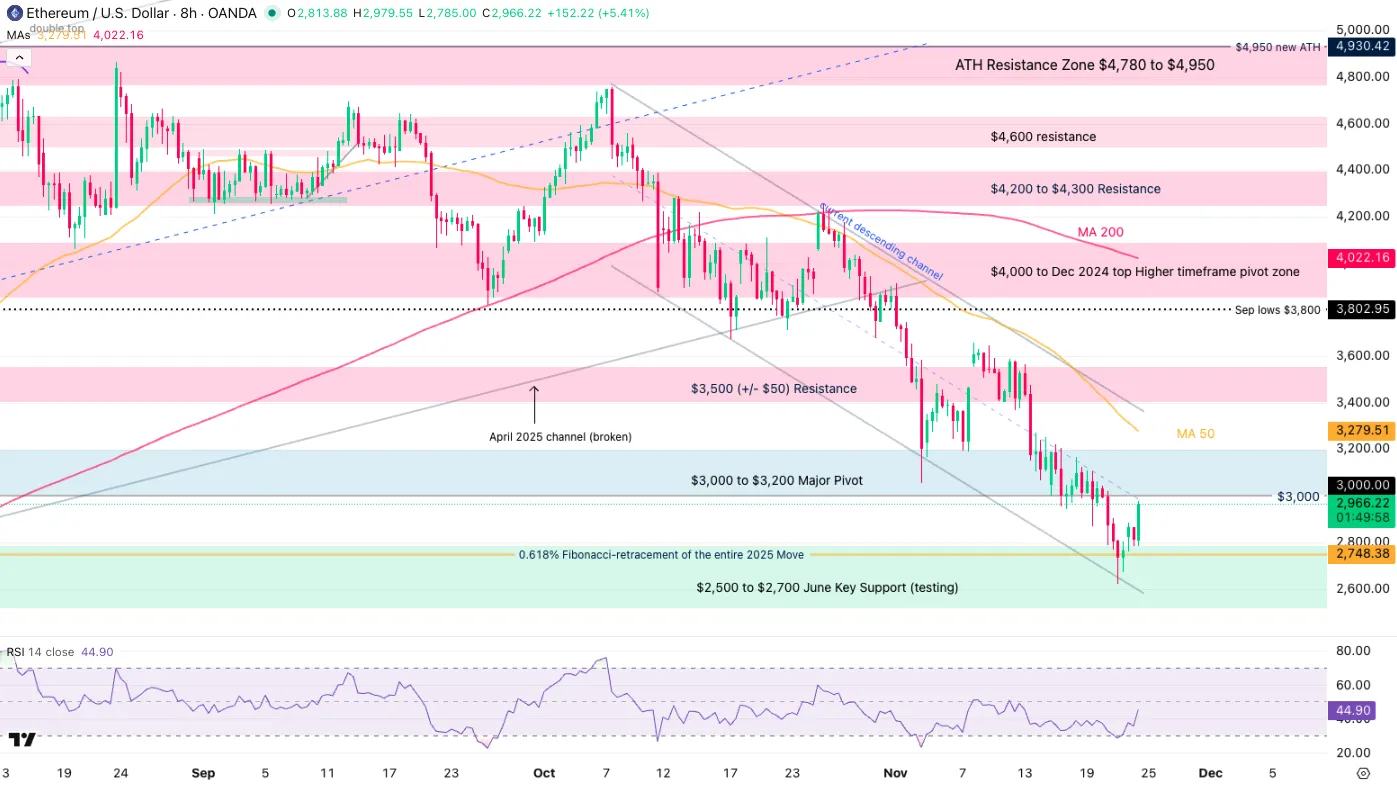
Ethereum (ETH) 8H Chart, November 24, 2025 – Source: TradingView
Levels of interest for ETH trading:
Support Levels:
- $2,500 to $2,700 June Key Support (recent rebound)
- $2,620 Session and weekly Lows
- $2,100 June War support
- $1,385 to $1,750 2025 Support
- 2025 Lows $1,384
Resistance Levels:
- $3,000 to $3,200 Major momentum Pivot (Test of the $3,000)
- $3,500 (+/- $50) Resistance and Descending Channel highs
- $3,800 September lows
- $4,000 to Dec 2024 top Higher timeframe Resistance zone
- $4,950 Current new All-time highs
Safe Trades!
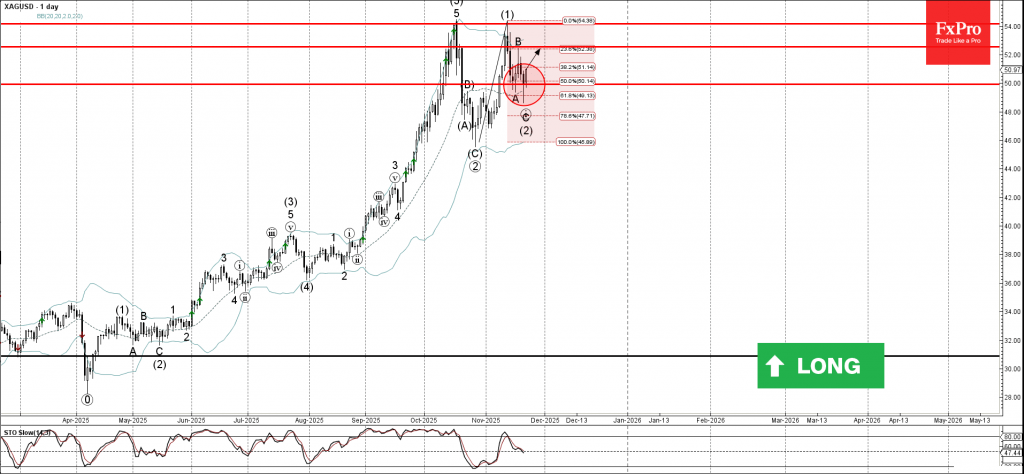
Silver Wave Analysis
Silver: ⬆️ Buy
- Silver reversed from support area
- Likely to rise to resistance level 52.50
Silver recently reversed from support area between the round support level 50.00 (which was set as the likely downward target in our earlier report for this instrument), 20-day moving average and the 50% Fibonacci correction of the upward impulse (1) from October.
The upward reversal from this support area started the active intermediate impulse wave (3).
Given the overriding daily uptrend, Silver can be expected to rise to the next resistance level 52.50 (top of the previous wave B).
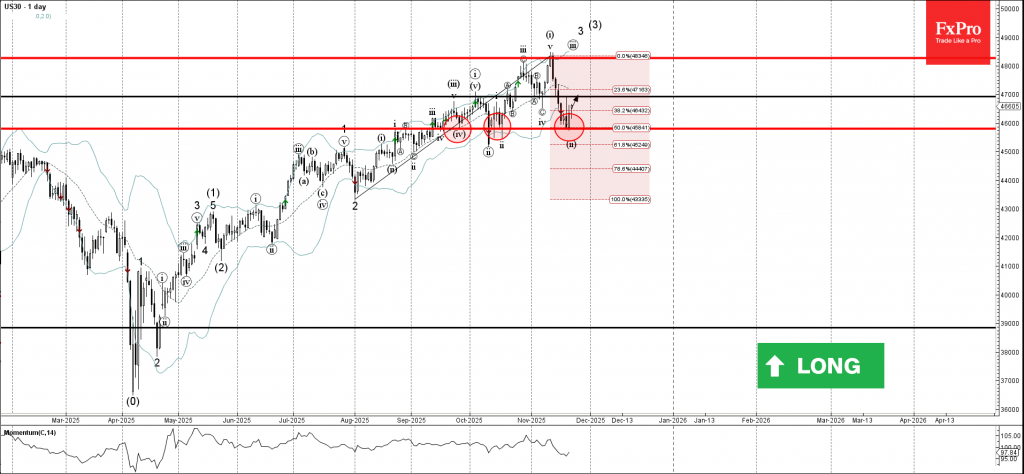
Dow Jones Wave Analysis
Dow Jones: ⬆️ Buy
- Dow Jones reversed from support area
- Likely to rise to resistance level 47000.00
Dow Jones index recently reversed from support area between the key support level 45800.00 (which has been reversing the price from September), lower daily Bollinger Band and the 50% Fibonacci correction of the upward impulse from July.
The upward reversal from this support area stopped the previous short-term ABC correction 2.
Given the clear daily uptrend, Dow Jones index can be expected to rise to the next resistance level 47000.00 (top of the previous wave B).
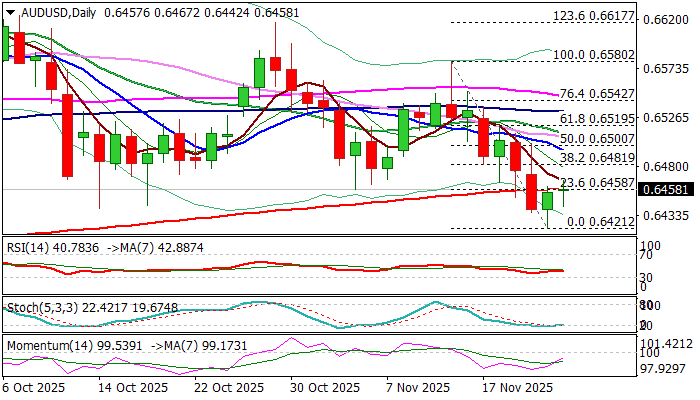
AUDUSD: Bounce from New Three-Month Low So Far Limited
AUDUSD – Last Friday’s bounce from new three-month low (bears were contained by the top of thick weekly Ichimoku cloud) was repeatedly obstructed by broken 200DMA (0.6458 – reverted to resistance)
Monday’s action is moving within limited range and shaped in long-legged Doji candle and signals indecision.
Conflicting fundamental signals (the latest dovish comments from Fed official revived expectations of December rate cut but countered by still prevailing concerns about inflation that may keep the central bank’s rates on hold next month) contribute to the current situation.
Investors also focus on Australia’s inflation report (due on Wednesday and the first time to be released on monthly basis, replacing old system of quarterly reports).
Technical picture remains bearishly aligned on daily chart (MA’s in bearish setup / negative momentum), with reaction on 200DMA to provide fresh signal.
Close above the moving average (0.6458, also Fibo 23.6% of 0.6580/0.6412) to add fresh optimism, though more work at the upside (lift above 0.6500 zone) needed to verify signal.
Conversely, repeated close below 200DMA to keep the downside at increased risk of violation of Aug 21 low (0.6414) and nearby Fibo 38.2% of larger 0.5914/0.6706 (0.6404).
Res: 0.6467; 0.6481; 0.6500; 0.6520
Sup: 0.6421; 0.6414; 0.6372; 0.6350