Sample Category Title
Sentiment Cautious But Not Negative, US Data Reboot Awaited
Sentiment in Asian markets started the week on the softer side, though the pullback has been well contained so far. The tone was more cautious than negative, with investors reluctant to take strong positions ahead of a busy global data schedule and the return of U.S. macro releases.
The dominant theme is anticipation. With U.S. data flow finally resuming after the government shutdown, traders are positioning defensively. Thursday’s release of the September US nonfarm payrolls report will be a key event. Markets are keen to understand whether the slowdown seen in summer was already deepening before reporting disruptions kicked in.
Meanwhile, today’s major highlight comes from Canada, where October CPI is expected to show headline inflation easing to 2.2%. The stickier question lies within the core measures, which are likely to remain close to the upper end of the BoC’s 1–3% target band. That should reinforce expectations that the BoC maintains its prolonged pause at 2.25%, the bottom of its neutral range. Such an outcome also solidifies the view that Canada’s easing cycle has effectively ended. With inflation drifting gradually lower but not collapsing, the central bank has little incentive to cut further.
Beyond Canada, the week brings a series of important releases: FOMC and RBA minutes, inflation reports from the UK and Japan, and PMI readings across several major economies.
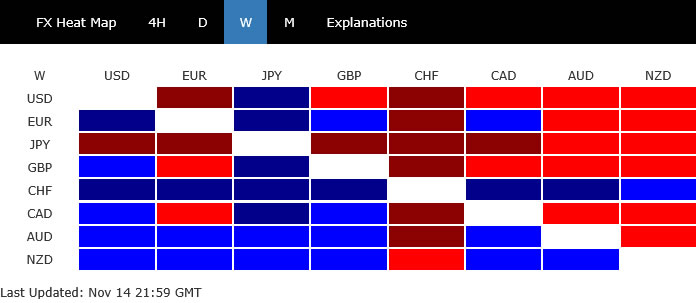
In currency markets, Dollar leads the board for the day so far, while Loonie and Yen are following. At the weaker end, Aussie is the softest performer, trailed by Kiwi and then Euro. Sterling and Swiss Franc are positioned firmly in the middle. Still, despite these relative moves, most major pairs and crosses remain locked inside last week’s ranges, as the markets are in wait-and-see mode.
In Asia, at the time of writing, Nikkei is down -0.22%. Hong Kong HSI is down -0.96%. China Shanghai SSE is down -0.59%. Singapore Strait Times is down -0.09%. Japan 10-year JGB yield is up 0.028 at 1.730.
Japan's GDP avoids deeper Q3 slump as public spending cushions demand
Japan’s economy contracted in the third quarter, but the decline was smaller than markets anticipated. GDP fell -0.4% qoq versus expectations of -0.6%. The annualized figure showed -1.8% drop compared with forecasts of -2.5%. The softer-than-expected contraction reflected pockets of resilience in domestic demand despite broader weakness.
Government spending rose 0.5% qoq and private consumption edged up 0.1% qoq, helping to offset some of the slowdown. Public demand grew 0.5% qoq and contributed 0.1 percentage point to overall GDP. However, private demand was a significant drag, falling -0.4% qoq as residential investment plunged -9.4% qoq, subtracting 0.3 percentage point from output.
External demand also weakened. Exports of goods and services fell -1.2% qoq after a strong 2.3% qoq rise in the previous quarter, with net exports contributing to a 0.2 percentage point drop in GDP.
Slight uptick in NZ BNZ services in October, but weakness persists
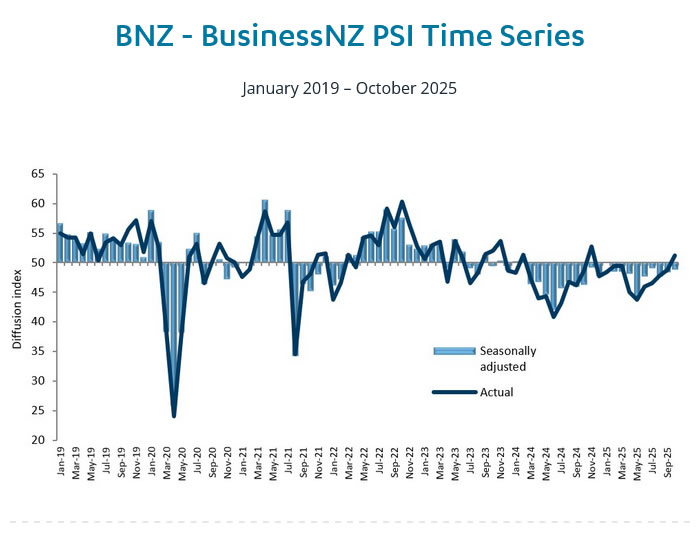
New Zealand’s services sector remained under heavy strain in October, with the BusinessNZ Performance of Services Index inching up from 48.3 to 48.7 but still locked firmly in contraction.Activity, employment, and new orders all hovered below 50, extending the sector’s downturn to 20 straight months and keeping the headline reading well below the long-term average of 52.8.
Businesses cited weak demand as the principal drag, linking the slowdown to reduced household spending, ongoing cost-of-living pressures, and diminished confidence. While the proportion of negative comments fell from 58.0% to 54.1%, responses still pointed to a market struggling with inconsistent sales flows and hesitant customers. The continued decline in new orders signals that firms are not yet seeing a meaningful turn in forward demand.
Operating costs, competitive intensity, workflow delays, and cancelled projects are adding further strain, tightening cashflow and limiting the ability of firms to absorb volatility.
Gold, Silver stay capped, macro haze holds breakout timing to early 2026
Gold and Silver’s late-week slide marked the continuation of a corrective pattern that has been unfolding since both metals hit record highs in mid-October. The sequence of the initial decline, the early-November rebound, and now the latest retreat all form part of a consolidation phase, reflecting that the markets are still searching for direction after months of decisive trending.
Both fundamental and technical backdrops suggest that this period of indecisiveness will continue in the near term. The broader uptrend remains firmly intact, but without a clear catalyst, price action is likely to stay choppy. New record highs remain part of the medium-term outlook, though the timetable leans toward early next year rather than the remainder of 2025.
On the fundamental side, the slowdown in Gold and Silver’s up trend began as U.S.–China trade tensions eased under their one-year arrangement blocking further tariff and non-tariff escalations. That agreement removed a significant layer of risk premium that had supported heavy hedging flows into precious metals. With geopolitical pressure reduced, markets have lacked urgency to extend the rally.
The latest leg lower was driven more by shifts in Fed expectations. A December cut is now regarded as a coin toss, softening the near-term appeal of non-yielding assets. Still, the larger policy direction remains downward, and an easing cycle next year should restore support for Gold and Silver once the current fog clears.
The challenge is that macro visibility will not improve immediately. Even though U.S. data releases are resuming after the shutdown ended last week, neither the Fed nor markets will have full clarity on underlying economic conditions until the release schedule fully normalizes in December. This leaves policymakers cautious and investors reluctant to build strong directional positions.
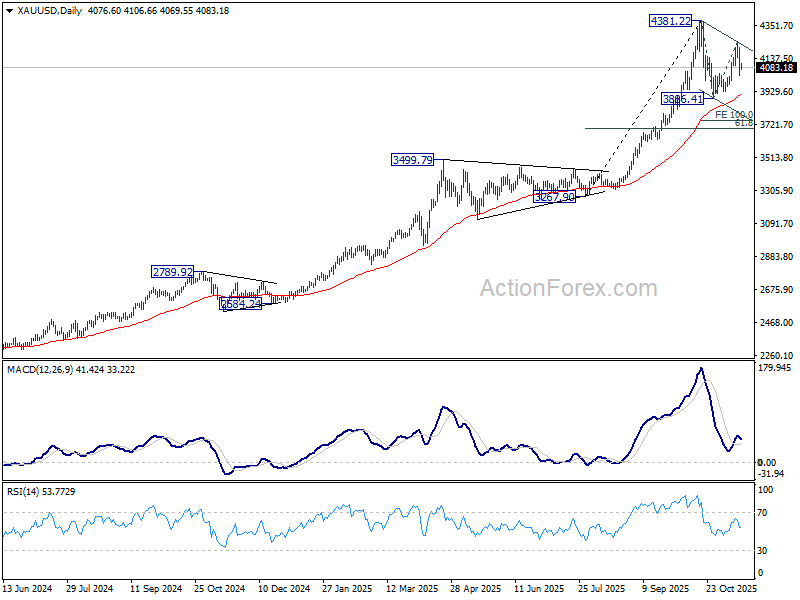
Technically, in Gold, the decline from 4,381.22 to 3,886.41 forms the first leg of a corrective pattern to uptrend from 3,267.90. The second leg has likely completed at 4,244.86 last week. Deeper move toward 55 D EMA (now at 3907.78) is favored. Support could emerge there, but firm break will target 100% projection of 4381.22 to 3886.41 from 4244.86 at 3750.05, where the correction should complete.
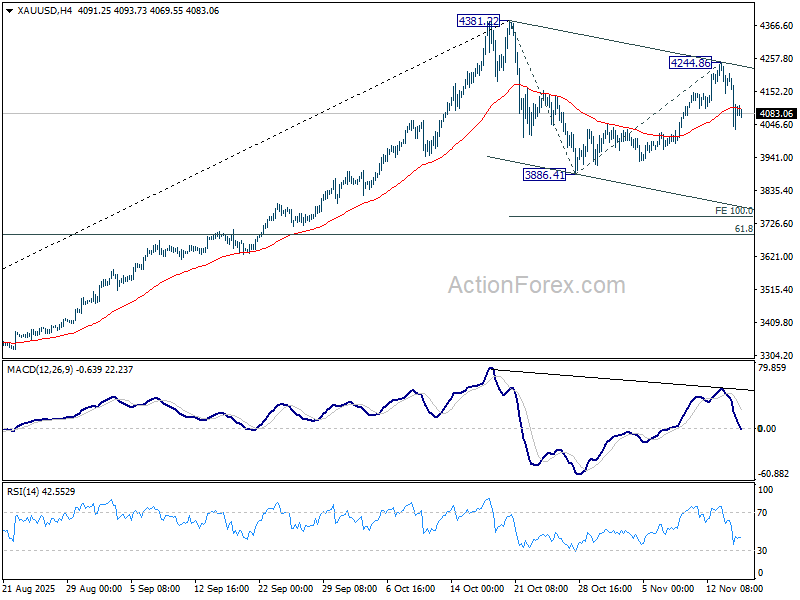
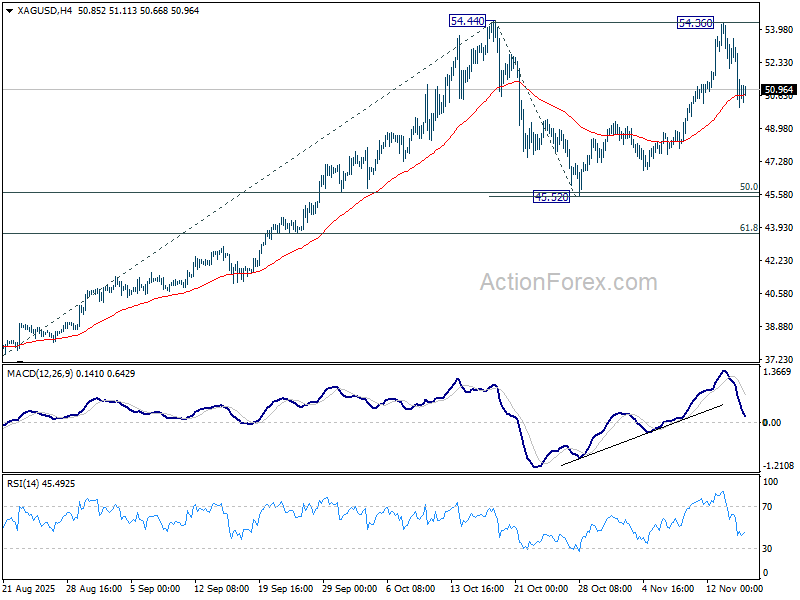
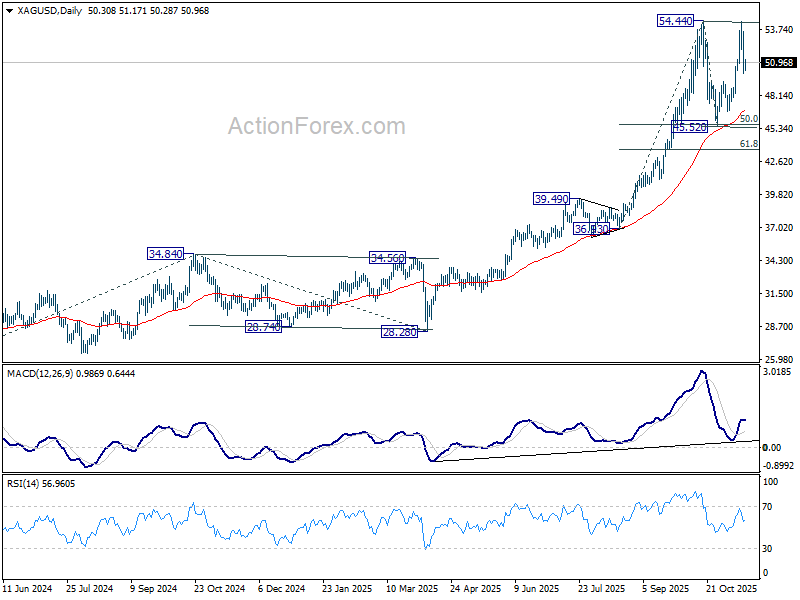
Silver shows a parallel pattern. The initial fall from 54.44 to 45.52 was followed by a second-leg rise to 54.36 last week, narrowly missing the prior high. Sustained trading below the 55 4H EMA (now at 50.678) would confirm the corrective structure and open a move toward the 55 D EMA (now at 46.99) or a bit lower. Strong support is expected from 45.52 cluster (50% retracement of 36.93 to 54.44 at 45.68) to contain downside to complete the consolidations pattern.
NFP and FOMC minutes to set tone for December Fed debate
U.S. economic data finally returns to focus this week, with the September nonfarm payrolls report set for release on Thursday following the reopening of the federal government. While the numbers will be somewhat dated, the report may become the last complete employment update the Fed receives before its December meeting. Any October labor figures, even if published, could carry omissions or reliability issues due to the data-collection disruptions during the shutdown.
Before the jobs report lands, Thursday’s FOMC minutes will offer the first detailed look at internal debates from the last meeting. Recent comments from Fed officials have shown clear hesitation toward committing to a December cut, and futures markets now price the probability of easing below 50%. The minutes should provide valuable insight into how divided policymakers were. The hawk-dove balance will be closely scrutinized, particularly given the Fed’s emphasis on.
RBA minutes on Tuesday add another central-bank highlight. With markets widely expecting no further cuts this year, attention will turn to how the Board frames the criteria for a possible February reduction. Any indication that some members view the current easing cycle as effectively complete would recalibrate expectations for 2026.
A packed international calendar rounds out the week. CPI releases from the UK, Canada, and Japan will guide inflation expectations, while Friday brings PMI updates from Australia, Japan, Eurozone, UK, and the U.S.
Highlights for the week ahead:
- Monday: New Zealand BNZ services; Japan GDP; Canada CPI; US Empire state manufacturing.
- Tuesday: RBA minutes; US NAHB housing index.
- Wednesday: New Zealand PPI; Japan trade balance; Australia wage price index; UK CPI, PPI; Eurozone CPI final; FOMC minutes.
- Thursday: China rate decision; Swiss trade balance; Germany PPI; Canada IPPI and RMPI; US non-farm payrolls, jobless claims, Philly Fed survey.
- Friday: New Zealand trade balance; Australia PMIs; Japan CPI, PMIs; UK Gfk consumer confidence; retail sales, PMIs; Eurozone PMIs; Canada retail sales; US PMIs.
AUD/USD Daily Report
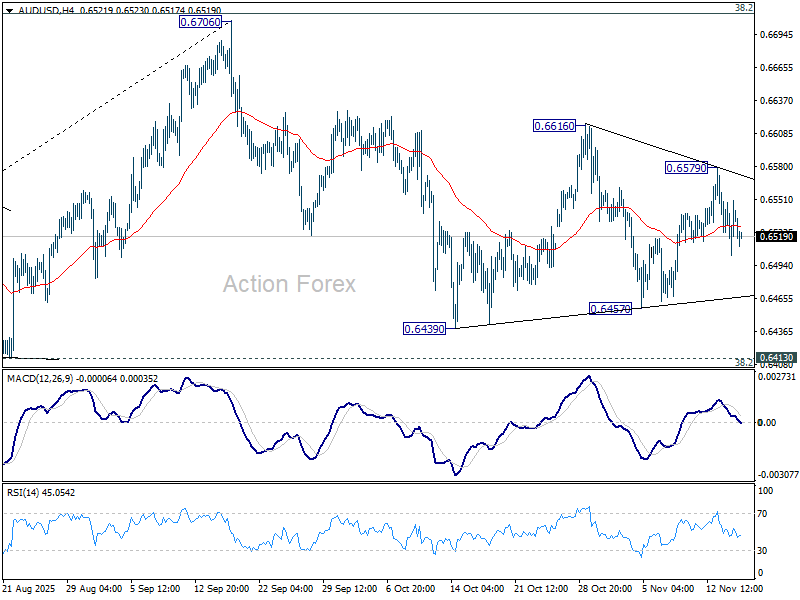
Daily Pivots: (S1) 0.6510; (P) 0.6531; (R1) 0.6557; More...
Intraday bias in AUD/USD remains neutral as sideway trading continues. On the downside, break of 0.6457 will target 0.6413 cluster (38.2% retracement of 0.5913 to 0.6706 at 0.6403). Decisive break there will carry larger bearish implications. On the upside, break of 0.6579 will bring stronger rise to 0.6616 resistance. Firm break there will target a retest of 0.6706 high.
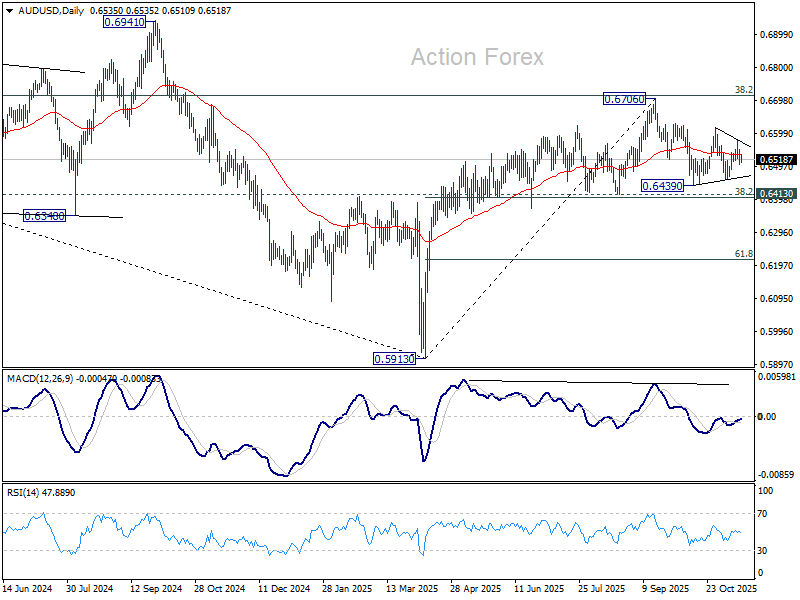
In the bigger picture, there is no clear sign that down trend from 0.8006 (2021 high) has completed. Rebound from 0.5913 is seen as a corrective move. Outlook will remain bearish as long as 38.2% retracement of 0.8006 to 0.5913 at 0.6713 holds. Break of 0.6413 support will suggest rejection by 0.6713 and solidify this bearish case. Nevertheless, considering bullish convergence condition in W MACD, sustained break of 0.6713 will be a strong sign of bullish trend reversal, and pave the way to 0.6941 structural resistance for confirmation.
Gold, Silver stay capped, macro haze holds breakout timing to early 2026
Gold and Silver’s late-week slide marked the continuation of a corrective pattern that has been unfolding since both metals hit record highs in mid-October. The sequence of the initial decline, the early-November rebound, and now the latest retreat all form part of a consolidation phase, reflecting that the markets are still searching for direction after months of decisive trending.
Both fundamental and technical backdrops suggest that this period of indecisiveness will continue in the near term. The broader uptrend remains firmly intact, but without a clear catalyst, price action is likely to stay choppy. New record highs remain part of the medium-term outlook, though the timetable leans toward early next year rather than the remainder of 2025.
On the fundamental side, the slowdown in Gold and Silver's up trend began as U.S.–China trade tensions eased under their one-year arrangement blocking further tariff and non-tariff escalations. That agreement removed a significant layer of risk premium that had supported heavy hedging flows into precious metals. With geopolitical pressure reduced, markets have lacked urgency to extend the rally.
The latest leg lower was driven more by shifts in Fed expectations. A December cut is now regarded as a coin toss, softening the near-term appeal of non-yielding assets. Still, the larger policy direction remains downward, and an easing cycle next year should restore support for Gold and Silver once the current fog clears.
The challenge is that macro visibility will not improve immediately. Even though U.S. data releases are resuming after the shutdown ended last week, neither the Fed nor markets will have full clarity on underlying economic conditions until the release schedule fully normalizes in December. This leaves policymakers cautious and investors reluctant to build strong directional positions.
Technically, in Gold, the decline from 4,381.22 to 3,886.41 forms the first leg of a corrective pattern to uptrend from 3,267.90. The second leg has likely completed at 4,244.86 last week. Deeper move toward 55 D EMA (now at 3907.78) is favored. Support could emerge there, but firm break will target 100% projection of 4381.22 to 3886.41 from 4244.86 at 3750.05, where the correction should complete.
Silver shows a parallel pattern. The initial fall from 54.44 to 45.52 was followed by a second-leg rise to 54.36 last week, narrowly missing the prior high. Sustained trading below the 55 4H EMA (now at 50.678) would confirm the corrective structure and open a move toward the 55 D EMA (now at 46.99) or a bit lower. Strong support is expected from 45.52 cluster (50% retracement of 36.93 to 54.44 at 45.68) to contain downside to complete the consolidations pattern.
EUR/USD Resumes Northbound Move, Hinting at Continued Strength
Key Highlights
- EUR/USD started a decent increase above 1.1600.
- A key bullish trend line is forming with support at 1.1600 on the 4-hour chart.
- GBP/USD recovered some losses and climbed above 1.3120.
- Gold failed to continue higher above $4,200 and trimmed some gains.
EUR/USD Technical Analysis
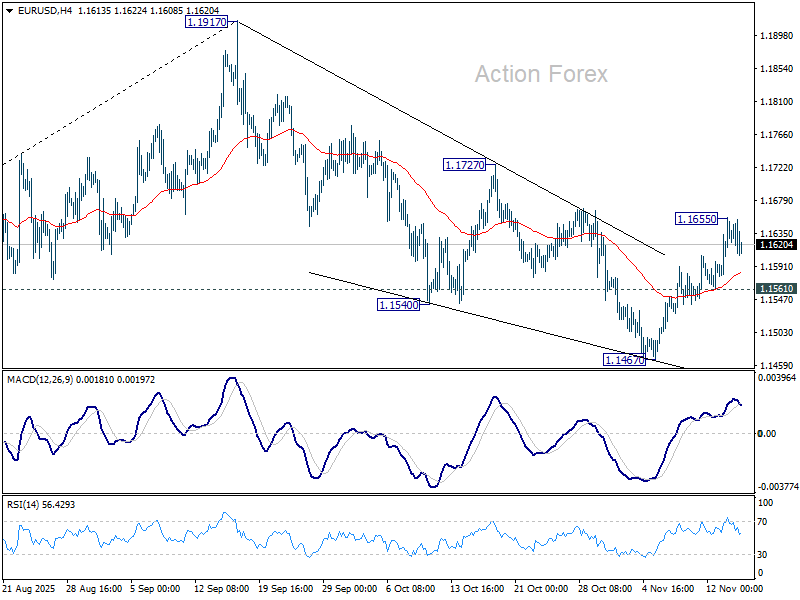
The Euro found support at 1.1475 and started a fresh increase against the US Dollar. EUR/USD climbed above 1.1550 and 1.1580.
Looking at the 4-hour chart, the pair settled above 1.1600 and the 100 simple moving average (red, 4-hour). It even spiked above the 200 simple moving average (green, 4-hour). On the downside, there is a key bullish trend line forming with support at 1.1600.
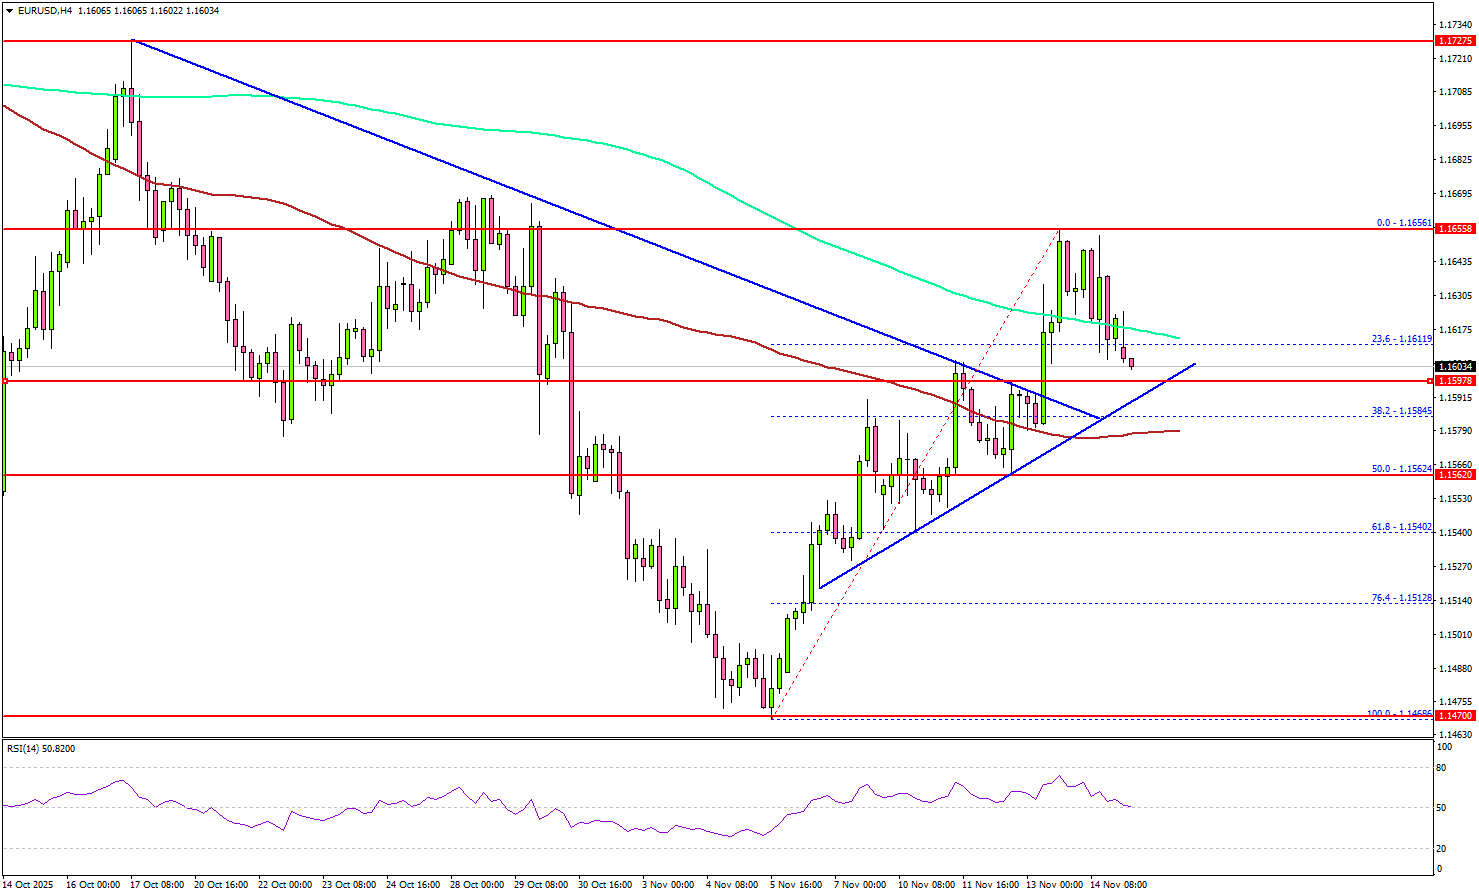
On the upside, the pair faces resistance near the 1.1650 zone. The first key hurdle sits at 1.1675. A close above 1.1675 might send the pair higher toward 1.1720.
The next resistance could be 1.1750. Any more gains could set the pace for a steady increase toward 1.1800. On the downside, the pair might find support at 1.1600 and the trend line. The main support might be 1.1580 and the 100 simple moving average (red, 4-hour).
A close below 1.1580 could start a pullback toward 1.1560. Any more losses might open the doors for a test of 1.1520 in the coming sessions.
Looking at GBP/USD, the pair started a recovery wave above 1.3120 and now faces tough resistance near 1.3200.
Upcoming Key Economic Events:
- European Commission releases Economic Growth Forecasts.
- NY Empire State Manufacturing Index for Nov 2025 – Forecast 6.1, versus 10.7 previous.
Japan’s GDP avoids deeper Q3 slump as public spending cushions demand
Japan’s economy contracted in the third quarter, but the decline was smaller than markets anticipated. GDP fell -0.4% qoq versus expectations of -0.6%. The annualized figure showed -1.8% drop compared with forecasts of -2.5%. The softer-than-expected contraction reflected pockets of resilience in domestic demand despite broader weakness.
Government spending rose 0.5% qoq and private consumption edged up 0.1% qoq, helping to offset some of the slowdown. Public demand grew 0.5% qoq and contributed 0.1 percentage point to overall GDP. However, private demand was a significant drag, falling -0.4% qoq as residential investment plunged -9.4% qoq, subtracting 0.3 percentage point from output.
External demand also weakened. Exports of goods and services fell -1.2% qoq after a strong 2.3% qoq rise in the previous quarter, with net exports contributing to a 0.2 percentage point drop in GDP.
Slight uptick in NZ BNZ services in October, but weakness persists
New Zealand’s services sector remained under heavy strain in October, with the BusinessNZ Performance of Services Index inching up from 48.3 to 48.7 but still locked firmly in contraction.Activity, employment, and new orders all hovered below 50, extending the sector’s downturn to 20 straight months and keeping the headline reading well below the long-term average of 52.8.
Businesses cited weak demand as the principal drag, linking the slowdown to reduced household spending, ongoing cost-of-living pressures, and diminished confidence. While the proportion of negative comments fell from 58.0% to 54.1%, responses still pointed to a market struggling with inconsistent sales flows and hesitant customers. The continued decline in new orders signals that firms are not yet seeing a meaningful turn in forward demand.
Operating costs, competitive intensity, workflow delays, and cancelled projects are adding further strain, tightening cashflow and limiting the ability of firms to absorb volatility.
Markets Stay Nervous After Shutdown Ends as Bitcoin Slips Below $100,000
It was a relatively quiet week in the markets, although the mid-week end of the U.S. government shutdown helped drive U.S. equities to fresh record highs and pushed USD/JPY briefly above 155. Despite the relief, concerns about stretched valuations — especially in AI-related stocks — continued to weigh on investor sentiment.
Toward the end of the week, several Federal Reserve policymakers warned that U.S. interest rates may not fall as quickly as many had hoped. This shift in expectations triggered selling across equities and other risk assets. The probability of a rate cut after the Fed’s December meeting has now dropped to around 50%, down sharply from about 67% a week ago and nearly 95% a month ago.
The shutdown has also delayed the release of key U.S. economic data, leaving markets with fewer important indicators to digest. However, traders showed renewed interest in safe havens, with gold surging sharply early in the week. In contrast, Bitcoin dropped below $100,000 as investors reduced exposure to high-risk assets.
Markets This Week
U.S. Stocks
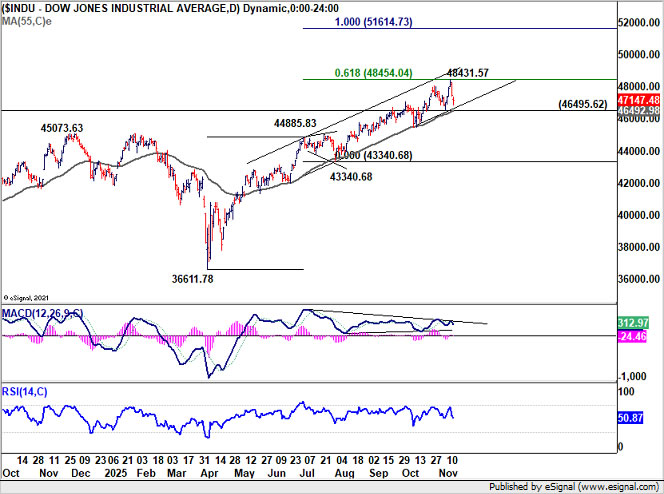
The Dow Index hit new highs last week but ended back below its 10-day moving average as investors stayed cautious about high valuations. In the current sentiment, focusing on selling opportunities remains the preferred short-term approach, though traders should avoid selling into weakness, as a major crash seems unlikely without significantly negative news. Resistance levels are at 47,500, 48,000, 48,500, and 49,000, while support lies at 46,500, 46,000, 45,500, 45,000, and 44,500.
Japanese Stocks
The Nikkei 225 traded sideways last week, as yen weakness helped support prices, but falling U.S. stocks limited gains. The market is still waiting for the new Japanese prime minister to announce an economic stimulus package, which could drive a move to new highs. For now, upward momentum has stalled, and technical indicators are pointing slightly lower, so a short-term test to the downside is likely unless stimulus is confirmed. Resistance is at 51,500円, 52,000円, and 53,000円, while support is at 50,000円, 49,000円, 48,500円, and 47,000円.
USD/JPY
Despite ongoing fears of intervention to support the yen, USD/JPY pushed higher last week as traders expect any Bank of Japan rate hike to be delayed until January. The 155 level remains key, and reduced market risk appetite led to some selling toward the end of the week. The overall uptrend is still intact, supported by higher U.S. interest rates compared to Japan, but further gains may be difficult, making a 153–155 range-trading strategy the most suitable for now. Resistance is at 155, 156, and 157, while support is at 153.5, 153, and 151.5.
Gold
Gold had a very strong start to last week, rising sharply as safe-haven demand increased. However, as the probability of a U.S. rate cut next month fell, some of those gains were trimmed toward the end of the week. The chart has now turned positive, and buying remains the preferred strategy as long as the market stays above $4,000. Resistance is at $4,200, $4,250, and $4,350, while support is at $4,050, $4,000, and $3,925.
Crude Oil
WTI remained under pressure last week after the International Energy Agency (IEA) warned about rising oversupply, while ongoing concerns over U.S. economic growth also kept prices capped. With the 10-day moving average still trending lower, selling remains the preferred strategy this week. Key chart levels are unchanged, with resistance at $65, $66.50, $70, and $75, and support at $55 and $50.
Bitcoin
As risky assets sold off late last week, Bitcoin fell below the key $100,000 level, triggering a sharp decline. With little support below this level, the risk of further falls is high, and many speculators are exiting positions. As long as Bitcoin stays under $100,000, the market is likely to remain weak, so selling remains the preferred strategy. Resistance is at $100,000, $106,000, and $116,000, while support is at $95,000, $90,000, and $85,000.
This Week’s Focus
- Monday: Japan GDP and Industrial Production, U.S. NY Empire State Manufacturing Index
- Tuesday: Australia RBA Meeting Minutes, U.S. Industrial Production
- Wednesday Japan Trade Balance, U.K. CPI and PPI, E.U. CPI, U.S. Building Permits and FOMC Meeting Minutes
- Thursday: U.S. Philadelphia Fed Manufacturing and Existing Home Sales
- Friday: Japan National CPI, U.K. Retail Sales and S&P Global Manufacturing, E.U. HCOB Eurozone Manufacturing PMI, U.S. S&P Global Manufacturing PMI and Michigan Consumer Sentiment
Volatility could rise this week as traders look for clues on possible rate cuts from Fed speeches and the release of FOMC meeting minutes. In Japan, GDP and CPI data will be important as the BoJ decides whether to raise rates, and the weak yen remains in focus. With the U.S. government shutdown now over, stock and risk markets are hoping for positive news to avoid more selling in a nervous market.
Don’t Miss Titan FX’s Black Friday Offer
With volatility likely to rise, this is a great time to take advantage of increased trading opportunities in FX and gold. For five days only, Titan FX is offering USD 3.99 cashback per lot on all FX and gold trades with no limits. From November 24–28, 2025, all live trading accounts are eligible — just register via your Client Cabinet, deposit at least USD 500, and start trading. The more you trade, the more cashback you earn.
Ethereum Wave Analysis
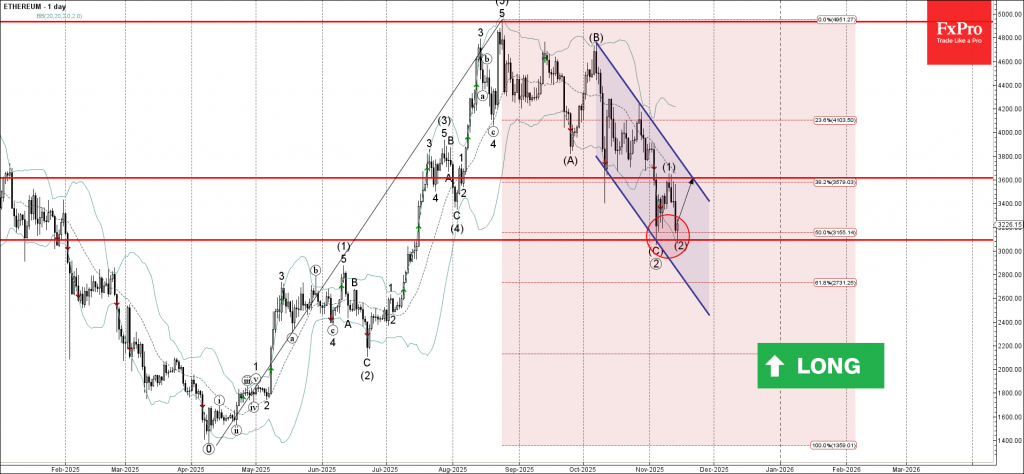
Ethereum: ⬆️ Buy
- Ethereum reversed from support zone
- Likely to rise to resistance level 3600.00
Ethereum cryptocurrency recently reversed from the support area between the support level 3090.00 (which stopped the previous impulse wave (C) at the start of November), 50% Fibonacci correction of the upward impulse from April and the lower daily Bollinger Band.
The upward reversal from this support zone stopped the previous medium-term ABC correction (2).
Given the strength of the support level 3090.00, Ethereum cryptocurrency can be expected to rise to the next resistance level 3600.00.
EURCHF Wave Analysis
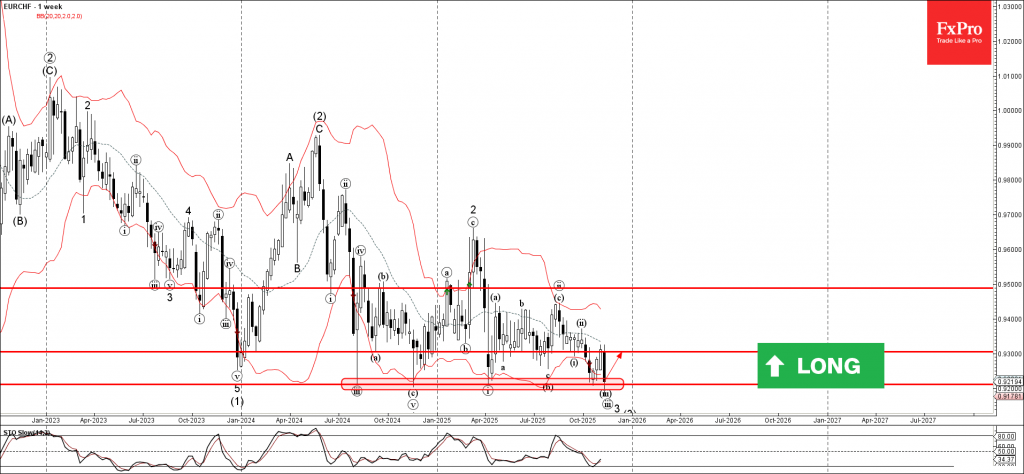
EURCHF: ⬆️ Buy
- EURCHF reversed from support zone
- Likely to rise to resistance level 0.9300
EURCHF currency pair recently reversed from the support zone between the long-term support level 0.9210 (which has been reversing the price from the middle of 2024) and the lower weekly Bollinger Band.
The upward reversal from this support zone stopped the previous short-term impulse wave (iii).
Given the strength of the support level 0.9210 and the bearish Swiss franc sentiment seen today, EURCHF currency pair can be expected to rise to the next resistance level 0.9300.
Investors Step Back From US Assets Ahead of Data Flood
Last week delivered what should have been a moment of relief for global markets: the US finally ended its historic government shutdown, clearing the way for normal economic data flow to resume. Yet instead of sparking a rally, the reopening brought little comfort.
U.S. assets struggled across the board. Equities came under pressure as investors reassessed the risks around Fed policy direction and stretched valuations in key growth sectors. Yields moved higher but offered no support to Dollar, which weakened broadly despite fading expectations of near-term Fed easing. Even the traditional safe-haven flows that typically favor the greenback failed to materialize in a meaningful way.
Currency markets delivered their own twist. Yen, often the first beneficiary of a risk-off wave, ended the week as the worst performer as traders pushed out expectations for a BoJ rate hike. Sterling suffered as well, pressured by weak economic data and growing conviction that the BoE would cut rates in December.
By contrast, Swiss Franc surged on a mix of safe-haven demand and positive trade developments. Australian and New Zealand Dollars found some early support but struggled to extend gains as sentiment darkened. Euro and Canadian Dollar sat in the middle of the pack.
Is ‘Sell America’ Returning, or Just a Pause Before the Data Storm?
The past week delivered an unusual alignment across U.S. assets: stocks, Treasuries, and Dollar all came under pressure at the same time. That pattern immediately drew comparisons to April, when markets reacted violently to President Donald Trump’s “Liberation Day” announcement, triggering the now-famous “Sell America” trade. While last week’s moves were nowhere near that magnitude, the directional similarity was difficult to ignore.
Still, calling it a revival of the same theme may be premature. Market positioning seems far more cautious than actively bearish. The historic government shutdown kept investors blind to key economic signals for weeks. With the data blackout now lifted, traders appear reluctant to make big commitments until a clearer macro picture emerges. The pullback in U.S. assets may simply reflect a desire to step aside before the next wave of information hits.
The coming week could prove decisive. With the government now reopened, the pipeline of U.S. economic releases is about to restart — and after several weeks of silence, the impact could be amplified. Volatility, which has softened noticeably during the shutdown, is likely to climb as markets digest a heavy flow of indicators that will reset expectations for both growth and inflation.
What those data reveal will determine whether last week’s moves were a temporary misalignment or the early stages of a more structural shift. A resilient economy with stable job growth could revive confidence in U.S. assets. A deteriorating backdrop could force a deeper repricing. Anything in between would keep traders directionally cautious but tactically reactive.
For now, the only certainty is uncertainty itself. Markets briefly lost their footing last week, and the synchronized weakness across U.S. stocks, bonds, and Dollar has raised legitimate questions about investor conviction. Whether that hesitation evolves into a broader “Sell America” theme could depend entirely on what the long-delayed data now reveal.
Fed Cut Odds Crumble, Yields Rebound
Expectations for a December Fed rate cut shifted sharply last week after a set of remarks from FOMC officials signaled that easing is far from guaranteed. What had looked like a near-certainty just a month ago is now a coin toss: market odds for a December cut have fallen to 44.4%, down from 66.9% a week earlier and 94.2% a month ago.
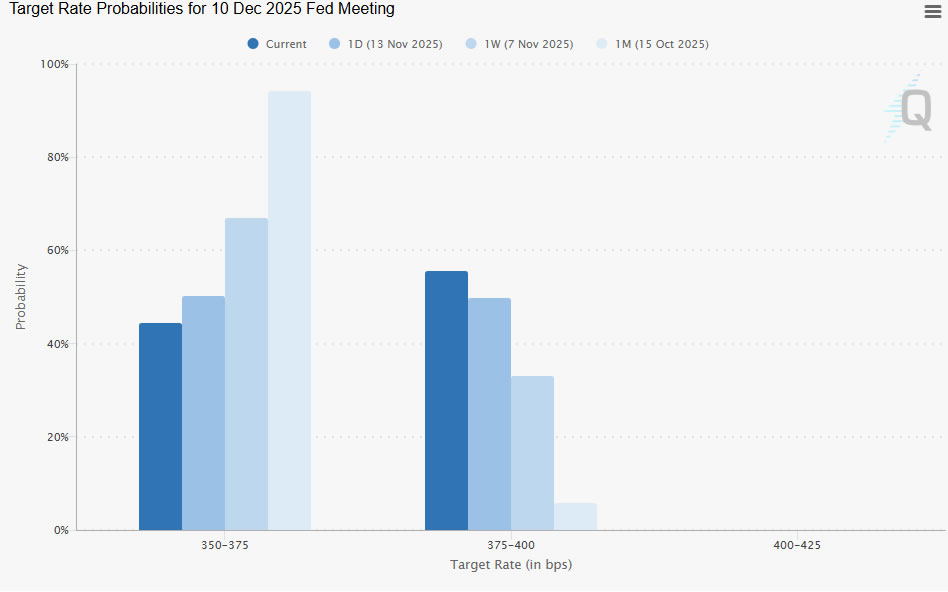
Some economists reinforced that view by noting that GDP prior to the shutdown was tracking at 3.5% to 4%, a pace more consistent with overheating than with urgency for additional stimulus. Financial conditions also remain unusually easy, leaving little justification for further policy accommodation. Lowering funding costs for banks at this stage risks could do more harm than good by reigniting price pressures just as progress toward 2% inflation remains uneven.
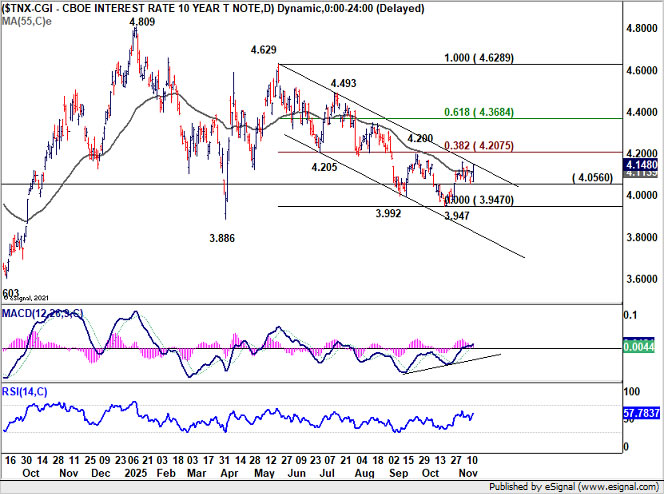
The repricing in expectations helped drive a meaningful move in Treasuries. 10-year yield jumped sharply on Friday, closing at 4.148. But for now, the rebound from 3.947 short term bottom is still viewed as a corrective move within the broader decline from 4.629.
Technically, resistance near 4.200 should form a formidable cap, with 4.205 support turned resistance and 38.2% retracement of 4.629 to 3.947 at 4.207. Break of 4.056 support will suggest that the corrective bounce has completed, and bring retest of 3.947 low.
However, decisive break above 4.200 would suggest the decline from 4.629 has run its course, and open way to 61.8% retracement at 4.368.
Tech Jitters Persist, But Dip Buyers Defend Key Support
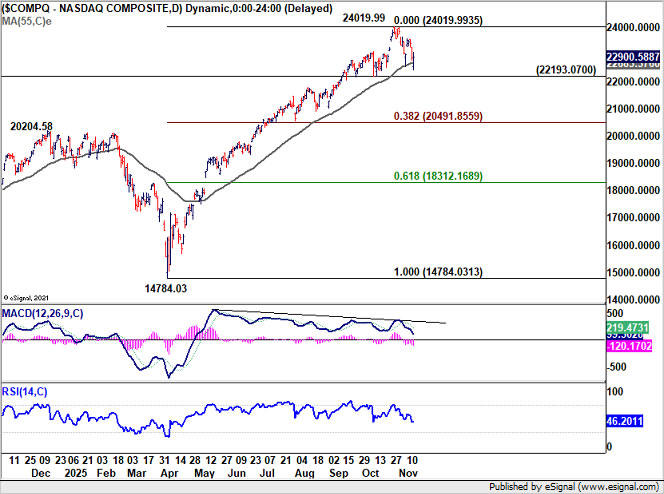
US equities spent latter part of last week struggling under the weight of shifting Fed expectations and the re-emergence of AI valuation concerns. Yet, just as in the prior week, buyers stepped in late on Friday, hinting that dip-buying appetite has not fully disappeared. NASDAQ closed at 22,900.58 after plunging to 22,436.79, a notable recovery given the earlier capitulation.
Technically, NASDAQ is still holding the line where it matters most. It remains above its 55 Day EMA (now at 22,683.37), and more importantly, above key structural support at 22,193.07. As long as these levels hold, the broader uptrend remains intact, and the path toward a fresh record high stays open.
However, D MACD continues to show bearish divergence, which adds uncertainty about the strength of the underlying trend. Decisive break of 22,193.07 will argue that it's at least correcting the rise from 14,784.03. In this case, deeper fall would be seen back to 38.2% retracement of 14,784.03 to 24,019.99 at 20,491.85.
DOW surged to a new record high of 48,435.57 mid-week, only to reverse sharply and finish at 47,147.48. Nevertheless, the broader technical picture remains bullish while support at 46,495.62 intact. Firm break of 61.8% projection of 36,611.78 to 44,885.83 from 43,340.68 will pave the way to 50k psychological level, and possibly further to 100% projection at 51,614.73.
Still, D MACD is showing bearish divergence condition, hinting that upward momentum is waning. Firm break of 46,495.62 support would confirm that a deeper correction is underway, sending the index back toward 44,885.83 resistance turned support.
Dollar Struggles Despite Shift in Fed Pricing
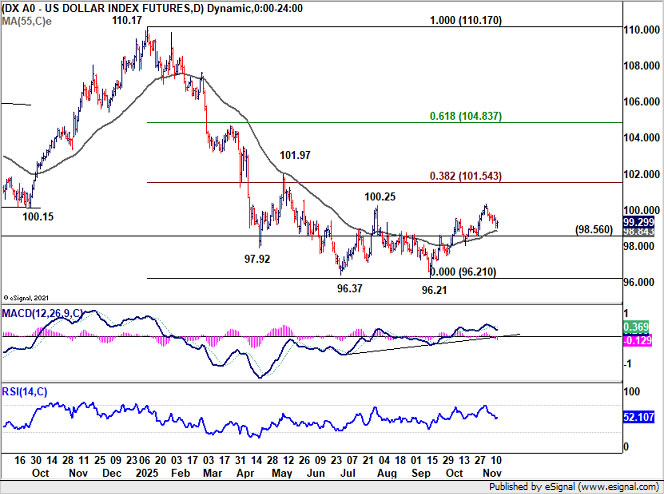
Dollar Index gyrated lower last week, failing to draw support from fading expectations of a December Fed rate cut, firmer Treasury yields, or the mild risk aversion that built into the Friday close.
Technically, with 98.56 support still intact, corrective rise from 96.21 short-term bottom remains in play. But any further upside should meet heavy resistance at 38.2% retracement of 110.17 to 96.21 at 101.54. On the downside, firm break of 98.56 would indicate that the bounce has already run its course, setting up a retest of the 96.21 low.
CHF/JPY Blasts to New Record
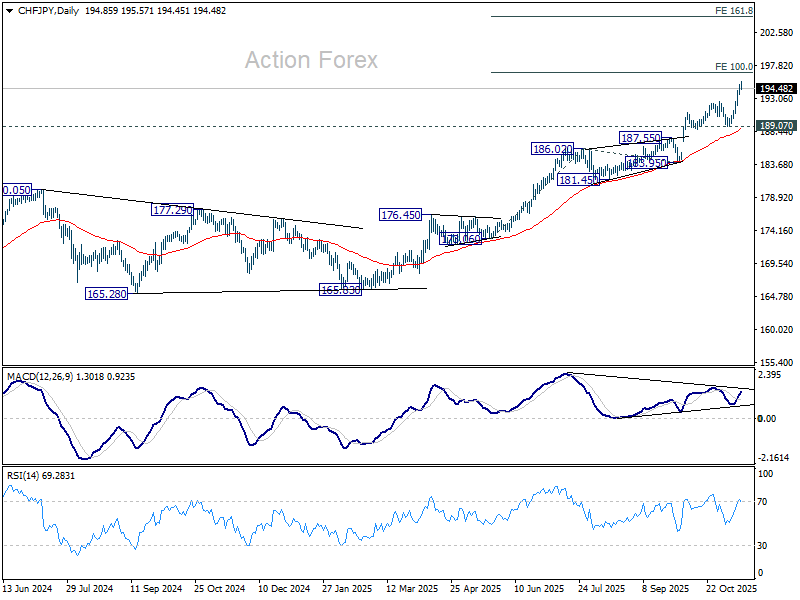
CHF/JPY exploded to new record highs last week, extending its already-impressive rally. The cross gained 2.11% and holds the number one position in the Top Movers chart.
Half of the move was driven by Swiss Franc strength as Switzerland and the U.S. reached a near-final framework to reduce tariffs on Swiss imports from 39% to 15%. This immediately leveled Switzerland with the EU’s trade treatment. Part of the also agreement includes a substantial Swiss pledge: USD 200B in investment into the U.S. by 2028, focused on pharmaceuticals, medical devices, aerospace and gold production.
Around 40% of Switzerland’s exports will benefit directly from the lower tariff regime. Officials said implementation could occur within “days, weeks,” once U.S. customs systems are updated.
Another half of the move was extended Yen weakness. The Japanese currency was weighed down broadly by increasingly explicit political pressure on the BoJ to delay rate hikes. Prime Minister Sanae Takaichi emphasized to parliament that Japan’s current inflation is driven primarily by food prices — the wrong kind of inflation — and warned of renewed deflation risks if monetary policy is tightened prematurely.
Economic Revitalization Minister Minoru Kiuchi captured the logic succinctly. Although the government watches Yen movements closely, he noted that Yen-based import prices have fallen for eight consecutive months, blunting the pass-through of currency weakness. Data later confirmed a ninth negative reading at -1.5% yoy. As long as Yen's decline remains measured and orderly, Tokyo is clearly willing to tolerate further weakness. Growth from monetary policy support clearly takes priority over currency strength.
Against that backdrop, CHF/JPY uptrend has powerful fundamental backing. Technically, the immediate focus is 100% projection of 173.06 to 186.02 from 183.95 at 196.91, where resistance could emerge due to bearish divergence condition in D MACD. But in any case, outlook will stay bullish as long as 189.07 support holds. Decisive break of 196.91 could invalidate the bearish divergence and unlock 161.8% projection at 204.91 as the next target.
EUR/USD Weekly Outlook
EUR/USD's rebound from 1.1467 extended higher last week retreated after hitting 1.1655. Initial bias is turned neutral this week first. Fall from 1.1917 might have completed as a three wave correction at 1.1467. Above 1.1655 will target 1.1727 resistance first. Firm break there will solidify this bullish case and bring retest of 1.1917 high. However, break of 1.1561 will revive near term bearishness and target 1.1467 low instead.
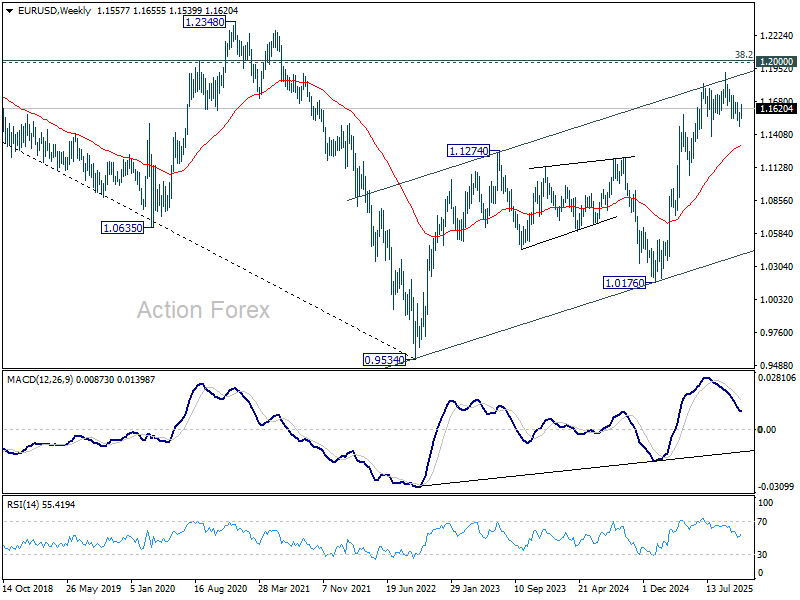
In the bigger picture, considering bearish divergence condition in D MACD, a medium term top is likely in place at 1.1917, just ahead of 1.2 key psychological level. As long as 55 W EMA (now at 1.1306) holds, the up trend from 0.9534 (2022 low) is still in favor to continue. Decisive break of 1.2000 will carry larger bullish implications. However, sustained trading below 55 W EMA will argue that rise from 0.9534 has completed as a three wave corrective bounce, and keep long term outlook bearish.
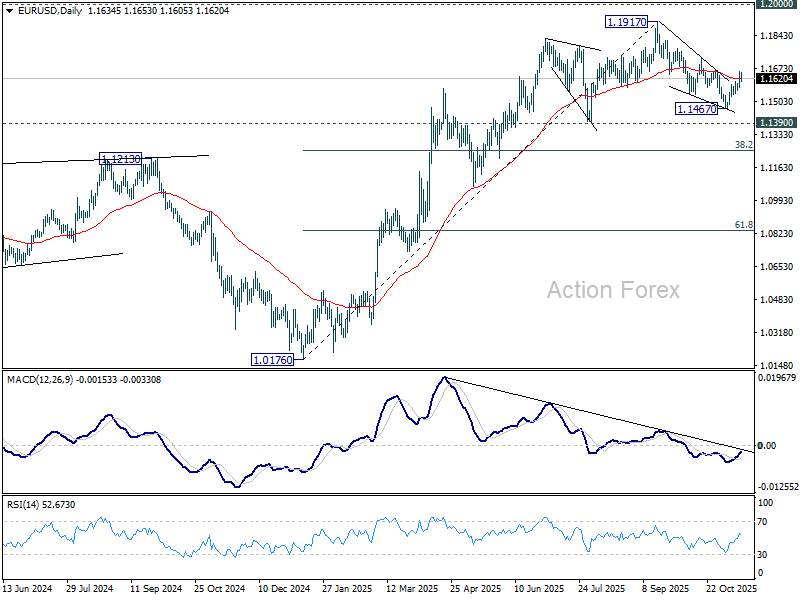
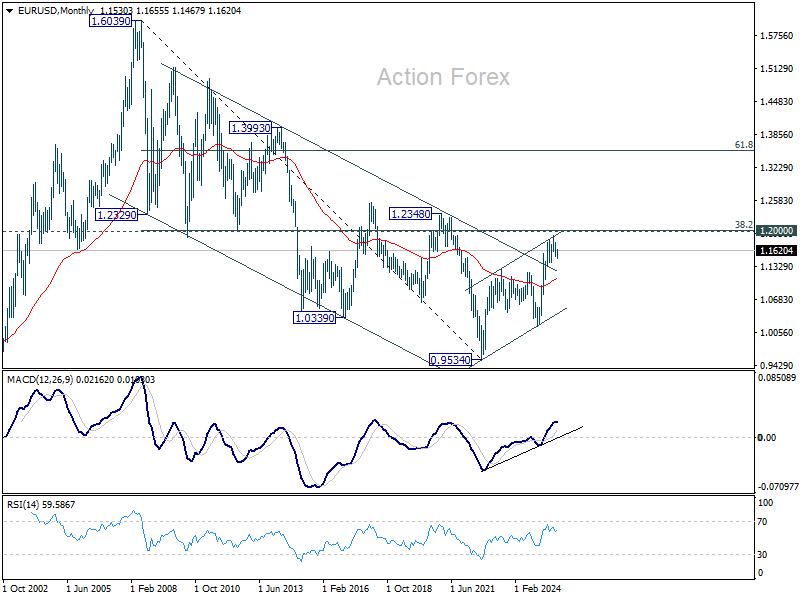
In the long term picture, 38.2% retracement of 1.6039 to 0.9534 at 1.2019, which is close to 1.2000 psychological level is the key for the outlook. Rejection by this level will keep the multi decade down trend from 1.6039 (2008 high) intact, and keep outlook neutral at best. However, decisive break of 1.2000/19, will suggest long term bullish trend reversal, and target 61.8% retracement at 1.3554.