Sample Category Title
EUR/CHF Weekly Outlook
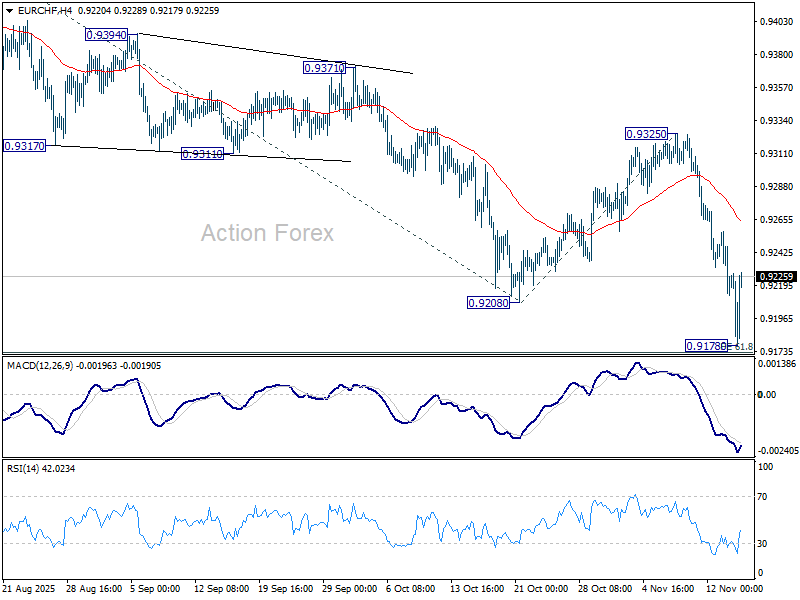
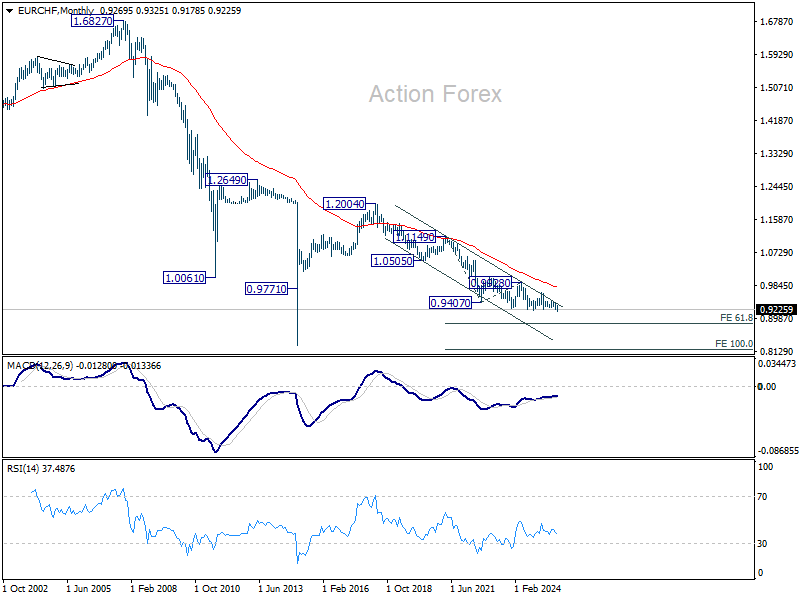
EUR/CHF's down trend resumed by breaking through 0.9205 last week, but recovered after dipping to 0.9178. Initial bias is turned neutral this week and some consolidations could be seen. Recovery should be limited below 0.9325 resistance to bring another fall. Firm break of 0.9178 will target 100% projection of 0.9452 to 0.9208 from 0.9325 at 0.9082.
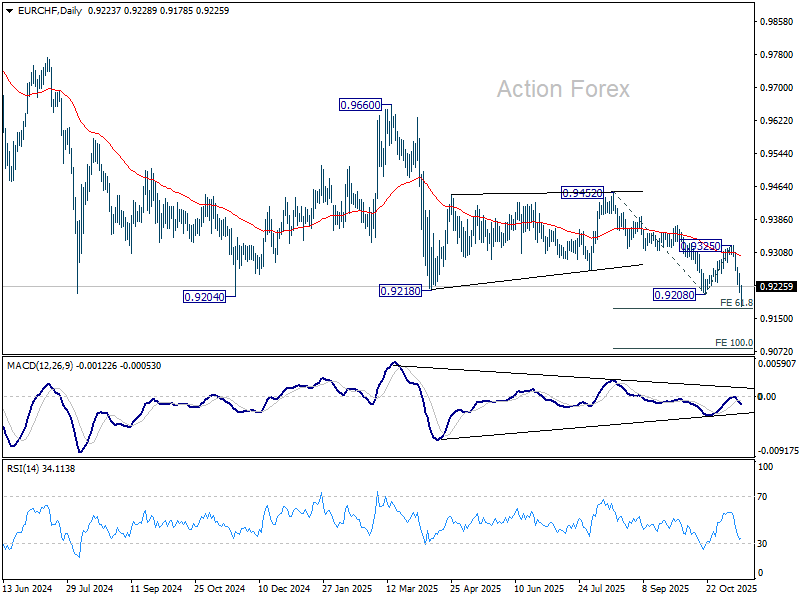
In the bigger picture, outlook remains bearish with EUR/CHF staying well inside long term falling channel after multiple rejection by 55 W EMA (now at 0.9383). Next target is 61.8% projection of 1.1149 to 0.9407 from 0.9928 at 0.8851. Break of 0.9452 resistance is needed to be the first sign of medium term bottoming. Otherwise, outlook will stay bearish in case of strong rebound.
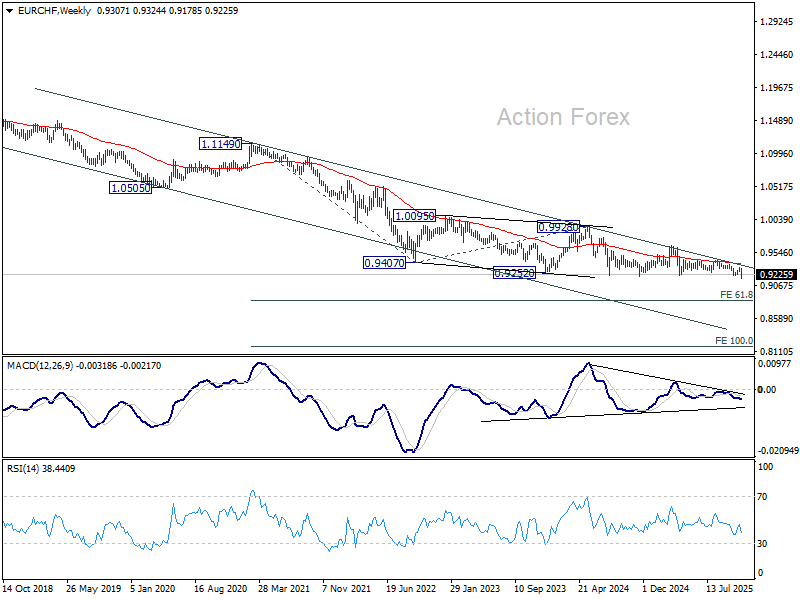
In the long term picture, overall long term down trend is still in progress in EUR/CHF. Outlook will continue to stay bearish as long as 55 M EMA (now at 0.9820) holds.
Unclear BLS Post-Shutdown Schedule – Markets Weekly Outlook
Week in review – Markets remain very anxious
This week finally saw the US government reopen after the longest ever government shutdown, which lasted 43 days.
News of the deal initially brought a much-needed rally in stocks on Monday, but throughout the week, markets have been plagued by sudden selloffs without much explanation.
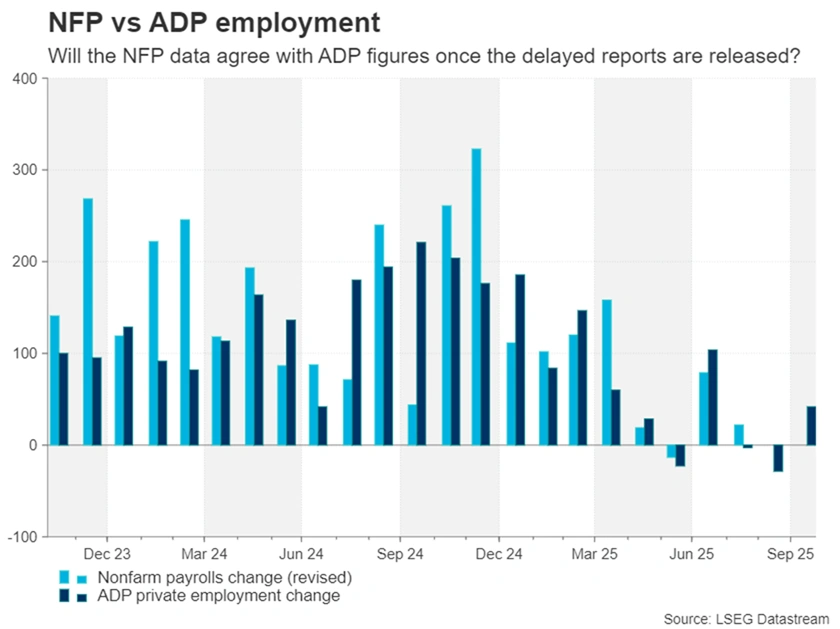
NOTE: The Bureau of Labor Statistics will publish the September NFP (normally published in early October) on Thursday, November 20.
As explained in our last weekly outlook, participants remain anxious on themes of high valuations, particularly as key participants like Nvidia CEO Jensen Huang issued warnings on US policies and regulations that he believes will restrain progress in AI.
Huang stated that China is only "nanoseconds behind America in AI".
Many doubts remain after some warnings from private data releases, like the new weekly ADP series, which indicated an average drop of 11K jobs in the private sector in the past four weeks. This has fueled even more anxiety about how the 1.5-month "data dark age" will ultimately look.
Adding to the confusion, White House Press Secretary Karoline Leavitt announced that due to the lack of collection during the shutdown, the October jobs (NFP) and inflation (CPI) data may never be released.
Leavitt claimed the data was "permanently impaired," leaving policymakers "flying blind at a critical period".
There has been a decent move higher in equities to finish the week after an even more scary open, but participants are all looking at each other to see who moves first.
Expect to receive more news from the BLS as they resume their operations again.
From what it seems, they will be prioritizing November releases.
However, the September NFP is expected to be released quickly, as early as next week, as its data was collected prior to the shutdown taking effect.
Weekly Performance across Asset Classes
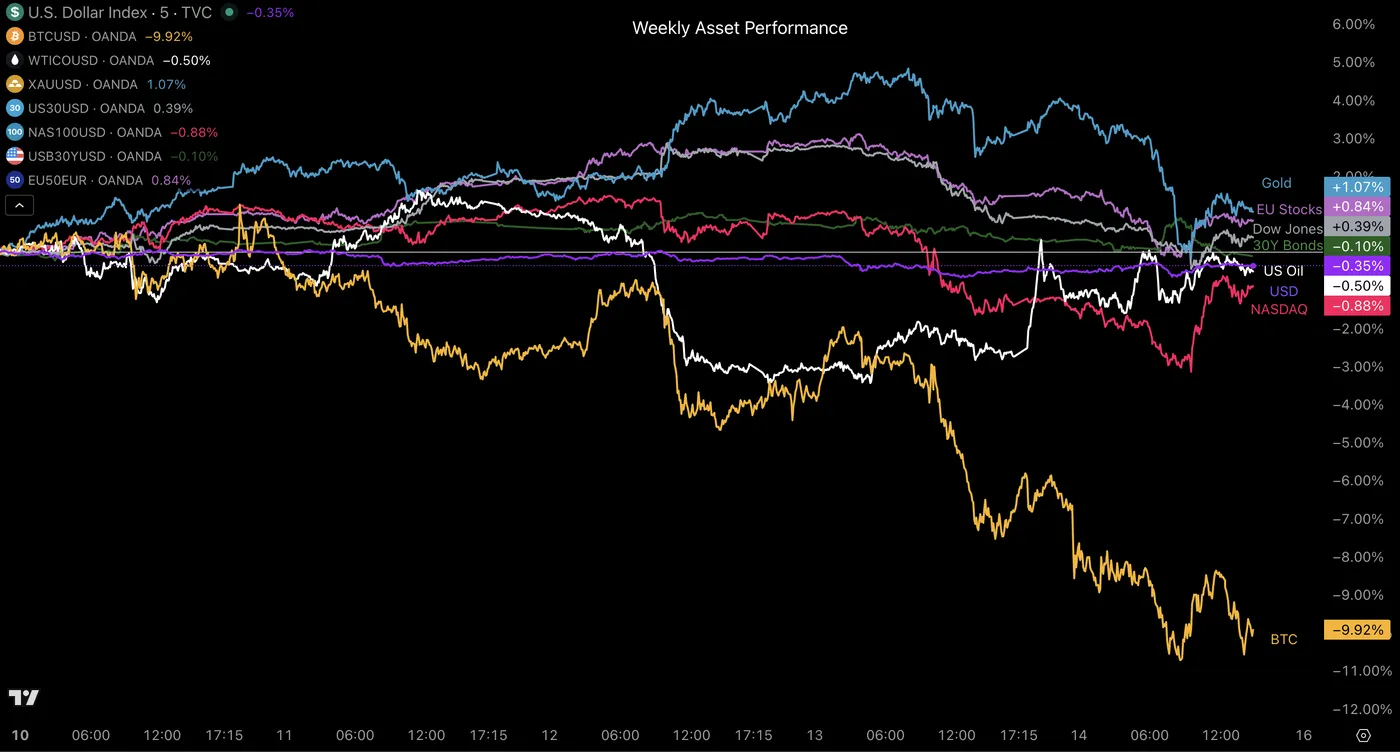
Weekly Asset Performance, November 14, 2025 – Source: TradingView
Cryptocurrencies see the most outflows once again in the ongoing risk-deleveraging happening throughout Markets.
For the rest, despite enormous volatility, most assets have mean-reverted throughout the week, leading to low weekly changes.
But for those who have been actively trading and/or watching the action unfold, everybody can confirm that the week has been far from calm.
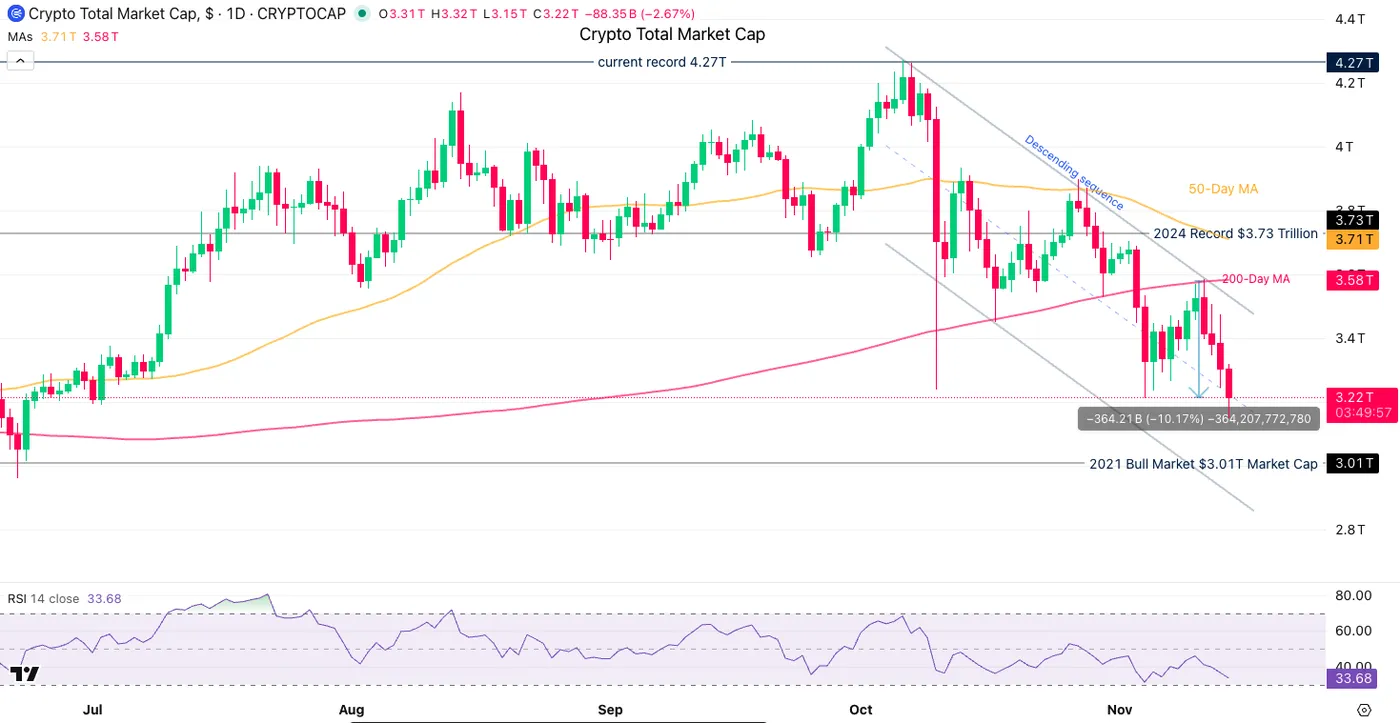
Crypto Total Market Cap down another 10% this week – Source: TradingView
The Week Ahead – US September NFP and many Inflation releases
Asia Pacific Markets – A focus on Japan and New Zealand combined with PBoC Rate Decision
The upcoming week for APAC markets is dominated by high-impact inflation updates, now focusing mostly on Japan and New Zealand data.
AUD traders will still have to log in. Monday starts with the release of the RBA Meeting Minutes, offering a detailed look at the Board's recent interest rate discussions and after another week of positive economic surprise (large beats in Employment, delaying cuts further).
The primary domestic indicator will be the Wage Price Index (WPI), due on Tuesday evening (20:30 ET), which is the most critical measure of underlying domestic inflation pressure.
For those following China, the PBoC Interest Rate Decision on Wednesday evening (21:15 ET) will attract quite some attention.
While no change is expected, communication regarding growth and concerns will be closely watched by all participants; China released some pretty bad data the past week, particularly regarding international trade.
Japanese data sets the stage early and provides the week's biggest inflation event. Sunday night brings the preliminary Q3 GDP figures to check the economy's pulse.
However , the key macro event for JPY traders is Thursday evening's (19:30 ET) National CPI release, but this one is not as closely compared to the Tokyo CPI (releasing next week).
NZD traders will also be quite busy, with the New Zealand Producer Price Index (Q3) releasing Tuesday evening, and followed by their Trade Balance data on Thursday.
US, Europe and UK Markets – US September NFP Inflation in Canada, Europe and UK + Some PMI spice
The upcoming week for traders is highly polarized, focusing on inflation in Europe, the UK and Canada – The picture is still unclear for US data except for a November 20 Sep NFP release!
Starting Monday, CAD traders will welcome the Consumer Price Index (CPI) at 9:30 A.M. ET.
Major data continues in Europe on Wednesday (6:00 A.M. ET) with the release of the Eurozone Core HICP (CPI).
The EU will also publish crucial forward-looking sentiment figures on Friday with the HCOB PMIs (4:15 - 5:00 A.M. ET), giving a fresh look at economic activity.
As for the US, the week is a waiting game of surprises, particularly with the BLS uncertainty.
Traders will look at the interest-rate-sensitive Housing Starts and Permits on Wednesday (8:30 A.M. ET).
The market’s real focus will be on potential past releases throughout next week, the New weekly ADP series on Tuesday, and Friday's Michigan Sentiment Survey (11:00 A.M. ET), which offers direct insight into consumer confidence and, more importantly, long-term Inflation Expectations.
Of course, the Swiss Franc is on watch as well, with SNB Chair Thomas Jordan speaking on Friday, and any policy hint will move the safe-haven currency that has seen quite some inflows again this week.
For all market-moving economic releases and events, see the MarketPulse Economic Calendar. (High-tier data only)
Not on the picture, but keep an eye on the flurry of Central Bank speeches throughout the week as the final quarter rate decisions approach.
Safe Trades and enjoy your weekend!
The Weekly Bottom Line: Shutdown is Over, But Uncertainty to Linger Some More
Canadian Highlights
- Prime Minister Carney unveiled a second tranche of six major projects designated for fast-track approvals.
- Inflation and retail sales data next week will likely confirm that prices are stabilizing and continued cautious spending from households.
- The Bank of Canada is likely done cutting interest rates. Risks to the outlook remain, but current rates appear to strike a balance between cushioning the impact from tariffs and preventing a new leg up in inflation.
U.S. Highlights
- The longest U.S. government shutdown in history finally ended after 43 days. However, markets reacted cautiously, with equities generally trending lower amid a selloff in tech stocks.
- Recent Fed speeches highlighted persistent caution, with several officials signaling reluctance to ease policy further. Odds of a December rate cut fell to around 50% from over 60% earlier in the week.
- Small business optimism recorded a slight decline in October but remained above its long-term average. Related inflation indicators improved modestly, while labor market metrics appeared to hold their own.
Canada – Building a Nation
A light week of domestic economic data paved the way for the federal government to make another splash following the federal budget release. Prime Minister Carney announced six new projects of perceived “national importance” to be considered for fast-track approval, increasing the total to 11. Two additional projects are in B.C.—the North Coast Transmission Line and the Ksi Lisims LNG project—while Ontario’s Crawford Nickel project and Quebec’s Nouveau Monde Graphite project were also included. The Sisson Mine in New Brunswick and a hydroelectric project in Iqaluit have also been added to the roster (Chart 1). The projects included on the list are at various stages, from early-planning to mid-construction, and are estimated to cost a total of over $100 billion.
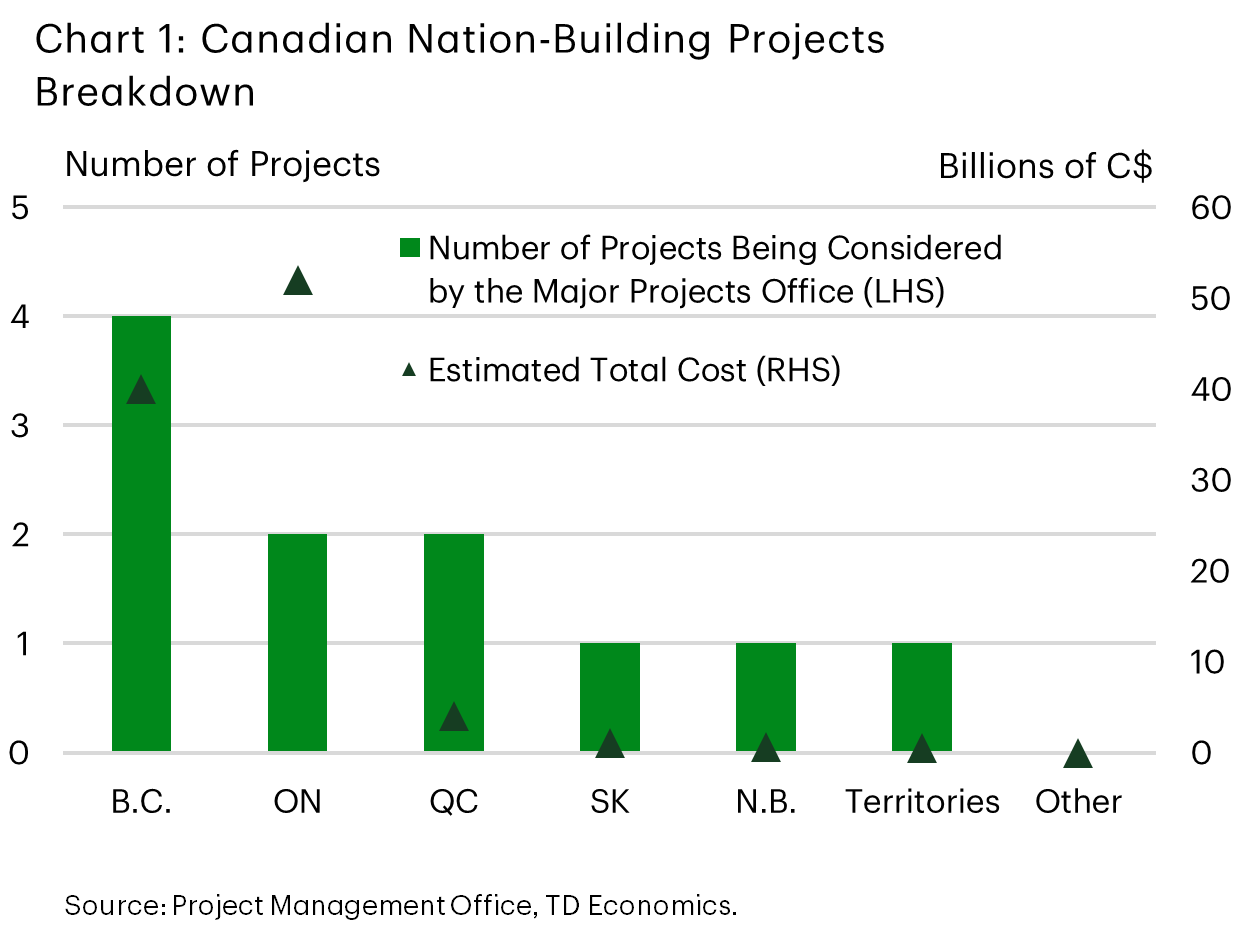
The hope is that fast-tracking these projects through the existing regulatory framework will bolster Canada’s economy and help reach the government’s broader goal of catalyzing $500 billion in private-sector investment over the next five years, a substantial tailwind for the economy should it materialize. From our lens, it the Major Projects Office still has its work cut out for it in bringing these projects to fruition. Given the novelty of the fast-tracking initiative, our outlook remains cautious but could be upgraded if notable progress on the investments is made.
Next week will bring a slew of important data to the counter including an inflation update on Monday and retail data on Friday. Headline price growth in October is projected to slow, partly due to lower energy prices, while core inflation measures are expected to remain near the upper limit of the Bank of Canada’s 1–3% inflation target range. Retail sales advanced estimates for September point to a contraction, which would continue the see-saw pattern of monthly declines then increases. Spending trends indicate that real personal spending growth in the latter half of 2025 should drift to a below-trend rate.
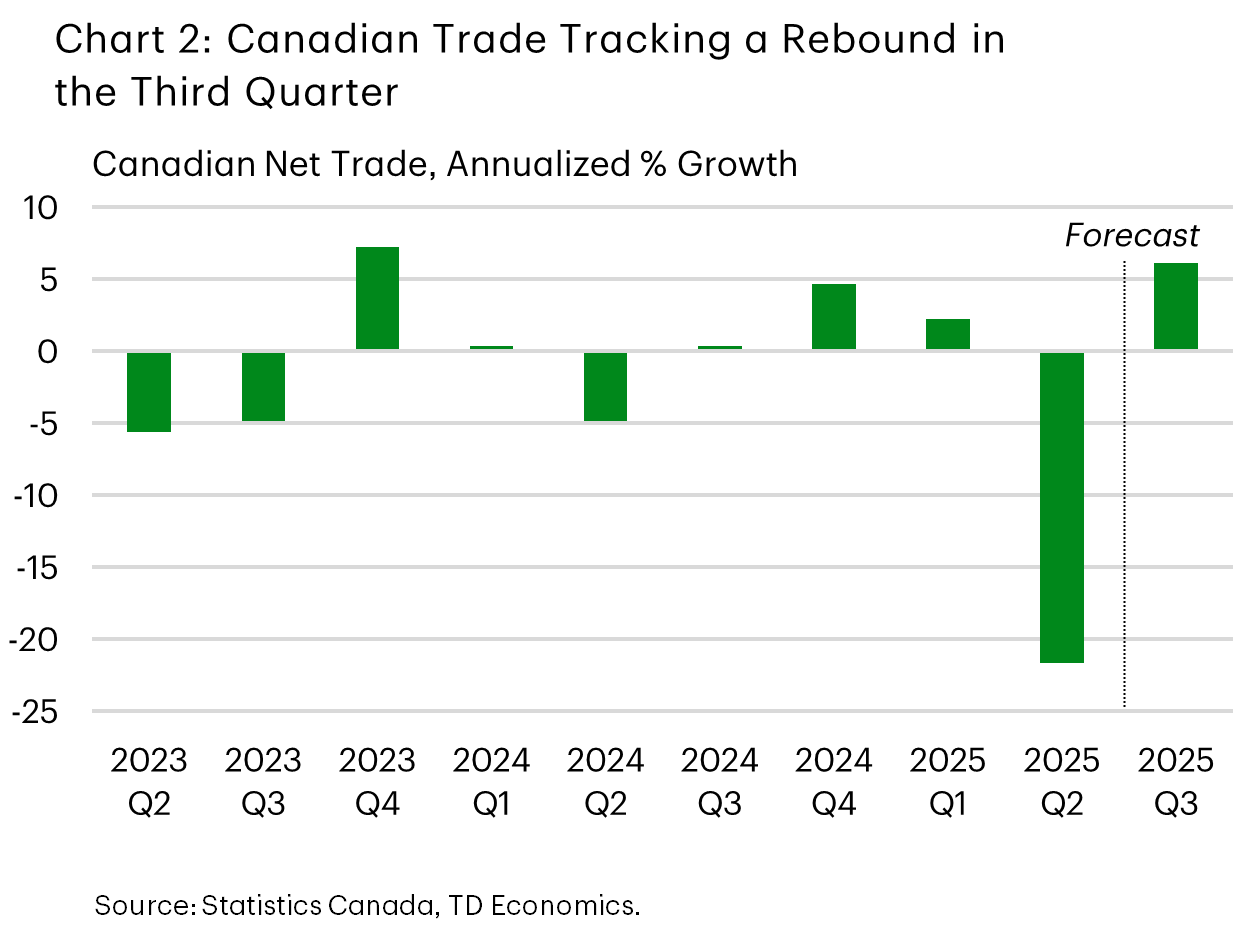
Further clarity about international trade developments in September is also expected soon, although the exact release date has not been announced. The U.S. government shutdown delayed Canada’s international trade releases as they rely on U.S. government sources. Unless there is a significant decline in exports for September, something we don’t expect, net trade is projected to contribute modestly to third-quarter GDP growth following a notably weak performance in the previous quarter (Chart 2).
The BoC’s next decision is on Dec. 10th, where it is widely expected to hold rates steady. With the policy rate at 2.25%, it is at the bottom end of its estimated neutral rate range and likely marks the end of their easing cycle. This week’s Summary of Deliberations highlighted that governing council believes it has done all it can to combat the impact from tariffs. The economy’s path from here, including the impact of the recent federal budget, will dictate the path forward. Should the economy continue to evolve in line with expectations, we don’t see a need for further interest rate cuts in the foreseeable future.
U.S. – Shutdown is Over, but Uncertainty to Linger Some More
The longest U.S. government shutdown in history ended this week after 43 days, bringing relief to federal workers and the broader economy. Yet, markets responded with caution. A series of Fed speeches offered little clarity on the Fed’s next move, with several officials appearing to favor a pause. Odds of a December rate cut have declined notably this week. Equities trended lower in the second half of the week, despite an uptick on Friday, with the tech-heavy Nasdaq faring worse.
Still, the end of the shutdown could be more of a temporary patch than a permanent fix. The deal includes full-year funding for only three out of 12 annual spending bills, with the rest funded only through January, leaving a real risk of a partial shutdown come February, especially if negotiations over Affordable Care Act subsidies falter. The full economic impact is uncertain, but the CBO estimates it could shave around 1.5 percentage points from fourth-quarter real GDP growth. We anticipate Q4 growth to slow to around 1%, down from a tracking of +3% in the third quarter.
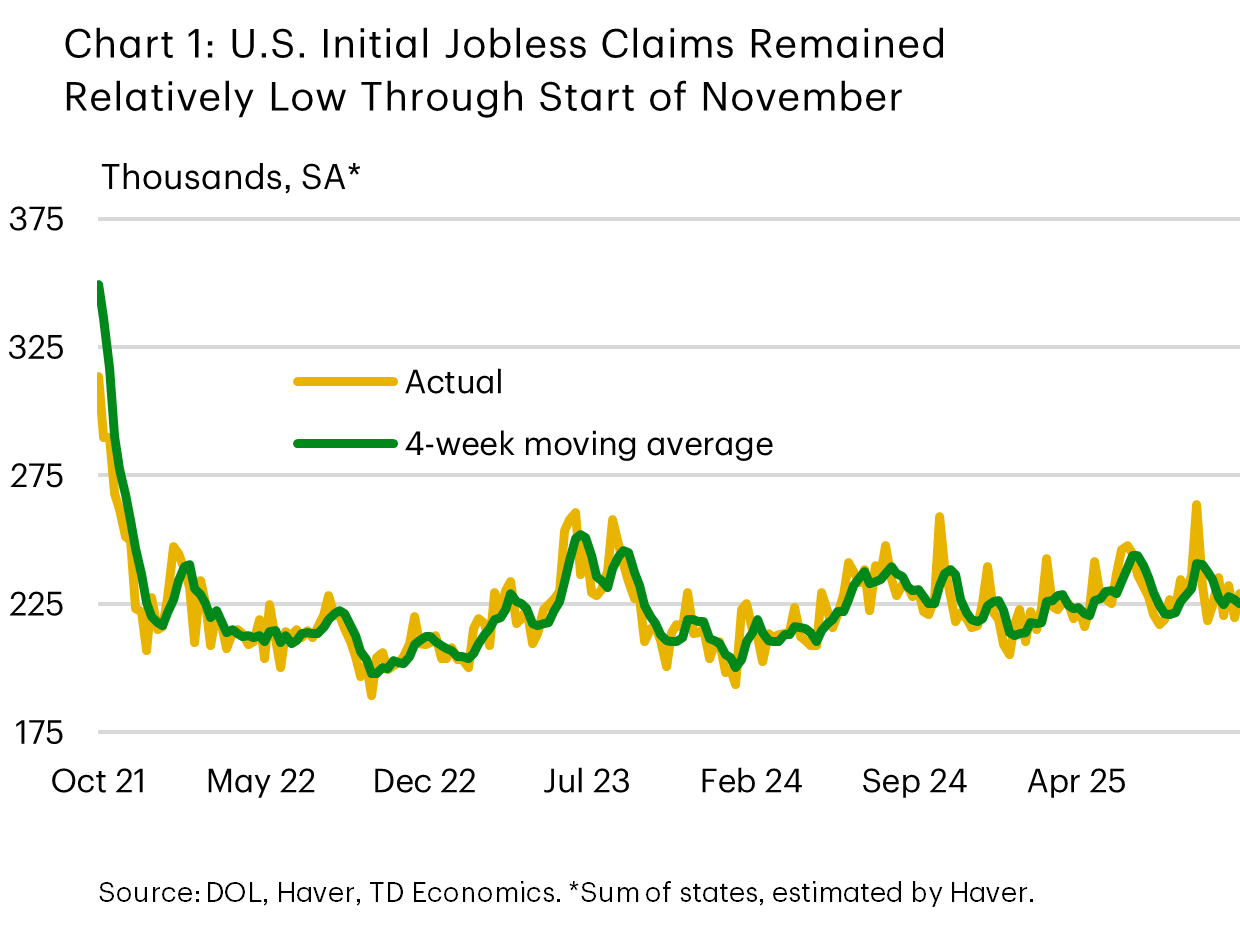
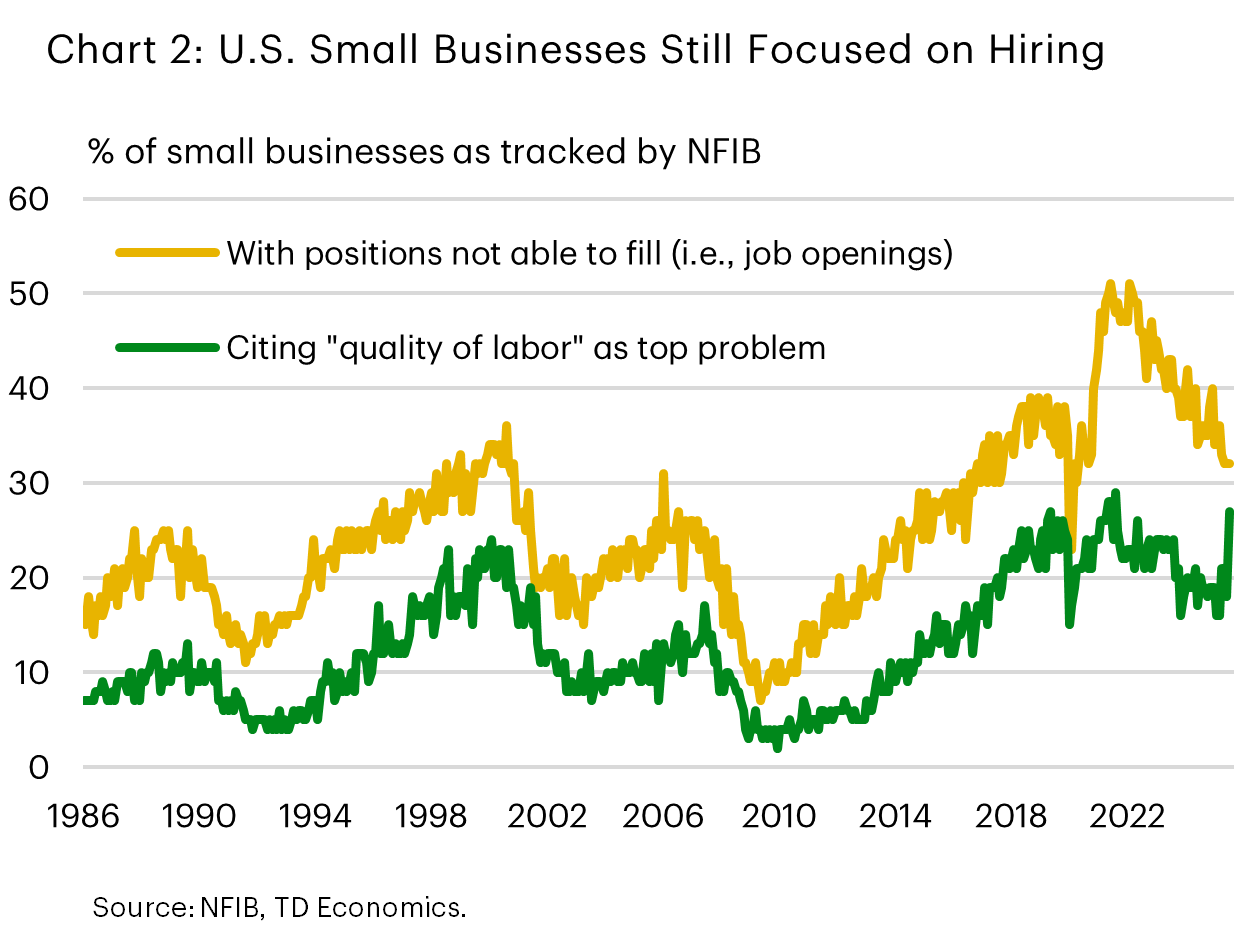
As departments like the Bureau of Labor Statistics (BLS) resume normal operations, delayed economic data should start to be released, but the revised schedule is unknown at time of writing. In the meantime, weekly initial jobless claims remain near recent levels (Chart 1). Small businesses also appear to be maintaining a hiring focus. The average change in employment for small firms did remain in shallow negative territory, but October small business employment indicators from the NFIB survey overall reinforced a “low hire, low fire” theme. Job openings are off pandemic highs, but remained in the upper range of historical norms in October (Chart 2). Meanwhile, the share of small firms citing “quality of labor” as their top problem surged to an all-time high of 27%, leaving concerns about taxes (16%) and inflation (12%) well behind.
We will soon find out how well the alternative data guided us through the shutdown. September’s job report would have been largely finished when the shut down began, and we expect it will be released next week. But, neither October’s Consumer Price Index (CPI) survey, nor the household survey portion of the employment report would have been conducted in the usual way with government workers off the job. The White House has said these reports are unlikely to be released. We don’t yet know if October data in both cases will be imputed from partial results or remain interpolations. The payrolls portion of the October jobs report is still likely to be released though. The lack of CPI for October will have knock on effects for other government data, like GDP, resulting in more estimation than usual.
All of these data disruptions mean the Fed is unlikely to have all the usual data it would ahead of it’s interest rate decision. Markets are currently putting coin flip odds that the lack of data will lead the FOMC to pause in December, rather than proceed in a data fog.
Weekly Economic & Financial Commentary: Fed on the Fence
Summary
United States: Fed on the Fence
- A wave of hawkish Federal Reserve commentary casting doubt on a December rate cut provided financial markets news to digest in the absence of any major economic data releases this week.
- Next week: Nonfarm Payrolls (Expected Tue. or Wed.), Existing Home Sales (Thu.)
International: Mixed Momentum in Global Activity
- This week’s data releases painted a mixed picture across major economies: The UK maintained modest Q3 growth with wage gains slowing, Australia’s labor market rebounded from last month’s weakness, while China’s activity data continued to soften.
- Next week: Japan GDP (Mon.), Canada CPI (Mon.), Eurozone PMIs (Fri.)
Topic of the Week: A Shutdown Solution at Last
- The longest government shutdown on record came to an end this week. With federal employees coming back to work in full force, the backlog of economic data should start to clear next week, but the impact on the U.S. data flow will reverberate for months to come.
Gold (XAU/USD) Price Forecast: Triangle Formation Shows Trader Indecision – Will $4,000 Hold?
Precious metals haven’t dodged the volatility bullet hitting markets throughout the morning session.
Bleak and brutal overnight trading has failed to attract flows into normally in-demand gold, even as risk sentiment deteriorates sharply.
An unusual positive correlation between the yellow metal and equities is adding confusion about where capital rotates when these outflows occur.
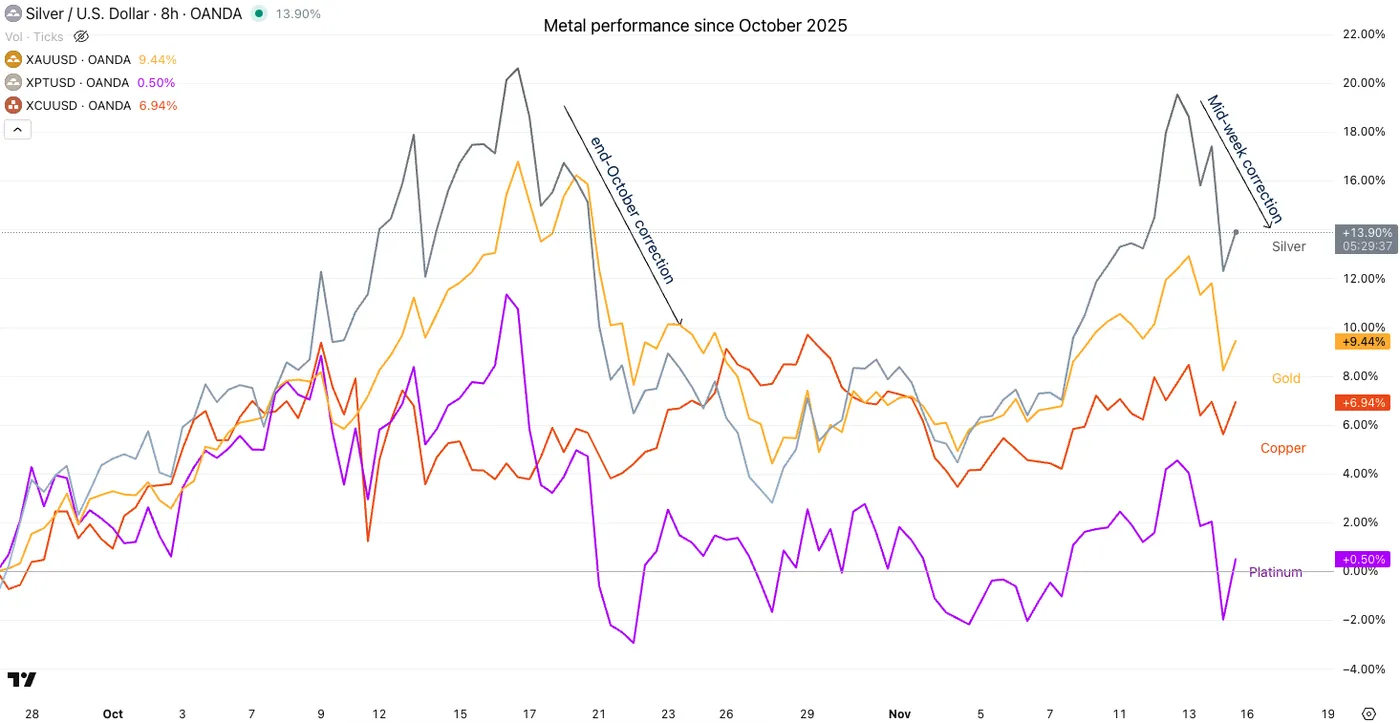
Metals performance since beginning October. November 14, 2025 – Source: TradingView
After dropping $150 at its morning lows, mean-reverting buyers dragged Gold prices back toward the $4,100 area, and are attempting to break through the psychological level.
With fresh volatility, lower highs are forming and the outlook is turning increasingly opaque.
So let’s dive into a multi-timeframe Gold analysis to see whether technical signals can help us determine where metal prices may be headed next.
Gold (XAU/USD) multi-timeframe technical analysis
Daily Chart
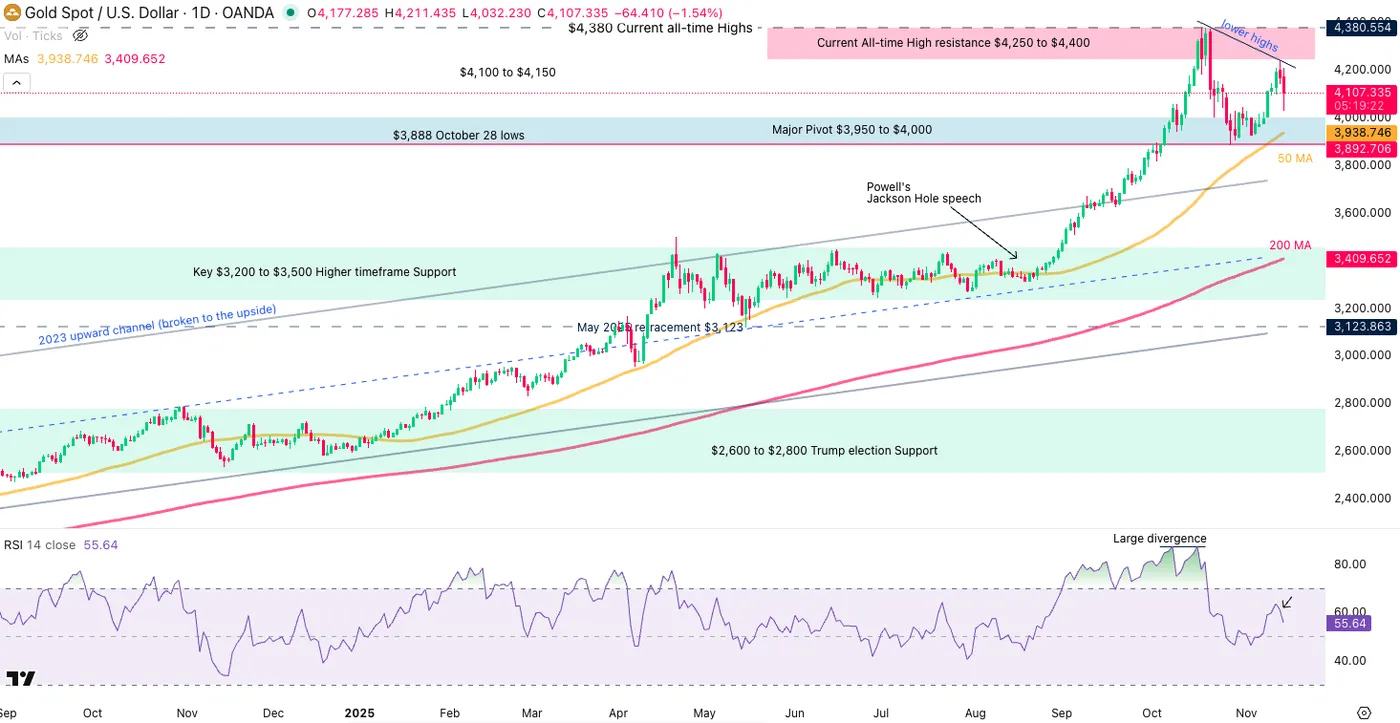
Gold (XAU/USD) Daily Chart. November 14, 2025 – Source: TradingView
After forming a gigantic bearish divergence at the end of last month, brutal outflows brought Gold well below the $4,000 mark.
Still, some strong dip-buying pushed the metal back higher as late-trend followers rushed for the "discounted prices".
But discounts can be traps in markets.
Sole performer during yesterday's bloody session, Gold found a top in a flash sale this morning, all the way to $4,030.
Now back above $4,100, the price action just looks more confusing on the Daily chart.
Long-wicked dojis like the one from today's action can put out trade setups:
- Look at what happens if bulls manage to retake the daily highs at $4,211 (trend continuation)
- Vice versa if bears bring the pair to new lows (especially below $4,000)
4H Chart and technical levels
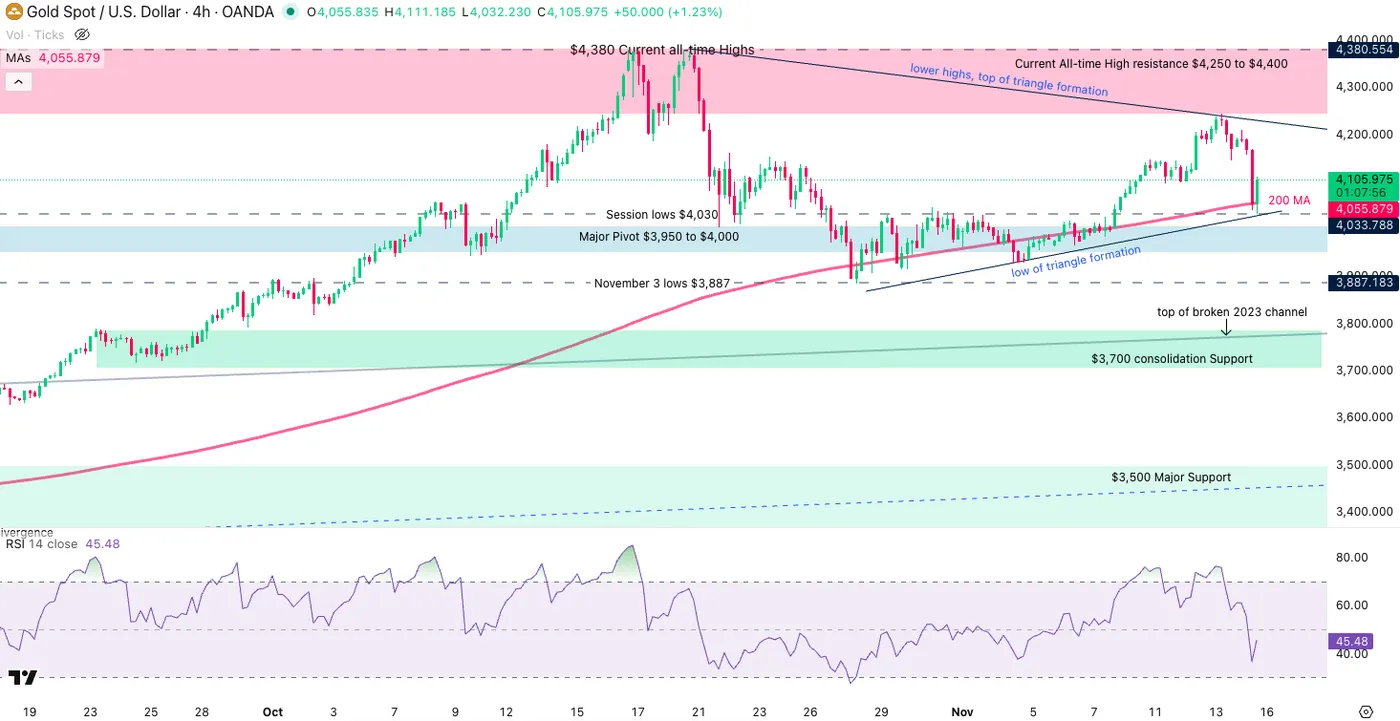
Gold (XAU/USD) 4H Chart. November 14, 2025 – Source: TradingView
Gold technical levels of interest:
Resistance Levels
- Current All-time High resistance $4,250 to $4,400 (ATH $4,380)
- Low of Resistance zone $4,250 and Triangle formation top
- Session highs $4,211
Support Levels
- 4H MA 200, Session and triangle formation lows: $4,030 to $4,050)
- Major Pivot $3,950 to $4,000
- $3,700 consolidation Support
- $3,500 Major Support
1H Chart
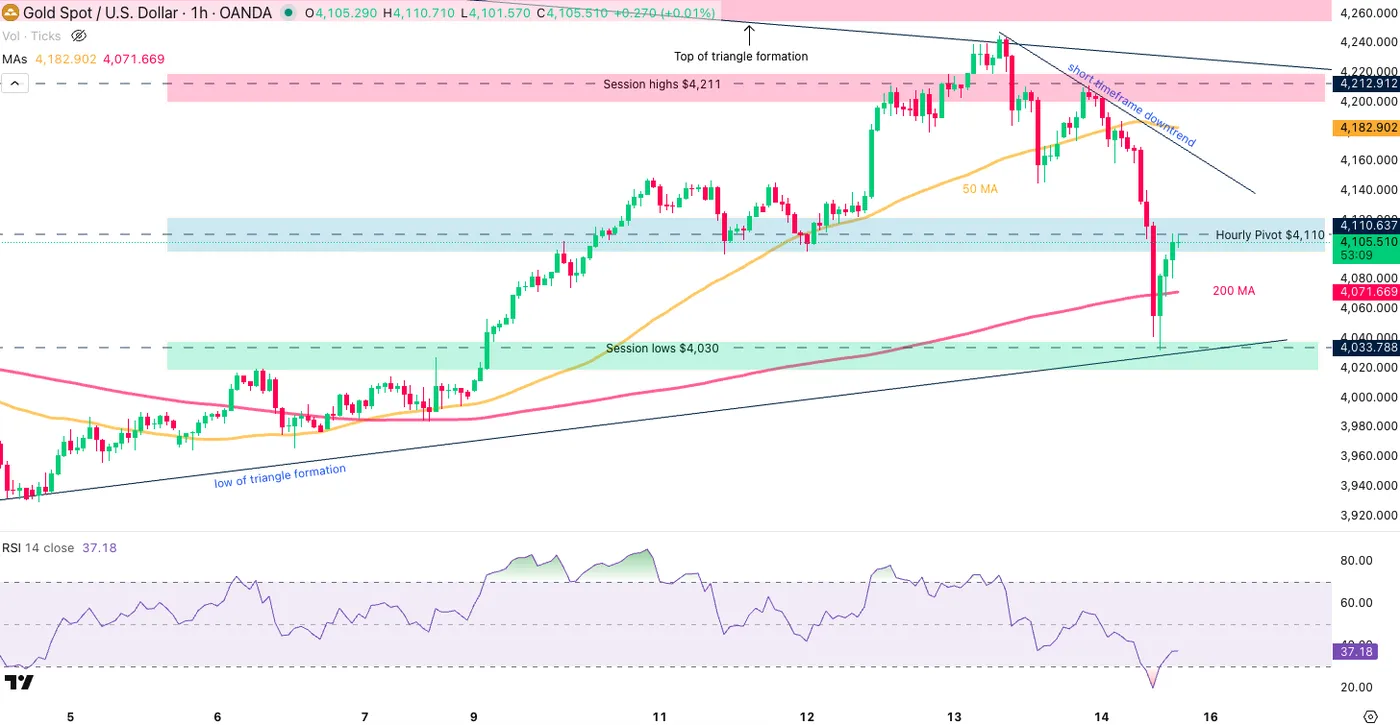
Gold (XAU/USD) 1H Chart. November 14, 2025 – Source: TradingView
It's a bull and bear battle in today's action, as expressed in the consolidation patterns seen through higher timeframes.
Buyers have broken the $4,100 but the momentum pivot stays around $4,110.
Closing above this level gives more odds for bull continuation towards the weekly close, while closing below the pivot gives back the hand to sellers.
Keep an eye on the triangle formation and watch the afternoon session closely to see if indecision follows or a side takes the wheel.
Safe Trades!
Bitcoin Drops Below $95,000 – Market Under Pressure as Investor Confidence Wanes
- Bitcoin plunges below $95,000, erasing nearly all 2025 gains amid rising market uncertainty and fading hopes for a Fed rate cut
- Massive outflows from Bitcoin ETFs and $1.3 billion in liquidated leveraged positions deepen the sell-off, highlighting weak market liquidity and investor anxiety
- Strategy Inc. under pressure, as its market value nears the worth of its BTC holdings; Michael Saylor announces new Bitcoin purchases and urges investors to “HODL."
On Friday, Bitcoin fell below the $95,000 mark, reaching $94,508 – its lowest level in about six months. Since hitting a record high of $126,251 in early October, the cryptocurrency has lost nearly 25% of its value. It is now dangerously close to erasing all gains made in 2025, with the year-end price of 2024 standing at $93,714.
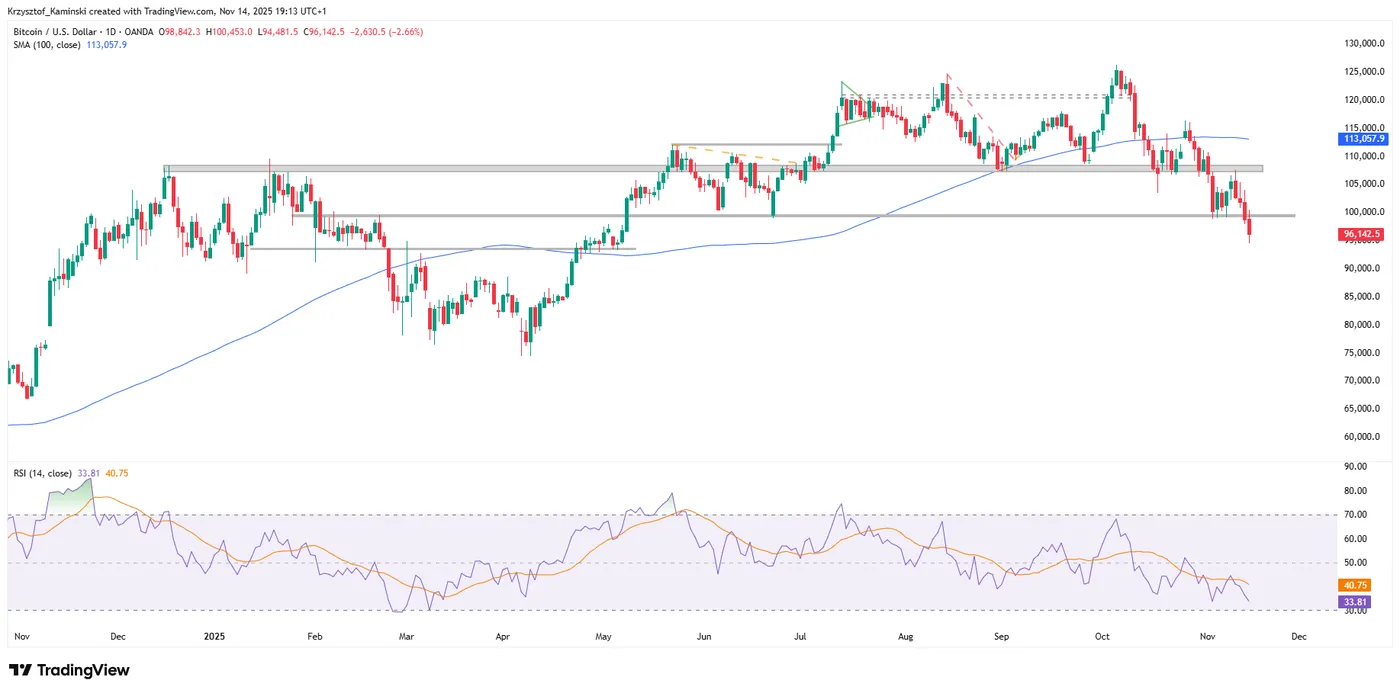
Bitcoin, daily timeframe, source:TradingView
Massive ETF Outflows and Leveraged Liquidations
One of the key drivers of the decline is the significant capital outflow from Bitcoin-based ETFs. On Thursday alone, approximately $870 million was withdrawn – the second-largest daily outflow since these instruments were launched. The market is still reeling from the mass liquidation on October 10, when around $19 billion in leveraged positions and over $1 trillion in total crypto market capitalization were wiped out. In the last 24 hours, another $1.3 billion in leveraged positions was liquidated, further intensifying selling pressure.
Macro Pressure and Weak Liquidity Worsen the Outlook
Bitcoin’s correction is closely linked to the broader sell-off in risk assets, particularly U.S. tech stocks. Investors are increasingly revising their expectations for the Federal Reserve’s monetary policy. Following recent hawkish remarks from Fed officials, hopes for a rate cut in December have significantly diminished.
Adding to the concern is the declining liquidity in the crypto market. Market depth – the ability of the market to absorb large orders without significant price movements – has dropped by around 30% compared to peak levels earlier this year. As a result, even moderate trade volumes can now lead to sharp price swings.
Strategy Inc. in Focus as Michael Saylor Steps In
Strategy Inc., one of the largest corporate holders of Bitcoin, has also come under pressure. Its stock around 2%, raising concerns that its market value could dip below the value of its BTC holdings (approximately $61 billion). The company’s total enterprise value, including debt and preferred equity, currently stands at $74.8 billion.
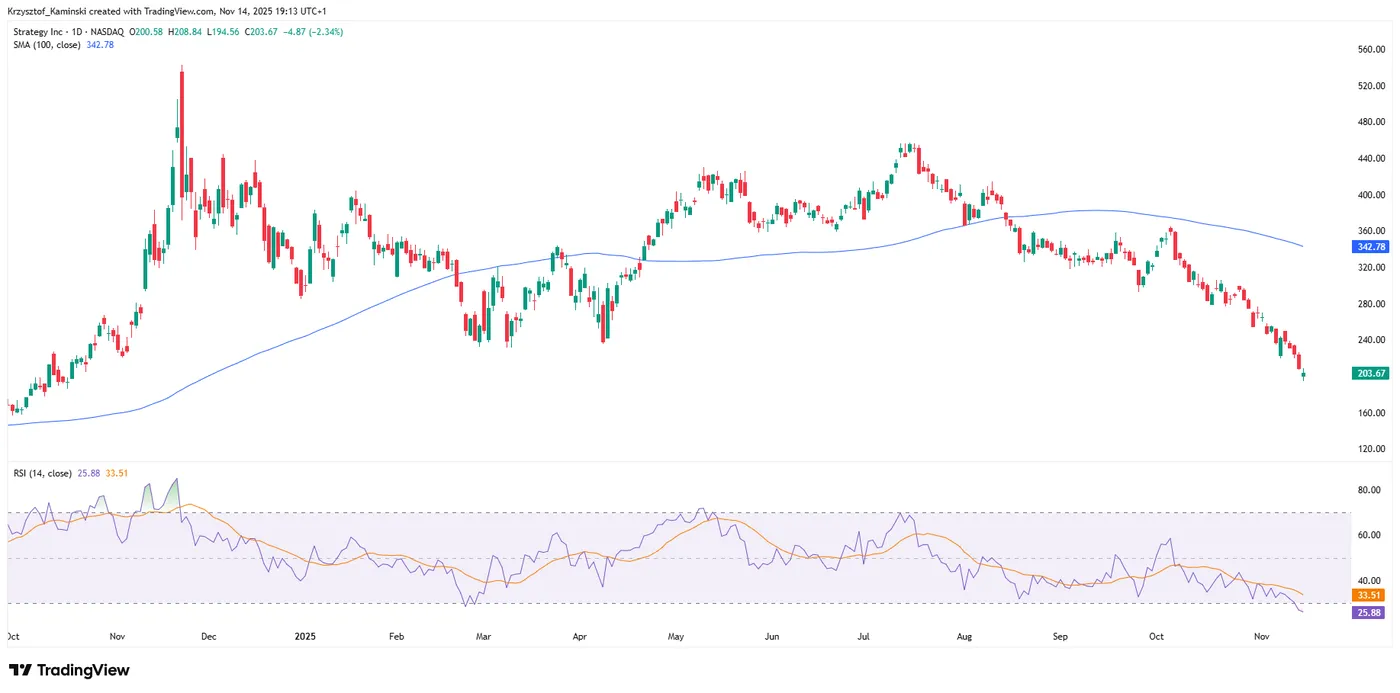
Strategy Inc. , daily timeframe, source: TradingView
Michael Saylor, Strategy’s co-founder, announced that the firm is “buying a lot” of Bitcoin and promised to reveal more details on Monday. He also urged investors to “HODL” – a call to hold on to their Bitcoin despite the ongoing downturn.
The current environment for Bitcoin remains highly volatile and uncertain. The next few trading sessions could be critical in determining whether this is merely a short-term correction or the beginning of a deeper bearish trend.
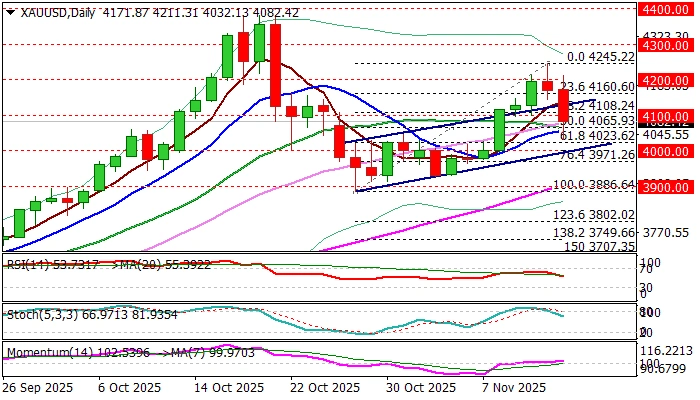
XAU/USD: Gold Falls Sharply on Further Cooling of Fed Dec Rate Cut Expectations
Gold lost ground on Friday and fell over 3% following more hawkish tones from Fed policymakers that further dropped bets for December rate cut (below 50%, compared to 80% on Thursday and over 90% just a couple of days ago).
FOMC members argued their stance by increased concerns about inflation and relatively stable situation in the labor market, although still lacking the full information, as delayed economic reports are to be released.
Quick drop below several key supports neutralized expectations for a healthy correction (dips to be contained by broken Fibo 50% / broken upper bull channel boundary at $4134) and soured the sentiment.
Near-term focus shifted lower after pullback from Thursday’s recovery peak ($4245) retraced nearly 61.8% of $3886/$4245 upleg, on dip to the session low at $4032 (that also exposed $4000 support (psychological / bull-channel lower boundary
However, hopes of fresh recovery are still alive due to quick bounce and supported by still bullishly aligned daily studies (positive momentum and MA’s in bullish configuration (converging 10/20DMA on track to form bull-cross).
Return and close above $4100 zone is minimum requirement to keep recovery hopes in play, with extension above bull-channel upper boundary ($4131) to validate fresh bullish signal.
Gold’s performance in the near future will depend on the incoming US economic data which will shape Fed’s stance on interest rates.
Res: 4100; 4108; 4131; 4160; 4200
Sup: 4065; 4032; 4038; 4023; 4000
Summary 11/17 – 11/21
Monday, Nov 17, 2025
| GMT | Ccy | Events | Consensus | Previous |
|---|---|---|---|---|
| 21:30 | NZD | Business NZ PSI Oct | 48.3 | |
| 23:50 | JPY | GDP Q/Q Q3 P | -0.60% | 0.50% |
| 23:50 | JPY | GDP Deflator Y/Y Q3 P | 3.10% | 2.90% |
| 04:30 | JPY | Industrial Production M/M Sep F | 2.20% | 2.20% |
| 10:00 | EUR | EU Economic Forecasts | ||
| 13:30 | CAD | CPI M/M Oct | 0.20% | 0.10% |
| 13:30 | CAD | CPI Y/Y Oct | 2.40% | |
| 13:30 | CAD | CPI Median Y/Y Oct | 3.10% | 3.20% |
| 13:30 | CAD | CPI Trimmed Y/Y Oct | 3.00% | 3.10% |
| 13:30 | CAD | CPI Common Y/Y Oct | 2.80% | 2.70% |
| GMT | Ccy | Events | |
|---|---|---|---|
| 21:30 | NZD | Business NZ PSI Oct | |
| Forecast: | Previous: 48.3 | ||
| 23:50 | JPY | GDP Q/Q Q3 P | |
| Forecast: -0.60% | Previous: 0.50% | ||
| 23:50 | JPY | GDP Deflator Y/Y Q3 P | |
| Forecast: 3.10% | Previous: 2.90% | ||
| 04:30 | JPY | Industrial Production M/M Sep F | |
| Forecast: 2.20% | Previous: 2.20% | ||
| 10:00 | EUR | EU Economic Forecasts | |
| Forecast: | Previous: | ||
| 13:30 | CAD | CPI M/M Oct | |
| Forecast: 0.20% | Previous: 0.10% | ||
| 13:30 | CAD | CPI Y/Y Oct | |
| Forecast: | Previous: 2.40% | ||
| 13:30 | CAD | CPI Median Y/Y Oct | |
| Forecast: 3.10% | Previous: 3.20% | ||
| 13:30 | CAD | CPI Trimmed Y/Y Oct | |
| Forecast: 3.00% | Previous: 3.10% | ||
| 13:30 | CAD | CPI Common Y/Y Oct | |
| Forecast: 2.80% | Previous: 2.70% | ||
Tuesday, Nov 18, 2025
| GMT | Ccy | Events | Consensus | Previous |
|---|---|---|---|---|
| 00:30 | AUD | RBA Meeting Minutes | ||
| 13:30 | USD | Import Price Index M/M Oct | 0.30% | |
| 14:15 | USD | Industrial Production M/M Oct | 0.10% | |
| 14:15 | USD | Capacity Utilization Oct | 77.30% | 77.40% |
| 15:00 | USD | NAHB Housing Market Index Nov | 36 | 37 |
| 21:45 | NZD | PPI Input Q/Q Q3 | 0.60% | |
| 21:45 | NZD | PPI Output Q/Q Q3 | 0.60% | |
| 23:50 | JPY | Trade Balance (JPY) Oct | -0.13T | -0.31T |
| 23:50 | JPY | Machinery Orders M/M Sep | 2.50% | -0.90% |
| 23:50 | JPY | Machinery Orders Y/Y Sep | 5.40% | 1.60% |
| GMT | Ccy | Events | |
|---|---|---|---|
| 00:30 | AUD | RBA Meeting Minutes | |
| Forecast: | Previous: | ||
| 13:30 | USD | Import Price Index M/M Oct | |
| Forecast: | Previous: 0.30% | ||
| 14:15 | USD | Industrial Production M/M Oct | |
| Forecast: | Previous: 0.10% | ||
| 14:15 | USD | Capacity Utilization Oct | |
| Forecast: 77.30% | Previous: 77.40% | ||
| 15:00 | USD | NAHB Housing Market Index Nov | |
| Forecast: 36 | Previous: 37 | ||
| 21:45 | NZD | PPI Input Q/Q Q3 | |
| Forecast: | Previous: 0.60% | ||
| 21:45 | NZD | PPI Output Q/Q Q3 | |
| Forecast: | Previous: 0.60% | ||
| 23:50 | JPY | Trade Balance (JPY) Oct | |
| Forecast: -0.13T | Previous: -0.31T | ||
| 23:50 | JPY | Machinery Orders M/M Sep | |
| Forecast: 2.50% | Previous: -0.90% | ||
| 23:50 | JPY | Machinery Orders Y/Y Sep | |
| Forecast: 5.40% | Previous: 1.60% | ||
Wednesday, Nov 19, 2025
| GMT | Ccy | Events | Consensus | Previous |
|---|---|---|---|---|
| 00:00 | AUD | Westpac Leading Index M/M Oct | -0.03% | |
| 00:30 | AUD | Wage Price Index Q/Q Q3 | 0.80% | 0.80% |
| 07:00 | GBP | CPI M/M Oct | 0.00% | |
| 07:00 | GBP | CPI Y/Y Oct | 3.60% | 3.80% |
| 07:00 | GBP | Core CPI Y/Y Oct | 3.40% | 3.50% |
| 07:00 | GBP | RPI M/M Oct | -0.40% | |
| 07:00 | GBP | RPI Y/Y Oct | 4.30% | 4.50% |
| 07:00 | GBP | PPI Input M/M Oct | -0.10% | |
| 07:00 | GBP | PPI Input Y/ YOct | 0.80% | |
| 07:00 | GBP | PPI Output M/M Oct | 0% | |
| 07:00 | GBP | PPI Output Y/Y Oct | 3.40% | |
| 07:00 | GBP | PPI Core Output M/M Oct | 0% | |
| 07:00 | GBP | PPI Core Output Y/Y Oct | 3.60% | |
| 09:00 | EUR | Eurozone Current Account (EUR) Sep | 14.5B | 11.9B |
| 10:00 | EUR | Eurozone CPI Y/Y Oct F | 2.10% | 2.10% |
| 10:00 | EUR | Eurozone Core CPI Y/Y Oct F | 2.40% | 2.40% |
| 13:30 | USD | Building Permits Oct | 1.312M | |
| 13:30 | USD | Housing Starts Oct | 1.307M | |
| 15:30 | USD | Crude Oil Inventories (Nov 14) | 6.4M | |
| 19:00 | USD | FOMC Minutes |
| GMT | Ccy | Events | |
|---|---|---|---|
| 00:00 | AUD | Westpac Leading Index M/M Oct | |
| Forecast: | Previous: -0.03% | ||
| 00:30 | AUD | Wage Price Index Q/Q Q3 | |
| Forecast: 0.80% | Previous: 0.80% | ||
| 07:00 | GBP | CPI M/M Oct | |
| Forecast: | Previous: 0.00% | ||
| 07:00 | GBP | CPI Y/Y Oct | |
| Forecast: 3.60% | Previous: 3.80% | ||
| 07:00 | GBP | Core CPI Y/Y Oct | |
| Forecast: 3.40% | Previous: 3.50% | ||
| 07:00 | GBP | RPI M/M Oct | |
| Forecast: | Previous: -0.40% | ||
| 07:00 | GBP | RPI Y/Y Oct | |
| Forecast: 4.30% | Previous: 4.50% | ||
| 07:00 | GBP | PPI Input M/M Oct | |
| Forecast: | Previous: -0.10% | ||
| 07:00 | GBP | PPI Input Y/ YOct | |
| Forecast: | Previous: 0.80% | ||
| 07:00 | GBP | PPI Output M/M Oct | |
| Forecast: | Previous: 0% | ||
| 07:00 | GBP | PPI Output Y/Y Oct | |
| Forecast: | Previous: 3.40% | ||
| 07:00 | GBP | PPI Core Output M/M Oct | |
| Forecast: | Previous: 0% | ||
| 07:00 | GBP | PPI Core Output Y/Y Oct | |
| Forecast: | Previous: 3.60% | ||
| 09:00 | EUR | Eurozone Current Account (EUR) Sep | |
| Forecast: 14.5B | Previous: 11.9B | ||
| 10:00 | EUR | Eurozone CPI Y/Y Oct F | |
| Forecast: 2.10% | Previous: 2.10% | ||
| 10:00 | EUR | Eurozone Core CPI Y/Y Oct F | |
| Forecast: 2.40% | Previous: 2.40% | ||
| 13:30 | USD | Building Permits Oct | |
| Forecast: | Previous: 1.312M | ||
| 13:30 | USD | Housing Starts Oct | |
| Forecast: | Previous: 1.307M | ||
| 15:30 | USD | Crude Oil Inventories (Nov 14) | |
| Forecast: | Previous: 6.4M | ||
| 19:00 | USD | FOMC Minutes | |
| Forecast: | Previous: | ||
Thursday, Nov 20, 2025
| GMT | Ccy | Events | Consensus | Previous |
|---|---|---|---|---|
| 01:15 | CNY | 1-Y Loan Prime Rate | 3.00% | 3.00% |
| 01:15 | CNY | 5-Y Loan Prime Rate | 3.50% | 3.50% |
| 07:00 | CHF | Trade Balance (CHF) Oct | 4.90B | 4.07B |
| 07:00 | EUR | Germany PPI M/M Oct | 0.00% | -0.10% |
| 07:00 | EUR | Germany PPI Y/Y Oct | -1.70% | |
| 13:30 | CAD | Industrial Product Price M/M Oct | 0.80% | |
| 13:30 | CAD | Raw Material Price Index Oct | 1.70% | |
| 13:30 | USD | Initial Jobless Claims | ||
| 13:30 | USD | Philadelphia Fed Manufacturing Nov | -1.4 | -12.8 |
| 15:00 | USD | Existing Home Sales Oct | 4.06M | 4.06M |
| 15:00 | USD | Existing Home Sales Change M/M Oct | 1.50% | |
| 15:00 | EUR | Eurozone Consumer Confidence Nov P | -14 | |
| 15:30 | USD | Natural Gas Storage (Nov 14) | ||
| 21:45 | NZD | Trade Balance (NZD) Oct | 1355M | |
| 22:00 | AUD | Manufacturing PMI Nov P | 49.7 | |
| 22:00 | AUD | Services PMI Nov P | 52.5 | |
| 23:30 | JPY | National CPI Y/Y Oct | 2.90% | |
| 23:30 | JPY | National CPI Core Y/Y Oct | 3.00% | 2.90% |
| 23:30 | JPY | National CPI Core-Core Y/Y Oct | 3% |
| GMT | Ccy | Events | |
|---|---|---|---|
| 01:15 | CNY | 1-Y Loan Prime Rate | |
| Forecast: 3.00% | Previous: 3.00% | ||
| 01:15 | CNY | 5-Y Loan Prime Rate | |
| Forecast: 3.50% | Previous: 3.50% | ||
| 07:00 | CHF | Trade Balance (CHF) Oct | |
| Forecast: 4.90B | Previous: 4.07B | ||
| 07:00 | EUR | Germany PPI M/M Oct | |
| Forecast: 0.00% | Previous: -0.10% | ||
| 07:00 | EUR | Germany PPI Y/Y Oct | |
| Forecast: | Previous: -1.70% | ||
| 13:30 | CAD | Industrial Product Price M/M Oct | |
| Forecast: | Previous: 0.80% | ||
| 13:30 | CAD | Raw Material Price Index Oct | |
| Forecast: | Previous: 1.70% | ||
| 13:30 | USD | Initial Jobless Claims | |
| Forecast: | Previous: | ||
| 13:30 | USD | Philadelphia Fed Manufacturing Nov | |
| Forecast: -1.4 | Previous: -12.8 | ||
| 15:00 | USD | Existing Home Sales Oct | |
| Forecast: 4.06M | Previous: 4.06M | ||
| 15:00 | USD | Existing Home Sales Change M/M Oct | |
| Forecast: | Previous: 1.50% | ||
| 15:00 | EUR | Eurozone Consumer Confidence Nov P | |
| Forecast: | Previous: -14 | ||
| 15:30 | USD | Natural Gas Storage (Nov 14) | |
| Forecast: | Previous: | ||
| 21:45 | NZD | Trade Balance (NZD) Oct | |
| Forecast: | Previous: 1355M | ||
| 22:00 | AUD | Manufacturing PMI Nov P | |
| Forecast: | Previous: 49.7 | ||
| 22:00 | AUD | Services PMI Nov P | |
| Forecast: | Previous: 52.5 | ||
| 23:30 | JPY | National CPI Y/Y Oct | |
| Forecast: | Previous: 2.90% | ||
| 23:30 | JPY | National CPI Core Y/Y Oct | |
| Forecast: 3.00% | Previous: 2.90% | ||
| 23:30 | JPY | National CPI Core-Core Y/Y Oct | |
| Forecast: | Previous: 3% | ||
Friday, Nov 21, 2025
| GMT | Ccy | Events | Consensus | Previous |
|---|---|---|---|---|
| 00:01 | GBP | GfK Consumer Confidence Nov | -18 | -17 |
| 00:30 | JPY | Manufacturing PMI Nov P | 48.2 | |
| 00:30 | JPY | Services PMI Nov P | 53.1 | |
| 07:00 | GBP | Retail Sales M/M Oct | 0.10% | 0.50% |
| 07:00 | GBP | Public Sector Net Borrowing (GBP) Oct | 15.2B | 20.2B |
| 08:15 | EUR | France Manufacturing PMI Nov P | 49 | 48.8 |
| 08:15 | EUR | France Services PMI Nov P | 48.6 | 48 |
| 08:30 | EUR | Germany Manufacturing PMI Nov P | 49.8 | 49.6 |
| 08:30 | EUR | Germany Services PMI Nov P | 54 | 54.6 |
| 09:00 | EUR | Eurozone Manufacturing PMI Nov P | 50.2 | 50 |
| 09:00 | EUR | Eurozone Services PMI Nov P | 53 | 53 |
| 09:30 | GBP | Manufacturing PMI Nov P | 49.3 | 49.7 |
| 09:30 | GBP | Services PMI Nov P | 52 | 52.3 |
| 13:30 | CAD | New Housing Price Index M/M Oct | 0.00% | -0.20% |
| 13:30 | CAD | Retail Sales M/M Sep | -0.70% | 1.00% |
| 13:30 | CAD | Retail Sales ex Autos M/M Sep | -0.30% | 0.70% |
| 14:45 | USD | Manufacturing PMI Nov P | 52.5 | |
| 14:45 | USD | Services PMI Nov P | 54.8 | |
| 15:00 | USD | UoM Consumer Sentiment Nov F | 50.3 | 50.3 |
| 15:00 | USD | UoM 1-Yr Inflation Expectations Nov F | 4.70% | 4.70% |
| GMT | Ccy | Events | |
|---|---|---|---|
| 00:01 | GBP | GfK Consumer Confidence Nov | |
| Forecast: -18 | Previous: -17 | ||
| 00:30 | JPY | Manufacturing PMI Nov P | |
| Forecast: | Previous: 48.2 | ||
| 00:30 | JPY | Services PMI Nov P | |
| Forecast: | Previous: 53.1 | ||
| 07:00 | GBP | Retail Sales M/M Oct | |
| Forecast: 0.10% | Previous: 0.50% | ||
| 07:00 | GBP | Public Sector Net Borrowing (GBP) Oct | |
| Forecast: 15.2B | Previous: 20.2B | ||
| 08:15 | EUR | France Manufacturing PMI Nov P | |
| Forecast: 49 | Previous: 48.8 | ||
| 08:15 | EUR | France Services PMI Nov P | |
| Forecast: 48.6 | Previous: 48 | ||
| 08:30 | EUR | Germany Manufacturing PMI Nov P | |
| Forecast: 49.8 | Previous: 49.6 | ||
| 08:30 | EUR | Germany Services PMI Nov P | |
| Forecast: 54 | Previous: 54.6 | ||
| 09:00 | EUR | Eurozone Manufacturing PMI Nov P | |
| Forecast: 50.2 | Previous: 50 | ||
| 09:00 | EUR | Eurozone Services PMI Nov P | |
| Forecast: 53 | Previous: 53 | ||
| 09:30 | GBP | Manufacturing PMI Nov P | |
| Forecast: 49.3 | Previous: 49.7 | ||
| 09:30 | GBP | Services PMI Nov P | |
| Forecast: 52 | Previous: 52.3 | ||
| 13:30 | CAD | New Housing Price Index M/M Oct | |
| Forecast: 0.00% | Previous: -0.20% | ||
| 13:30 | CAD | Retail Sales M/M Sep | |
| Forecast: -0.70% | Previous: 1.00% | ||
| 13:30 | CAD | Retail Sales ex Autos M/M Sep | |
| Forecast: -0.30% | Previous: 0.70% | ||
| 14:45 | USD | Manufacturing PMI Nov P | |
| Forecast: | Previous: 52.5 | ||
| 14:45 | USD | Services PMI Nov P | |
| Forecast: | Previous: 54.8 | ||
| 15:00 | USD | UoM Consumer Sentiment Nov F | |
| Forecast: 50.3 | Previous: 50.3 | ||
| 15:00 | USD | UoM 1-Yr Inflation Expectations Nov F | |
| Forecast: 4.70% | Previous: 4.70% | ||
Week Ahead: US Schedule Awaited – Fed Minutes, CPI and Flash PMI on Tap
- Canada, Japan and the UK to publish CPI data, but not the US.
- US October jobs and inflation reports may never get released.
- New release schedule likely; FOMC minutes eyed in meantime.
- Flash PMIs to be watched amid renewed economic worries.
US government reopens: All eyes on revised schedule
The US government shutdown finally came to an end on Wednesday after 43 days, raising hopes that it won’t be long before the data blackout is also over. It is very likely that the various statistics agencies such as the Bureau of Labor Statistics and the Bureau of Economic Analysis will publish updated release schedules at the start of the week. But when the delayed data will start rolling again is yet to be determined.
Quite possibly, the September jobs report will be the first to see the day of light, maybe as early as the end of next week, as it’s thought that the data was already compiled before the government shut down. The same was true for the CPI report, which was the only exception by the BLS, prioritizing its release in late October.
Risk of no October data
However, there are doubts about the October data. The BLS may decide to forgo both the October payrolls and inflation figures to focus on the November data, as even then, they might have to be delayed slightly. Then there’s the question mark about whether it’s going to be possible to backfill the October numbers in the November or future reports.
For example, it would be very difficult for the BLS to collect data for the October CPI and unemployment rate, which is calculated from the household survey, when the month has already elapsed. Though, it might still be possible to backfill the nonfarm payrolls reading, which is prepared from the establishment survey.
A growing list of overdue releases
Investors will also want to learn how soon the initial jobless claims will return to the weekly agenda, as well as the schedule for the delayed October retail sales and PCE inflation, and Q3 GDP reports.
Any complications in the resumption of these key publications could weigh on expectations of Fed rate cuts, as it would provide the hawks with an excuse to stay on hold until there is a fuller picture on the US economy, following Chair Powell’s ‘driving in the fog’ remark.
Hence, the US dollar is more likely to go into consolidation than to extend its pullback in the coming week, while any positive data surprises could revive the bulls.
Fed minutes and flash PMIs are the scheduled highlights
In terms of the regular releases, the New York Fed's and Philadelphia Fed’s manufacturing surveys are out on Monday and Thursday, respectively, while S&P Global’s flash PMIs for November due on Friday will be vital for filling in the gaps.
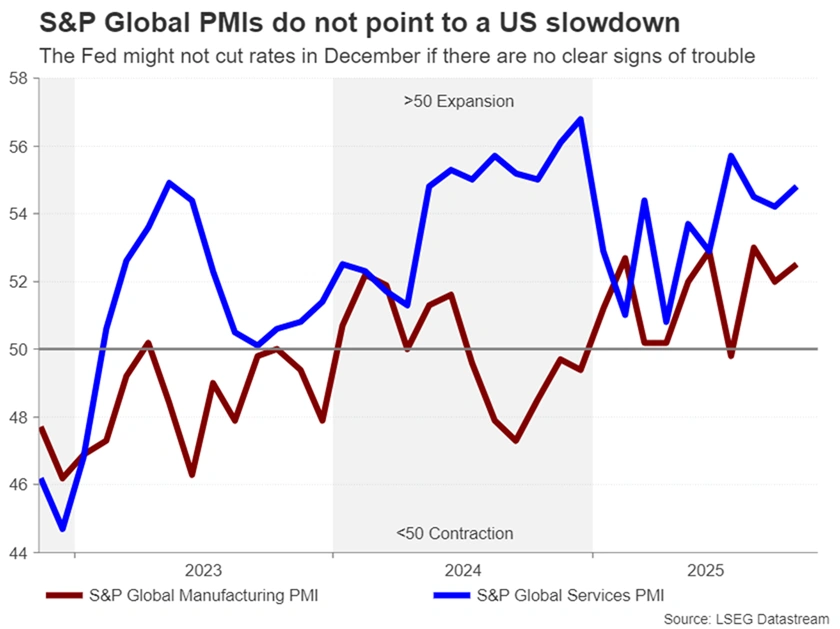
With the markets’ rate cut expectations not currently aligned with the Fed’s own outlook, the dollar will be sensitive to any indications that the US economy is either slowing sharply or that the recent soft jobs readings were a false flag. On the other hand, if the PMIs continue to point to stagflationary conditions, this would knock sentiment as well as the dollar.
Also on next week’s agenda are the minutes of the Fed’s October policy meeting. Most Fed policymakers have already expressed their views since that meeting, so the minutes are not anticipated to spur much reaction. Nevertheless, should the divisions among FOMC members appear to be widening, this could cast a fresh cloud of uncertainty over the rate path.
Will UK CPI boost BoE rate cut bets?
Across the pond, there is a bit more certainty surrounding the odds of the Bank of England cutting rates in December. Only a few weeks ago, many investors were not anticipating further UK rate reductions before spring 2026. But the last CPI report was a game-changer, as it eased fears of inflation spiking above 4.0%. With employment and GDP figures also coming in below expectations in the past week, traders have upped their bets of a 25-bps cut in December to about 80%.
The spotlight now firmly lies on next week’s CPI prints for October, and to a lesser extent, the November 26 budget. Headline inflation remained unchanged at 3.8% y/y in September, while core CPI dipped to 3.5% y/y. A further moderation in Wednesday’s October update would cement expectations that the BoE will trim rates next month, likely pressuring the pound.
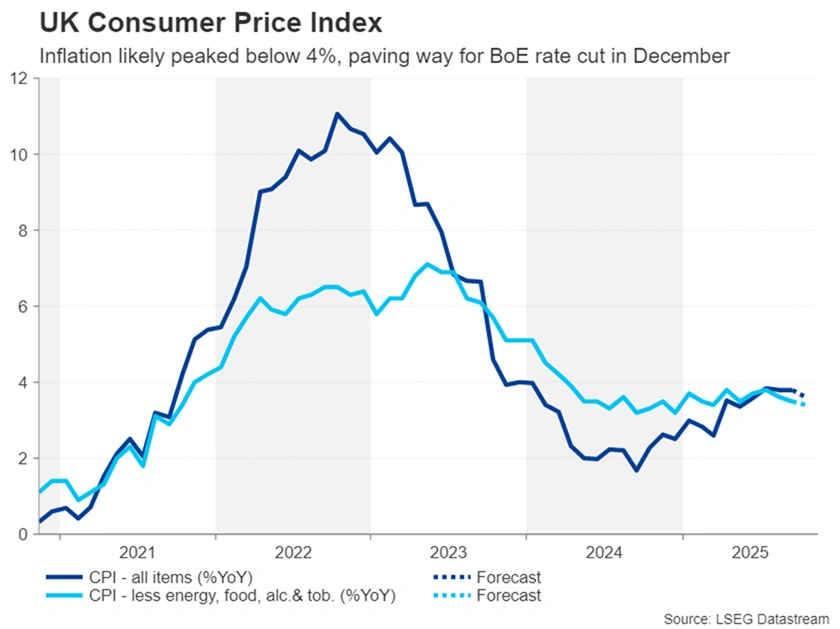
However, there might be some support for sterling on Friday should the October retail sales numbers and flash PMIs for November suggest there is still some momentum in the UK economy.
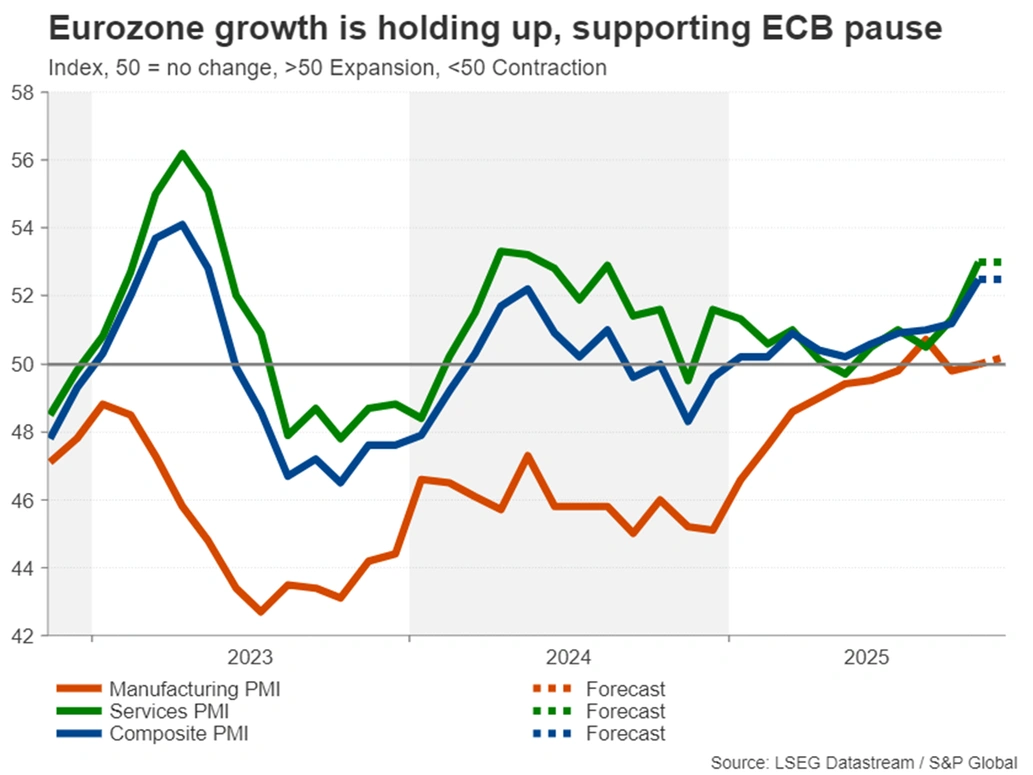
Eurozone PMIs to pose no threat to ECB pause
The flash PMIs will be the primary data point for the euro area. The recent PMI and GDP readings out of the Eurozone have been surprisingly solid, bolstering the view that the European Central Bank is done cutting rates.
Friday’s preliminary PMIs for November are unlikely to change much regarding the rate outlook. Yet any further improvement in economic activity, particularly if both the manufacturing and services gauges hold above 50, could give the euro a small leg up against the US dollar.
Ahead of the PMIs, the final estimates of October CPI are due on Wednesday.
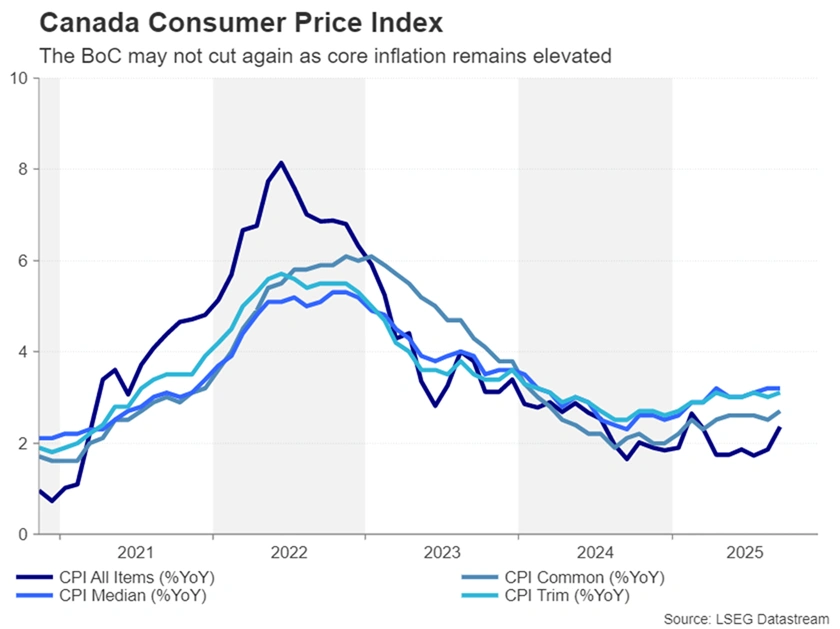
Will Canadian CPI thwart the Loonie’s rebound?
The Bank of Canada may soon join the ECB in going on pause. Although the central bank lowered rates at its last policy meeting, the tone from Governor Tiff Macklem was unusually neutral.
Employment numbers for October supported Macklem’s comment that interest rates are “about the right level”, as Canada’s labour market added more than 60k jobs for the second straight month.
Investors see just a one-third probability of one more rate cut by the BoC over the next year and Monday’s CPI data for October is unlikely to move the needle much. And with the Canadian dollar posting a decent rebound over the past week, any upside surprises in inflation could worsen dollar/loonie’s pullback.
Busy week looms for the Yen
In Japan, consistently above 2.0% inflation has not been enough to convince the Bank of Japan to hike interest rates aggressively. Policymakers continue to fret that wages are not yet growing sustainably fast enough to keep inflation around 2.0%. The new government seems to agree and Prime Minister Sanae Takaichi has openly called on the BoJ to prioritize growth, questioning whether Japan has truly exited deflation.
But the BoJ hasn’t been completely sidetracked by the political pressure and policymakers have hinted that a hike is on the way, although the timing is less clear.
One reason for the caution is the negative impact the trade uncertainty, and the resulting drag on exports, is expected to have had on third quarter growth. Data out on Monday is forecast to show the Japanese economy contracted by 0.6% q/q in Q3.
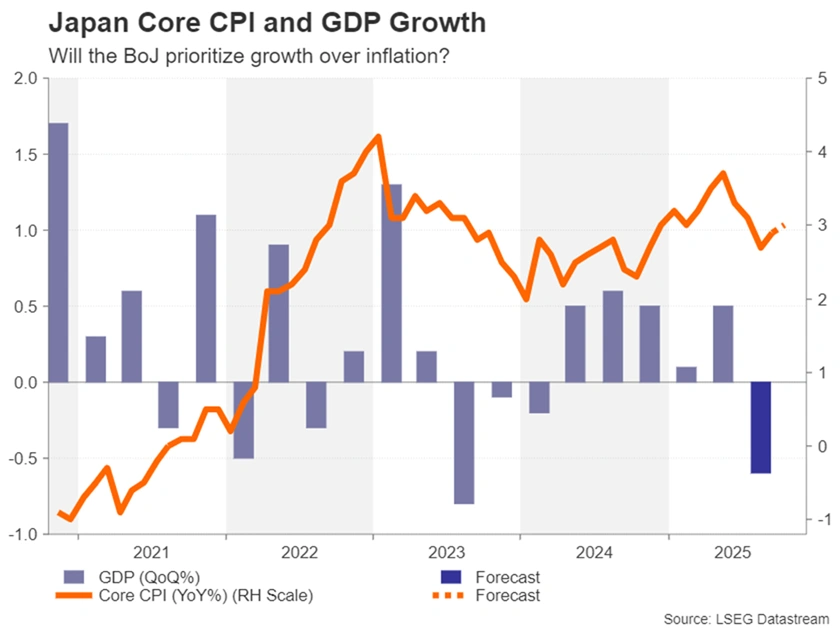
However, Friday’s CPI report will probably back the need for more tightening. Core CPI is projected to have edged up in October to 3.0% y/y.
Other releases will also be watched such as machinery orders (Wednesday), trade (Wednesday) and flash PMIs (Friday). Hence, an overall strong batch of data could offer the battered yen some much needed relief, especially versus the greenback, where a breach of the 155 level risks government intervention to prop up the currency.
Forward Guidance: Canadian Consumer Prices and Spending in Focus in the Week Ahead
Delayed U.S. data releases due to the record long government shutdown could begin to trickle out in the week ahead – including potentially the September nonfarm payroll data that was just days away from release before the government shut down in early October.
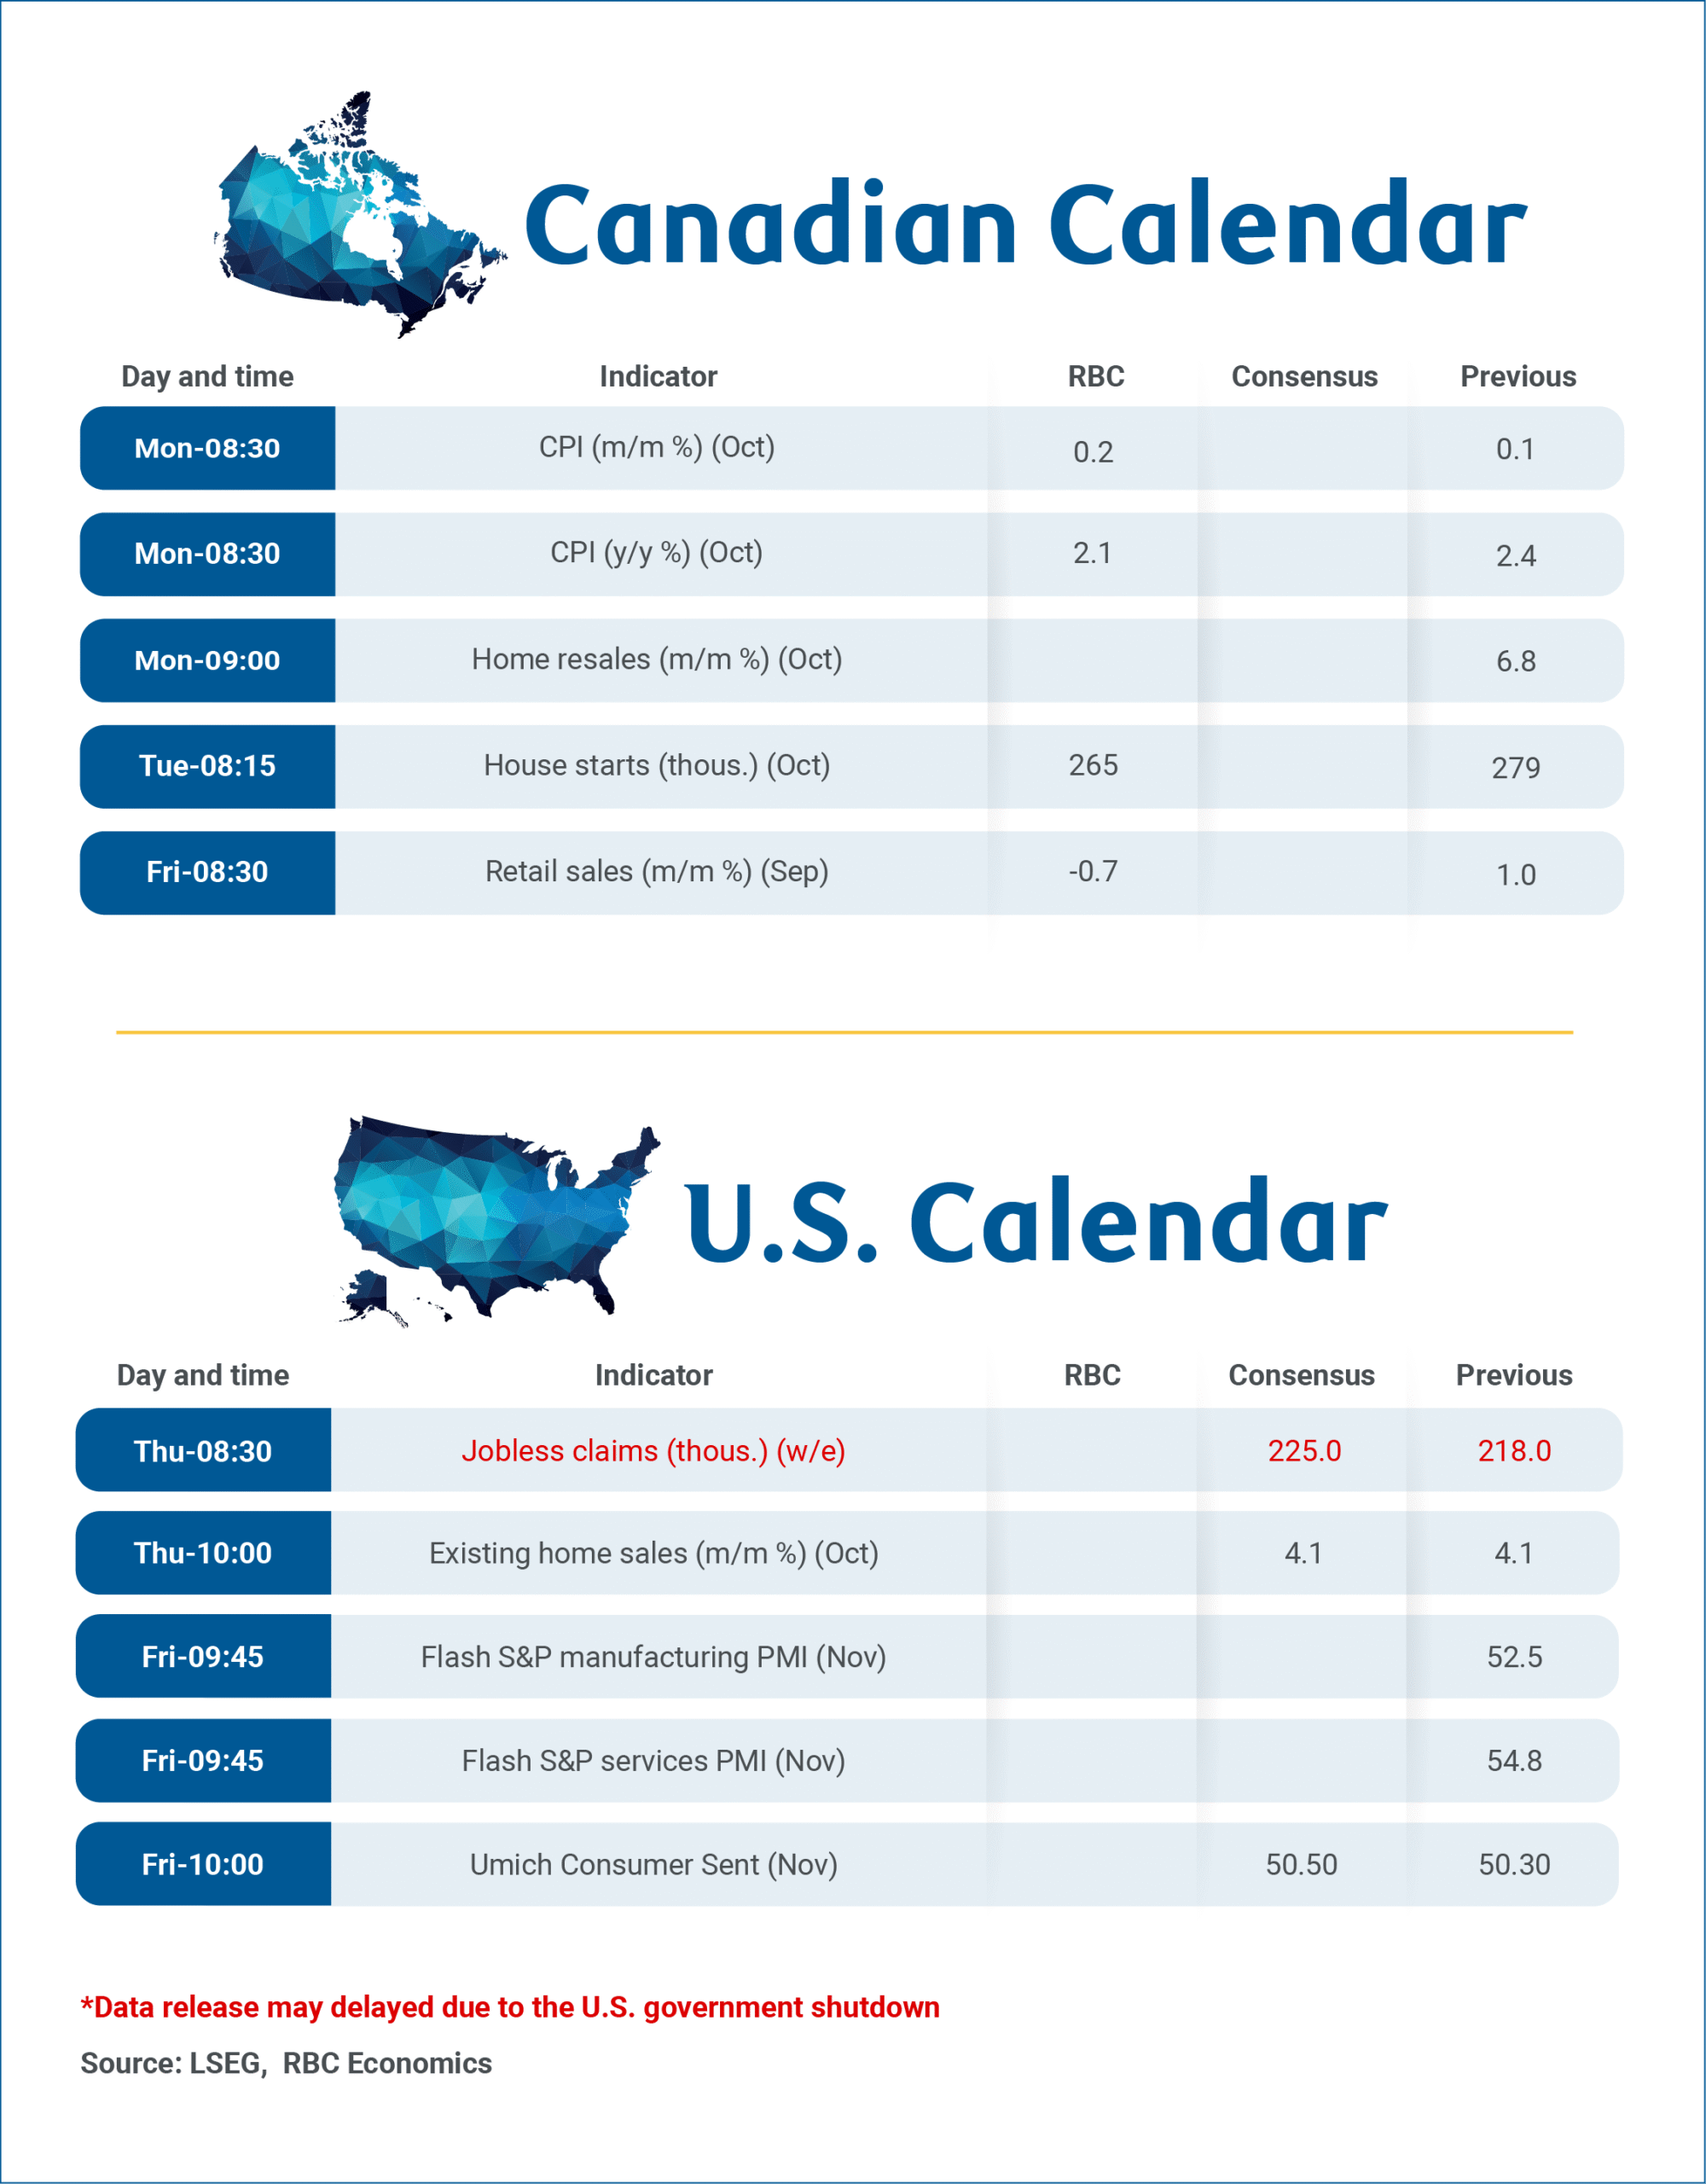
Next week’s Canadian economic calendar includes important releases on Canada’s household spending and inflation backdrop. October CPI data will likely be the primary focus, with housing starts and resales also set for release on Monday and September retail sales (and the advance estimate for October) to follow on Friday.
We forecast headline inflation to edge down to a 2.1% year-over-year rate, following last month's upside surprise. This moderation is expected to be primarily driven by lower gasoline prices, which fell 5% from September. We expect food price growth to hold close to September’s 3.8% annual rate in October. The October data will include the annual update on property tax prices in the CPI data. Significant property tax increases again took effect in some major population centers, but nationally we expect a smaller increase (4%) than the 6% increase in October a year ago.
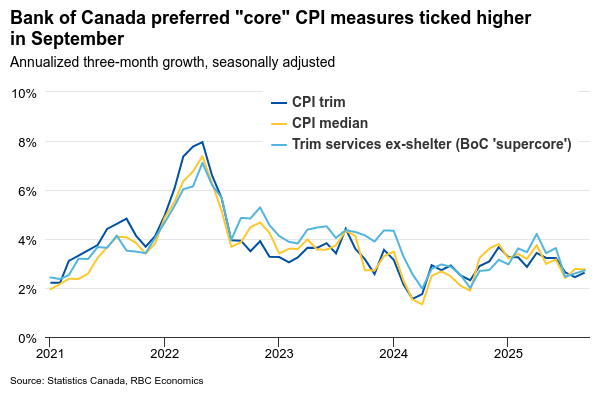
Headline CPI growth continues to be distorted on the downside by the removal of the cabon tax from energy products in most provinces in April. Broader measures of ‘core’ inflation are expected to remain above the Bank of Canada’s 2% target rate in October. We look for the price growth excluding food and energy products to hold at a 2.4% year-over-year rate. CPI-trim and CPI-median measures should hold around a 3% year-over-year rate.
Statistics Canada's advance estimate indicates retail sales declined 0.7% month-over-month in September, reversing most of a 1% increase in August. On a quarterly annualized basis, retail sales volume growth likely maintained positive momentum in Q3, albeit at a slower pace than Q2. This also aligns with our own cardholder spending analysis for Q3, which indicates consumer resilience despite ongoing moderation in spending patterns.
Week ahead data watch:
We anticipate housing starts will retreat in October following September's surge. Our forecast stands at 265,000 units, representing a 5% monthly decline that partially reverses September's 14% increase.
Canada’s October home resales report on Monday should show a mixed housing market backdrop across the country, with early market reports pointing to elevated inventories to sales remaining in less affordable markets in B.C. and Ontario but resale increases in other regions.