Sample Category Title
GBP/USD Mired at Seven-Month Lows Amid Political and Fiscal Concerns
The GBP/USD pair declined to 1.3149 on Friday, hovering near a seven-month low. The sell-off was triggered by the government’s abrupt abandonment of plans to raise income tax rates ahead of the Autumn Statement on 26 November.
According to the Financial Times, Prime Minister Keir Starmer and Chancellor Rachel Reeves have scrapped the previously debated increases to basic and higher tax rates. Instead, they will seek more indirect measures to address a budget deficit estimated at £30 billion.
This policy reversal has sparked significant market anxiety over the new cabinet’s fiscal discipline and long-term strategy, leading to a broad sell-off in sterling-denominated assets and exerting upward pressure on government bond yields.
Moreover, recent macroeconomic data have been weak, further compounding the political unease. Third-quarter economic growth was muted, with monthly GDP contracting in September. This follows earlier reports showing unemployment rising to a four-year high and wage growth slowing to its weakest pace since early 2022. Consequently, market expectations for a Bank of England rate cut in December have intensified.
Technical Analysis: GBP/USD
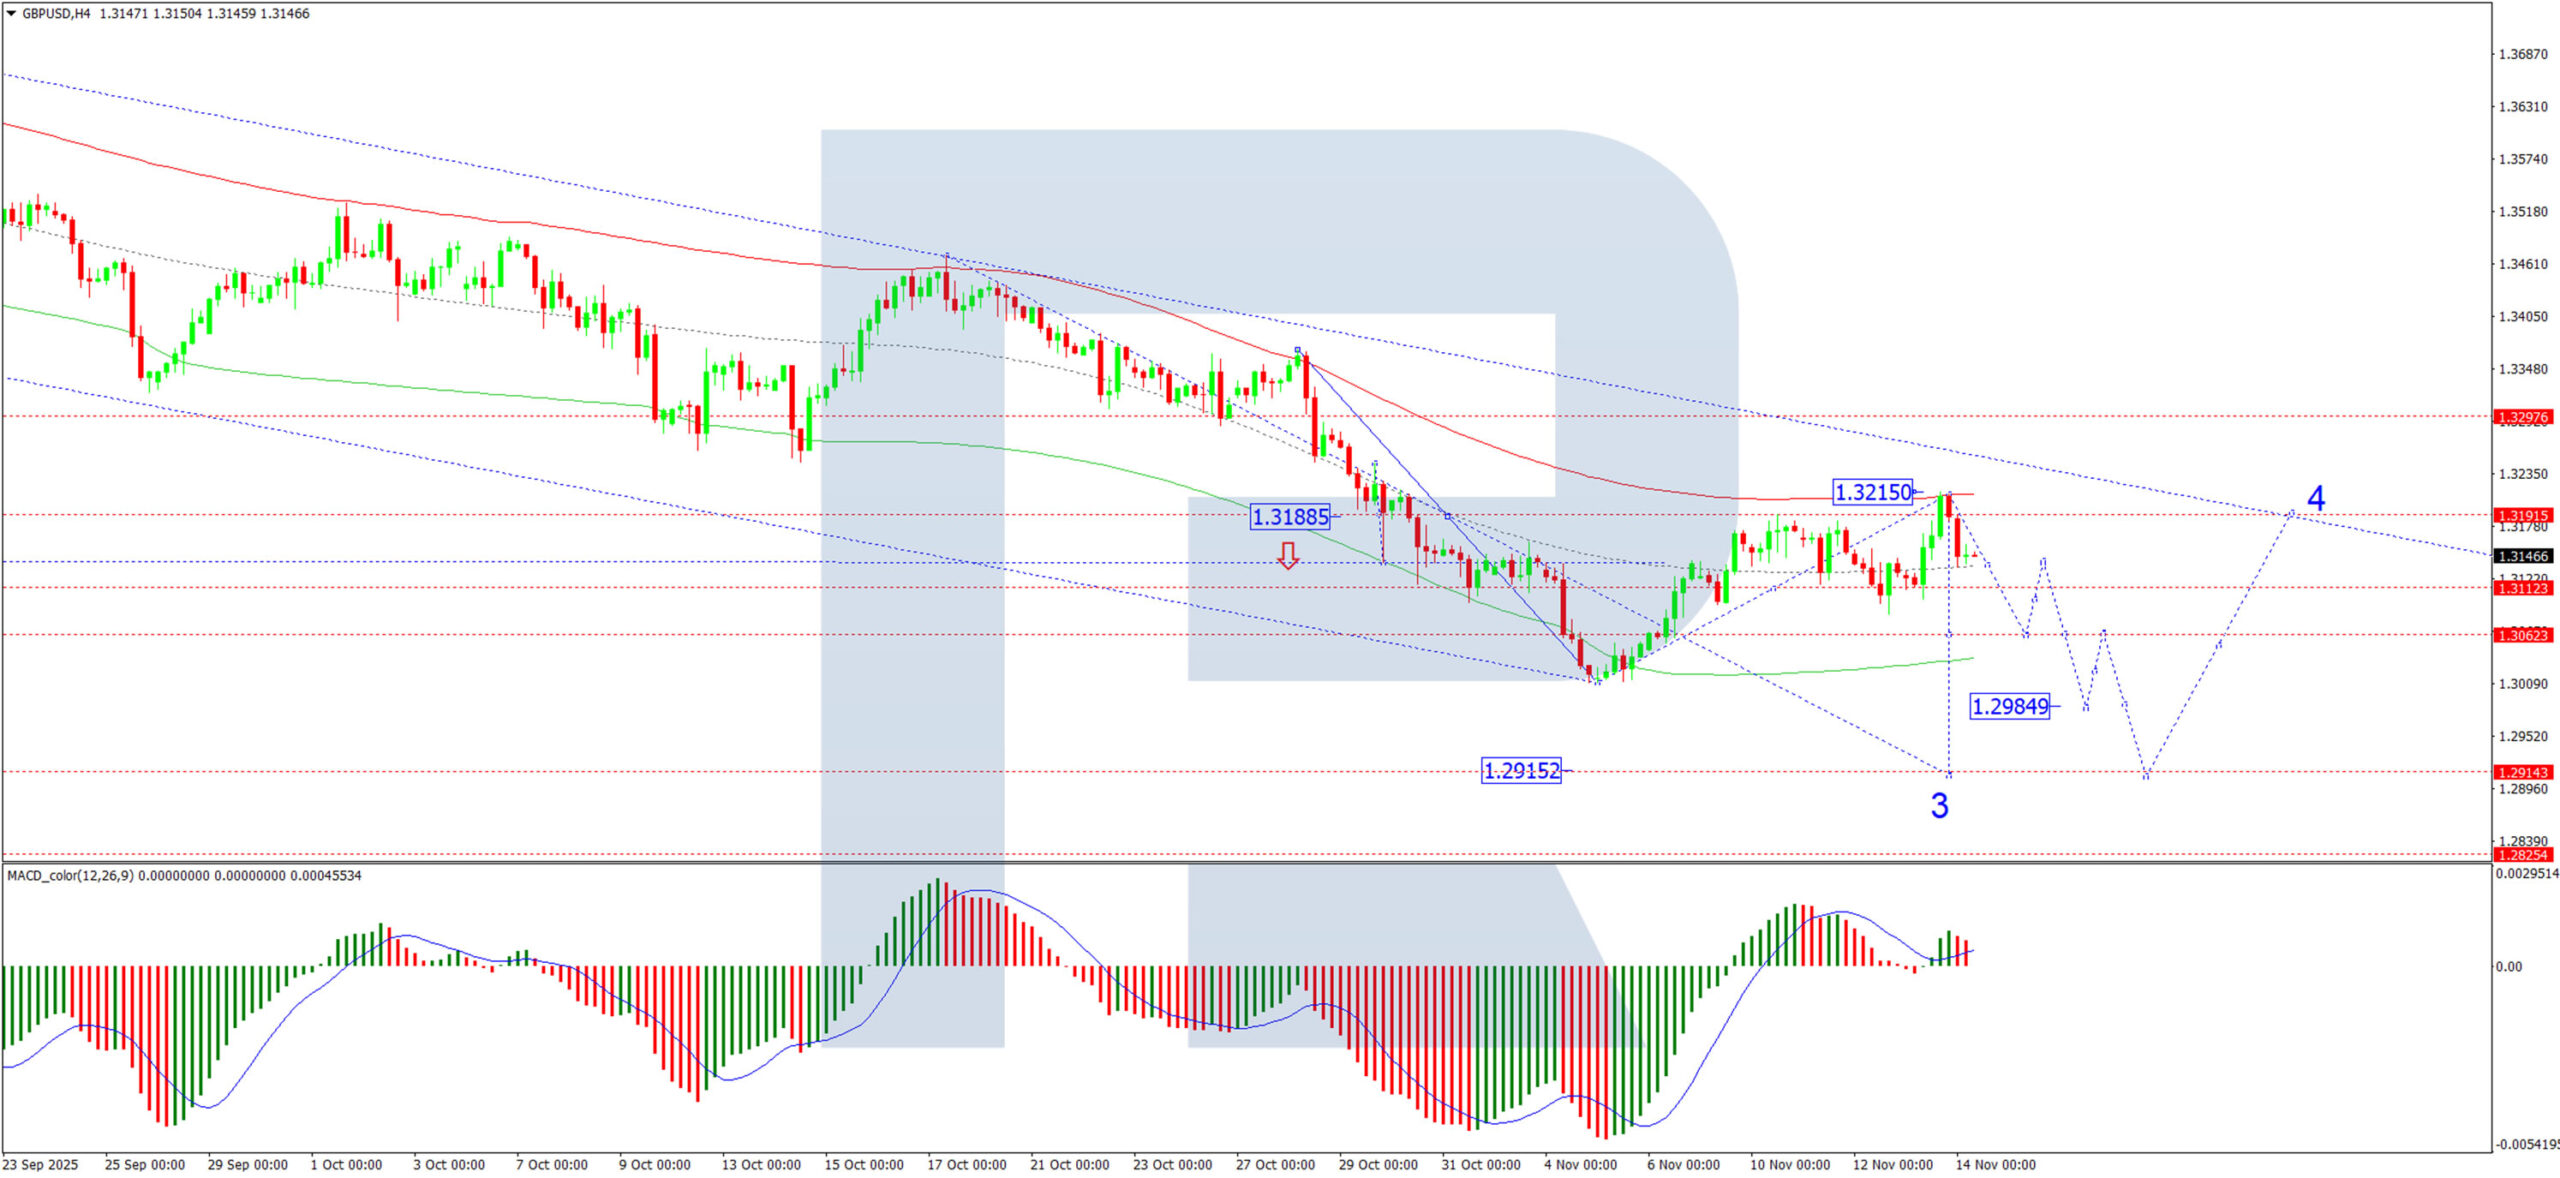
H4 Chart:
On the H4 chart, GBP/USD has completed a corrective wave at 1.3215. A decline towards 1.3062 is anticipated, likely to be followed by a minor rebound to 1.3131. This level is expected to form resistance within a new consolidation range. A subsequent downward breakout from this range would signal a resumption of the primary downtrend, opening the path towards 1.2985, with a further potential decline to at least 1.2915. This bearish scenario is supported by the MACD indicator. Its signal line, while above zero, has diverged bearishly from its histogram, suggesting the recent corrective bounce has ended and a new downward impulse is forming.
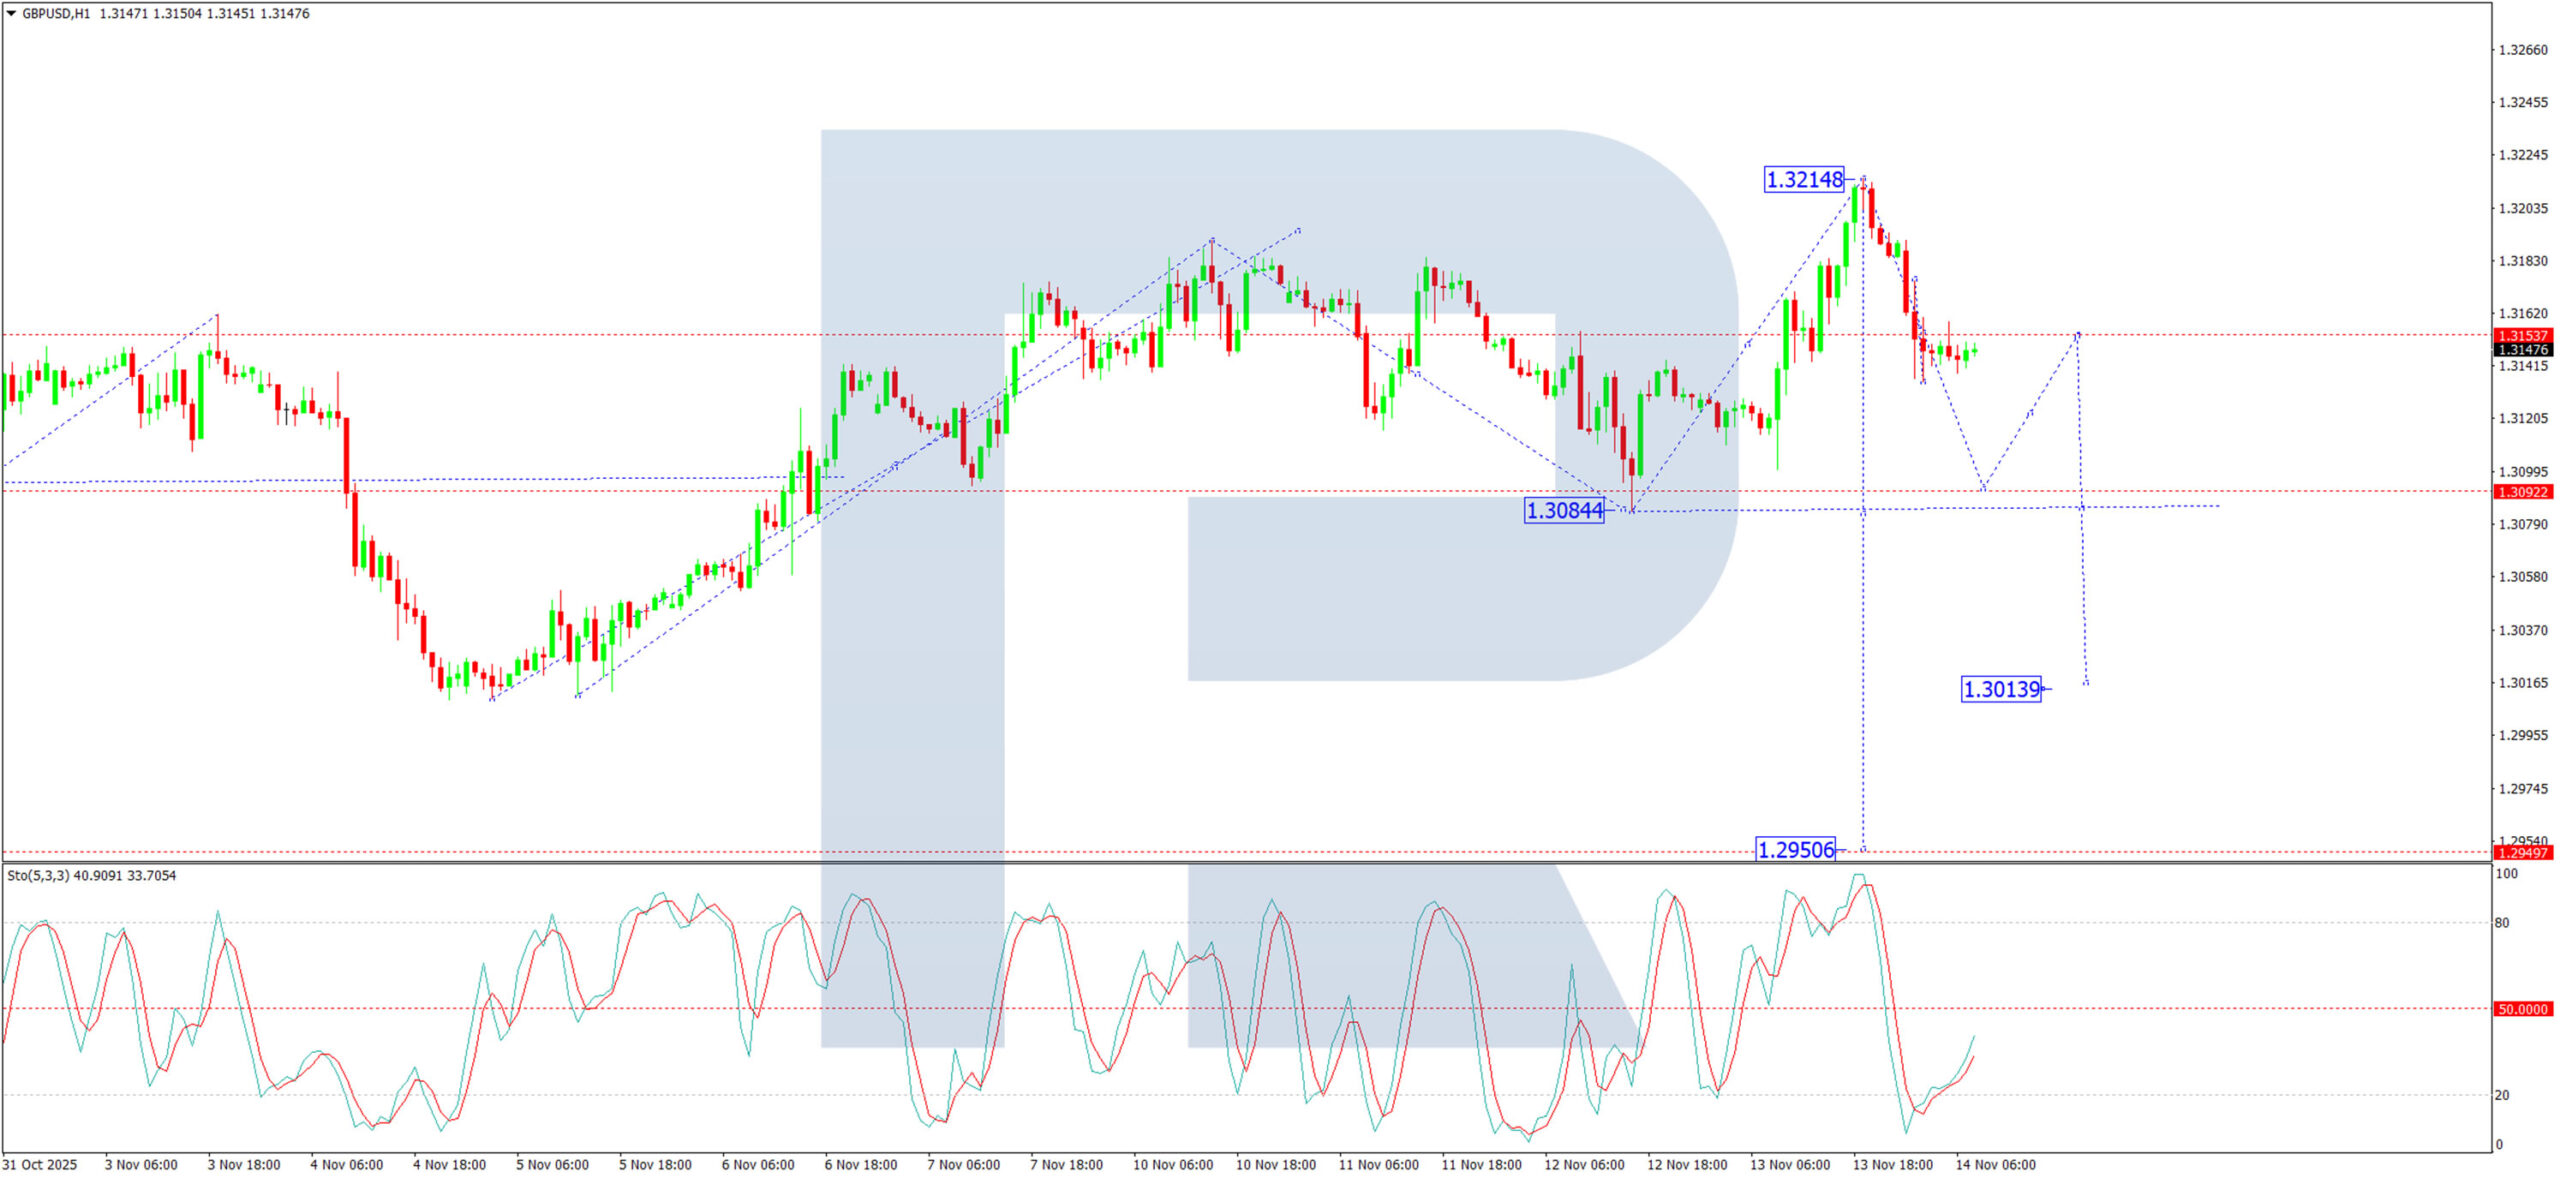
H1 Chart:
On the H1 chart, the pair has formed a consolidation range around 1.3153. We expect an initial decline to 1.3090, followed by a technical retracement to retest the 1.3153 level from below. This retest is likely to present a selling opportunity before the downtrend extends towards 1.3013. The Stochastic oscillator aligns with this view. Its signal line is deep in oversold territory at the 20 level, which, rather than suggesting a rebound, typically indicates sustained downward momentum in a strong trend.
Conclusion
The pound remains under heavy pressure, caught between political missteps that undermine fiscal credibility and a deteriorating economic backdrop that points to monetary easing. Technically, the pair maintains a clear bearish structure. Any near-term stability is likely to prove temporary, with the path of least resistance pointing towards a test of support at 1.2985 and potentially 1.2915.
Natural Gas Prices Hover Near a Three-Year High
As the XNG/USD chart shows today, natural gas prices are trading close to the March peak, which is the highest level since December 2022.
According to Trading Economics, the rise in gas prices has been driven by several factors:
→ Despite short-term warming in the US, weather models point to colder conditions ahead.
→ LNG exports remain elevated, as European buyers continue seeking alternatives to Russian gas. In November, average shipments across the eight major US terminals reached 17.8 billion cubic feet per day, exceeding the previous record of 16.7 billion in October.
→ The International Energy Agency expects global demand for oil and gas to continue rising until 2050, reflecting uncertainties surrounding the pace of the energy transition.
At the same time, chart analysis suggests that the upside potential may be limited.
Technical Analysis of XNG/USD
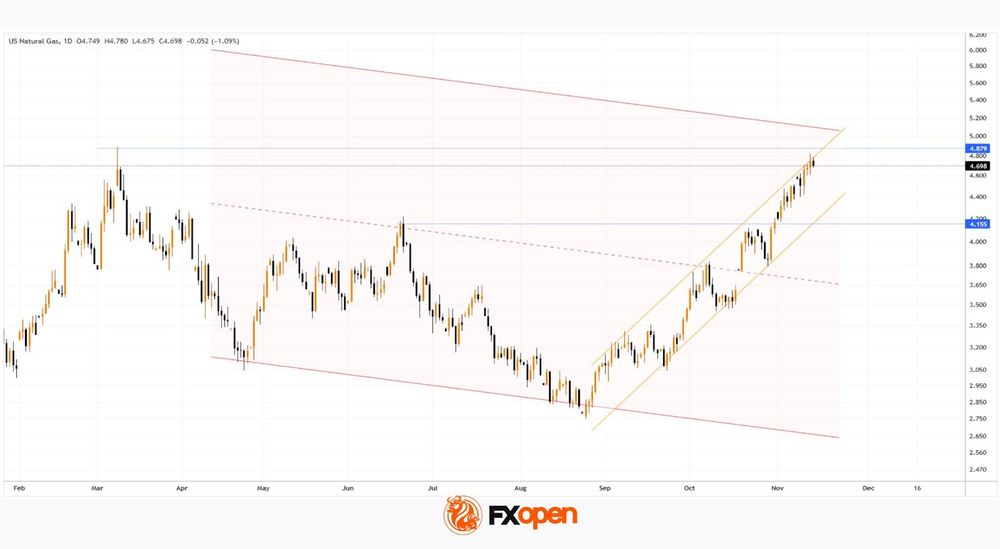
Price action is approaching a major resistance area, formed by:
- → the upper boundary of the channel, widened after the bullish breakout in late October;
- → the psychological level of $5.000 per MMBtu;
- → the previously mentioned March high.
Meanwhile, the more than 50% rally since early autumn has been significant, and long-position holders may be tempted to take profits. Therefore, if the price attempts to break above these resistance levels, it may result in a false bullish breakout (a buyer’s trap) followed by a pullback.
Start trading commodity CFDs with tight spreads. Open your trading account now or learn more about trading commodity CFDs with FXOpen.
This article represents the opinion of the Companies operating under the FXOpen brand only. It is not to be construed as an offer, solicitation, or recommendation with respect to products and services provided by the Companies operating under the FXOpen brand, nor is it to be considered financial advice.
Pound Strengthens After Weak GDP Data as Markets Assess the Impact of the US Shutdown
The British pound posted a solid advance yesterday, despite UK GDP data coming in weaker than expected. The economy showed virtually no growth, underscoring persistent pressure on domestic demand and the manufacturing sector. However, the market appears to have used the release as an opportunity to cover short positions after a prolonged decline, which supported the pound in both major pairs.
Another factor behind the gains in GBP/JPY and GBP/USD may have been the end of the longest government shutdown in US history. The reopening of federal agencies removed some of the risks linked to delays in economic releases and uncertainty surrounding the budget process. Investors are assessing the consequences of the 43-day halt in US government operations, which has already shaved nearly 1.5 percentage points off GDP growth and created a significant gap in key macroeconomic data. Delayed employment and inflation reports are expected to begin appearing only by mid-November, and it will take longer for statistical accuracy to be fully restored.
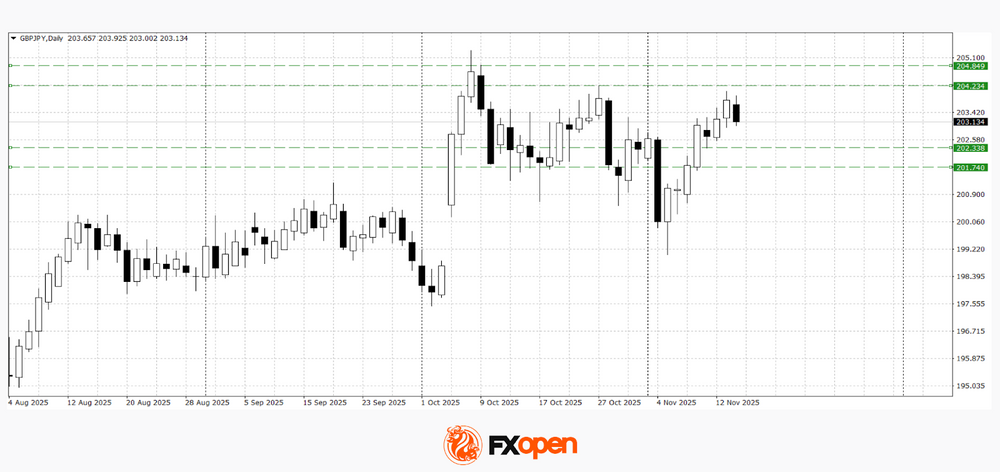
GBP/JPY
Despite two weeks of steady gains, GBP/JPY buyers have so far been unable to break above the October high at 205.30, the current yearly peak. Yesterday, the pair traded near 204.00, but failed to secure a firm close above this level.
Technical analysis suggests the pair may continue rising towards 204.30–204.80 if 204.00 confirms itself as support. A daily close below 203.00 could open the way for a deeper decline towards 201.70–202.30.
Upcoming events that may influence GBP/JPY price action:
- Today, 16:00 (GMT+3): UK Monthly GDP Tracker by NI;
- Today, 23:30 (GMT+3): Net speculative GBP positions from the CFTC.
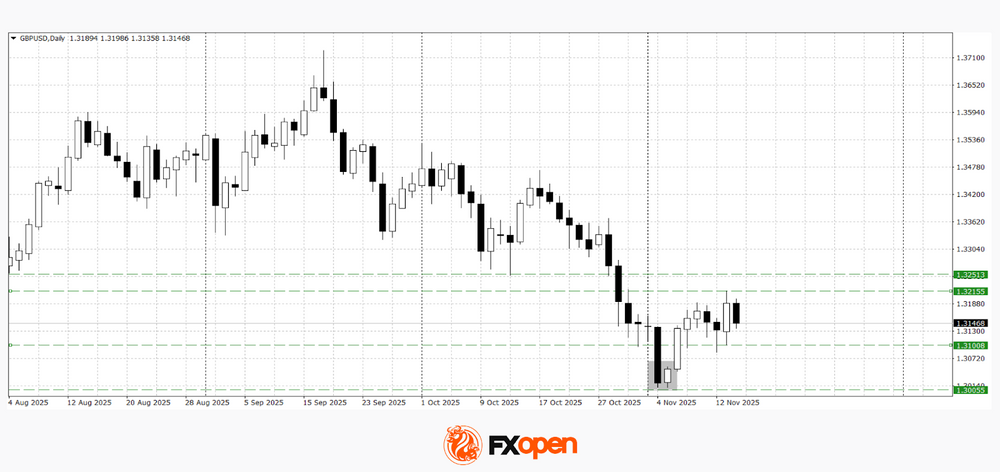
GBP/USD
Last week’s test of the key 1.3000 support level resulted in the formation of a bullish “piercing line” pattern. The follow-through on this setup allowed buyers to retest the major resistance at 1.3200. A break above this area may extend the corrective move towards 1.3250–1.3300. A sustained move below 1.3100 could lead to a retest of recent lows.
Upcoming events that may affect GBP/USD pricing:
- Today, 15:30 (GMT+3): US Initial Jobless Claims;
- Today, 17:20 (GMT+3): Speech by FOMC member Raphael Bostic;
- Today, 20:00 (GMT+3): Atlanta Fed GDPNow estimate.
Trade over 50 forex markets 24 hours a day with FXOpen. Take advantage of low commissions, deep liquidity, and spreads from 0.0 pips. Open your FXOpen account now or learn more about trading forex with FXOpen.
This article represents the opinion of the Companies operating under the FXOpen brand only. It is not to be construed as an offer, solicitation, or recommendation with respect to products and services provided by the Companies operating under the FXOpen brand, nor is it to be considered financial advice.
China Industrial Output Hits 14-Month Lows as Wall Street Losses Spill Over into Asia, Europe
Asia Market Wrap - Asian Stocks Follow Wall Streets Lead
Asian stock markets tumbled on Friday, joining a worldwide selloff after hawkish comments from Federal Reserve officials dampened hopes for a US interest rate cut next month.
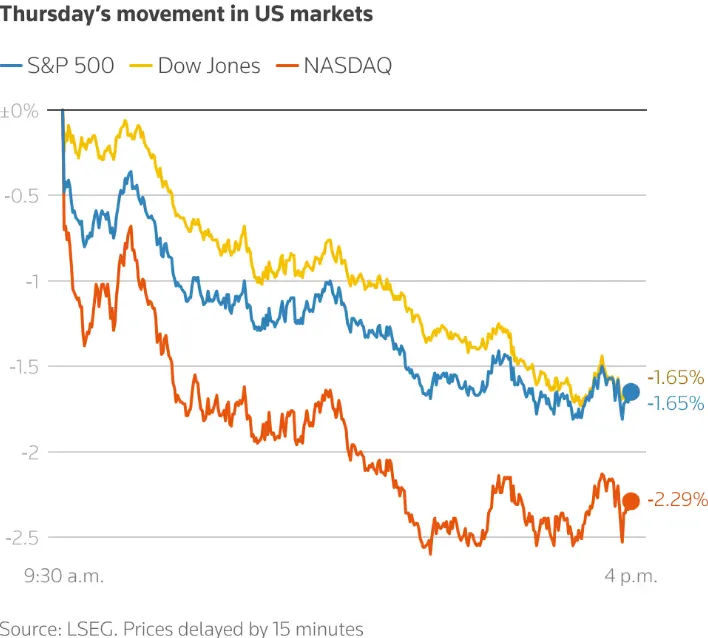
This fear, combined with a messy schedule of economic data, caused Wall Street to snap its four-day winning streak with its biggest one-day fall since April, which then spread to Asia.
Key regional markets saw steep declines: Japan's Nikkei fell 2%, Australia's resource shares slid 1.4%, and South Korea tumbled by as much as 3.6%. Separately, Chinese stocks also eased 0.9% after new monthly data confirmed that both factory production and retail sales slowed down in October, missing analyst expectations.
Take a look at how US markets ended yesterday, sentiment which has spilled over into Asian trade.
China Industrial Output Hits 14-Month Low
China’s industrial production grew by 4.9% in October, which was a significant slowdown from the 6.5% growth in September and missed the expected growth of 5.5%. This was the weakest increase seen since August 2024, mainly because activity slowed down in manufacturing and mining, partly due to the Golden Week national holiday.
However, the production of electricity, heat, gas, and water actually accelerated. Despite the overall slowdown, growth was still seen in 29 out of 41 major industries, including very strong performances in the automotive, computer/communications, and shipbuilding sectors. For the first ten months of the year, industrial production has risen by 6.1%.
European Session - Cautious Open Expected
Early European stock futures showed a mixed start, but the past 24 hours have been difficult for global markets as traders suddenly lost confidence that the US Federal Reserve will cut interest rates in December, now seeing the chance as 50/50. This uncertainty caused global stocks, Treasury bonds, and the US dollar all to fall.
Adding to the bad mood, new data confirmed that China's factory production and retail sales grew at their slowest pace in over a year during October. Compounding the issue, Federal Reserve official Neel Kashkari further reduced optimism by stating he opposed the rate cut last month and is still unsure about supporting a cut in December.
In early European trading, Euro Stoxx 50 futures were down 0.4%, German DAX futures rose 0.1% and FTSE futures slid 0.5%.
On the FX front, the US Dollar (USD) is set to end the week lower, with its overall strength remaining near a two-week low and on track for a 0.4% weekly fall.
The Swiss Franc similarly held near its strongest level in over three weeks against the Dollar.
Meanwhile, the British Pound fell 0.3%, unable to keep the gains it made overnight against the weaker Dollar.
In China, the Yuan hit a one-year high against the Dollar, as local exporters reportedly sold off their dollars after the exchange rate crossed a key level.
Currency Power Balance
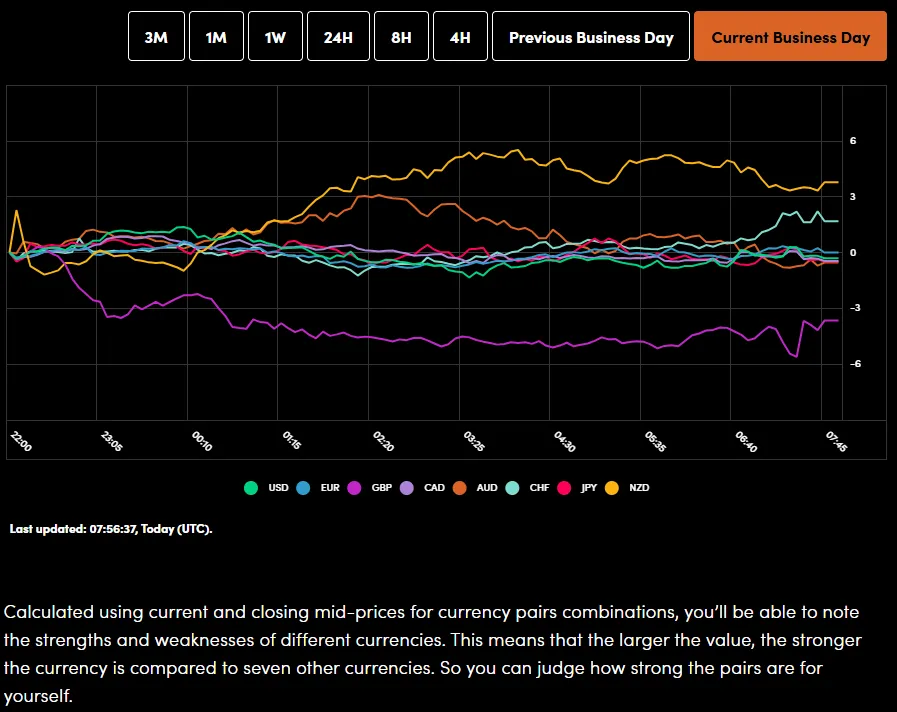
Source: OANDA Labs
Oil prices surged by about 2% on Friday because of renewed worries over global supply after a Ukrainian drone attacked a major oil export hub in Russia, the Black Sea port of Novorossiysk. Russian officials confirmed that the attack early on Friday damaged the oil depot, apartment buildings, and a ship in the port, injuring three crew members.
Following this news, both major benchmarks saw significant jumps, with Brent crude futures rising to $64.25 a barrel and US West Texas Intermediate crude climbing to $59.94 a barrel.
Gold prices rose on Friday and are set for a weekly gain, primarily supported by a weaker US Dollar. The market is currently waiting for the release of more US economic data to get a better sense of whether the Federal Reserve will still cut interest rates in December, especially following recent comments from Fed officials that sounded against a rate cut.
Spot gold was up 0.7% at 4,201.70/oz and has posted a strong overall gain of 5% so far this week.
Economic Calendar and Final Thoughts
On Friday, markets will be influenced by several major announcements.
In terms of company earnings, three large firms are reporting: the German insurer Allianz, the Swiss reinsurance giant Swiss Re, and the British aerospace and defense company Rolls-Royce Holdings.
Regarding economic data, attention will be on Europe:
France will release its final inflation rate (CPI) for October.
The Eurozone will release several important figures, including the first official estimate for economic growth (GDP) in the third quarter, flash data on job changes (Employment flash) for the third quarter, and trade figures (trade balance) for September.
Moving to the US and markets will be hoping for more clarity regarding October data and whether or not it will be released. If it is confirmed that the jobs data and CPI data for October is not going to be released, this could add to market uncertainty and leave sentiment fearful heading into the weekend.
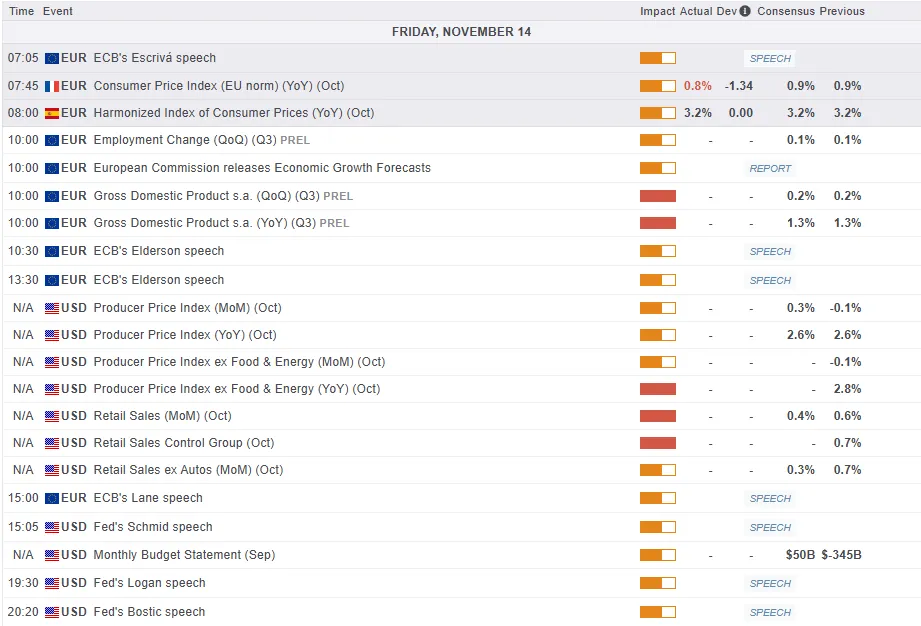
For all market-moving economic releases and events, see the MarketPulse Economic Calendar. (click to enlarge)
Chart of the Day - FTSE 100 Index
From a technical standpoint, the FTSE 100 has pulled back significantly over the last two days.
The index has declined around 200 points as it has followed on from the dent to sentiment which has dragged down US stocks as well.
On the four-hour chart below, the overall structure remains bullish until we get a four-hour candle close below the swing low at 9661.
If price fails to breach the previous swing low, a bounce and recovery remains on the cards. This will however depend on the overall market sentiment improving.
FTSE 100 Index Daily Chart, November 14, 2025
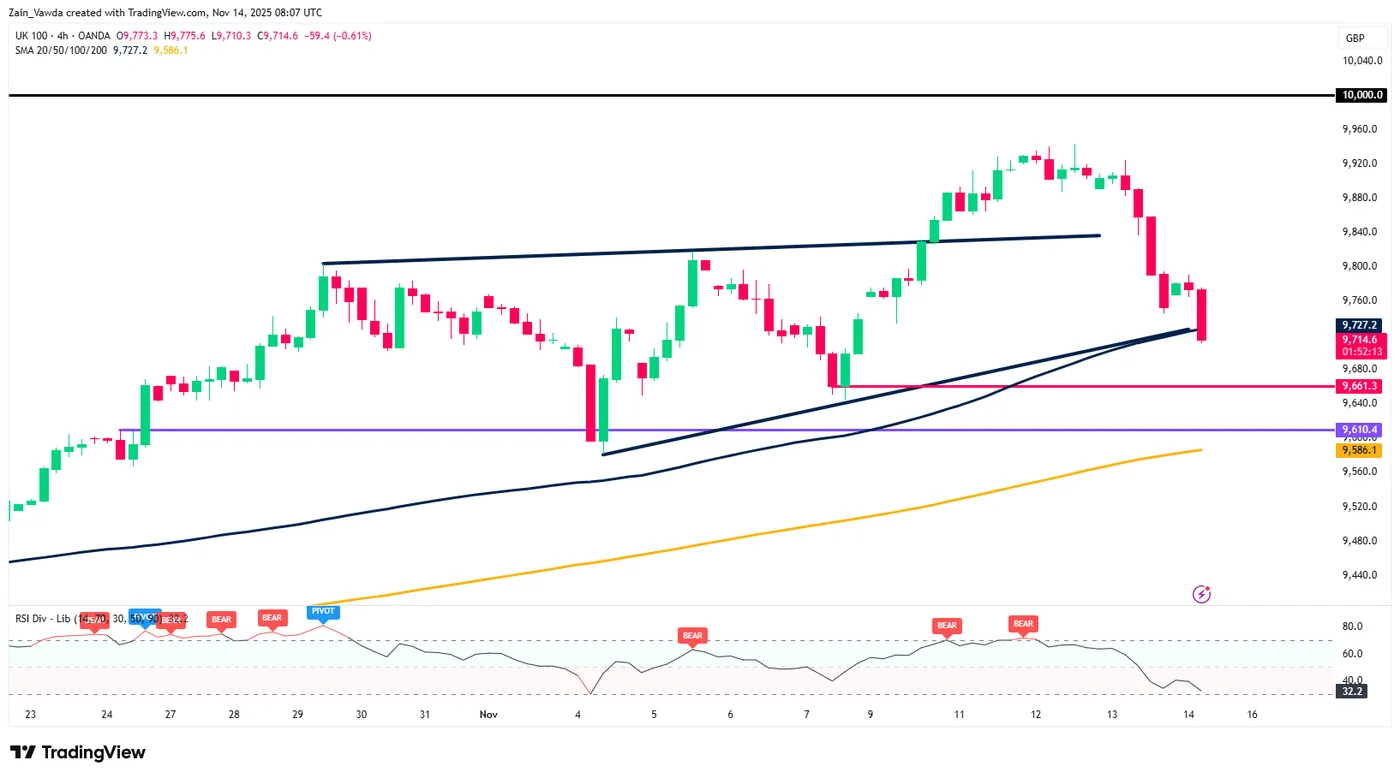
Source: TradingView.com (click to enlarge)
Number One Question Now: Whether Upcoming Official Data Supports or Opposes Further Fed Easing
Markets
Stock momentum faded, resulting into declines of more than 2% for the likes of the Nasdaq. European equities swapped gains for losses of around 1% across the continent. President Trump effectively ended the shutdown by signing the Congress-approved bill into law yesterday but markets clearly had been frontrunning the outcome. The number one question now is whether the upcoming official data either supports or opposes further Fed easing, in December in particular. Chair Powell was very clear at the October meeting that a third risk-management rate cut is not at all a given but markets up until this week remained pretty certain (+/- 70%). That changed yesterday with the odds dipping below 50% for the first time. Non-voting member Kashkari from the Minneapolis Fed said he’s undecided on December but he opposed the October cut, citing the underlying economic resilience and too-high inflation. Since then, available data suggested “more of the same”. Cleveland Fed Hammack repeated that she favours a pause next month with concerns about inflation outweighing those about the labour market. She said rates (3.75-4%) are “barely restrictive, if at all” and advocates keeping them steady around the current level. Musalem of the St Louis Fed argued again for moving cautiously with inflation running above the 2% target. The room to lower them is limited. US yields rose between 2.2 and 5 bps in a daily perspective. Long end underperformance followed a tailed $25bn 30-year auction. Demand metrics were slightly weaker but had to be compared with October’s record low primary dealer award. European rates rose in similar fashion. The 2-yr swap rate rallied to an 8-month high, surpassing the September high of 2.18%. The 10-yr tenor nears the upper bound of the current (since July) sideways trading range and 30-yr topped 3%, the first such close since 2023. EUR/USD’s rate-driven recovery was blocked around 1.1630 by US risk aversion. USD/JPY’s upside momentum hit resistance around 155, meaning DXY lacked the safety net it had on Tuesday. The trade-weighted index slipped towards the 99 handle. China’s yuan finished at the strongest level since October 2024, at 7.096. The below-consensus monthly update (including retail sales, IP, housing data and jobless rate) thwarts a further rise though. USD/CNY stabilizes around yesterday’s closing levels. For lack of an inspiring eco calendar – US retail sales and PPI are stilling missing while US government offices are working their way through the backlogs – we keep an eye at GBP today. EUR/GBP pushes through to the highest level since April 2023 around 0.885. Renewed sterling weakness creeped in after reports that UK Chancellor Reeves is reconsidering plans to raise income tax rates and other levies in the Nov 26 budget. Doing so would break with key election promises and has triggered internal revolt. GBP markets are left wondering what measures she’ll take to address the gaping deficit of almost 5% of GDP. Without higher taxes, growth-dampening austerity is the only viable option – assuming Starmer and Reeves don’t want to be the next Truss-Kwarteng.
News & Views
KPMG and REC’s monthly UK report on jobs showed temp billings increasing for the first time in 16 months in October. The downturn in permanent placements eased for the fourth straight month. Overall, employers remain hesitant to commit to new hires though amid a weaker economic climate and uncertainty over the upcoming government Budget. Vacancies continued to fall at a historically marked pace while both permanent and temporary staff availability rises at rates amongst the quickest since 2020. This supply/demand mismatch keeps pay pressures weak. The surveyors are hopeful that a Budget that build business confidence could be a catalyst for new hiring. They label today’s report as the best since the summer of 2024 but admit that this is just a more stable market.
The US administration released joint statements yesterday with four Latin-American countries (Ecuador, Argentina, El Salvador and Guatemala) saying that the US would reduce tariffs on a variety of goods not produced (sufficiently) domestically. Officials later confirmed that these goods would include products like bananas, coffee and beef. Certain textile and apparel products would also be under consideration. The press releases follow comments earlier this week by Treasury Secretary Bessent hinting in that direction in order to bring down domestic prices very quickly to temper the cost-of-living crisis. Tariff rates on non-exempted products will remain the same at 15% for Ecuador and 10% for the other three nations.
The Big Bear Has Fallen
I see no need for a long introduction, so I’ll dive right in: Michael Burry is done with this. In a short letter yesterday, he announced that he’s liquidating funds and returning capital as his “estimation of value in securities is not now, and has not been for some time, in sync with the markets.” In short, he’s been thinking that the market is overvalued for quite some time. He’s been short the booming companies like Nvidia and Palantir. And he’s got his reasons. But he’s — apparently — growing increasingly desperate about the time it will take for the market to go back to its senses. Senses meaning valuations that point to PE, PS, P - whatever ratios - that make more sense to him and to many. The S&P 500 companies, for example, trade at an average PE ratio of about 23 today, well above the historical average of around 18.
A big bear has just fallen — just given in to the aggressive AI bulls and their insatiable appetite for tech stocks, or just anything that would rally fast and high enough to keep the show going.
Funny enough, the Nasdaq didn’t rally yesterday. On the contrary, it was down 2%, with Nvidia dropping more than 3.5%. I hope the Big Bubble Burst doesn’t start the day after Burry buries his positions. That would be ungrateful.
But zooming out, short positions against the S&P 500 increase along with its price. Institutional traders are clearly breathing down the necks of retail bulls — and have been for some time. The CFTC data suggests that leveraged net positions have been fairly negative since the summer of 2022. So the game is clear: if retail traders can hold on to their positions long enough to push the bears away, the bears will get washed out and the market rally could continue. That’s probably what Burry thought when he made his decision to just get the hell out of here. Maybe the market will really crash and there will be a Big Short 2. Who knows.
What likely triggered yesterday’s selloff was the growing realization that a full set of jobs and inflation data won’t land before the Federal Reserve’s (Fed) December meeting. And if that’s the case — and if the Fed retains even a minimum degree of independence and reason — it wouldn’t cut rates blindly. In this context, Atlanta Fed President Raphael Bostic said on Wednesday that “price stability remains the more pressing risk as signals from the labour market don’t indicate a cyclical downturn clearly enough to merit significant policy loosening while inflation remains well above target.” Well, HAPPILY, he will retire next February. But then, other Fed members echoed the same inflation worries, increasing discomfort among Fed doves, and risk takers. The US 2-year yield — which captures Fed expectations — rose to 3.60% yesterday as stocks fell.
And if yields keep pushing higher, the stock selloff could accelerate. But if that selloff deepens, the Fed could be more tempted to cut rates. So Keep Calm and Carry On. The system remains well anchored to keep propping up asset prices — whatever the fundamentals. No one wants to be the Fed Chair who triggered another financial crisis, or caused a bubble to pop.
Right now, optimism around the end of the US government shutdown is giving way to panic — panic and chaotic market moves. The US dollar’s selloff, for instance, accelerated yesterday despite hawkish Fed expectations and rebounding yields.
Maybe it’s the yen? The USDJPY hit the 155 mark and retreated for the second session in a row. That 155 level now seems to be the new pain threshold — the point that triggers official unease, as Japan’s Finance Minister clearly doesn’t feel comfortable with the yen’s rapid depreciation.
And sorry to say this, Ms. Katamaya, but if yen bears persist, they’ll likely win this game. Spending FX reserves to stop a currency slide while your Prime Minister is pushing for looser monetary policy is a losing battle. The only way to reverse that depreciation trend while pushing against rate hikes would be through very strong growth — and that’s not on the menu this Christmas.
Japanese GDP grew just 0.5% last quarter, after 0.1% in each of the two preceding ones. So I wouldn’t say FX interventions are useless in the short run — they do wipe out bearish positions temporarily and let the currency breathe. But in the medium run, it’s like fighting the waves with your fist. The USDJPY is far more likely to test 160 than fall back below 150.
So, if we summarise: the dollar is unloved, the yen is unappetising. I won’t even start on sterling… Cable rebounded yesterday only thanks to the dollar’s selloff. But sterling is a no-go before the Autumn Budget, and the pair already gave back most of the gains before I had time to call a top.
Underneath, Rachel Reeves wishes she’ll have billions of pounds of extra room in her budget, helped by lower inflation and lower interest rates. But the data tells another story: an economy barely growing, battered by tax rises and inflation.
Not helping either — Land Rover’s production halt after a cyberattack weighed heavily on the latest industrial numbers. And it’s hard to see how the UK could generate growth under the current circumstances.
Shout out if you see anything promising there. But come November 26, Rachel Reeves will either upset investors or taxpayers.
Either taxpayers take the hit and the economy is left to a slow death — and the Bank of England (BoE) cuts rates. Or investors get upset, we get another gilt crisis — and the BoE still cuts rates.
Either way, a 25bp cut from the BoE in December looks increasingly likely. And downhill seems to be sterling’s year-end path.
Elliott Wave Analysis: Spot Silver (XAGUSD) Targeting Fresh All-Time Highs
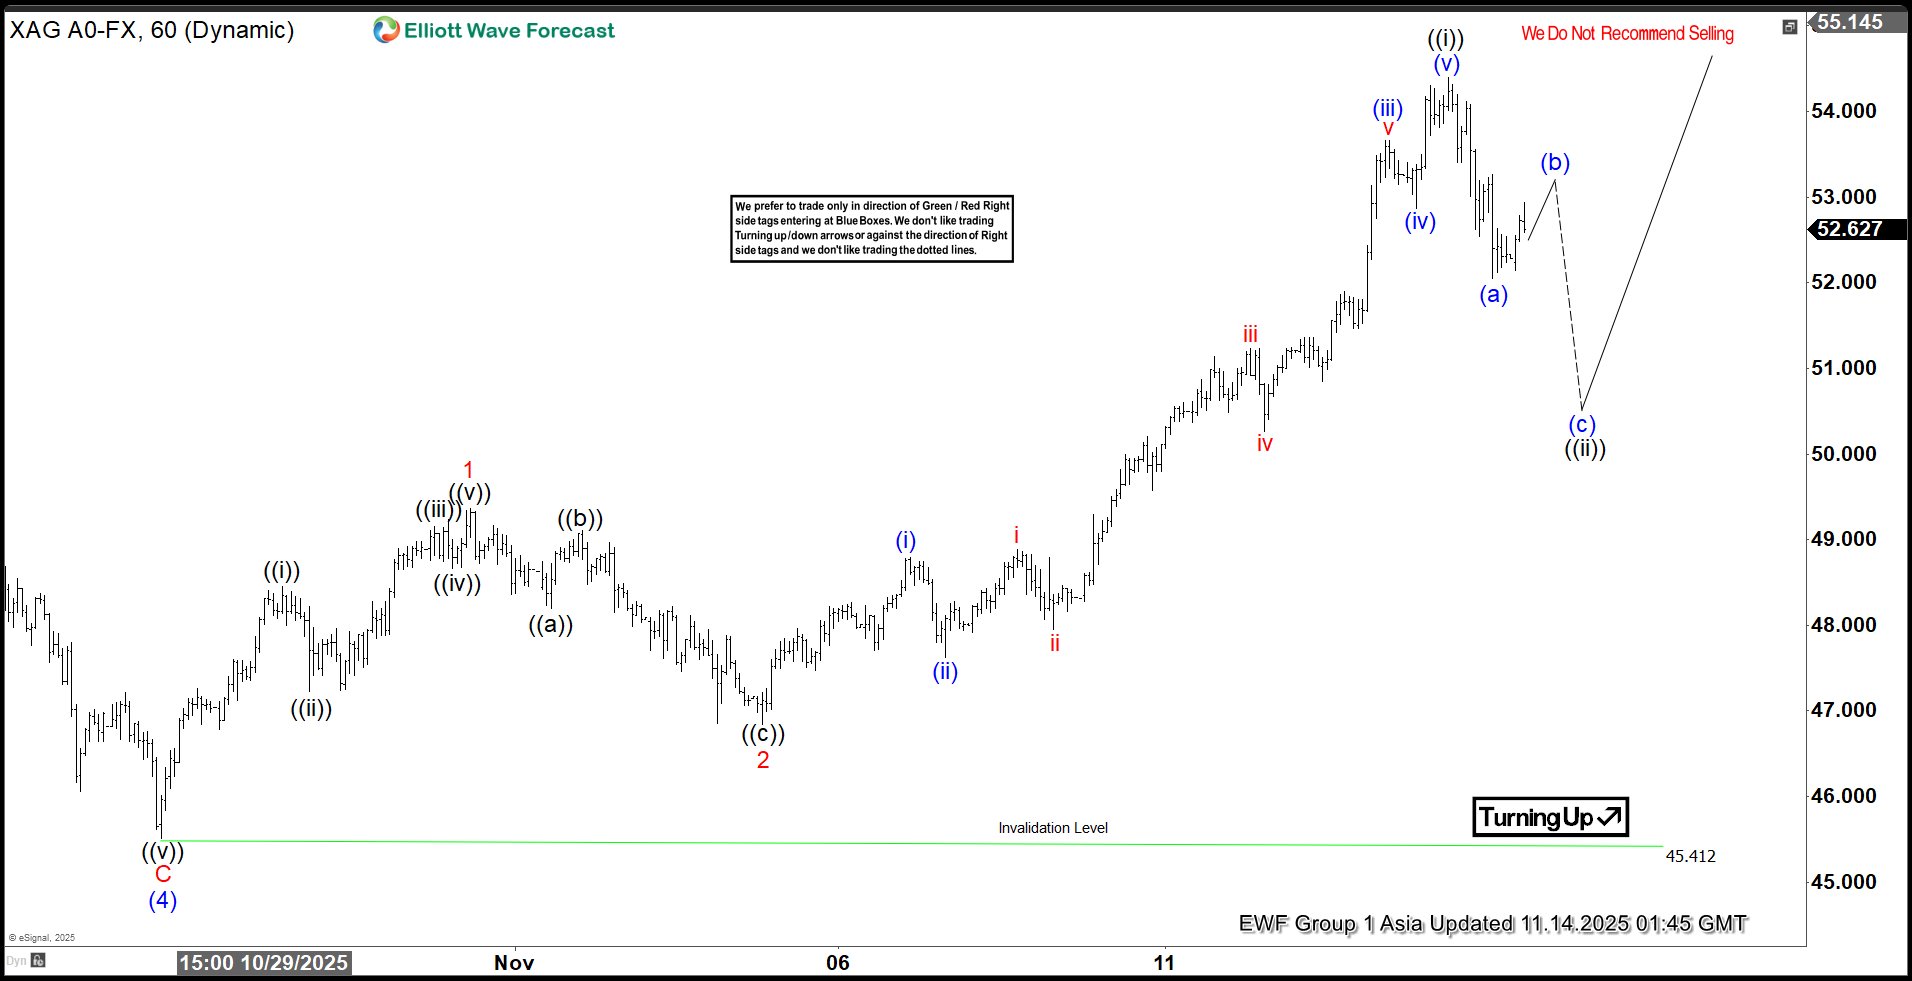
Spot Silver (XAGUSD) has mounted a notable recovery following the sharp decline from its all-time high of $54.46 to the $45.40 low registered on 28 October. We interpret this decline as the completion of wave (4) within the broader impulsive structure. While the metal has yet to decisively break above the $54.46 high to fully negate the possibility of a double correction, it currently trades just a few cents below that threshold. Given this proximity, the likelihood of a double correction at this stage appears minimal.
From the wave (4) low, price action has unfolded as a nesting five-wave impulsive sequence. Wave ((i)) concluded at $48.45, followed by a corrective pullback in wave ((ii)) that ended at $47.22. The advance resumed with wave ((iii)) reaching $49.14, while wave ((iv)) retraced modestly to $48.65. The final leg, wave ((v)), terminated at $49.36, thereby completing wave 1 of a higher degree.
Subsequently, a corrective wave 2 developed as a zigzag structure, bottoming at $46.86. The metal has since resumed its ascent in another impulsive nest. From wave 2, wave ((i)) peaked at $54.39. A pullback in wave ((ii)) is currently underway, correcting the cycle from the 5 November low. In the near term, as long as the $45.40 pivot remains intact, dips are expected to attract buyers in 3, 7, or 11 swings, supporting further upside potential.
Spot Silver (XAGUSD) 1-Hour Elliott Wave Chart From 11.14.2025
XAGUSD Elliott Wave Video
https://www.youtube.com/watch?v=F2gYTx-C1vM
When Differentials Make Little Difference
Fed outlook shifts down, RBA on hold for longer – so why aren’t we seeing the shift in relative interest rates affect the exchange rate?
- The outlook for US monetary policy has shifted down as labour market risks come to the fore. We now expect two further cuts to the Fed funds rate. At the same time, the outlook for RBA policy has been pushed out given near-term inflation developments.
- Ordinarily, lower expected rates in the US relative to Australia should put some appreciation pressure on the AUD, but that hasn’t really happened lately. Partly this is because policy rates are not the only yields that matter to investors. More important is the attractiveness of other assets such as equities. The AI boom is playing a role here, much as the internet boom did in the late 1990s and early 2000s, the previous period of USD overvaluation.
- The USD is still about 15% overvalued on standard metrics, so some mean reversion should be expected over coming years. A lot hangs on sentiment, though, so it is likely to happen in fits and starts.
The US government shutdown has meant that some key data releases have not been published, particularly crucial labour market data. The data that are available from private sector sources have been mixed. With monetary policy still on the tight side and tariffs weighing on employment as well as lifting some prices, downside risks on the labour market have come to the fore.
Some observers are also pointing to possible downside risks for the US labour market from AI. The relative weakness in the graduate job market is seen in some quarters as evidence of the AI threat. In their current form, generative AI tools do best when replacing white-collar job tasks that are routine or easily standardised, such as building reports or compiling information. This kind of “donkey work” is typically given to the least experienced employees, ostensibly to help them learn. Weaker demand for labour for this reason is long-lasting, not ephemeral. Though in some sense structural, it would be another reason for the Fed to respond.
These downside risks and the ongoing uncertainty over government policy and functioning changes the calculus for US monetary policy. In our Market Outlook release for November, we added two further 25bp cuts to our forecast for Fed policy, to occur in the first half of the year. This is despite the ongoing inflation risks in the US, which we expect to be a binding constraint on further easing beyond the cumulative 50bp we have now pencilled in.
The outlook for RBA policy has shifted in the opposite direction. As we have detailed elsewhere, the higher September quarter inflation print has pushed out the feasible timing of future cash rate cuts. (And if inflation plays out according to the RBA’s forecasts rather than our own, then any cut in the cash rate will take even longer.)
Ordinarily, this shift in interest rate differentials should matter for exchange rates. The usual theory on exchange rate determination is that when interest rates rise in one country relative to another, assets denominated in the first country’s currency are more attractive to investors. Its exchange rate against the other country’s currency should therefore appreciate.
This is not what we have seen lately in AUD/USD. If anything, the AUD has moved sideways, against the USD and other major currencies like the euro since the middle of the year. There are a number of reasons for this.
The first consideration is that our forecasts are not always in line with market pricing, and it is market pricing for rates that feeds into the view for exchange rates. When we set out our view of Fed policy for 2025 at the beginning of the year, our view was far from consensus. Market pricing on the US rates outlook had been more dovish than our house view. Our early-2025 view has turned out to be closer to the actual outcome for the year than what was priced in at the time. However, this means that the additional downside in the rates outlook now emerging for 2026 is not such a departure from what the market had been pricing, just a lot later than it had been pricing.
The second consideration is that it is not just policy rates that matter for the views of participants in currency markets. While some models of AUD fundamentals have used policy rate differentials, it is more common to focus on longer maturities. For example, the RBA’s workhorse MARTIN model uses a two-year differential. There, the story is a bit different. At the 2-year and 3-year maturity, Australian government bond yields legged down in the wake of ‘Liberation Day’ in April and have been drifting up steadily since. US yields at that maturity fell less at the time, because the US was the source of the policy and tariff-related inflation that had changed the policy outlook there. They have since been drifting down, narrowing the spread to Australian yields; at this maturity, Australian yields are now higher than their US equivalents. Again, this would suggest appreciation pressure on the AUD relative to the USD, but not on the timing implied by shifting views on the monetary policy outlook.
More broadly, other asset returns and expectations also matter to asset allocation decisions across economies, especially equities, which then drives flow demand for particular currencies. These are currently working in the opposite direction to the pressures implied by interest differentials. Because the current AI boom is so focused on a few US-domiciled firms, shifting investor views of the sector and these firms find their expression in global flows into US equity markets and related infrastructure assets and thus the USD. The ebb and flow of investor concerns about US trade policy also manifests in relative asset demand and so exchange rates.
There are parallels here with the late 1990s and early 2000s ‘dot com’ boom. That boom, too, was highly concentrated in a tech sector predominantly located in the US or at least listed on the US stock market. Australia was seen as an ‘old economy’ and did not receive the same interest from investors as the US did. Accordingly, the AUD was noticeably undervalued then, at the same time the USD was almost as overvalued as it was at the beginning of this year.
At the beginning of this year, the USD hit peak overvaluation at the same time as ‘US exceptionalism’ narratives reached their zenith. These both unwound in the first half of the year, as we have previously detailed. More recently, as trade tensions have eased and deals have been done, some of the downside risk to US prospects have faded and been priced out of the USD exchange rate, which has therefore shown some resilience in recent weeks.
The USD is still overvalued on standard metrics, though. There are a range of ways to assess this, but a standard one is just the ‘real effective exchange rate’ – trade-weighted indices adjusted for relative inflation rates. These are available from a range of sources including the IMF and most central banks, including the RBA for the AUD.
Using the Fed’s “Broad Index”, the USD is about 15% above its longer-run average, compared with more than 20% earlier in the year. History would suggest that this overvaluation will correct itself over the course of several years. Investors want to be less long the USD in the wake of policy developments in the US. But they are also mindful that an overvalued exchange rate does tend to mean-revert over time, and therefore they want to avoid future capital losses relative to holding assets denominated in other currencies.
All this suggests that AUD should still appreciate against USD over the next few years. This is a USD story not a AUD story, though. And because so much hangs on sentiment, it could happen in fits and starts.
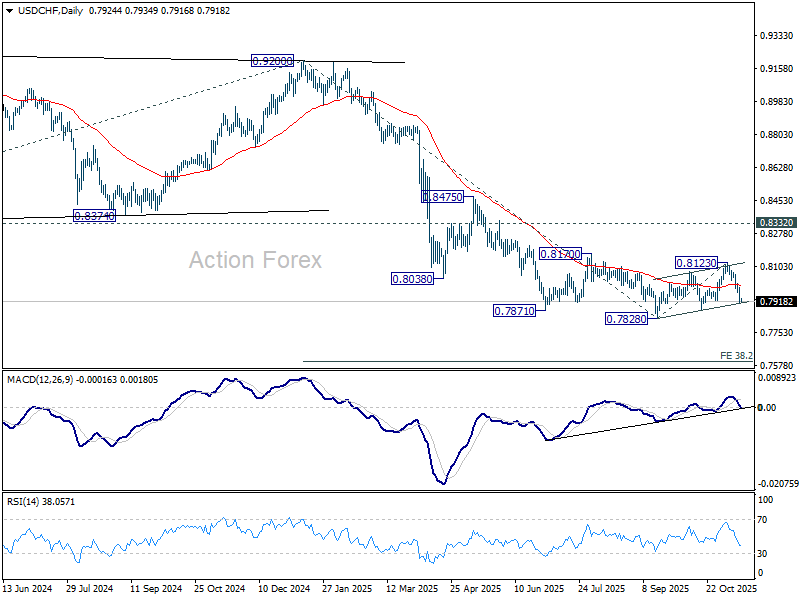
USD/CHF Daily Outlook
Daily Pivots: (S1) 0.7894; (P) 0.7944; (R1) 0.7979; More…
Intraday bias in USD/CHF remains on the downside as fall from 0.8123 is in progress. Decisive break of 0.7872 support will argue that down trend is ready to resume. Break of 0.7828 will target 38.2% projection of 0.9200 to 0.7828 from 0.8123 at 0.7599. On the upside, above 0.7993 minor resistance will delay the bearish case and bring more consolidations first.
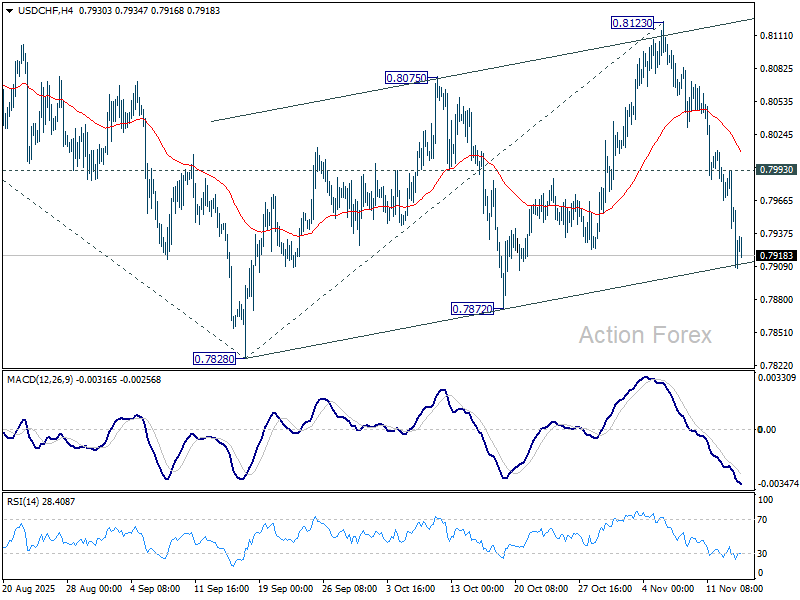
In the bigger picture, long term down trend from 1.0342 (2017 high) is still in progress. Next target is 100% projection of 1.0146 (2022 high) to 0.8332 from 0.9200 at 0.7382. In any case, outlook will stay bearish as long as 0.8332 support turned resistance holds (2023 low).
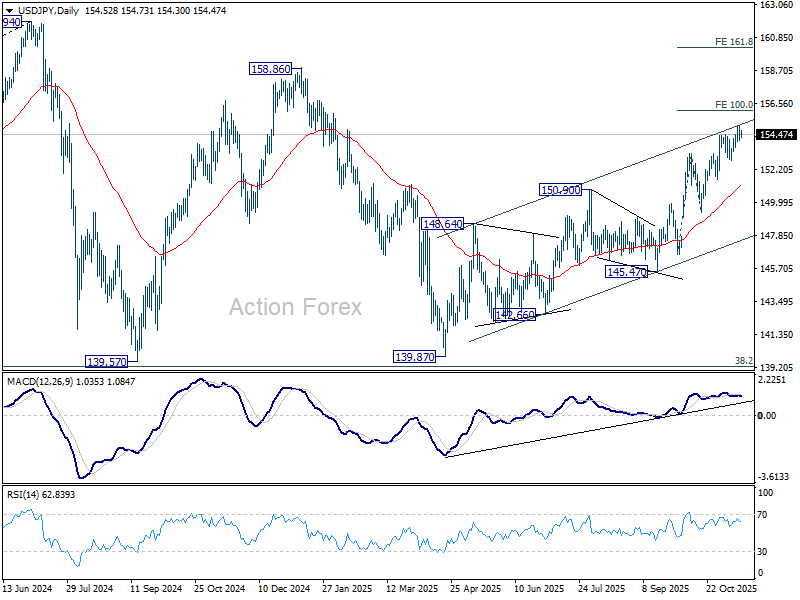
USD/JPY Daily Outlook
Daily Pivots: (S1) 154.10; (P) 154.56; (R1) 154.98; More...
Intraday bias in USD/JPY is turned neutral with current retreat. Some consolidations would be seen below 155.03 temporary top, but further rally is expected as long as 152.81 support holds. Above 155.03 will resume the rise from 139.87 to 100% projection of 146.58 to 153.26 from 149.37 at 156.05. Firm break there will pave the way to 158.86 key structural resistance.
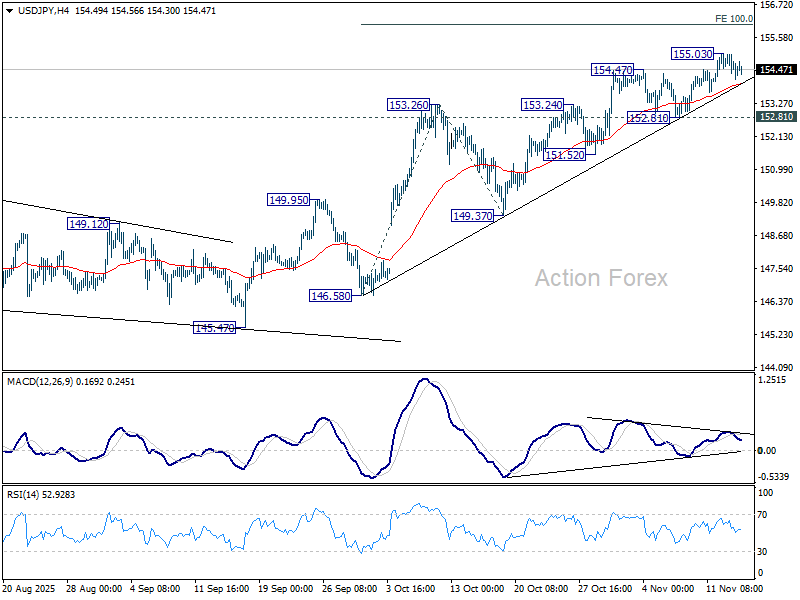
In the bigger picture, current development suggests that corrective pattern from 161.94 (2024 high) has completed with three waves at 139.87. Larger up trend from 102.58 (2021 low) could be ready to resume through 161.94 high. On the downside, break of 149.37 support will dampen this bullish view and extend the corrective pattern with another falling leg.