
Sample Category Title
EUR/AUD Daily Outlook
Daily Pivots: (S1) 1.7685; (P) 1.7767; (R1) 1.7903; More...
EUR/AUD recovered notably but stays in range of 1.7561/7895 and intraday bias remains neutral. On the downside, break of 1.7561 support will revive the bearish case that corrective pattern from 1.8554 is in the third leg, and target 1.7245 support. On the upside, though, above 1.7895 will resume the rebound from 1.7561 to 1.8160 resistance next.
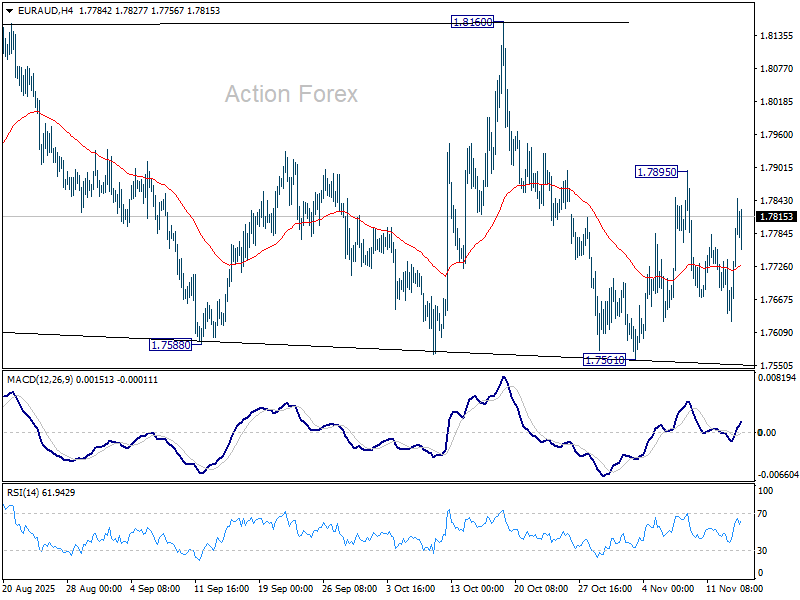
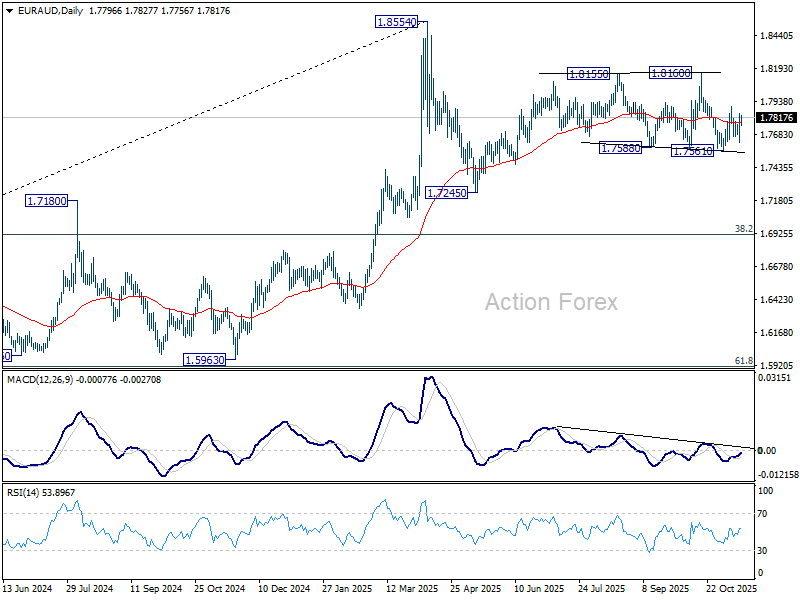
In the bigger picture, price actions from 1.8554 medium term top are seen as a corrective pattern. Sustained break of 55 W EMA (now at 1.7424) will suggest that it's correcting the whole rally from 1.4281 (2022 low). In this case, deeper decline would be seen to 38.2% retracement of 1.4281 to 1.8554 at 1.6922. Nevertheless, strong rebound form 55 W EMA will likely bring resumption of the up trend sooner.
EUR/CHF Daily Outlook
Daily Pivots: (S1) 0.9207; (P) 0.9233; (R1) 0.9252; More....
Intraday bias in EUR/CHF remains on the downside for 0.9204/8 support zone. Break there will confirm larger down trend resumption. Next near term target is 61.8% projection of 0.9452 to 0.9208 from 0.9325 at 0.9175. Decisive break there could prompt downside acceleration to 100% projection at 0.9082. On the upside, above 0.9256 minor resistance will delay the bearish case and turn bias neutral first.
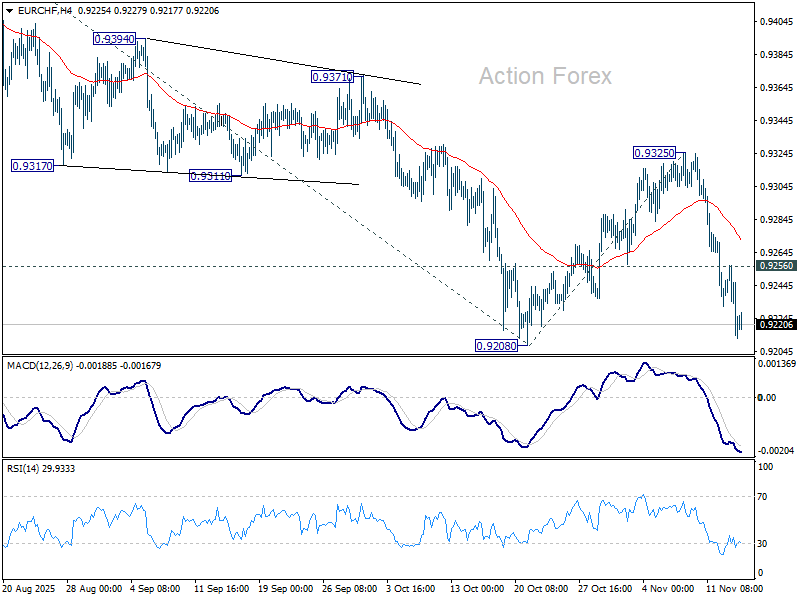
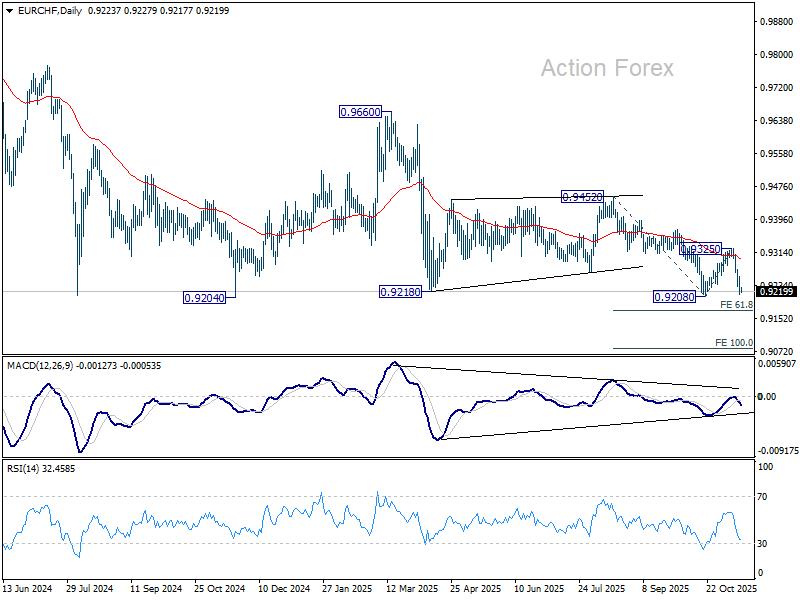
In the bigger picture, outlook remains bearish with EUR/CHF staying well inside long term falling channel after multiple rejection by 55 W EMA (now at 0.9383). Firm break of 0.9204 will resume the whole down trend from 1.2004 (2018 high). Next target is 61.8% projection of 1.1149 to 0.9407 from 0.9928 at 0.8851. However, break of 0.9452 resistance will now be the first sign of medium term bottoming.
Risk-Off Rekindled by Fed Pushback and Deepening China Weakness
Risk aversion returned forcefully overnight, with Wall Street suffering its steepest daily decline in a month as investors unwound exposures. The reopening of the U.S. government offered no support to sentiment, with markets instead refocusing on the prospect that a December Fed rate cut is far from assured. Comments from several Fed officials pushed back against aggressive easing expectations, prompting Fed fund futures to mark down the odds of a December cut to around 50%, from nearly 70% just one week ago. The shift revived concerns that policy support may not arrive as early as traders had hoped.
Technology stocks bore the brunt of the selloff. Major AI leaders, including Nvidia and other semiconductor names, saw another round of heavy liquidation, a stark reversal from the early-week relief rally. It appears the market’s concern over stretched AI valuations was only temporarily set aside—not dismissed.
Asian sentiment followed the U.S. lower, with Nikkei and Kospi leading declines. SoftBank’s sharp plunge, extending a third day of heavy losses after confirming on Tuesday that it had sold its entire Nvidia stake, added an extra drag to regional tech shares.
China offered no cushion. Fresh data showed an even deeper slowdown in October, driven by weak consumer demand, falling investment, and the ongoing property downturn. The soft tone reinforced the perception that China’s recovery remains uneven and fragile.
Nevertheless, there was one constructive development on the trade front. The U.S. and Switzerland moved closer to a deal that could reduce the crippling 39% U.S. tariffs on Swiss imports. After talks in Washington, both sides described discussions as “very positive,” with Swiss Economy Minister Guy Parmelin saying virtually all issues were clarified.
An unnamed Swiss official said a deal has been effectively reached, pending final approval from US President Donald Trump. A senior U.S. official echoed the optimism, adding that Switzerland had presented a plan to reduce its trade surplus with the U.S. and lower non-tariff barriers, creating a path for tariff reductions if the White House signs off.
In the currency markets, Swiss Franc remains the strongest performer this week, benefiting from safe-haven flows and expectations of a breakthrough in trade negotiations. Kiwi and Aussie hold second and third place but are starting to look vulnerable as risk sentiment deteriorates.
At the other end of the spectrum, Yen remains pinned at the bottom, pressured by expectations that the BoJ will delay its long-anticipated hike until January at the earliest. Sterling is the second weakest as soft data reinforce BoE cut expectations for December. Dollar sits third-weakest, while Euro and Loonie are positioned in the middle of the weekly rankings.
In Asia, at the time of writing, Nikkei is down -1.59%. Hong Kong HSI is down -1.26%. China Shanghai SSE is down -0.16%. Singapore Strait Times is down -0.78%. Japan 10-year JGB yield is up 0.008 at 1.699. Overnight, DOW fell -1.65%. S&P 500 fell -1.66%. NASDAQ fell -2.29%. 10-year yield rose 0.047 to 4.112.
China industrial production slows to 4.9% yoy in October, investment contraction deepens
China’s October activity data pointed to a loss of momentum, with industrial production rising 4.9% yoy, down from September’s 6.5% yoy and below expectations of 5.6%. It marks the weakest annual pace since August 2024.
Retail sales also slowed, rising 2.9% yoy compared with 3.0% in September, though slightly outperforming expectations of 2.7% yoy. Still, it was the slowest pace since August last year, underscoring persistently cautious household demand. Excluding autos, consumer goods retail sales rose a firmer 4.0%, suggesting pockets of resilience but not enough to anchor a broad consumption recovery.
More concerning was the continued drag from investment: fixed asset investment fell -1.7% ytd yoy, deteriorating from -0.5% and missing expectations of -0.7%. Private-sector investment remained under heavy pressure, dropping -4.5%, underscoring structural weakness in confidence, property-linked spillovers, and limited risk appetite.
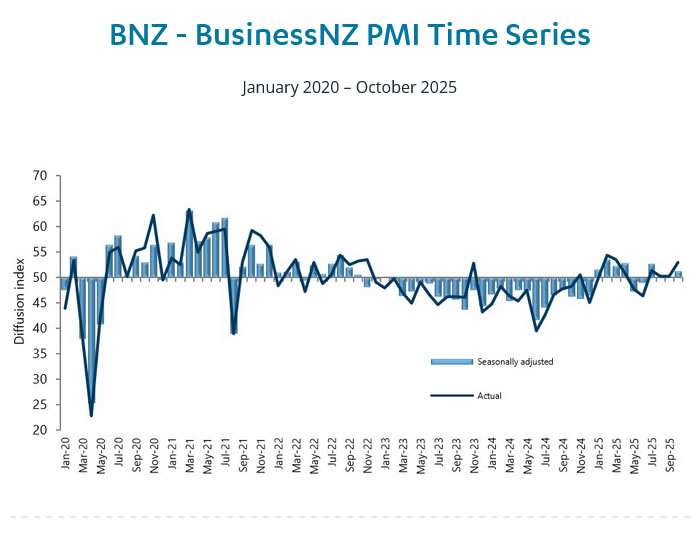
New Zealand BNZ PMI at 51.4 as orders hit three-year high
New Zealand’s manufacturing sector showed further improvement in October, with BusinessNZ PMI rising from 50.1 to 51.4, marking a fourth straight month above 50. While still below the long-term average of 52.4, the sector is now experiencing its most sustained period of expansion in three years, hinting that the worst of the downturn may be behind it.
The details were encouraging: production improved from 50.5 to 52.0. New orders jumped from 50.5 to 54.9, the strongest pace since August 2022 and a key sign that demand conditions are firming. Employment remained in contraction at 48.1, up from 47.7, but even that component showed stabilization after six months of declines.
BusinessNZ’s Catherine Beard said October brought “more signs of life” after months of stagnation. The share of negative respondent comments fell from 60.2% to 54.1%, with many firms reporting stronger orders, seasonal demand, new customers, and productivity gains driven by process improvements and automation.
EUR/CHF Daily Outlook
Daily Pivots: (S1) 0.9207; (P) 0.9233; (R1) 0.9252; More....
Intraday bias in EUR/CHF remains on the downside for 0.9204/8 support zone. Break there will confirm larger down trend resumption. Next near term target is 61.8% projection of 0.9452 to 0.9208 from 0.9325 at 0.9175. Decisive break there could prompt downside acceleration to 100% projection at 0.9082. On the upside, above 0.9256 minor resistance will delay the bearish case and turn bias neutral first.
In the bigger picture, outlook remains bearish with EUR/CHF staying well inside long term falling channel after multiple rejection by 55 W EMA (now at 0.9383). Firm break of 0.9204 will resume the whole down trend from 1.2004 (2018 high). Next target is 61.8% projection of 1.1149 to 0.9407 from 0.9928 at 0.8851. However, break of 0.9452 resistance will now be the first sign of medium term bottoming.
China industrial production slows to 4.9% yoy in October, investment contraction deepens
China’s October activity data pointed to a loss of momentum, with industrial production rising 4.9% yoy, down from September’s 6.5% yoy and below expectations of 5.6%. It marks the weakest annual pace since August 2024.
Retail sales also slowed, rising 2.9% yoy compared with 3.0% in September, though slightly outperforming expectations of 2.7% yoy. Still, it was the slowest pace since August last year, underscoring persistently cautious household demand. Excluding autos, consumer goods retail sales rose a firmer 4.0%, suggesting pockets of resilience but not enough to anchor a broad consumption recovery.
More concerning was the continued drag from investment: fixed asset investment fell -1.7% ytd yoy, deteriorating from -0.5% and missing expectations of -0.7%. Private-sector investment remained under heavy pressure, dropping -4.5%, underscoring structural weakness in confidence, property-linked spillovers, and limited risk appetite.
USD/JPY Targets Breakout as Bullish Pressure Builds
Key Highlights
- USD/JPY remained supported above the 154.00 zone.
- A key bullish trend line is forming with support at 154.15 on the 4-hour chart.
- EUR/USD recovered some losses and climbed above 1.1580.
- GBP/USD still faces hurdles near 1.3200 and 1.3240.
USD/JPY Technical Analysis
The US Dollar settled above the 152.00 pivot level against the Japanese Yen. USD/JPY tested 155.00 before there was a short-term correction.
Looking at the 4-hour chart, the pair remained supported above 154.00, the 100 simple moving average (red, 4-hour), and the 200 simple moving average (green, 4-hour). On the downside, there is a key bullish trend line forming with support at 154.15.
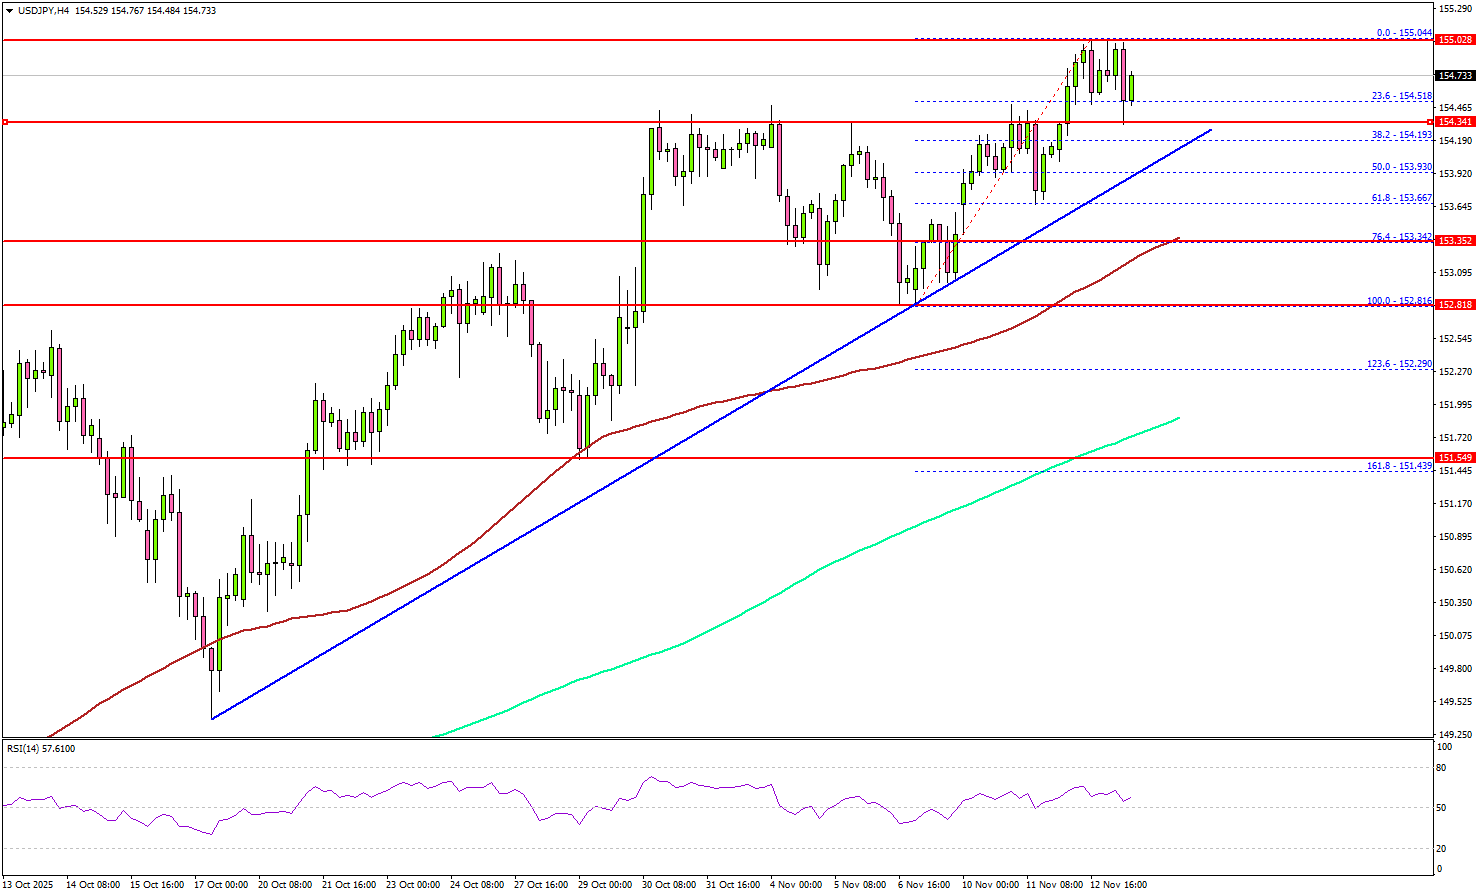
On the upside, the pair faces resistance near the 155.00 zone. The first key hurdle sits at 155.50. A close above 155.50 might send the pair higher toward 156.20.
The next resistance could be 156.50. Any more gains could set the pace for a steady increase toward 158.00. On the downside, the pair might find support at 154.00 and the trend line. The main support might be 153.35 and the 100 simple moving average (red, 4-hour).
A close below the 153.35 zone could start a pullback toward 152.00 and the 200 simple moving average (green, 4-hour). Any more losses might open the doors for a test of 151.00.
Looking at EUR/USD, the pair started a recovery wave above 1.1580 and now faces tough resistance near 1.1650.
Upcoming Key Economic Events:
- US Retail Sales for Oct 2025 (MoM) – Forecast +0.4%, versus +0.6% previous.
- US Producer Price Index for Oct 2025 (MoM) – Forecast +0.3%, versus -0.1% previous.
- US Producer Price Index for Oct 2025 (YoY) – Forecast +2.6%, versus +2.6% previous.
New Zealand BNZ PMI at 51.4 as orders hit three-year high
New Zealand’s manufacturing sector showed further improvement in October, with BusinessNZ PMI rising from 50.1 to 51.4, marking a fourth straight month above 50. While still below the long-term average of 52.4, the sector is now experiencing its most sustained period of expansion in three years, hinting that the worst of the downturn may be behind it.
The details were encouraging: production improved from 50.5 to 52.0. New orders jumped from 50.5 to 54.9, the strongest pace since August 2022 and a key sign that demand conditions are firming. Employment remained in contraction at 48.1, up from 47.7, but even that component showed stabilization after six months of declines.
BusinessNZ’s Catherine Beard said October brought “more signs of life” after months of stagnation. The share of negative respondent comments fell from 60.2% to 54.1%, with many firms reporting stronger orders, seasonal demand, new customers, and productivity gains driven by process improvements and automation.
Cliff Notes: On the Bright Side
Key insights from the week that was.
In Australia, the week’s dataflow kicked off with a bang as Westpac-MI Consumer Sentiment surged 12.8% in November to 103.8, the first reading above the optimist / pessimist divide since the economy reopened after the ‘delta’ outbreak. A calmer geopolitical backdrop following the de-escalation of US-China trade tensions and a more assured domestic recovery look to be behind the result.
While respondents showed some renewed concerns over inflation and the interest rate outlook, these negatives were offset. It is interesting to note that responses received after the RBA’s November decision were positive, suggesting the Board’s decision and communications were construed as measured rather than outright hawkish.
On balance, these factors led to a significant improvement in views on the economic outlook for one year (+16.6%) and five years (+15.3%). The ‘time to buy a major household item’ sub-index also jumped (+14.9%); together with less-restrained intentions for Christmas spending, this outcome suggests the foundation for the consumer recovery is firming. Positive wealth effects associated with the housing upswing are arguably also at play, as evinced by strong investor-led growth in home lending and Westpac-MI house price expectations moving to a new cycle high.
While consumers have grown more anxious on the jobs outlook, this week’s labour force data confirmed that the labour market is only softening at a very gradual pace. Employment was firmer-than-expected in the month, rising +42.2k, keeping annual growth steady at 1.5% on a three-month average basis. The unemployment rate also fell from a ‘thin’ 4.5% in September to a ‘fat’ 4.3% in October (–0.1ppt from 4.45% to 4.34%). Looking through the noise, the steady-but-modest uptrend in the unemployment rate in place throughout 2025 remains intact. At its current level, the unemployment rate is broadly consistent with full employment – indicative of a labour market in good health but which poses little-to-no risk to inflation via wages.
The rebalancing of employment growth from the ‘jobs-rich’, public-funded care economy to the less ‘jobs-intensive’ market sector is a key driver of the softening employment trend. The latest NAB business survey suggests this transition remains in good stead, the business conditions index rising to its highest level since March 2024. Confidence is re-emerging but remains fragile. Given the weak starting point for investment, businesses might hold off on capacity expansion.
The main development offshore this week was US Congressional approval to end the government shutdown in place since the beginning of October. While a welcome development, another partial shutdown from the end of January is a distinct possibility, with only the Departments of Agriculture and Veteran’s Affairs, the Food and Drug Administration, military construction projects and Congress funded through to end-September. There is no guarantee a vote on extending the Obamacare subsidies will pass over year end, and so debate is likely to remain highly politicised over funding the remainder of the Government from February.
In coming weeks, US statistical agencies will attempt to bring the dataflow back up to date, though the market has already been told some upcoming releases will be incomplete. FOMC members, by and large, continue to focus attention on inflation risks, viewing these as more significant and immediate than the labour market’s ongoing deceleration. Arguably then, it will take a material deterioration in conditions for the Committee to ease again at the December meeting.
Ethereum Drops Another 3% Below $3,500 – Time for Panic or Opportunity?
Risk assets have been yo-yoing since mid-October, with fundamentals turning increasingly obscure amid the absence of US data, leaving investors hesitant to take on new risk.
Cryptocurrencies have also been flashing mixed signals following the early-October rallies in Bitcoin, Solana, and Ethereum.
Despite ongoing market cap outflows, the crypto space has made solid progress this year.
Screenshot 2025-11-13 at 11.15.59 AM
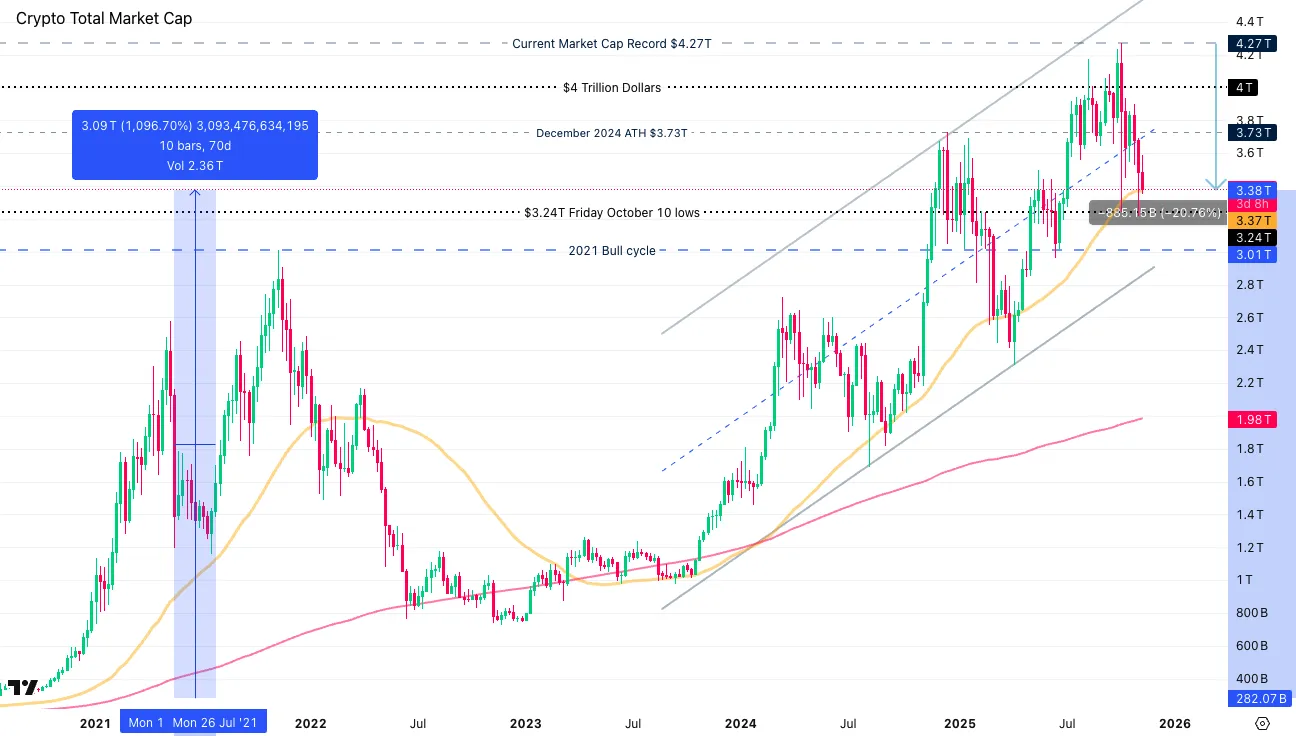
Crypto Total Market Cap Weekly Chart, November 13, 2025 – Source: TradingView
Still, with prices now down roughly 32% from the $4,950 August peak, the hype in ETH has cooled substantially.
Yet, it’s often when fewer people are watching that true opportunities emerge—though the question remains: is this a dip to buy or a reason to panic?
Overstretched tech valuations continue to weigh on markets, as reflected in today's weakness across stock indices, and crypto is facing similar pressure.
From an investment standpoint, the long term will reveal its truth—but for those without a crystal ball, a prudent approach is Dollar-Cost Averaging (DCA), which involves gradually building positions over time.
For traders, the focus should stay on support and resistance levels—spotting trends between them and reacting when those levels break.
Let’s now look these levels through a multi-timeframe Ethereum analysis.
Daily overview of the Crypto Market, November 13, 2025 – Source: Finviz
Ethereum (ETH) Multi-timeframe technical analysis
Daily Chart
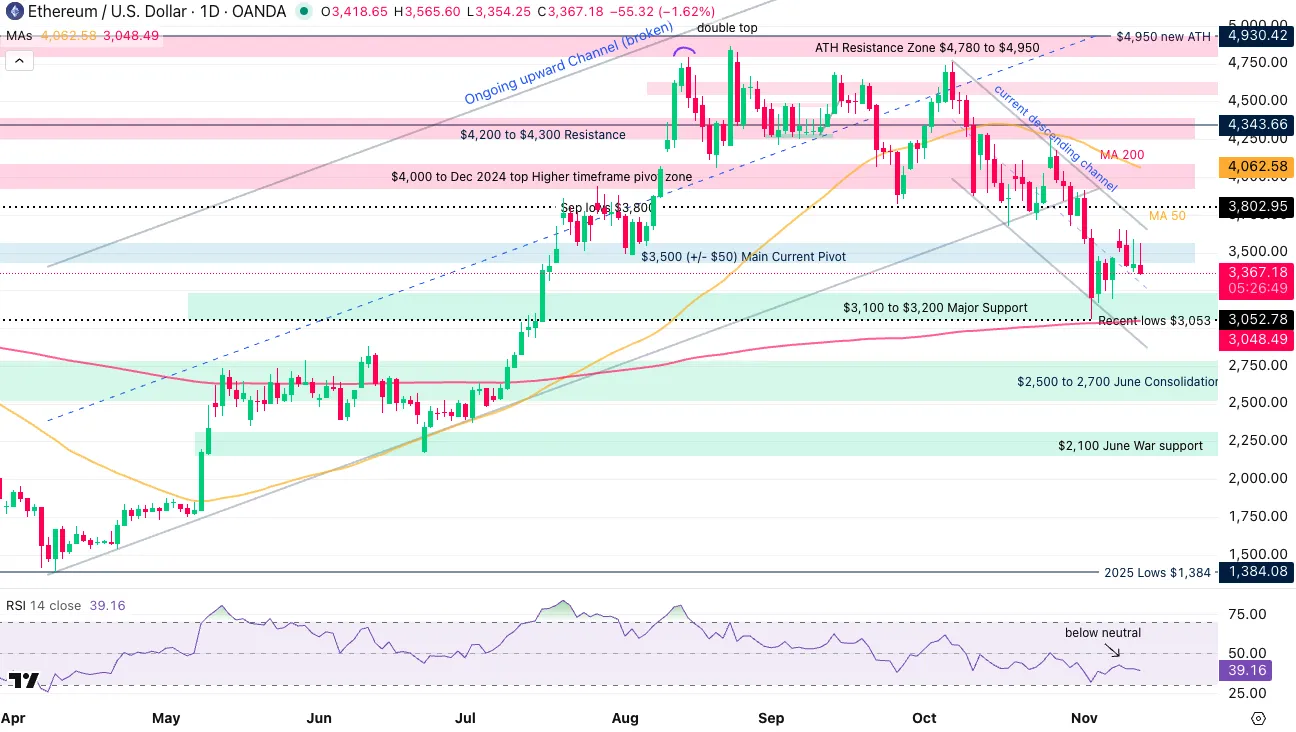
Ethereum (ETH) Daily Chart, November 13, 2025 – Source: TradingView
Having broken its April 2025 explosive upward channel, the picture for ETH is tilting more bearish, as strong flows have brought the second-Crypto below its $3,500 momentum pivot.
Multiple attempts to break resistances have been met with consequent selloffs, leading to the formation of lower-highs.
A balancing rebound last Tuesday (Nov 4) marked a temporary bottom at $3,053 – the rest will be to see if the bottom holds in an eventual double bottom or if its breaks, but for now these prices are still 8% from here (But never underestimate Crypto volatility!).
4H Chart and levels
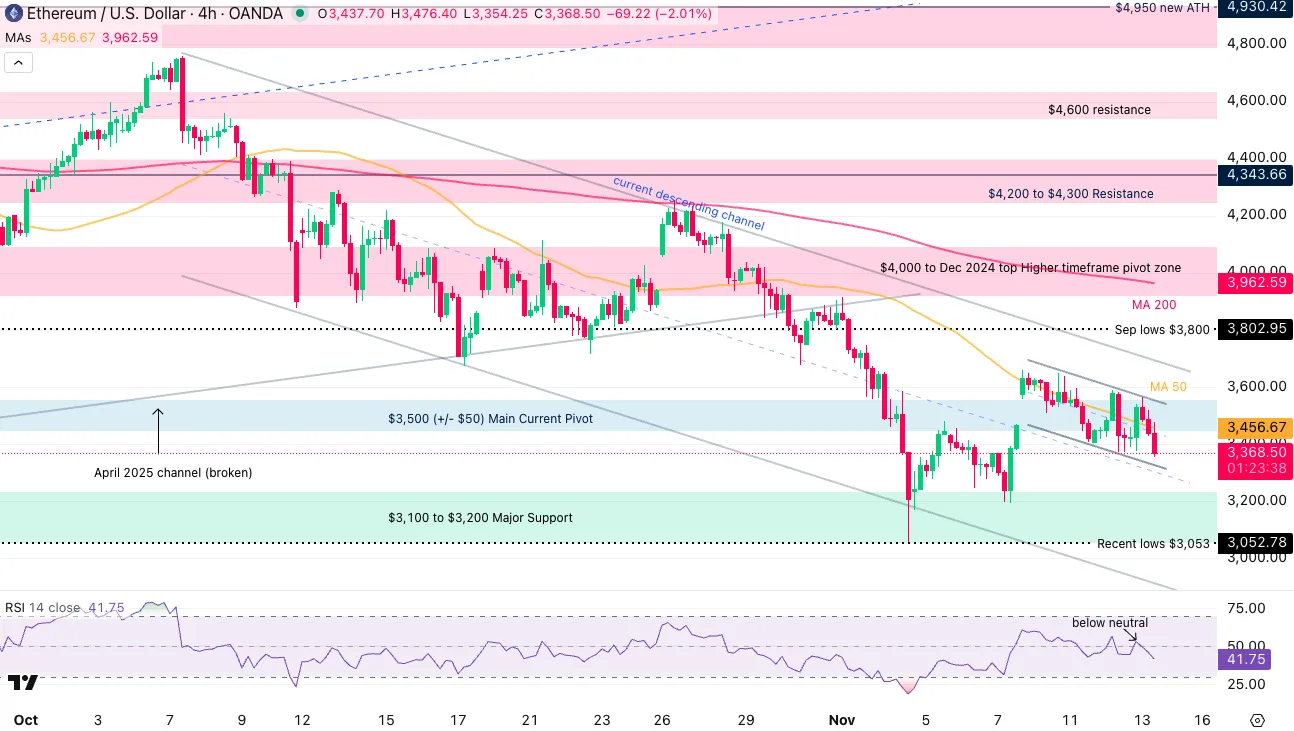
Ethereum (ETH) 4H Chart, November 13, 2025 – Source: TradingView
Levels of interest for ETH trading:
Support Levels:
- $2,100 June War support
- $2,500 to 2,700 June Consolidation
- Recent lows $3,053
- $3,500 (+/- $50) Main Current Pivot
Resistance Levels:
- $3,500 (+/- $50) Main Current Pivot
- $3,650 Descending channel highs
- $3,800 September lows
- $4,000 to Dec 2024 top Higher timeframe pivot zone
- $4,950 Current new All-time highs
1H Chart
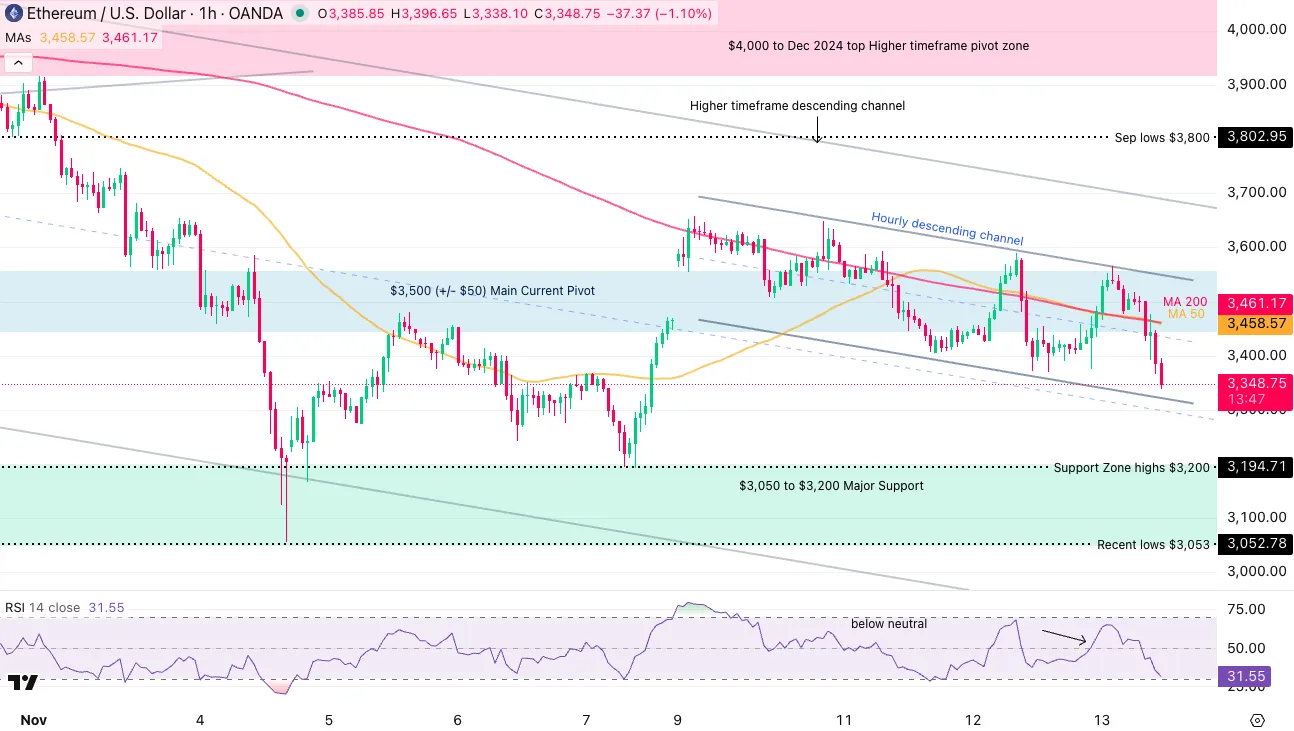
Ethereum (ETH) 1H Chart, November 13, 2025 – Source: TradingView
ETH is oscillating in a shorter timeframe descending channel which serves as immediate momentum indicator:
Breaking below its support line ($3,300 to $3,330) points at more aggressive selling
Bouncing at the lows of the channel points to a short-term revisit of the $3,500 Pivot Zone.
Further upwards, a break above $3,700 (with preferably a session/weekly close), points to a more stable rebound that may serve for future rallies.
Safe Trades!
EUR/USD Jumps from Recent Dollar Weakness and ECB President Talks
The EUR/USD has gained 1.5% since its November 4th bottom, a move that coincided with dovish US private labor data from the Challenger report.
With the U.S. government shutdown beginning to weigh on economic activity, attention has turned toward the Eurozone, which continues to send relatively solid signals:
Inflation remains stable in key economies like Germany and France (see comments from Villeroy), while growth, though modest, remains decent with a 52.5 PMI last week and retail sales up 1% year-over-year.
As confidence grows in the Eurozone’s more politically stable environment—with a few exceptions such as France—and fund managers continue diversifying away from the U.S. dollar, the euro has seen strong dip-buying flows.
Meanwhile, discussions around President Lagarde’s potential successor have emerged, with Knot, Nagel, and De Cos reportedly among the frontrunners—three strong policy voices within the ECB.
By the way, these three members tilt more on the hawkish/conservative side for the Euro, which plays a big role in demand for a currency. This conversation is one to track for the upcoming year, as Christine Lagarde's term finishes in 2027 (except for any early resignation on her part).
Adding to the supportive tone, European Commission President Ursula von der Leyen announced stricter rules on low-cost Chinese imports, a move interpreted as a sign of European strength, as reflected in today’s market reaction (however, there has been some mean reversion since)
Let’s now dive into the EUR/USD rally and spot the key technical levels for the most traded FX pair.
EUR/USD Multi-timeframe technical analysis
Daily Chart

EUR/USD Daily Chart, November 13, 2025 – Source: TradingView
EUR/USD has been on a V-shape recovery since last week, allowing the pair to break above its daily descending channel.
With the RSI turning positive and strong daily candles, the reversal looks decisive.
However, bears may find comfort in the 50-Day Moving Average coming as immediate resistance at 1.16625, right at the 1.1650 to 1.17 Pivot Zone.
Keep an eye on this zone which will serve as momentum guidance: breaking above points to a retest of the 1.18 bound, while rejecting it points to further descent (retest of the 1.15 handle).
Overall, the Daily trend looks like one of rangebound action between just below 1.15 to 1.18 until proven the contrary.
4H Chart and technical levels

EUR/USD 4H Chart, November 13, 2025 – Source: TradingView
Levels to place on your EUR/USD charts:
Resistance Levels
- 1.1650 to 1.17 mid-range Pivot zone
- 1.1750 mini-resistance
- Resistance Zone around 1.18 (+/- 150 pips)
- Sep 2021 Highs – Resistance 1.19 to 1.1950 Zone
- Daily highs 1.1656
Support Levels
- 1.1550 to 1.16 range support
- 4H MA 200 Mini-support 1.16190
- 1.1475 to 1.15 Support Zone
- 1.1350 to 1.14 Support
- Weekly lows 1.15460
1H Chart

EUR/USD 1H Chart, November 13, 2025 – Source: TradingView
The price action has been evolving in a steep hourly upward channel.
However, some sellers appeared right at the entrance of the Pivot zone mentioned in higher timeframes, with the daily highs stalling at 1.15562.
Maintaining the rejection downward could point to a retest of the 1.16 handle which corroborates with the 50-H MA and the uptrend.
However, breaking new highs now would infer bull-dominance in the pair – Closing around the highs (less than 100 pips) mean that they won't give up this ongoing move.
Safe Trades!
DXY Outlook: Dollar Drops After US Government Reopens
The US dollar always moves in complex ways, influenced by a large multitude of factors.
Some are straightforward, like a demand for the USD when the US economy performs better than its peers or when investors seek exposure to US assets and Stocks.
Some dollar dynamics are more obscure, like the link between dollar strength and expected change in paths for the Fed (sometimes, even a rate cut can boost the dollar – assuming communication is not dovish) or the even more confusing banking demand for dollar funding (cross-currency basis swaps, repo dynamics, etc ...)
All of this goes into fundamental analysis for the Greenback – but how weird was its rise in the middle of the longest ever US government shutdown (that just ended)?
Some might say that the shutdown did not significantly influence markets – and they might be right.
Odds for a December cut have been steadily decreasing since Powell's recent speech at the FOMC rate decision conference, from 98% priced in just a week before the event to the current 54%.

Pricing of the next Fed rate cut, November 13, 2025 – Source: CMEGroup
This change of interest rate pricing could have been the reason behind the rise from 97.90 to a peak of 100.37 in the Dollar Index throughout the Government Shutdown period, but this still seems contradictory.
In any case, for traders, pictures are worth a thousand words – Let's dive right into our multi-timeframe US Dollar Index (DXY) analysis.
DXY multi-timeframe analysis
DXY Daily Chart

Dollar Index (DXY) Daily Chart, November 13, 2025 – Source: TradingView
The past month's rise, forming an upward channel, was surprisingly tenace despite the fundamentals.
But moving averages, especially Daily, can act as strong resistances – Look at how prices reacted to the 200-Day MA (currently at 100.125), which just caught up to this year's fall in the DXY.
In yesterday's trading, a test of the lower bound of the upward channel failed, leading to this morning's break lower.
As traders still await for public BLS data, momentum corrects back to neutral – Expect a lot of volatility as economic data makes a comeback.
Its downward tilt hints at a more bearish/mean-reverting price action but a close below the channel would be required for confirmation.
4H Chart and technical levels

Dollar Index (DXY) 4H Chart, November 13, 2025 – Source: TradingView
Levels to place on your DXY charts:
Resistance Levels
- 99.60 to 99.80 mini-resistance
- 100.00 to 100.50 Main resistance zone
- 100.376 November highs
- Top of channel round 100.650
- Weekly highs & 4H 50-period MA 99.74
Support Levels
- Higher timeframe Pivot 98.80 to 99.00 (immediate test)
- Mini-support 98.50
- Main support 98.00
- Session lows 99.152
1H Chart
Dollar Index (DXY) 1H Chart, November 13, 2025 – Source: TradingView
Some small mean-reversion buying is taking place on the shorter timeframe, but below the steep trendline, bears are in control as prices trend in an hourly bear-channel.
Two scenarios can unfold from here:
- A reversal from the channel lows breaks the trendline which hints at a pullback between 99.40 to 99.50 (retest of October channel bound)
- Sellers break the daily lows and test the 98.80 to 99.00 pivot zone
As breakout scenarios don't seem to be materializing for now, the price action looks balanced, but still expect some volatility with this afternoon's Fed speeches: Musalem (2025 voter) and Hammack (2026 voter) go back to back at 13:15.
Fed's Kashkari (2026 voter) will also appear in a few minutes.
And don't forget the 30-year bond auction at 13:00 which can affect the USD and have been getting some traction as of late.
Safe Trades!