
Sample Category Title
1.3000 Line in the Sand: Will GBP/USD Break Higher or Face a Year-End Correction?
GBP has remained on the offensive against the US dollar. This comes despite the series of negative UK data of late which continued this morning.
UK GDP Data Disappoints
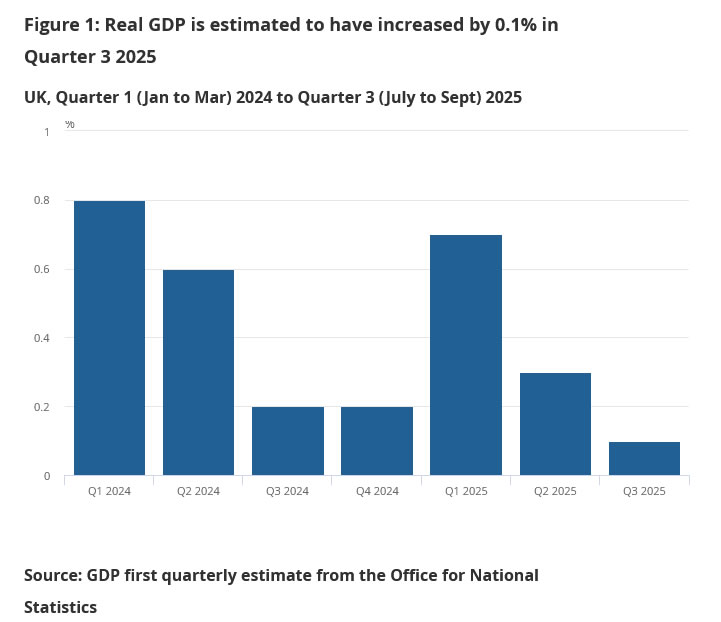
The UK economy grew slightly, by 0.1%, between July and September 2025, which was less than the 0.2% growth market participants had predicted.
The main problem was in the industrial sector, like factories and mining, which shrank by 0.5%. Manufacturing was down, with car making hit especially hard—dropping over 10%—after a cyberattack in September caused major problems for Jaguar Land Rover. The services sector, which includes things like entertainment and real estate, did grow, but at 0.2%, it was slower than the previous quarter. Construction also saw very small growth of 0.1%, mostly from repair jobs, as new building projects actually fell. When looking at the entire year, the economy grew 1.3% compared to the same time last year, which was also slightly below forecasts.
The weak GDP number should add to rate cut expectations from the BoE in December. As you can see the most recent pricing places a 75% probability on a 25bps rate cut.
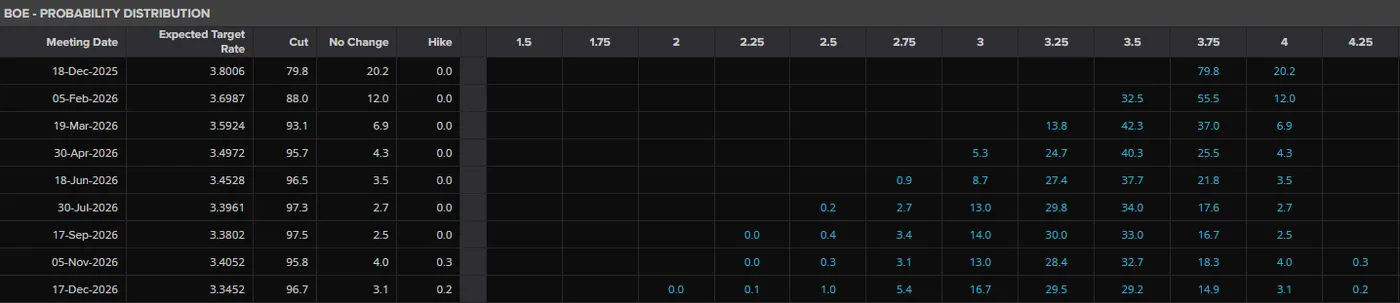
Source: LSEG
UK inflation does however remain elevated at 3.8%, which is well above the 2% target. This keeps market participants on edge and will keep eys on the Bank of England heading into December.
Market Reaction and the US Dollars Role
Cable has remained resilient since the selloff which ended on November 5, just shy of the critical 1.3000 pivot level. A sharp rally followed before a period of consolidation since Friday November 7.
Part of the reason for Cable's rise may be attributed to the US Dollar as well as buyers defending the crucial 1.3000 pivot handle.
From the US Dollar perspective, the end of the US Government shutdown has led to some US Dollar weakness. The dollar is facing rising rate cut bets and declining haven flows as the Government shutdown appears close to being resolved.
US Dollar Index Daily Chart, November 13, 2025
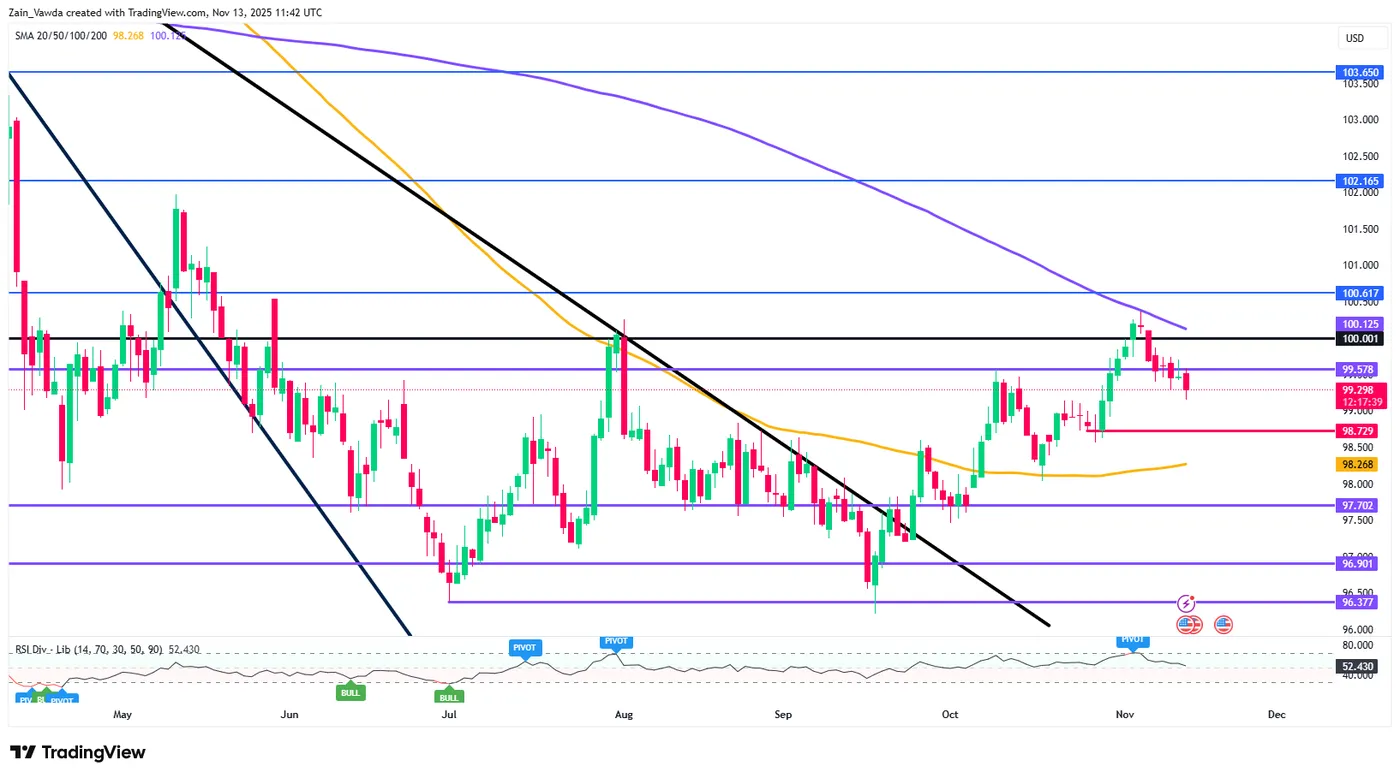
Source: TradingView
This sets the stage for further GBP resilience. However, the UK budget is coming up soon and that could be keeping bulls on a leash as Chancellor Rachel Reeves faces an unenviable task.
UK Budget Ahead
Chancellor Rachel Reeves faces a significant challenge in addressing a fiscal shortfall of approximately £25 billion per year.
Her primary task is to deliver a credible, "market-friendly" budget that closes this gap without unnerving investors or adding to inflation. The Treasury is reportedly keen to avoid any tax hikes, such as on VAT, that could fuel inflation and limit the Bank of England's scope for future rate cuts.
This forces Reeves to find a difficult balance between raising revenue, likely through measures like freezing tax thresholds and increasing bank taxes all the while implementing politically sensitive spending cuts, which markets are skeptical will be delivered. Any failure to demonstrate fiscal discipline risks a negative market reaction, undoing the recent fall in gilt yields.
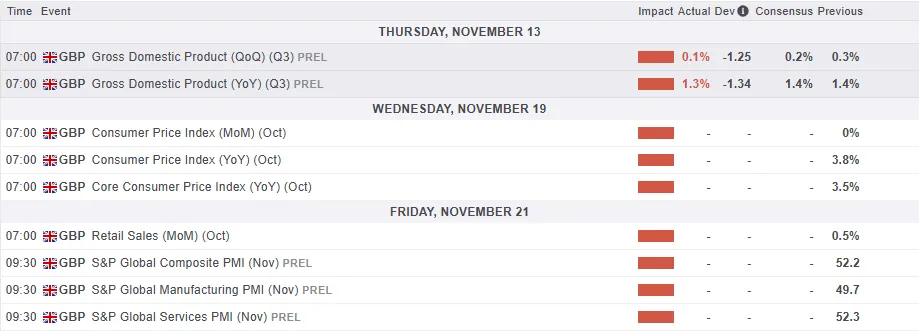
For all market-moving economic releases and events, see the MarketPulse Economic Calendar. (click to enlarge)
Technical Analysis - GBP/USD
From a technical point of view, GBP/USD has been in consolidation since Friday, November 7.
On the four-hour timeframe, there is a red block between the 1.3180 and 1.3100 with a four-hour candle close above opening up the possibility of a move in either direction.
The overarching macro picture points to further upside but bulls may remain slightly hesitant ahead of the UK budget.
Immediate upside resistance is provided by the 100-day MA at 1.31927 before the long-term descending trendline comes into play. Beyond that we have the 200-day MA resting at 1.3300 and resistance around the 1.3333 handles to consider.
The 1.3000 handle remains key for GBP/USD, the longer it holds the more bulls may be emboldened. If the UK fails to inspire a break of that level, GBP/USD may be set to end the year higher.
GBP/USD Daily Chart, November 13, 2025
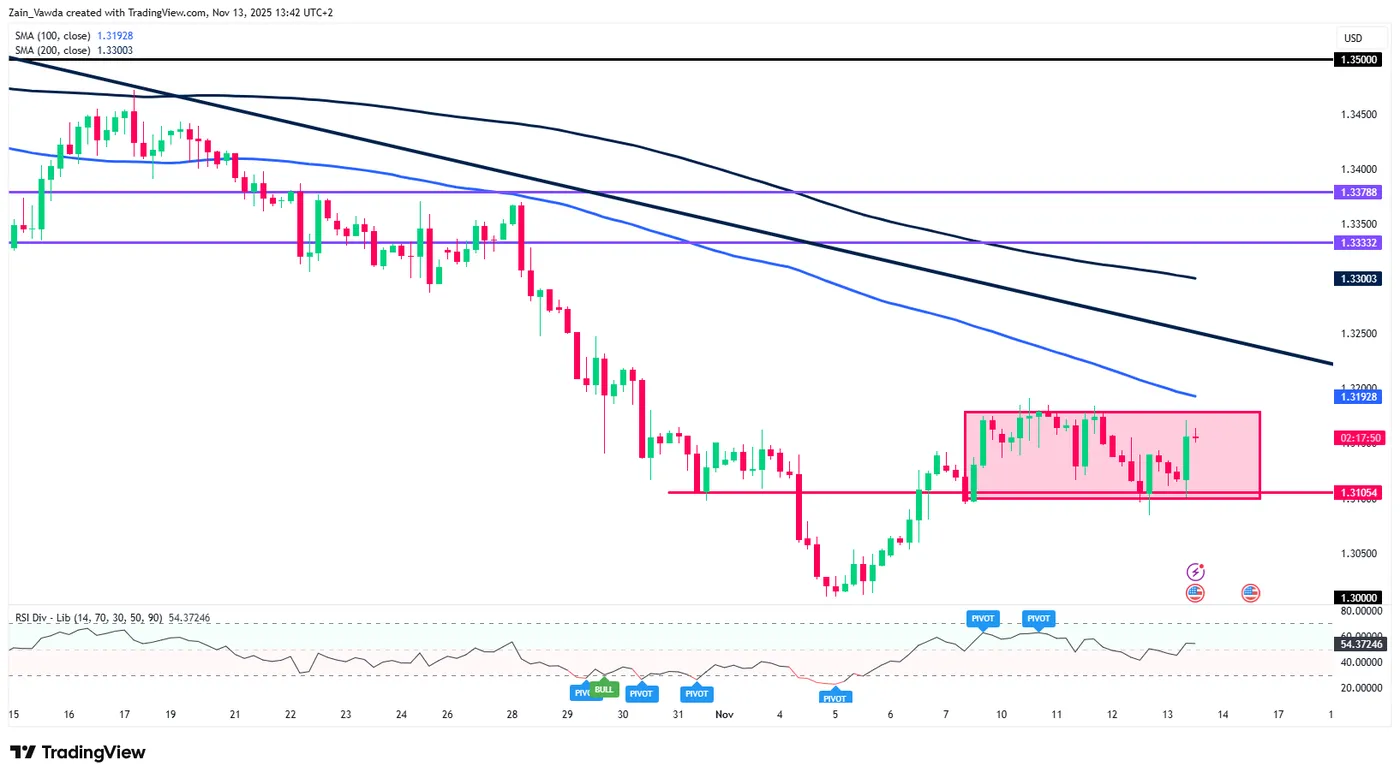
Source: TradingView.com
Cryptocurrency Market Stagnating, Lagging Competitors
Market Overview
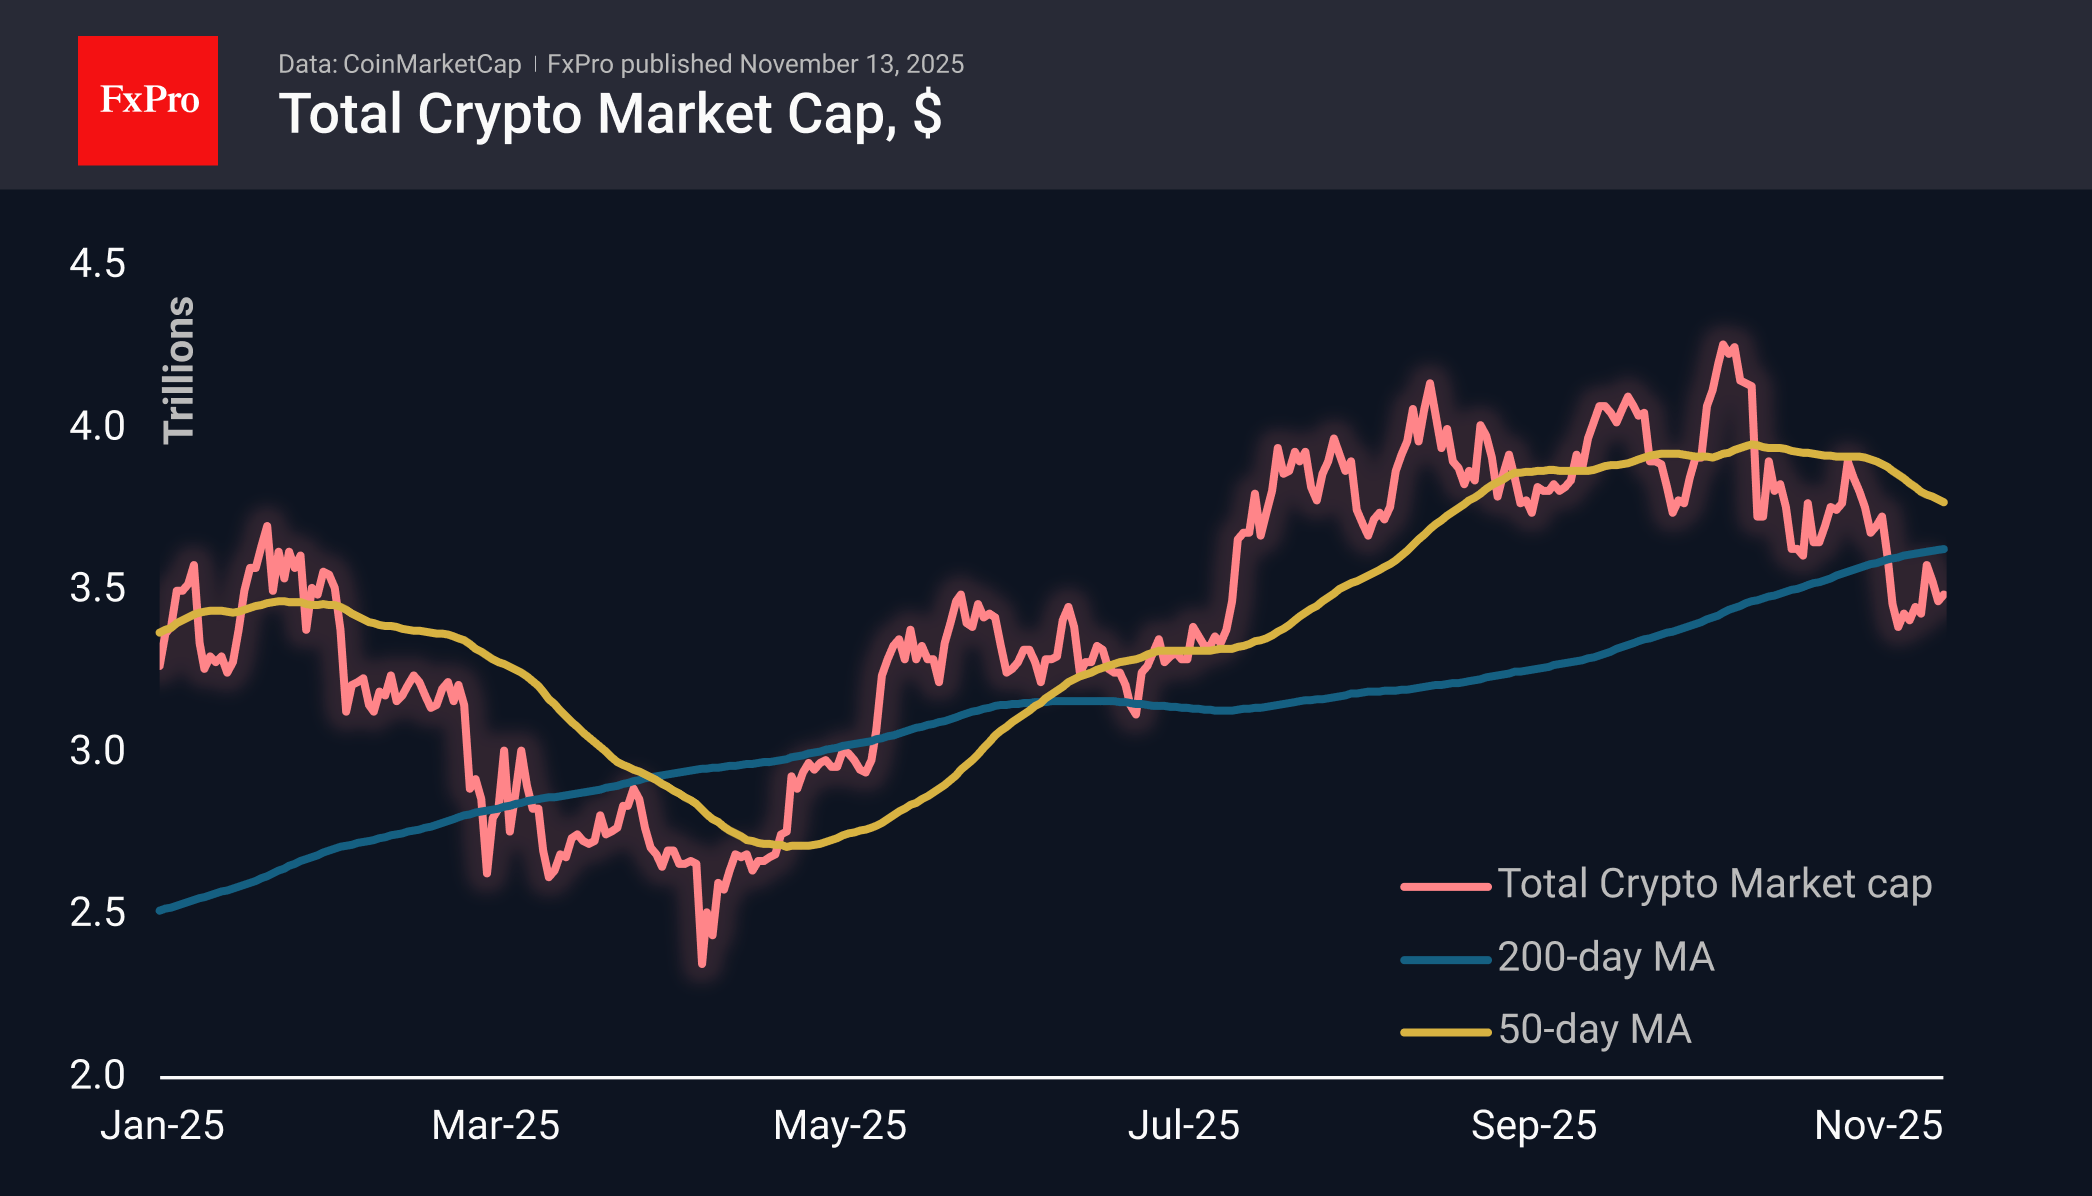
The cryptocurrency market capitalisation has changed little over the past day, fluctuating around $3.5 trillion. The cryptocurrency fear index has fallen to 15, its lowest level since 4 March. Notably, the cryptocurrency market has been left out of the recent rally in precious metals and stock indices. If this is not an attempt by whales to lock in profits from the rally since April or even from the growth of the last two years, then it is an alarming signal of deep-seated risk aversion that is about to manifest itself in larger markets.
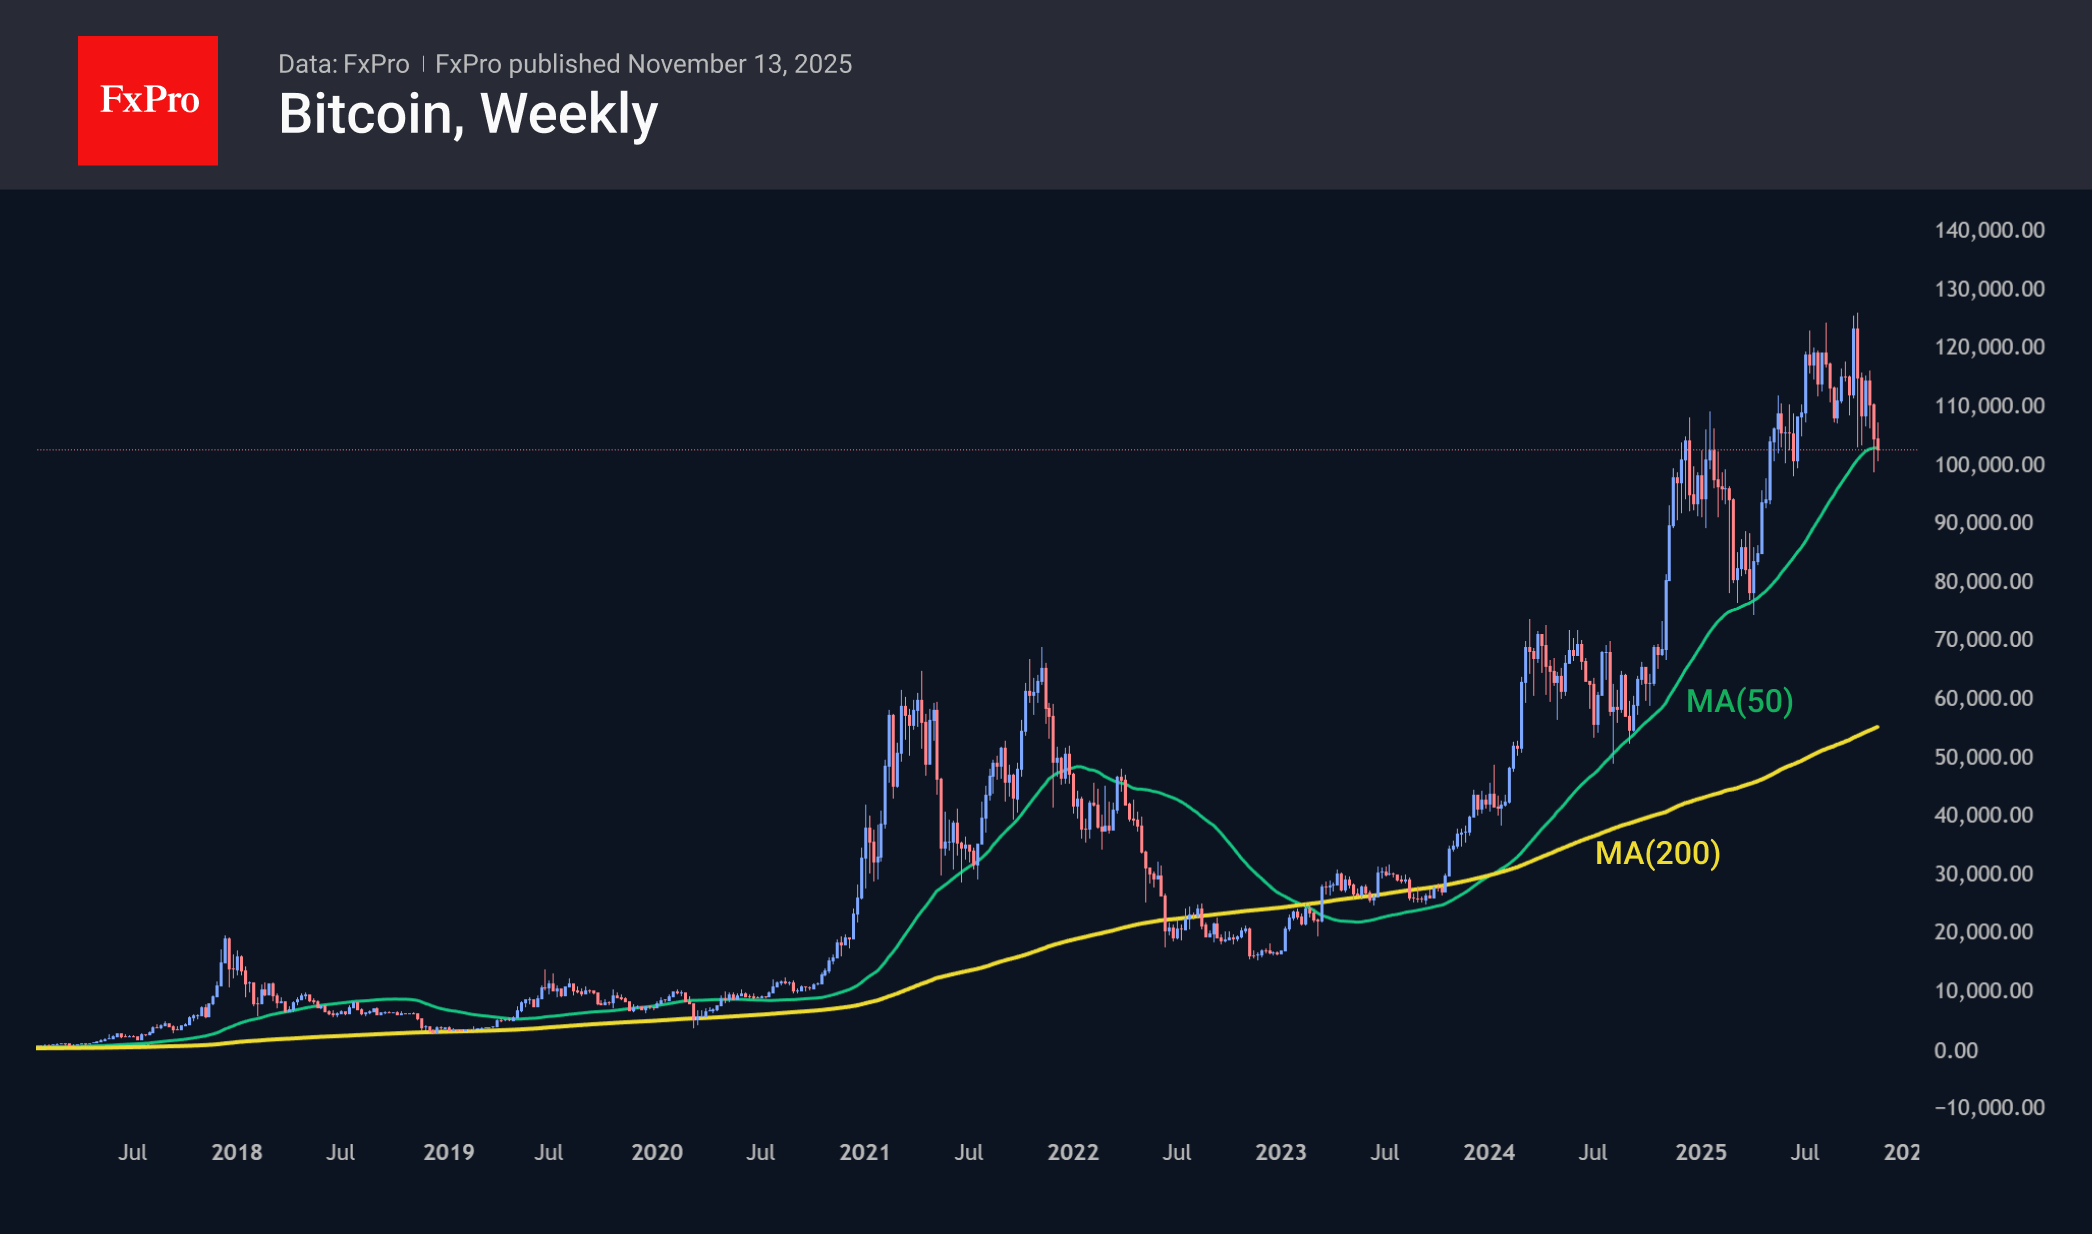
Bitcoin continues to struggle to remain within the bull market on weekly timeframes, trying to stay above the 50-week moving average. Last week’s close was on the edge, and attempts to develop an offensive this week are running into selloffs, despite the favourable external backdrop. The previous such transition occurred at the end of 2021, and so far, everything aligns with the 4-year halving cycles that many were quick to dismiss.
News Background
Over the past three months, a clear break has occurred in the correlation between Bitcoin and the stock market. The S&P 500 stock index has risen 7% during this time, while BTC has lost 15%. Judging by four years of close correlation, it can be argued that Bitcoin is currently undervalued, according to Santiment.
Jan3 founder Samson Mow attributes Bitcoin’s decline to a massive sell-off by investors who bought it over the past 12 to 18 months. They are rushing to lock in profits amid rumours of an imminent bearish trend in the crypto market.
The crypto market’s growth phase is nearing its end, so it is time for investors to consider locking in profits and reducing the share of crypto assets in their portfolios, according to Morgan Stanley, which cites a four-year cycle that the cryptocurrency market has consistently followed since 2009.
The bitcoin mining industry is facing a difficult period due to growing competition and declining profitability, said MARA CEO Fred Thiel. According to him, only those miners who have access to cheap energy or new business models will survive.
According to SoSoValue, spot Solana ETFs in the US have attracted more than $350 million in 11 trading sessions. The steady inflow of funds into new SOL ETFs came as a surprise to the market. The results significantly exceeded initial conservative forecasts, according to LVRG Research.
Visa has unveiled a pilot project called Visa Direct, which allows US customers to make direct cross-border payments in USDC stablecoin to recipients’ wallets. The initiative is aimed at content creators and freelancers.
The crypto industry is entering a new phase of capital raising. The launch of Coinbase’s ICO platform is expected to be a key event in this trend, according to Bitwise. The exchange will select and launch one verified project per month.
EUR/USD Holds Steady as US Government Shutdown Ends
The EUR/USD pair is trading flat on Thursday, hovering around 1.1587, following the House of Representatives' approval of a short-term budget bill that ends the longest US government shutdown in history.
The bill now awaits President Donald Trump's signature – a formality that will allow shuttered government agencies to resume operations within days.
While the resolution clears the way for the publication of a backlog of delayed macroeconomic data, the White House has cautioned that key October reports on employment and inflation may still be withheld from the public.
Market expectations for a December interest rate cut by the Federal Reserve have moderated but persist. The probability of a 25-basis-point cut has eased to 60%, down from 67% the day before.
This cautious sentiment was fuelled earlier in the week by ADP data, which showed that the US private sector shed an average of 11,250 jobs per week throughout October, amplifying concerns over a cooling labour market.
Technical Analysis: EUR/USD
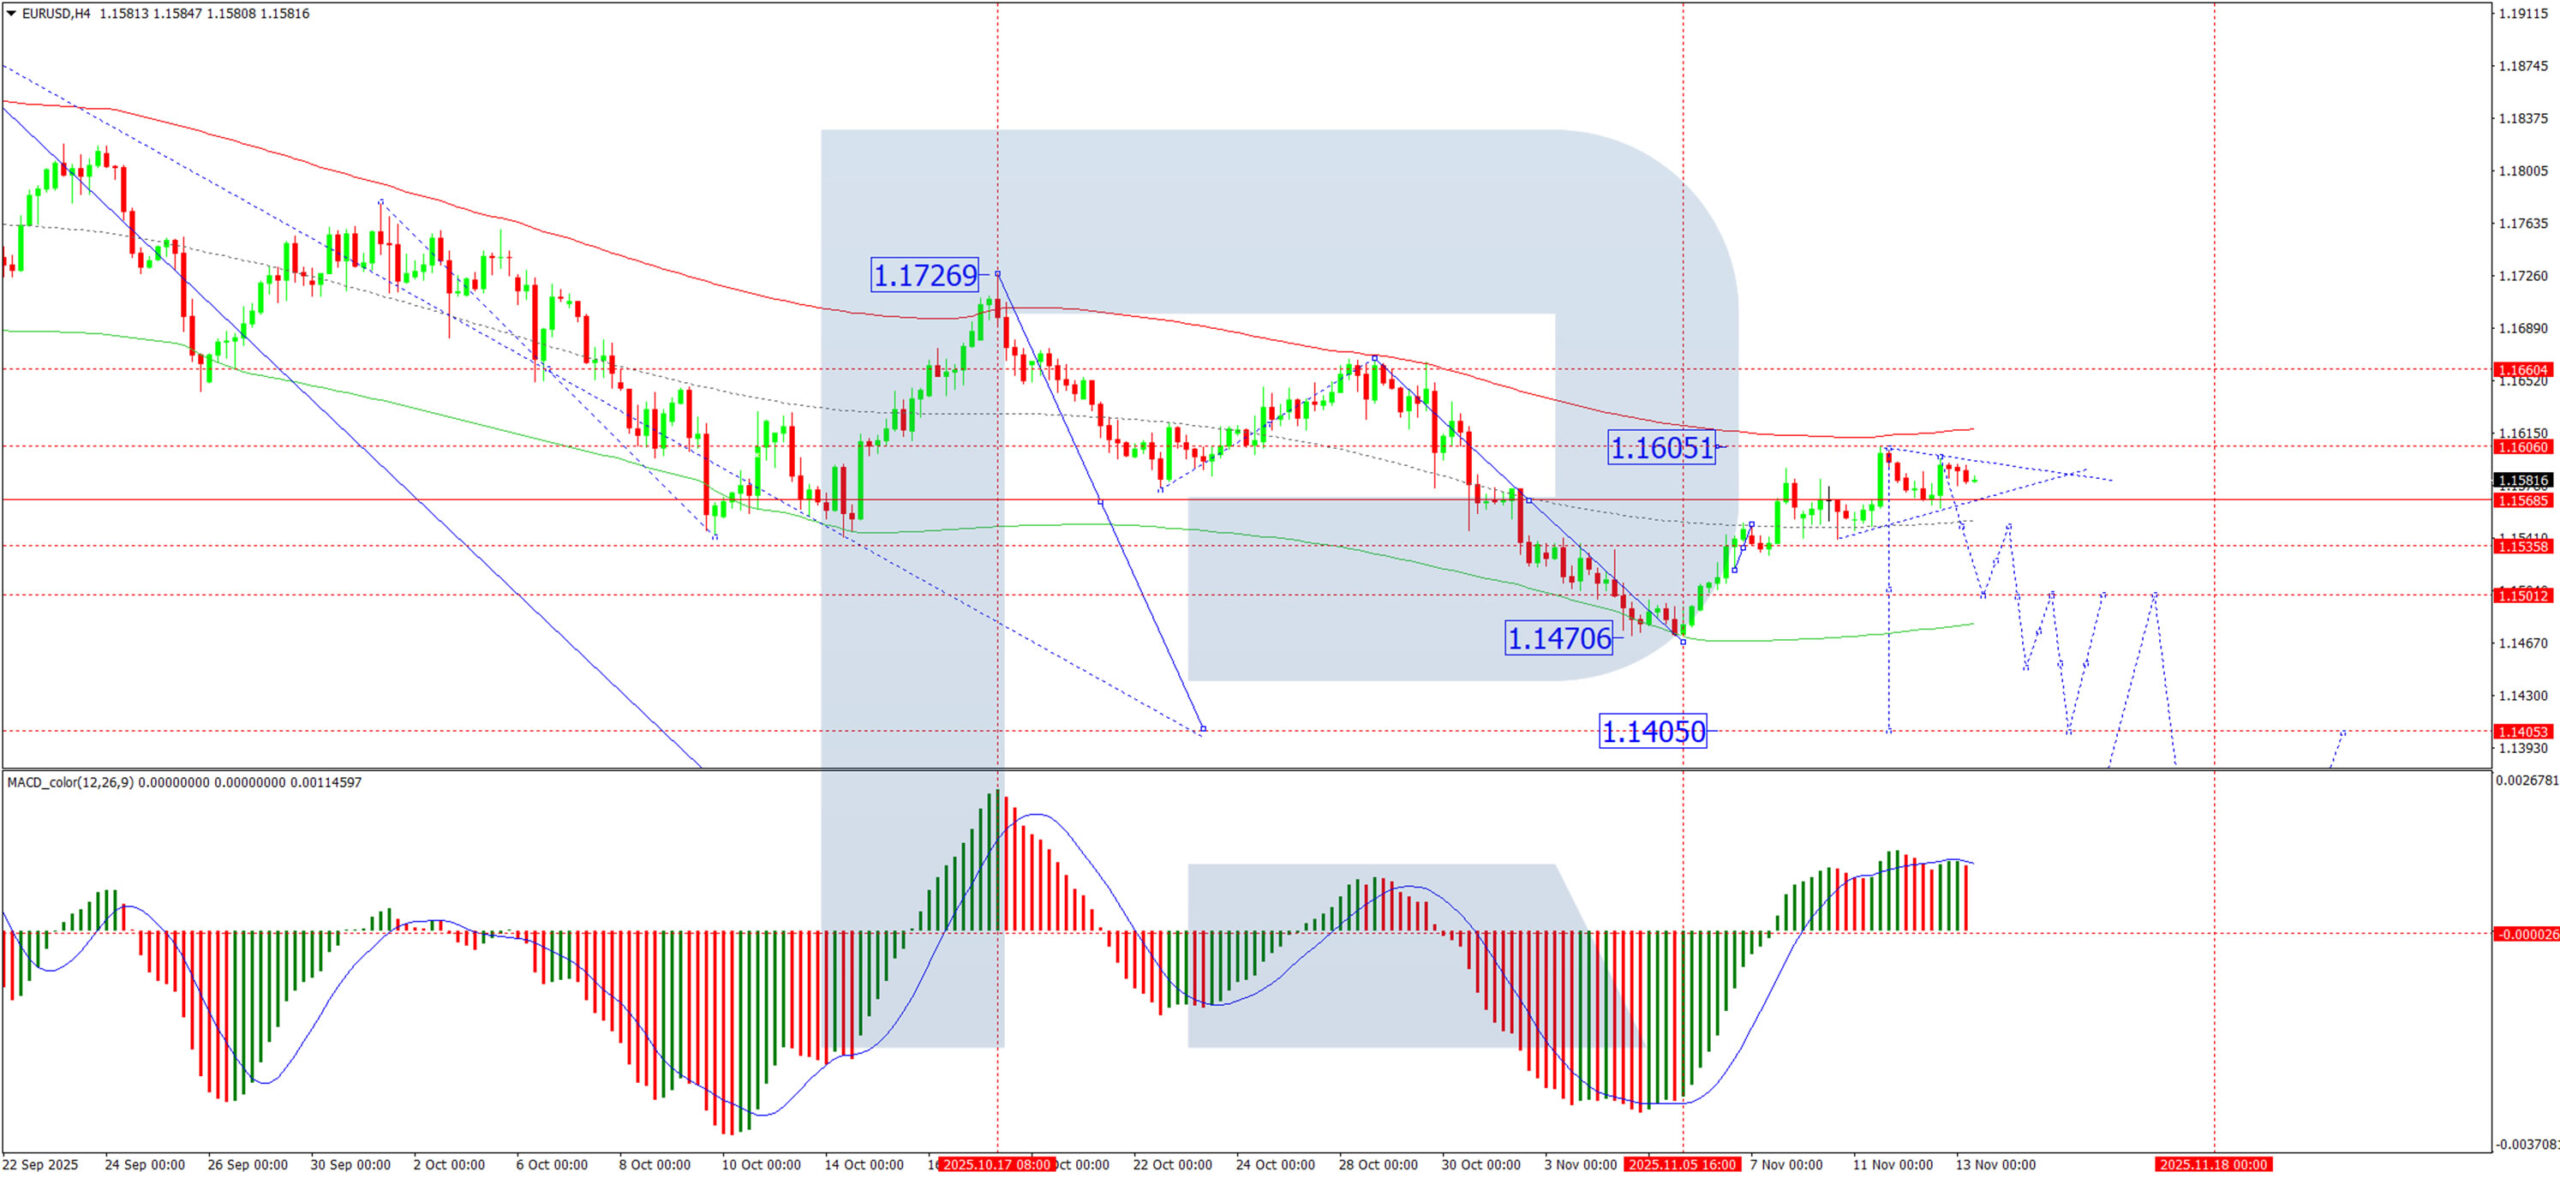
H4 Chart:
On the H4 chart, EUR/USD has completed a corrective wave to 1.1605 and has formed a tight consolidation range below this resistance level. We anticipate a downward breakout from this range, triggering a decline towards an initial target of 1.1505. A breach of this level would open the path for a further extension of the downtrend to 1.1405. This bearish outlook is technically supported by the MACD indicator. Its signal line is above zero but has diverged from its histogram and is pointing decisively downward, suggesting the recent upward correction has run its course and bearish momentum is reasserting itself.
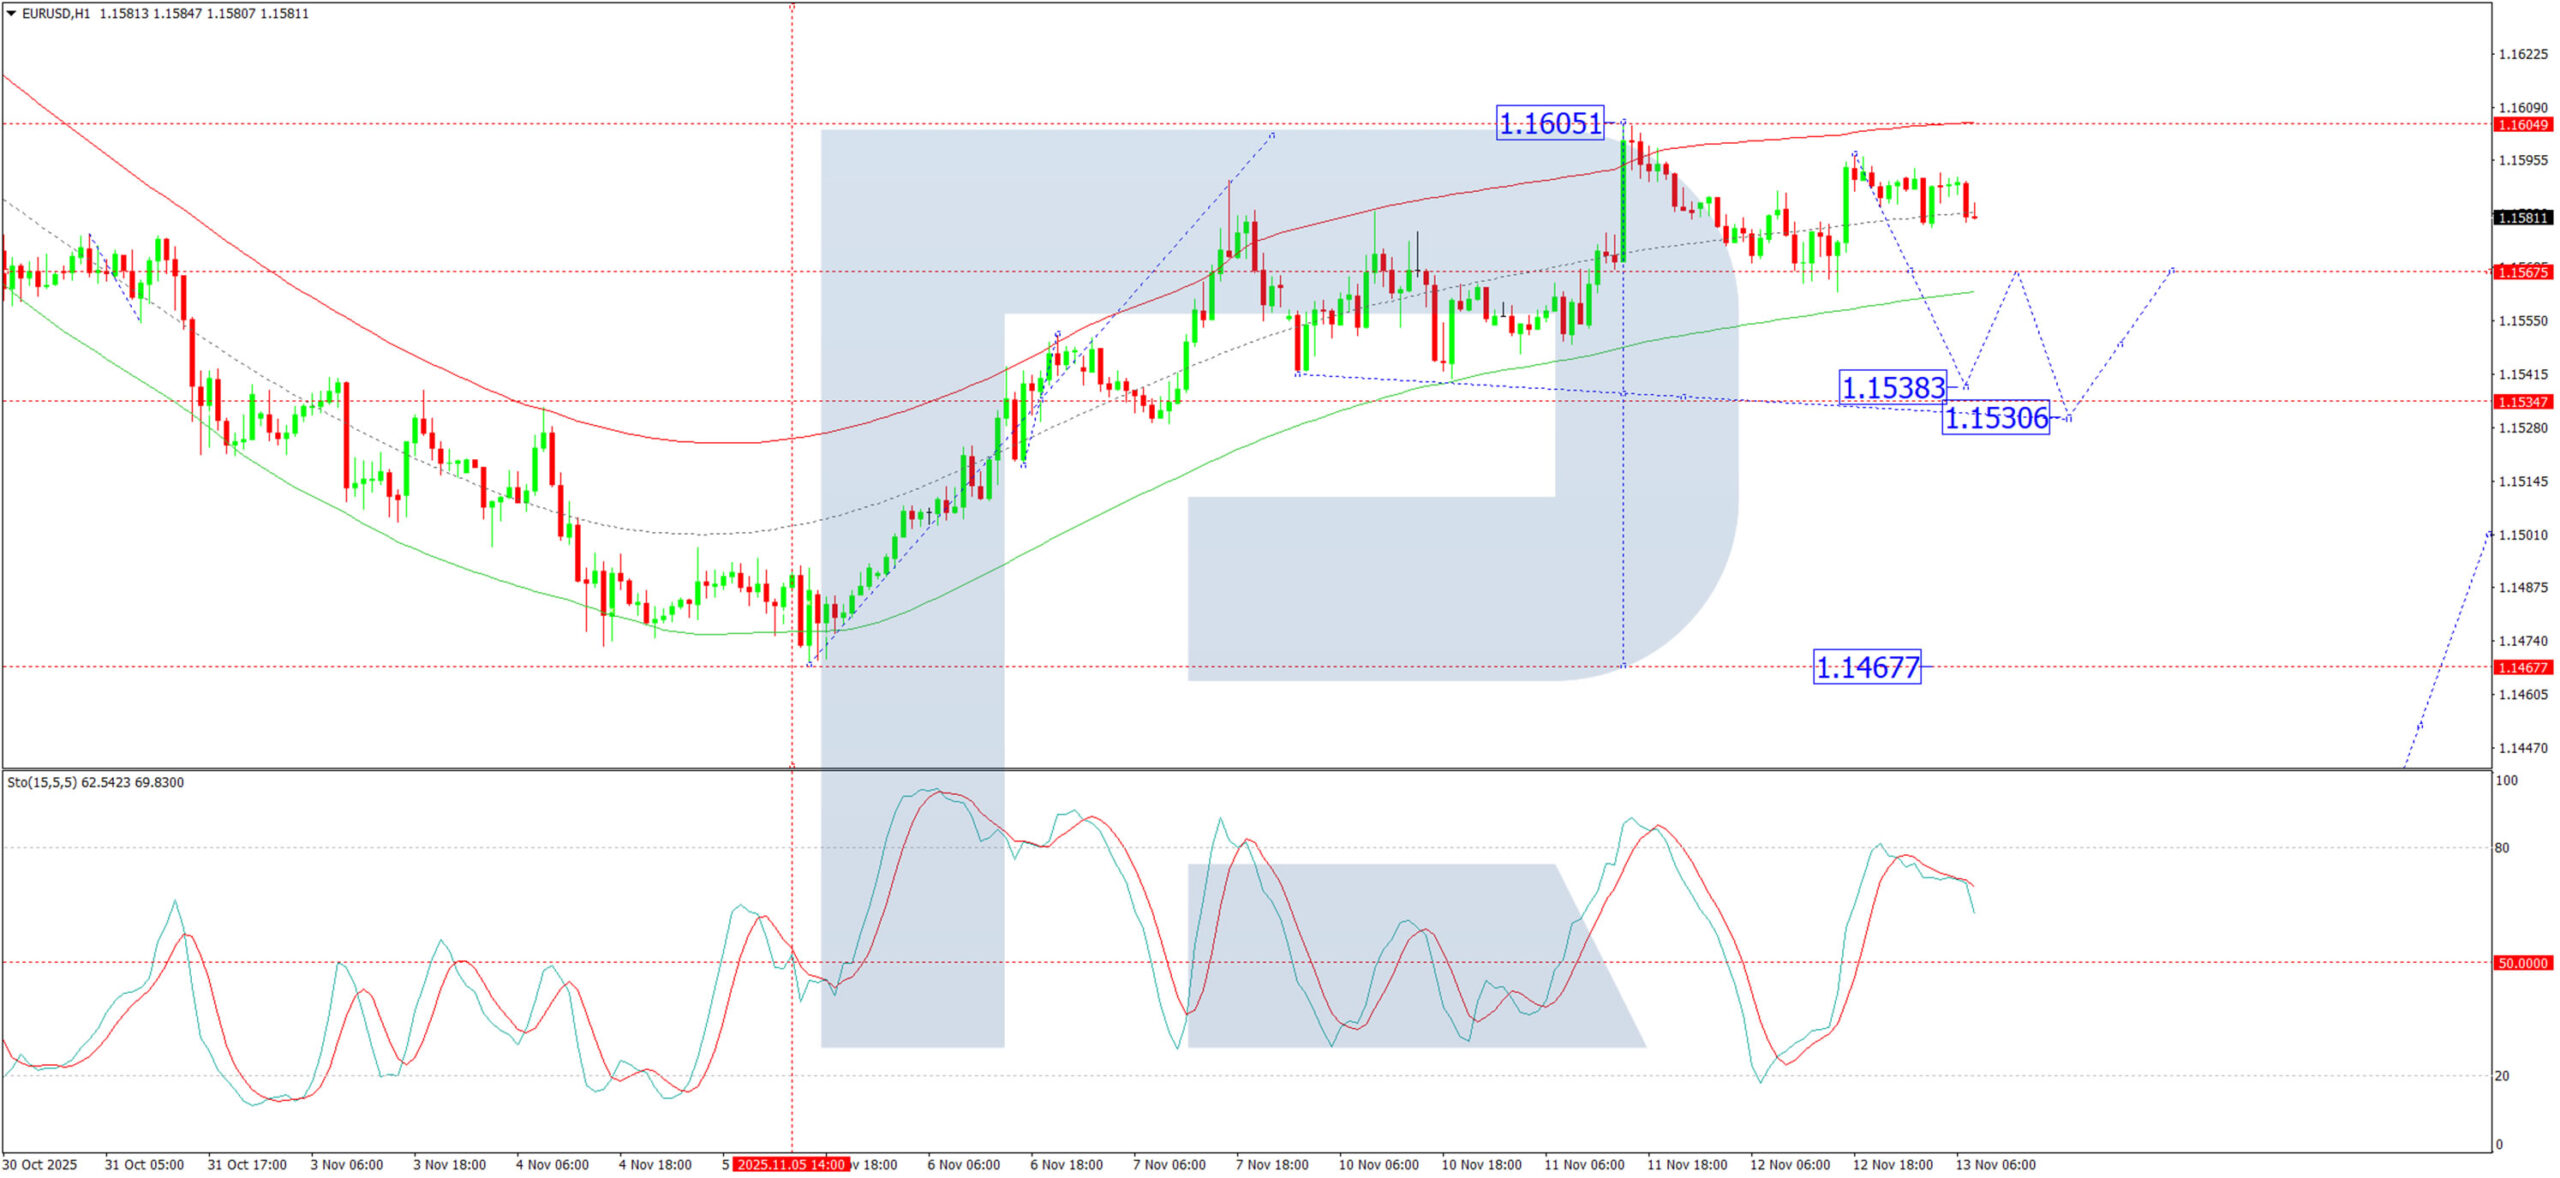
H1 Chart:
On the H1 chart, the pair completed a downward impulse to 1.1563, followed by a corrective bounce to 1.1597. These two levels define the upper and lower boundaries of a new consolidation range. A downward breakout is expected, leading to a resumption of the sell-off towards initial targets at 1.1538 and 1.1530. The Stochastic oscillator corroborates this view. Its signal line has turned down from below the 80 level and is falling steadily towards 20, indicating that short-term downward momentum is building.
Conclusion
While the end of the US government shutdown removes a key market overhang, the EUR/USD pair remains capped by underlying concerns about the US economy and a still-dovish Fed outlook. Technically, the structure points to a bearish resolution. The completion of the correction near 1.1605 suggests the pair is poised for a fresh leg lower, with key downside targets at 1.1505 and 1.1405.
Dow Futures (YM) Breaks Record : Five Waves Elliott Wave Impulse in Sight
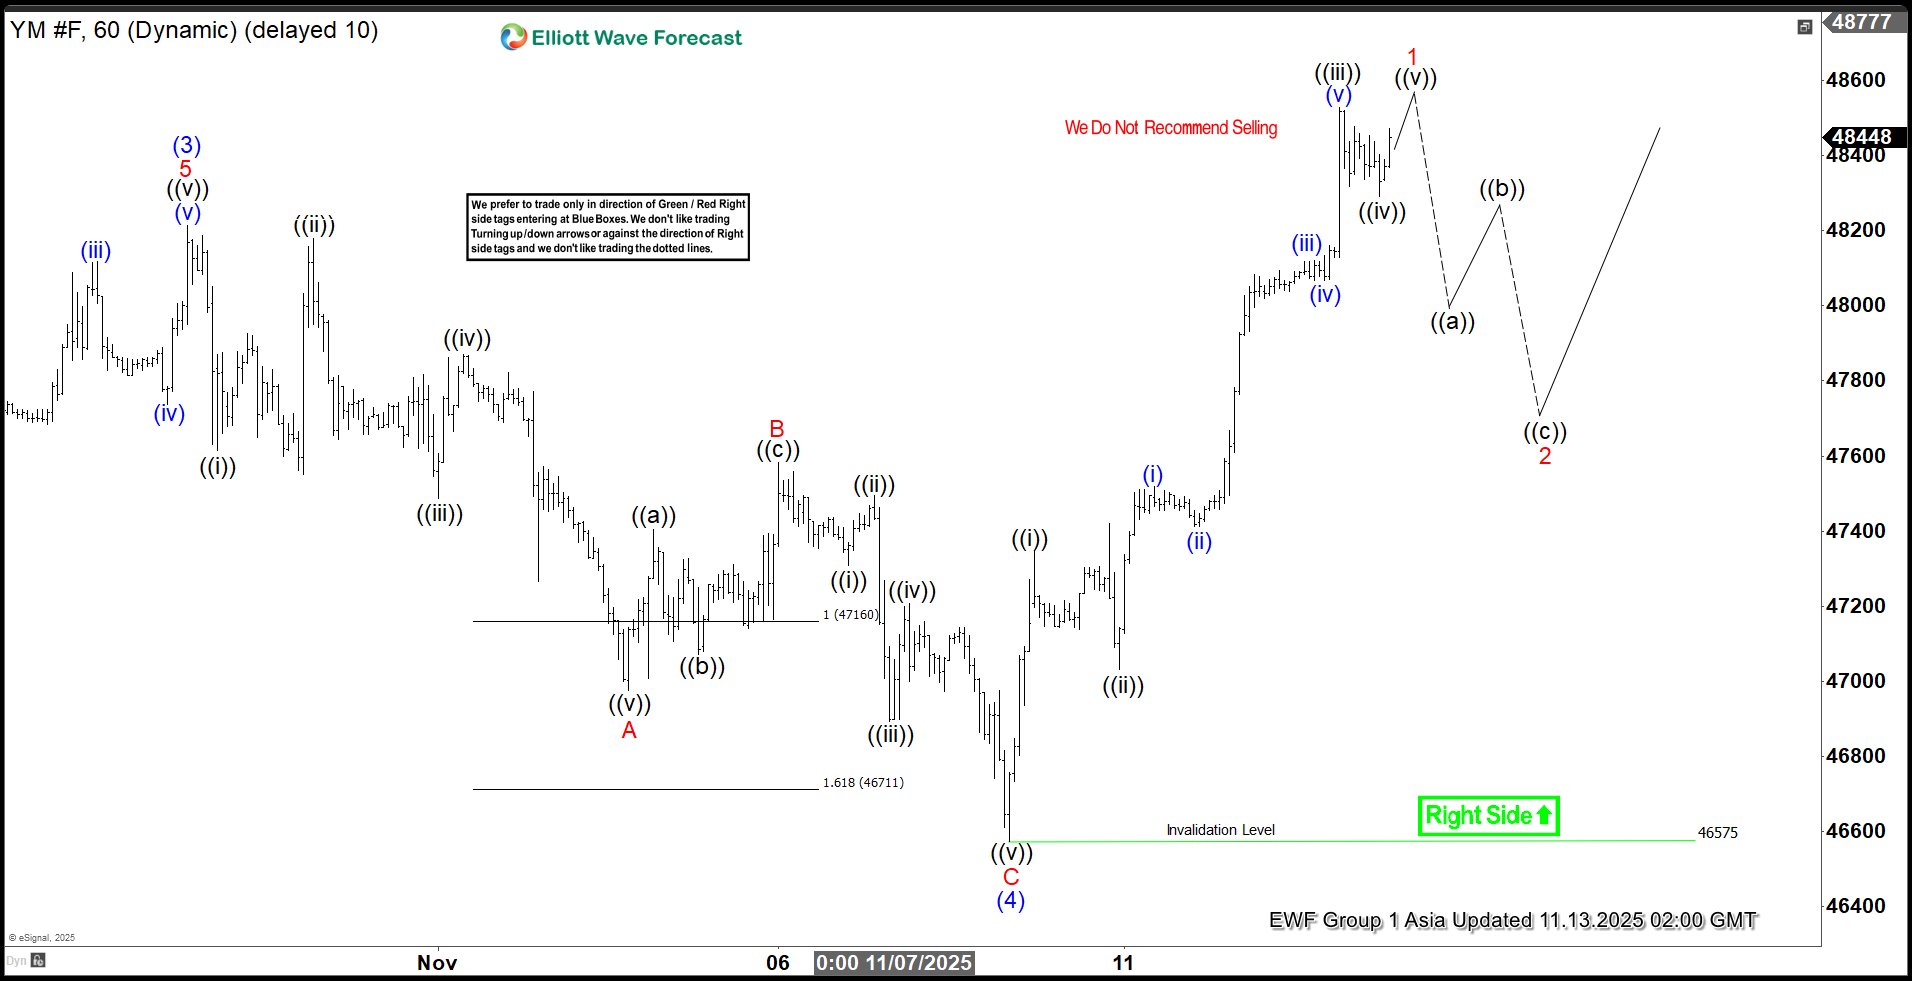
Dow Futures (YM) has surged to a new all-time high, reinforcing the prevailing bullish trend. The cycle from the April 2025 low remains active and is unfolding as a five-wave impulsive structure. Within this sequence, wave (3) concluded at 48,214. The subsequent decline in wave (4) developed as a zigzag Elliott Wave formation. From the peak of wave (3), wave ((i)) terminated at 47,616, followed by a corrective rally in wave ((ii)) that reached 48,180. The index then declined in wave ((iii)) to 47,488, before wave ((iv)) produced a modest rebound to 47,869. The final leg, wave ((v)), completed at 46,976, marking the end of wave A. A corrective bounce in wave B subsequently peaked at 47,583.
The index then resumed its downward correction in wave C. From wave B, wave ((i)) ended at 47,308, and wave ((ii)) retraced to 47,495. A deeper decline in wave ((iii)) reached 46,894, followed by a brief recovery in wave ((iv)) to 47,207. The final leg, wave ((v)), concluded at 46,575, completing wave C of (4). A bullish reversal has since occurred, with the index breaking to new highs in wave (5). From wave (4), wave ((i)) ended at 47,345, and wave ((ii)) pulled back to 47,031. Wave ((iii)) extended higher to 48,528, followed by a minor retracement in wave ((iv)) to 48,368. One final push higher is expected to complete wave ((v)) of 1.
Subsequently, a corrective wave 2 should unfold to retrace the cycle from the 8 November low. Provided the pivot at 46,575 remains intact, dips are anticipated to find support in the 3-, 7-, or 11-swing sequence, paving the way for further upside.
Dow Futures (YM) 1-Hour Elliott Wave Chart From 11.13.2025
YM Elliott Wave Video
https://www.youtube.com/watch?v=a3Fp3PX0oqo
EUR/JPY Reaches Record High
As the chart shows, the pair climbed to a new all-time high of ¥179.80 per euro today.
The main driver has been the weakening of the Japanese yen, which continues amid fresh statements from government officials. According to Reuters:
→ Japanese Prime Minister Sanae Takaichi said her administration prefers to keep interest rates low and called for close coordination with the Bank of Japan — a factor contributing to yen weakness.
→ Meanwhile, Finance Minister Satsuki Katayama issued a verbal warning about the yen’s weakness, noting “one-sided and rapid moves” in the currency market. In theory, this should have supported the yen, but judging by today’s USD/JPY movements, the impact was limited.
Technical Analysis of EUR/JPY
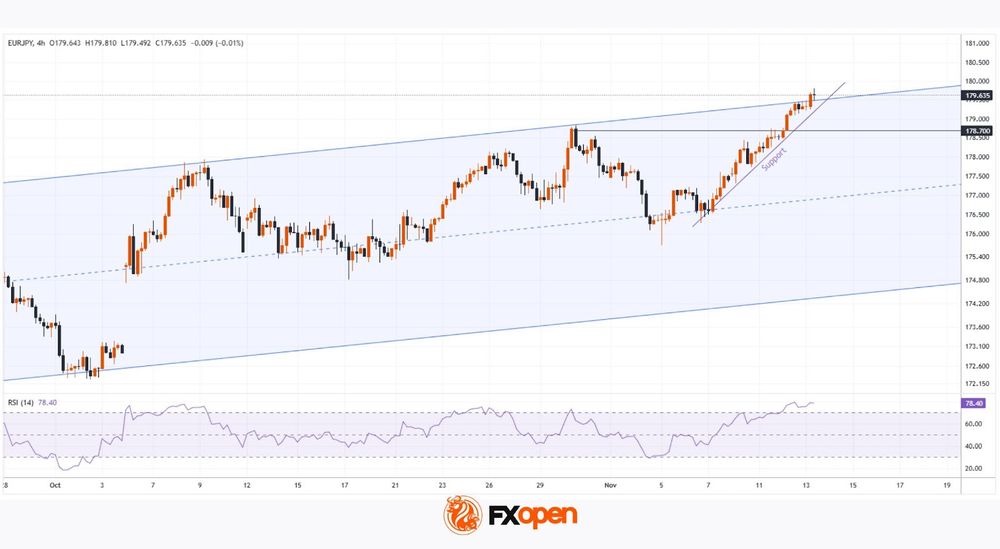
Price action continues to form an ascending channel (marked in blue). Following the early October news of Sanae Takaichi’s victory, who is viewed as a proponent of economic stimulus, the yen weakened, and EUR/JPY moved into the upper half of the channel.
Since then, the upper boundary has acted as a key resistance level. Today’s record high serves as yet another test of strength for that level. Given that the RSI is in overbought territory, and long-position holders may be tempted to take profits (at least partially), the market appears vulnerable to a pullback.
Therefore, it cannot be ruled out that we may see:
→ a bearish break of the support line that has held since early November;
→ followed by a retracement to retest the former resistance level around 178.70. A deeper correction towards the channel’s median is also possible.
The future direction of the yen will largely depend on market expectations regarding a potential Bank of Japan rate hike — a likely scenario, as a weak yen increases inflationary pressure on food and energy prices.
This article represents the opinion of the Companies operating under the FXOpen brand only. It is not to be construed as an offer, solicitation, or recommendation with respect to products and services provided by the Companies operating under the FXOpen brand, nor is it to be considered financial advice.
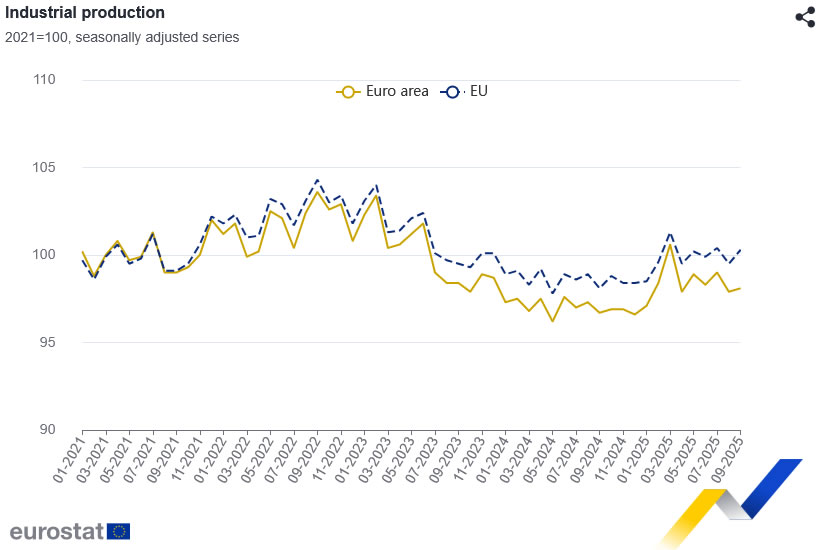
Eurozone industrial production disappoints with 0.2% mom growth, consumer goods weigh
Eurozone industrial production rose only 0.2% mom in September, sharply below expectations of 0.8%. The modest gain reflected mixed sectoral dynamics — output increased for intermediate goods (+0.3%), capital goods (+0.3%), and energy (+1.2%), but fell for durable consumer goods (-0.5%) and non-durable consumer goods (-2.6%).
Across the broader European Union, output performed better, rising 0.8% mom, helped by strong growth in Denmark (+7.2%), Sweden (+5.3%), and Greece (+4.8%). However, steep contractions in Ireland (-9.4%), Luxembourg (-5.7%), and Malta (-1.7%) underscored the fragmented nature.
Sterling Faced Selling Pressures Over Last Couple of Sessions
Markets
US Treasuries outperformed Bunds yesterday. Yields dropped between 2.2 (2-yr) and 4.7 (7- to 10-yr bucket) bps. The majority came right after the cash market open, catching-up with the Nov 11 release by ADP. The creator of the unofficial monthly payrolls report recently started providing weekly updates as well. Tuesday’s print showed companies shedding 11.3k jobs a week in the four weeks through October 25. Longer maturities including the 10-year found a bottom after a $42bn 10-yr Note auction tailed slightly with bidding metrics a tad weaker. The currently outsized market relevance of alternatively sourced data (such as ADP’s) due to a lack of official government releases may fade in coming weeks. A bill to end the 43-day long shutdown passed the House in a 222-209 vote, despite two Republicans defecting and with the support of six Democrats. President Trump signed that bill into law overnight, supporting risk sentiment. The White House instructed staff to return to their offices starting today but it’ll take several weeks at least to overcome the backlog. It means no jobless claims or October CPI that were otherwise scheduled for today. WH Press Secretary Leavitt said yesterday that it’s unlikely that last month’s inflation figures will be published at all. The same goes for the payrolls report, although some expect the Bureau of Labour Statistics to combine two months (October and November) into one statistic to catch-up. German rates yesterday eased between 0.3 and 2.6 bps in a bull flattening move, navigating through a flurry of ECB speeches. FX markets were a sea of calm and we expect more of the same today. EUR/USD overcame European weakness into the US open and ended the day marginally higher just shy of 1.16. DXY treaded water around 99.5 with a weaker JPY preventing losses for the trade-weighted index. USD/JPY rose to a new 9-month high (154.79). Sterling faced selling pressures over the last couple of sessions amid Labour’s internal disarray spilling on the streets, a weak labour market report and sub-par Q3 growth. EUR/GBP appreciates to 0.884, the strongest level since April 2023. UK GDP expanded by 0.1% compared to the 0.2% expected and with the accompanying monthly series revealing underwhelming dynamics (-0.1% m/m in September after stagnating the month before). The numbers are another blow to chancellor Reeves going into the critical Autumn Budget on November 26, which is expected to end up in Labour breaking its 2024 election manifesto through introducing additional taxes. To help fill a fiscal hole of as much £35bn, the UK Treasury has presented the Office of Budget Responsibility with plans to cut household bills and lower inflation (through lowering regulated prices). That should pave the way for further BoE rate cuts and lower borrowing costs. The OBR delivers the economic forecasts to which the UK fiscal rules are being measured against.
News & Views
Strong October Australian labour market data strengthen the view that the Reserve Bank of Australia is finished with its policy normalization cycle. The number of employed people rose by 42k, beating 20k consensus. Details showed an even bigger increase in full-time employment (+55k) which was partly offset by less part-time jobs (-13k). The unemployment rate dropped back to summer levels (4.3%) after spiking to 4.5% in September. The participation rate remained steady at 67%. Hours worked rose by 0.5% M/M, outpacing the 0.3% M/M employment growth. The AUD government bond curve bear flattens this morning with yields rising up to 10 bps at the front end of the curve. The Aussie dollar profits marginally, currently changing hands around AUD/USD 0.6550.
he UK October housing market survey from the Royal Institution of Chartered Surveyors (RICS) showed the national price balance slightly declining from -17% to -19% in October. Details showed new buyer enquiries at the weakest level since April (-24%) as uncertainty surrounding the upcoming Autumn Budget (potential changes to property-related taxes including stamp duty, capital gains and inheritance tax) not only led to reduced buyer demand, but also sales and new property listings. Above target inflation and rising unemployment are also negative for the overall market. Agreed sales registered a net balance of -24%, down from -17%. A net balance of +7% surveyors anticipates a modest improvement in 2026. New vendor instructions (-20%) hit the lowest level since 2021.
UK GDP grows 0.1% qoq in Q3, vehicle production plunges
The UK economy barely grew in Q3, with GDP expanding just 0.1% qoq, below expectations for 0.2%, reinforcing concerns about stagnation as demand cools. The latest figures show services output rising 0.2% qoq and construction up 0.1%, while the production sector contracted -0.5%, offsetting modest gains elsewhere. Real GDP per head was flat, underscoring the absence of meaningful growth in living standards.
Monthly data painted an even weaker picture. September GDP fell -0.1% mom, missing forecasts for a flat reading, following zero growth in August (revised from +0.1%) and a -0.1% contraction in July. The decline was driven by a -2.0% drop mom in production, as a steep -28.6% collapse in vehicle manufacturing subtracted 0.17 percentage points from overall GDP. In contrast, services and construction both managed modest 0.2% expansions.
Trump Signs Funding Deal, Ending Record-Long Shutdown
In focus today
- In the UK, September GDP data is released. Growth rates are low but close to potential, a challenging cocktail with inflation close to 4%.
- In Sweden, October inflation details are published this morning. Last week's flash estimate saw yet another upside surprise, as CPIF overshot over forecast by a tenth and the Riksbank by 0.4 p.p. Core inflation rose as well, in contrast to expectations, which raises some questions regarding the Riksbank's confidence in their current inflation assessment. As such, today's details will prove an important input in assessing the 'temporary nature' of this inflation overshoot. For what it is worth, all 'temporary surprises' this year have been to the upside.
- Additionally, the Riksbank will publish their bi-annual Financial Stability Report. The first edition, from spring, highlighted the elevated political uncertainty abroad and the need for Swedish banks to have a more active liquidity management. On top of the usual comments regarding the resilience of households and the real estate sector, we are particularly keen to hear if the Riksbank has more to say on banks' liquidity management.
- Overnight, China will release the monthly batch of data for retail sales, industrial production and indicators for the housing market. We expect to see a continued picture of a two-speed economy with robust manufacturing, partly driven by strong exports, while retail sales and housing data will likely continue to show weak domestic demand.
Economic and market news
What happened overnight
President Donald Trump signed legislation to end the 43-day government shutdown, the longest in US history, after the House of Representatives passed the funding package in a 222-209 vote. The deal extends federal funding through 30 January, allowing federal workers to return to their jobs as early as Thursday and restoring disrupted government services such as food assistance and air traffic control. However, the shutdown has caused lasting disruptions, with key economic data releases for October, such as employment and CPI reports, unlikely to be published. The funding package did not include healthcare subsidies, a contentious issue that will be revisited in December.
What happened yesterday
In the US, two Fed speakers were on the wire. Atlanta Fed President Bostic, who announced he will retire in February 2026, stated he favours keeping rates unchanged until there is clear evidence that inflation is returning to the 2% target, citing inflation as a greater risk than labour market signals. Bostic was not scheduled to become a voting member until 2027, so his decision to retire will not impact near-term monetary policy decisions. Meanwhile, New York Fed President John Williams discussed the Federal Reserve's upcoming end to quantitative tightening on 1 December and signalled plans for gradual asset purchases to maintain ample reserves.
Furthermore, Anthropic announced a USD 50bn investment to build data centres in Texas and New York, with additional sites planned. Partnering with Fluidstack, the initiative aims to boost AI infrastructure and aligns with the Trump administration's push to maintain American leadership in AI. The project is expected to create 800 permanent jobs and 2,400 construction jobs, further highlighting the rapid expansion of AI investment in the US.
In France, lawmakers voted to suspend President Macron's contested pension reform, keeping the minimum retirement age at 62 years and nine months until after the 2027 elections. The suspension, secured through concessions to Socialist lawmakers, provides Prime Minister Lecornu's government with a temporary reprieve as it struggles to pass next year's budget in a hung parliament. However, the freeze, combined with other spending trade-offs, raises fresh concerns over the country's ability to rein in its euro zone-high budget deficit.
In oil markets, OPEC's latest report forecasts a small surplus of 20,000 bpd in 2026, revising its earlier predictions of a deficit. The shift reflects higher production from OPEC+ and non-OPEC+ producers, contrasting sharply with the IEA's projection of a 4 million bpd surplus next year. Following the release, oil prices fell over 3% to USD 63 per barrel.
Equities: Equities moved higher again yesterday across regions, with fresh all-time highs set in several indices. Interestingly, the US was not leading this leg higher, Europe outperformed once again, as did several other regions. Also noteworthy, yesterday's session did not feature a tech-led catch-up after the previous day's tech underperformance. Instead, defensives continued to outperform, with healthcare once again the best-performing sector globally. To put that into context, global healthcare has now gained more than 15% over the past three months, outperforming the next best sector by over 5 percentage points despite an already strong equity tape. That fits perfectly with our call made during summer, both in terms of reasoning and performance pattern, and we are obviously quite pleased with how that thesis has played out. In Europe, banks were again the best-performing industry yesterday. Over the past 12 months, European banks are now up more than 77%. Despite the strong run, our conviction remains unchanged, the sector still I not expensive, and the fundamental drivers continue to align with our view. In the US yesterday, Dow +0.7%, S&P 500 +0.1%, Nasdaq -0.3%, Russell 2000 -0.3%. Asian equities trade higher this morning, and futures are modestly firmer in both Europe and the US.
FI and FX: Yields have edged marginally higher on the expected end to the US government shutdown. 10Y US Treasury yields continue to trade close to the 4.10 mark while the US swap curve has steepened slightly during the Asia-hours. In commodities oil prices traded heavy following remarks from OPEC that supplies had surpassed demand earlier than expected. This contributed to sending Brent crude down below USD 63/bbl and by extension EUR/NOK up in the high 11.60s. AUD is the big FX outperformer overnight following better-than-expected labour market figures. EUR/USD has been steady overnight after having risen close to 1.16 during yesterday's US session. Finally, the JPY is under pressure with markets continuing to test the Japanese authorities' preparedness to intervene in the market.
What is Safe, Anyway?
Optimism continues – and extends to a fourth session – as the US government shutdown ends and the latest news regarding AI are rather encouraging. Among them, AMD jumped 9% after forecasting accelerating sales growth over the next five years, and Cisco beat analyst estimates for last quarter and raised its annual guidance, saying that AI-boosted networking demand improved performance. Not only are they selling more hardware, but they’re also securing large AI infrastructure orders. That was exactly what investors wanted to hear: that AI investments are starting to show up somewhere in revenue generation. Cisco jumped 7.5% in after-hours trading.
But it doesn’t solve the puzzle of when Cisco’s clients — those who invest in chips, networks and data centers — will turn that investment, that spending, into revenue. And I’m afraid we won’t have the answer this quarter. Nvidia will probably announce another jaw-dropping result next week, but again, it won’t mean that those buying the chips are yet selling more stuff to end users.
Alibaba, for example, displayed slower growth in Singles Day sales this year despite using AI tools to boost activity, sending the stock price straight below the 50-DMA. We keep coming back to the same story: big spending, delayed results. For China, and for Alibaba, the big story isn’t even AI — it’s that consumer dynamics have been very difficult to revive since the pandemic. Meanwhile, in the US, consumers face the pressure of trade tensions, economic uncertainty and rising layoffs — partly due to AI-driven automation.
That being said, many of us continue to believe that short-term pain during this transition period will lead to long-term gain, as during the Industrial Revolution. On that note, Anthropic said it will invest $50 billion to build data centers in several locations including New York and Texas, a project expected to create around 3,000 jobs. There you go.
But still, Big Tech valuations and big spending will remain front of mind for investors until Microsoft, for example, can say that AI-boosted software sales have exploded — and that’s not yet the case.
Inspired by a comment claiming that most Big Tech companies are “safer than the US”, I looked at corporate growth through the lens of compound annual growth rates, pulled out their debt, and compared it with that of the US. It’s an odd comparison — apples to spaceships — since the US is a government while the tech giants are growth companies, they’re riskier by definition: if they go bankrupt, taxpayers won’t save them and they can’t print money. But the comparison was still revealing.
In terms of growth, Nvidia’s revenue has compounded by roughly 70% a year over the past three years, while Microsoft, Meta, and Amazon have grown between 10% and 25% annually — all multiples of the US’s roughly 3% GDP growth.
More importantly, although these companies have spent massively — maybe too much — their debt has either remained flat or grown far more slowly than their sales. In other words, their spending has been financed by cash, not borrowing. That makes their debt-to-revenue ratios much lower than the US. Numerically, the US debt-to-GDP ratio is around 118%, meaning the country spends more than it produces. Meanwhile, the debt-to-revenue ratios for Microsoft, Meta, and Amazon range between 20% and 45%, while Nvidia’s is almost null.
So, if we compared the US government to Big Tech using the same revenue-to-debt logic, Washington would look like the world’s most overleveraged company.
But of course, there’s more to the story. Big Tech has recently started selling bonds to finance higher spending and — more worryingly — teaming up with private equity firms to take on debt, keeping some of it off balance sheet. That’s something to watch.
As for the “safety” narrative: the US government remains safer as long as investors keep financing its debt by buying Treasuries. For now, they do. But developed market debt as a whole is increasingly seen as riskier, which may also explain why investors keep flocking into higher-risk assets despite stretched valuations. We’ll see how Rachel Reeves handles the Autumn Budget to keep investors on board — she’ll likely need to raise taxes. That ultimately means the UK will have to finance more of its own debt. The point is: “safe” status can be easier to lose than many think.
Coming back to market dynamics: futures are positive, and sentiment is more risk-on than risk-off this week. Investors are hopeful that upcoming US data will clarify the Federal Reserve’s (Fed) December intentions. But since the odds of a December cut are roughly 50-50, any data point could swing expectations either way.
I won’t waste time speculating whether the data will come in before the Fed decision — we’ll see as it flows in and watch how markets reposition. My guess for the next few weeks is as good as anyone’s.
What’s clearer, though, is that sentiment among oil bulls keeps deteriorating. OPEC’s latest monthly report said supplies exceeded demand sooner than expected — duh — due to rising non-OPEC production. The report sent US crude straight below $60 per barrel. Even the IEA’s prediction that global demand will keep growing until 2050, from around 100 mbpd today to 113 mbpd, couldn’t bring the bulls back. The barrel is now testing the $58 support with enough momentum to justify a deeper move below $55 per barrel, which acted as solid support earlier this year.