
Sample Category Title
USD/CHF Daily Outlook
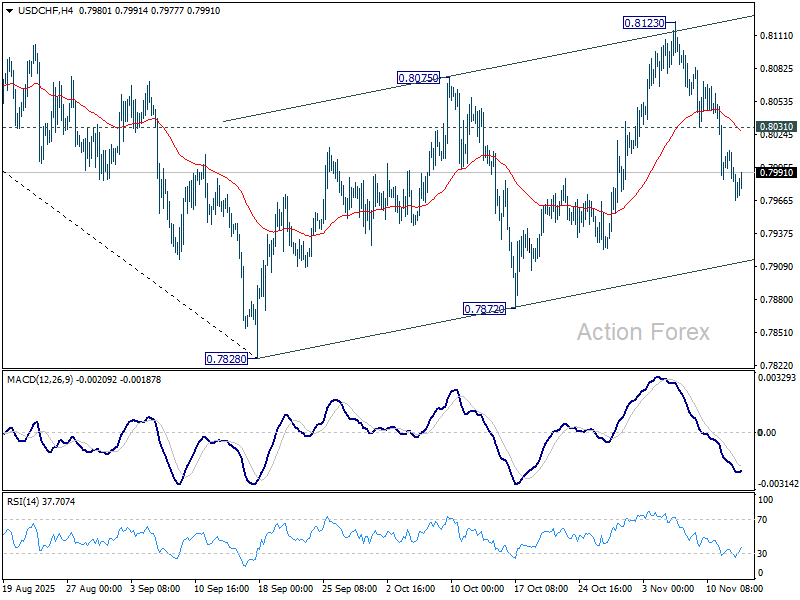
Daily Pivots: (S1) 0.7961; (P) 0.7986; (R1) 0.8005; More…
Intraday bias in USD/CHF stays mildly on the downside for the moment. Fall from 0.8123 should target 0.7872 support. Firm break there will argue that larger down trend is ready to resume through 0.7828 low. On the upside, above 0.8031 minor resistance will turn intraday bias neutral again.
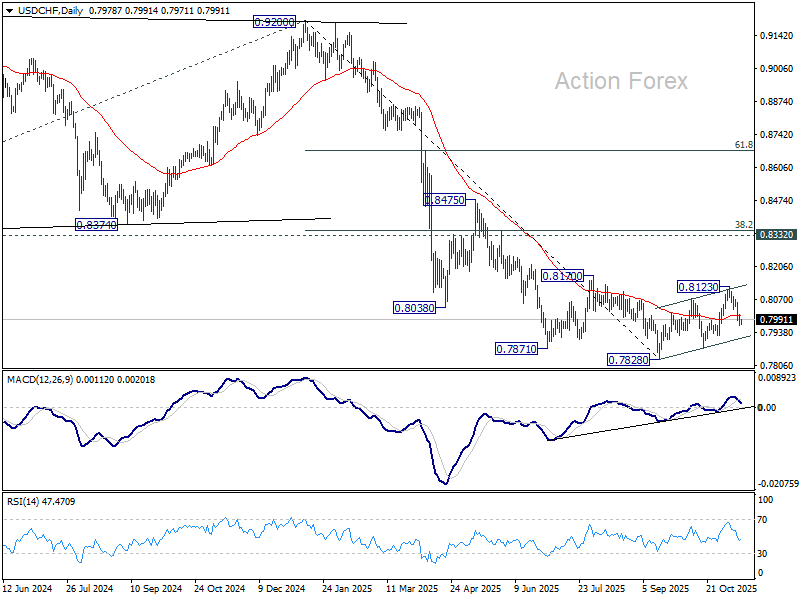
In the bigger picture, long term down trend from 1.0342 (2017 high) is still in progress. Next target is 100% projection of 1.0146 (2022 high) to 0.8332 from 0.9200 at 0.7382. In any case, outlook will stay bearish as long as 0.8332 support turned resistance holds (2023 low).
USD/CAD Daily Outlook
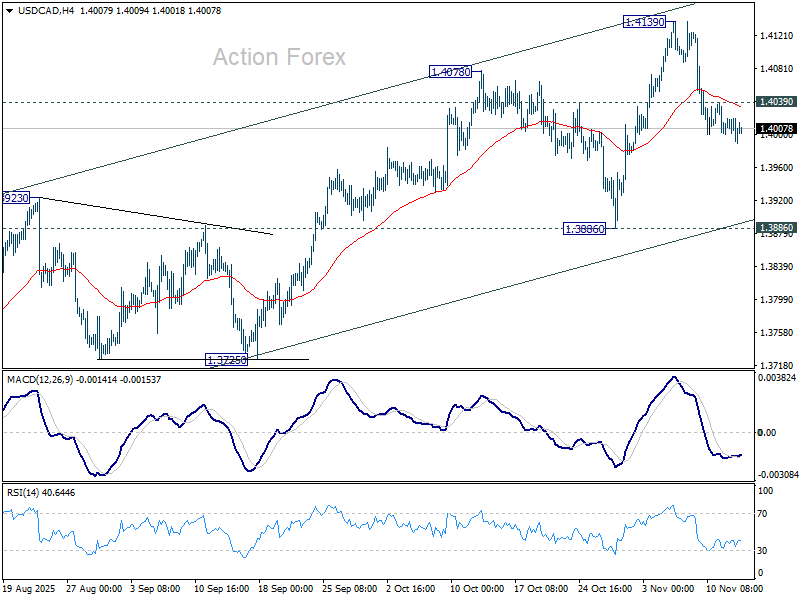
Daily Pivots: (S1) 1.3990; (P) 1.4006; (R1) 1.4023; More...
Intraday bias in USD/CAD stays mildly on the downside for the moment. Fall from 1.4139 short term top would extend towards 1.3886 support. On the upside, above 1.4039 minor resistance, however, will argue that the pullback has completed. Bias will be flipped back to the upside for retesting 1.4139. Further break there will resume the rally from 1.3538 to 61.8% retracement of 1.4791 to 1.3538 at 1.4312.
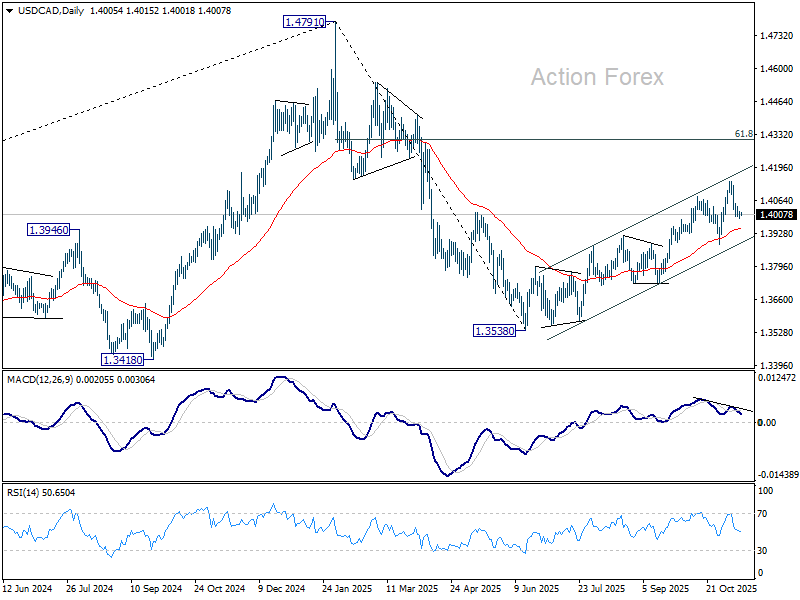
In the bigger picture, price actions from 1.4791 medium term top is likely just unfolding as a correction to up trend from 1.2005 (2021 low), with rise from 1.3538 as the second leg. A third leg should follow before up trend resumption. That is, range trading is set to extend for the medium term. For now, this will remain the favored case as long as 1.3886 support holds. However, firm break of 1.3886 will revive the case that fall from 1.4791 is indeed a larger scale correction.
AUD/USD Daily Report
Daily Pivots: (S1) 0.6521; (P) 0.6535; (R1) 0.6555; More...
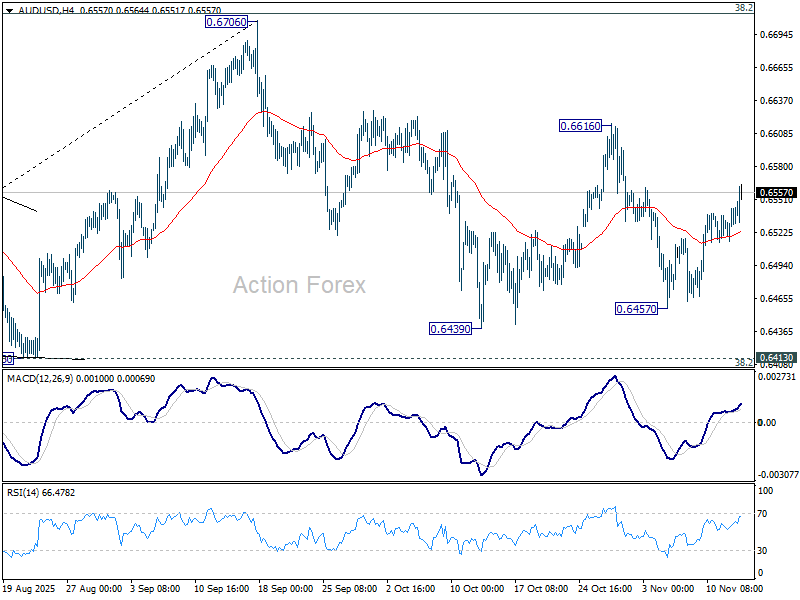
AUD/USD's rebound from 0.6457 extended higher today, but it stays below 0.6616 resistance. Intraday bias remains neutral at this point. On the downside, break of 0.6457 will target 0.6413 cluster (38.2% retracement of 0.5913 to 0.6706 at 0.6403). Decisive break there will carry larger bearish implications. On the upside, break of 0.6616 will bring retest of 0.6706 high instead.
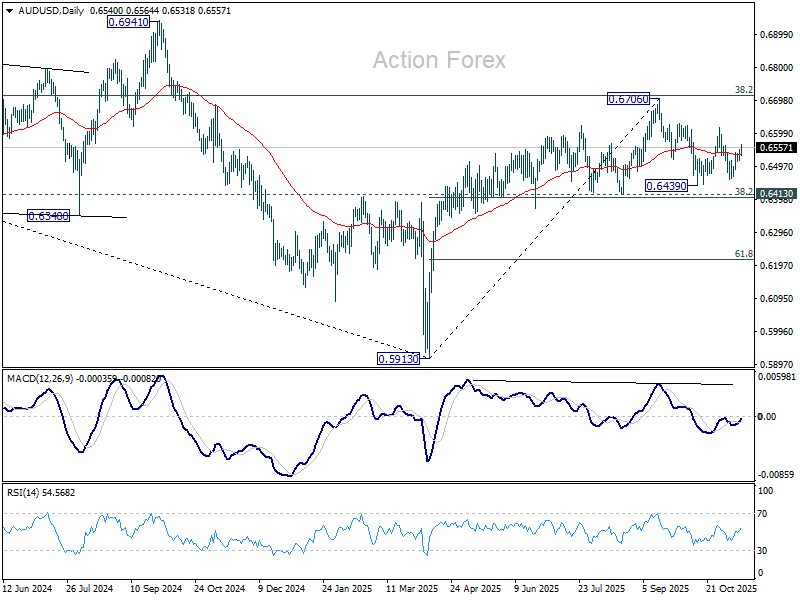
In the bigger picture, there is no clear sign that down trend from 0.8006 (2021 high) has completed. Rebound from 0.5913 is seen as a corrective move. Outlook will remain bearish as long as 38.2% retracement of 0.8006 to 0.5913 at 0.6713 holds. Break of 0.6413 support will suggest rejection by 0.6713 and solidify this bearish case. Nevertheless, considering bullish convergence condition in W MACD, sustained break of 0.6713 will be a strong sign of bullish trend reversal, and pave the way to 0.6941 structural resistance for confirmation.
Aussie Soars on Strong Jobs Data; U.S. Shutdown Ends, UK GDP in Focus
Australian Dollar strengthened broadly in Asian session today after stronger-than-expected October employment report reinforced confidence in the resilience of Australia’s labor market. The robust job data numbers confirmed that while the labor market is cooling, the adjustment is happening only gradually. The results also vindicated RBA Governor Michele Bullock’s view that September’s weak figures were “just some noise,” rather than the start of a more serious slowdown.
For the RBA, the data reinforce the case for holding rates steady through year-end, giving policymakers time to assess whether inflation would ease back toward target in coming months. Without renewed progress on disinflation, the scope for rate cuts remains limited. February is the earliest opportunity for the RBA to consider easing, though the next move could easily slip to May—or even later—if inflation proves sticky.
In the U.S., the historic government shutdown officially ended after President Donald Trump signed a stopgap funding bill approved by the House in a 222–209 vote. The measure will fund federal operations through the end of January. The Office of Management and Budget instructed federal employees to return to work Thursday. The Department of Transportation also announced it would freeze flight cuts introduced during the shutdown amid air traffic controller shortages.
On the trade front, Swiss Economy Minister Guy Parmelin and State Secretary Helene Budliger Artieda are traveling to Washington to complete talks on a U.S.–Swiss trade deal that could cut the 39% tariff on Swiss exports to 15%, bringing parity with the EU’s rate. Switzerland remains hopeful of sealing the agreement soon, which would benefit key industries including watches, machinery, and chocolate.
In currency markets, the overall picture remains familiar. Yen continues to underperform for the week as the BoJ faces political pressure to delay its long-anticipated rate hike to January at the earliest. The Pound is also soft, with markets firming up bets on a December BoE cut ahead of today’s UK Q3 GDP release.
Meanwhile, the Aussie leads the majors, followed by the Swiss Franc. Though, the latter’s momentum appears to be fading amid “buy the rumor, sell the news” risk ahead of the trade deal announcement. Kiwi holds third place among gainers, while the Loonie and Euro are trading mid-pack.
In Asia, at the time of writing, Nikkei is up 0.25%. Hong Kong HSI is down -0.58%. China Shanghai SSE is up 0.44%. Singapore Strait Times is down -0.006%. Japan 10-year JGB yield is flat at 1.691. Overnight, DOW rose 0.68%. S&P 500 rose 0.06%. NASDAQ fell -0.26%. 10-year yield fell -0.055 to 4.065.
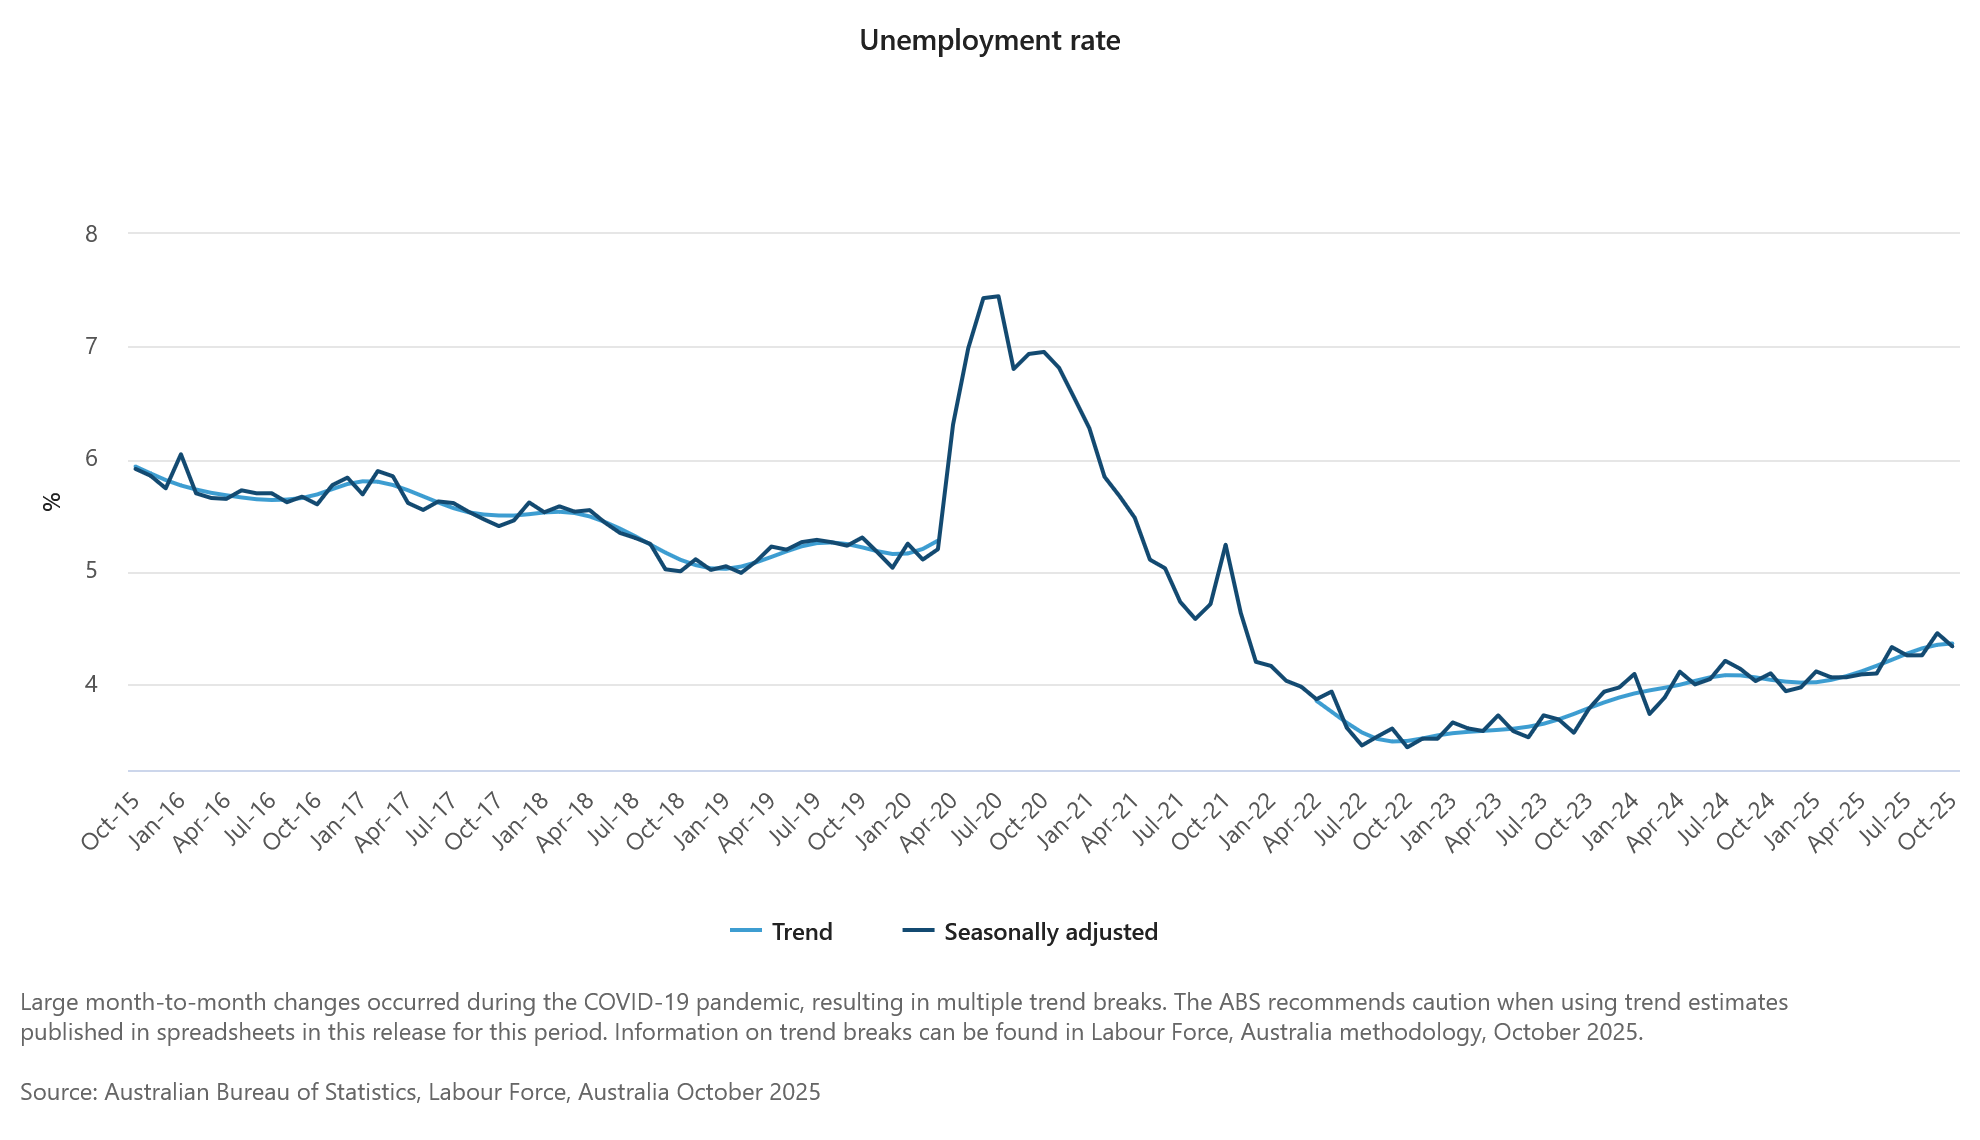
Australia jobs surge 42.2k in October as unemployment rate falls to 4.3%
Australia’s labor market showed renewed strength in October, with employment rising by 42.2k, more than double market expectations of 20.3k. The gain was driven by a 55.3k surge in full-time positions, partly offset by a -13.1k drop in part-time work, highlighting a solid expansion in higher-quality jobs.
The unemployment rate unexpectedly fell from 4.5% to 4.3%, beating forecasts of 4.4%, while the participation rate held steady at 67.0%. Meanwhile, monthly hours worked climbed 0.5% mom, further underscoring the underlying resilience of labor demand.
The upbeat figures reaffirm Australia’s labor market resilience and encourage the RBA to maintain its current cautious tone rather than pivot quickly toward easing. With inflation pressures lingering and employment holding firm, the RBA is likely to wait for clearer signs of slack before signaling rate cuts—keeping February as the earliest plausible window for policy adjustment.
BoJ's Ueda highlights tight job market, resilient consumption
BoJ Governor Kazuo Ueda told parliament today that Japan’s inflation is gradually aligning with the central bank’s 2% goal, supported by improving wages and steady domestic demand. He reiterated the BoJ aims for moderate inflation accompanied by rising incomes and economic improvement, rather than price gains driven solely by import costs or temporary shocks.
Ueda noted that while demand for food and other non-durable goods has softened, household consumption remains resilient thanks to higher incomes and a tight labor market. He highlighted that stronger wage growth is helping sustain a moderate cycle of rising prices and pay—an essential precondition for durable inflation in the BoJ’s framework.
He added that underlying inflation—stripping out volatile components—is gradually accelerating toward the 2% target, driven not only by food but also by price increases across a broader range of goods and services.
"When we look at underlying inflation that strips away temporary factors, it is gradually accelerating toward our 2% target," he said.
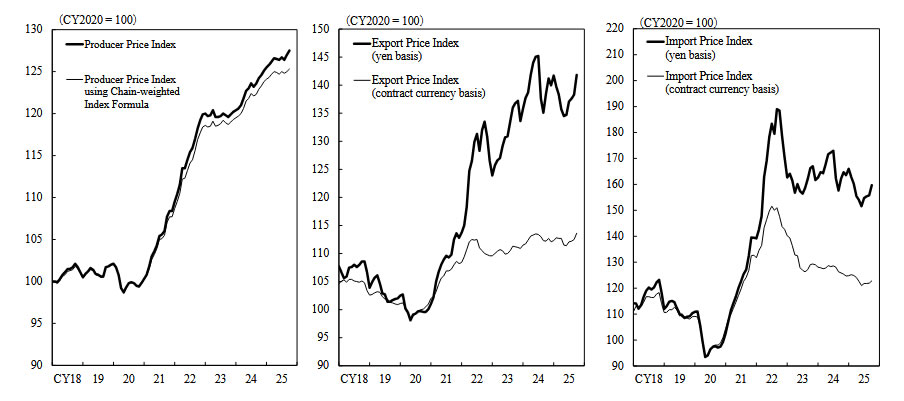
Japan CGPI rises 2.7% yoy in October, weak yen fails to lift import prices
Japan’s Corporate Goods Price Index rose 2.7% yoy in October, easing slightly from 2.8% in September but exceeding expectations of 2.5%, according to Bank of Japan data.
Notably, the Yen-based import price index fell -1.5% from a year earlier, marking its ninth straight month of decline. The persistent drop indicates that the weak Yen is not translating into renewed cost-push inflation—contradicting the typical currency-inflation link.
AUD/USD Daily Report
Daily Pivots: (S1) 0.6521; (P) 0.6535; (R1) 0.6555; More...
AUD/USD's rebound from 0.6457 extended higher today, but it stays below 0.6616 resistance. Intraday bias remains neutral at this point. On the downside, break of 0.6457 will target 0.6413 cluster (38.2% retracement of 0.5913 to 0.6706 at 0.6403). Decisive break there will carry larger bearish implications. On the upside, break of 0.6616 will bring retest of 0.6706 high instead.
In the bigger picture, there is no clear sign that down trend from 0.8006 (2021 high) has completed. Rebound from 0.5913 is seen as a corrective move. Outlook will remain bearish as long as 38.2% retracement of 0.8006 to 0.5913 at 0.6713 holds. Break of 0.6413 support will suggest rejection by 0.6713 and solidify this bearish case. Nevertheless, considering bullish convergence condition in W MACD, sustained break of 0.6713 will be a strong sign of bullish trend reversal, and pave the way to 0.6941 structural resistance for confirmation.
WTI Crude Oil Faces Renewed Pressure — Bears Eye Another Drop
Key Highlights
- WTI Crude Oil prices started a fresh decline from $62.50.
- A key declining channel is forming with resistance at $61.00 on the 4-hour chart.
- Gold started a fresh increase above $4,050 and $4,080.
- The US CPI could increase by 3.0% in Oct 2025 (YoY).
WTI Crude Oil Price Technical Analysis
WTI Crude Oil price struggled above $62.50 against the US Dollar. It started a fresh decline below $61.50 and $61.20 to enter a bearish zone.
Looking at the 4-hour chart of XTI/USD, the price declined below the 50% Fib retracement level of the upward move from the $56.37 swing low to the $62.92 high. The price also settled below $60.50, the 100 simple moving average (red, 4-hour), and the 200 simple moving average (green, 4-hour).
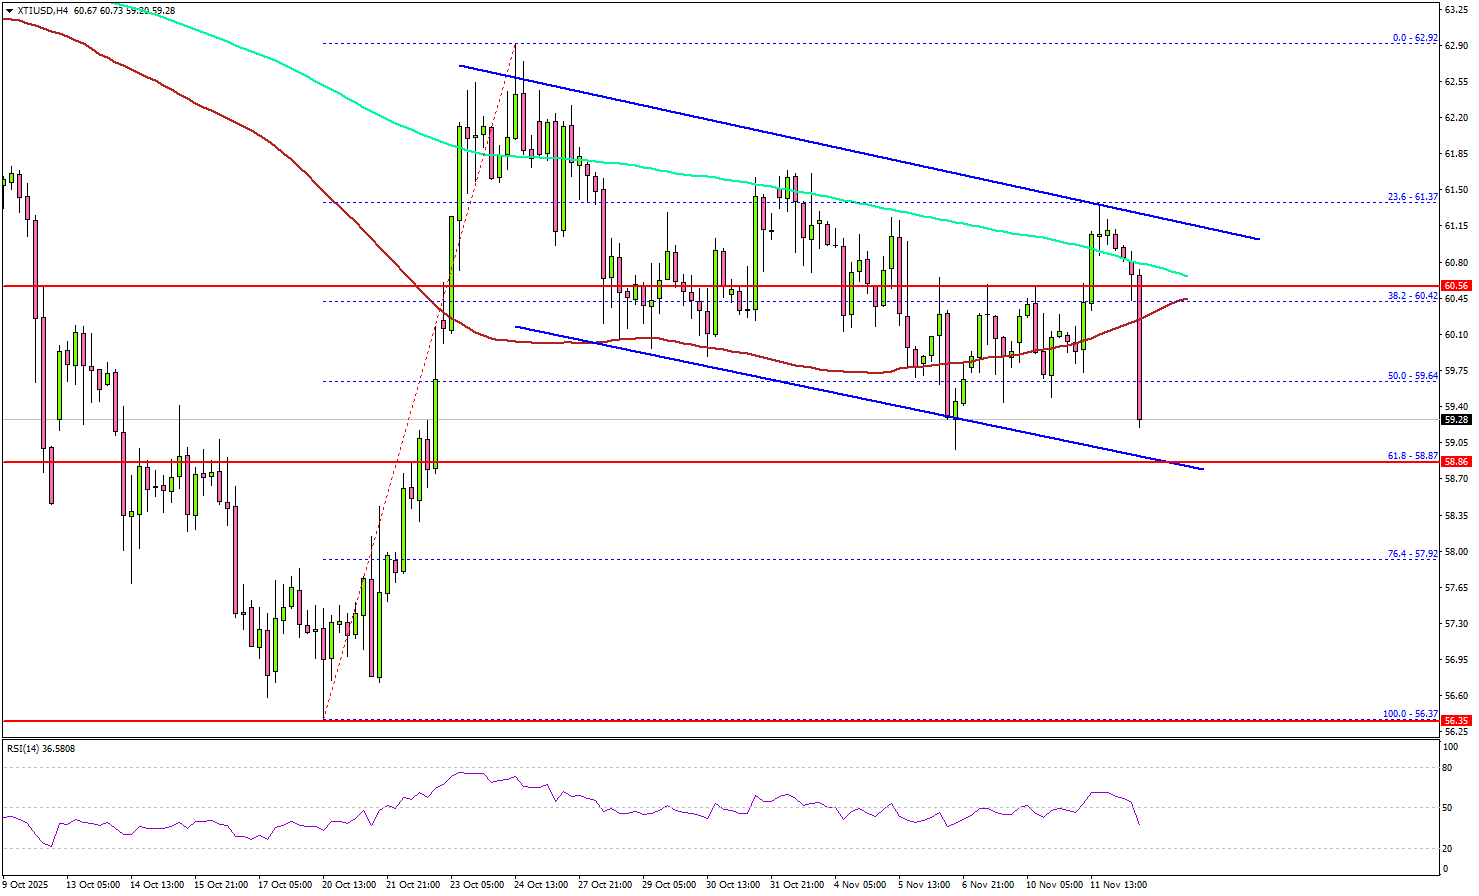
On the downside, the first major support sits near the $58.85 zone and the 61.8% Fib retracement level of the upward move from the $56.37 swing low to the $62.92 high.
The next support could be $58.00. A daily close below $58.00 could open the doors for a larger decline. In the stated case, the bears might aim for a drop toward $56.50. Any more losses could open the doors for a test of the $55.00 zone.
On the upside, immediate resistance is near the $60.50 level and the 100 simple moving average (red, 4-hour). The first key hurdle for the bulls could be $61.00. The main hurdle sits at $62.00. A close above $62.00 might send Oil prices toward $63.20. Any more gains might call for a test of $65.00 in the near term.
Looking at Gold, the bulls remained in action, and the price started a fresh increase above the $4,080 resistance.
Economic Releases to Watch Today
- US Consumer Price Index for Oct 2025 (MoM) – Forecast +0.2%, versus +0.3% previous.
- US Consumer Price Index for Oct 2025 (YoY) – Forecast +3.0%, versus +3.0% previous.
- US Initial Jobless Claims - Forecast 223K, versus 218K previous.
Australia jobs surge 42.2k in October as unemployment rate falls to 4.3%
Australia’s labor market showed renewed strength in October, with employment rising by 42.2k, more than double market expectations of 20.3k. The gain was driven by a 55.3k surge in full-time positions, partly offset by a -13.1k drop in part-time work, highlighting a solid expansion in higher-quality jobs.
The unemployment rate unexpectedly fell from 4.5% to 4.3%, beating forecasts of 4.4%, while the participation rate held steady at 67.0%. Meanwhile, monthly hours worked climbed 0.5% mom, further underscoring the underlying resilience of labor demand.
The upbeat figures reaffirm Australia’s labor market resilience and encourage the RBA to maintain its current cautious tone rather than pivot quickly toward easing. With inflation pressures lingering and employment holding firm, the RBA is likely to wait for clearer signs of slack before signaling rate cuts—keeping February as the earliest plausible window for policy adjustment.
BoJ’s Ueda highlights tight job market, resilient consumption
BoJ Governor Kazuo Ueda told parliament today that Japan’s inflation is gradually aligning with the central bank’s 2% goal, supported by improving wages and steady domestic demand. He reiterated the BoJ aims for moderate inflation accompanied by rising incomes and economic improvement, rather than price gains driven solely by import costs or temporary shocks.
Ueda noted that while demand for food and other non-durable goods has softened, household consumption remains resilient thanks to higher incomes and a tight labor market. He highlighted that stronger wage growth is helping sustain a moderate cycle of rising prices and pay—an essential precondition for durable inflation in the BoJ’s framework.
He added that underlying inflation—stripping out volatile components—is gradually accelerating toward the 2% target, driven not only by food but also by price increases across a broader range of goods and services.
"When we look at underlying inflation that strips away temporary factors, it is gradually accelerating toward our 2% target," he said.
Japan CGPI rises 2.7% yoy in October, weak yen fails to lift import prices
Japan’s Corporate Goods Price Index rose 2.7% yoy in October, easing slightly from 2.8% in September but exceeding expectations of 2.5%, according to Bank of Japan data.
Notably, the Yen-based import price index fell -1.5% from a year earlier, marking its ninth straight month of decline. The persistent drop indicates that the weak Yen is not translating into renewed cost-push inflation—contradicting the typical currency-inflation link.
Bitcoin BTCUSD Elliott Wave Analysis : Forecasting Decline After 3-Wave Recovery
Hello traders. In this technical article we’re going to look at the Elliott Wave charts of Bitcoin BTCUSD published in members area of the website. BTCUSD has recently given us a 3 waves recovery that found sellers as expected. In this discussion, we’ll break down the Elliott Wave forecast and present the target area.
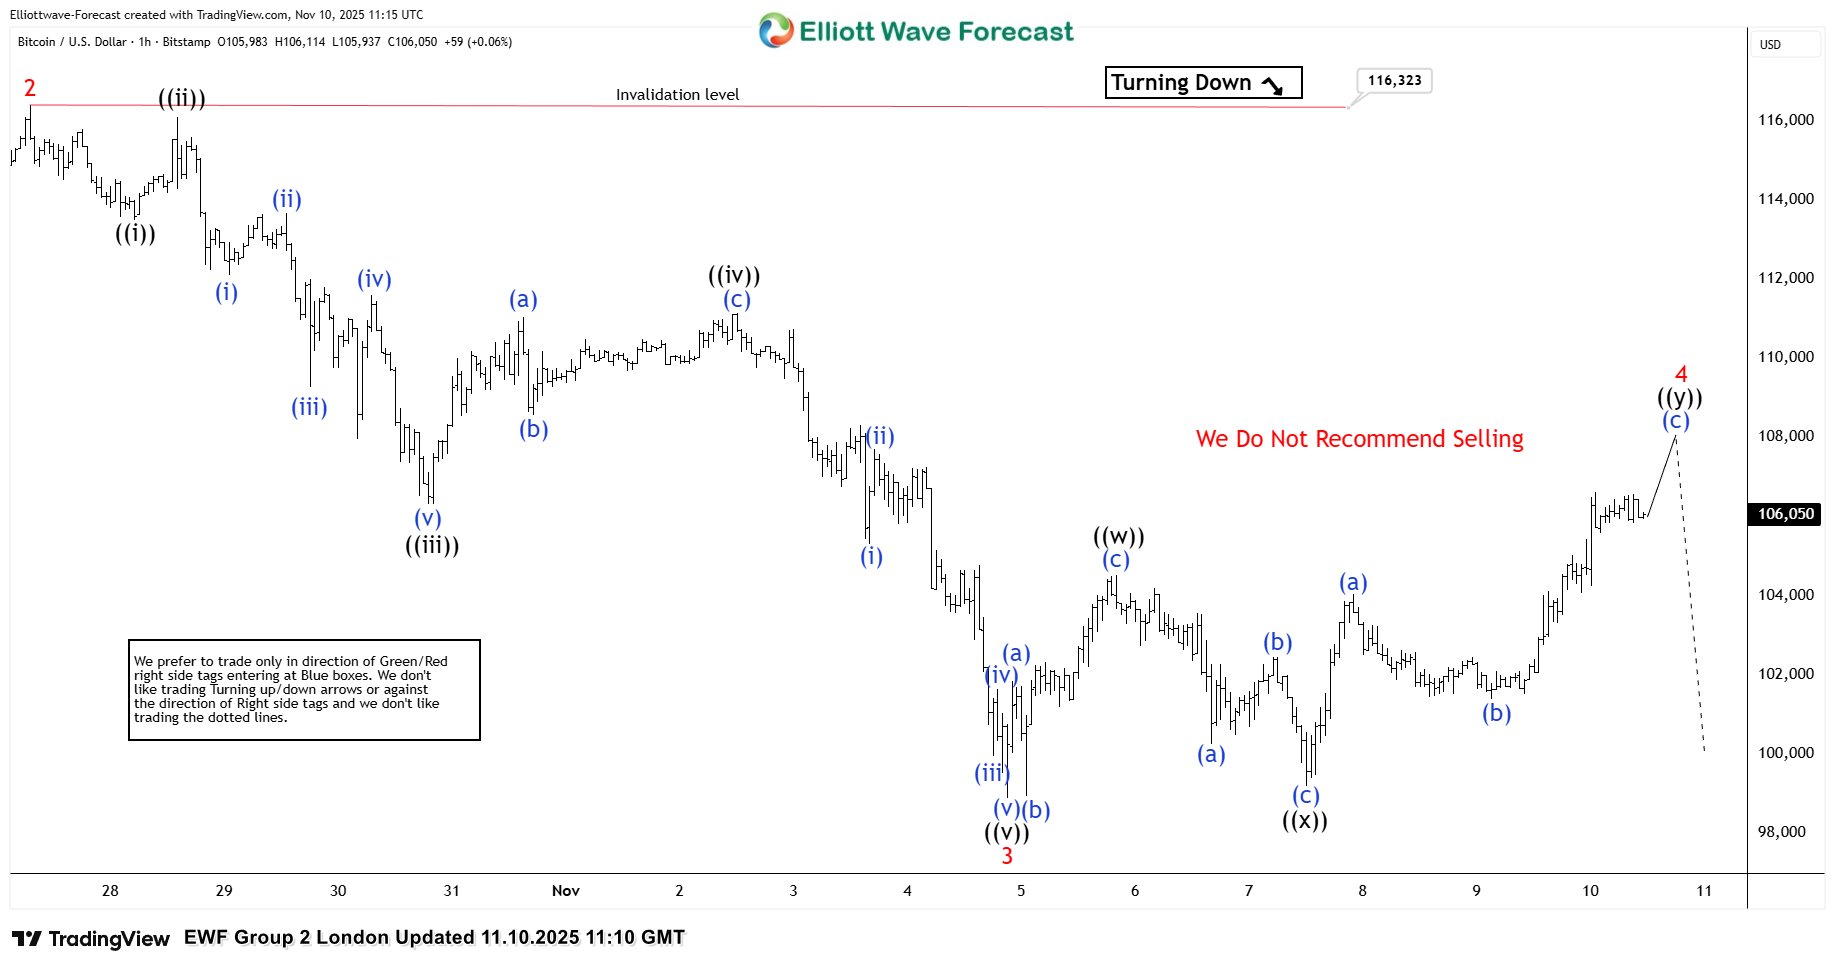
BTCUSD Elliott Wave 1 Hour Chart 11.10.2025
BTCUSD ended a 5-wave decline in the cycle from the 116.323 peak. Currently, the crypto is showing a recovery against that peak — wave 4 red. As our members know, we determine the potential ending point of a correction by measuring the equal legs area. In this case, we measure the 1.00–1.618 Fibonacci extension of waves ((w))–((x)). The reversal area (sellers’ zone) comes at 104.942–108.471. The price is already within the sellers’ zone, and we anticipate another leg down from this area or at least a 3-wave pullback.
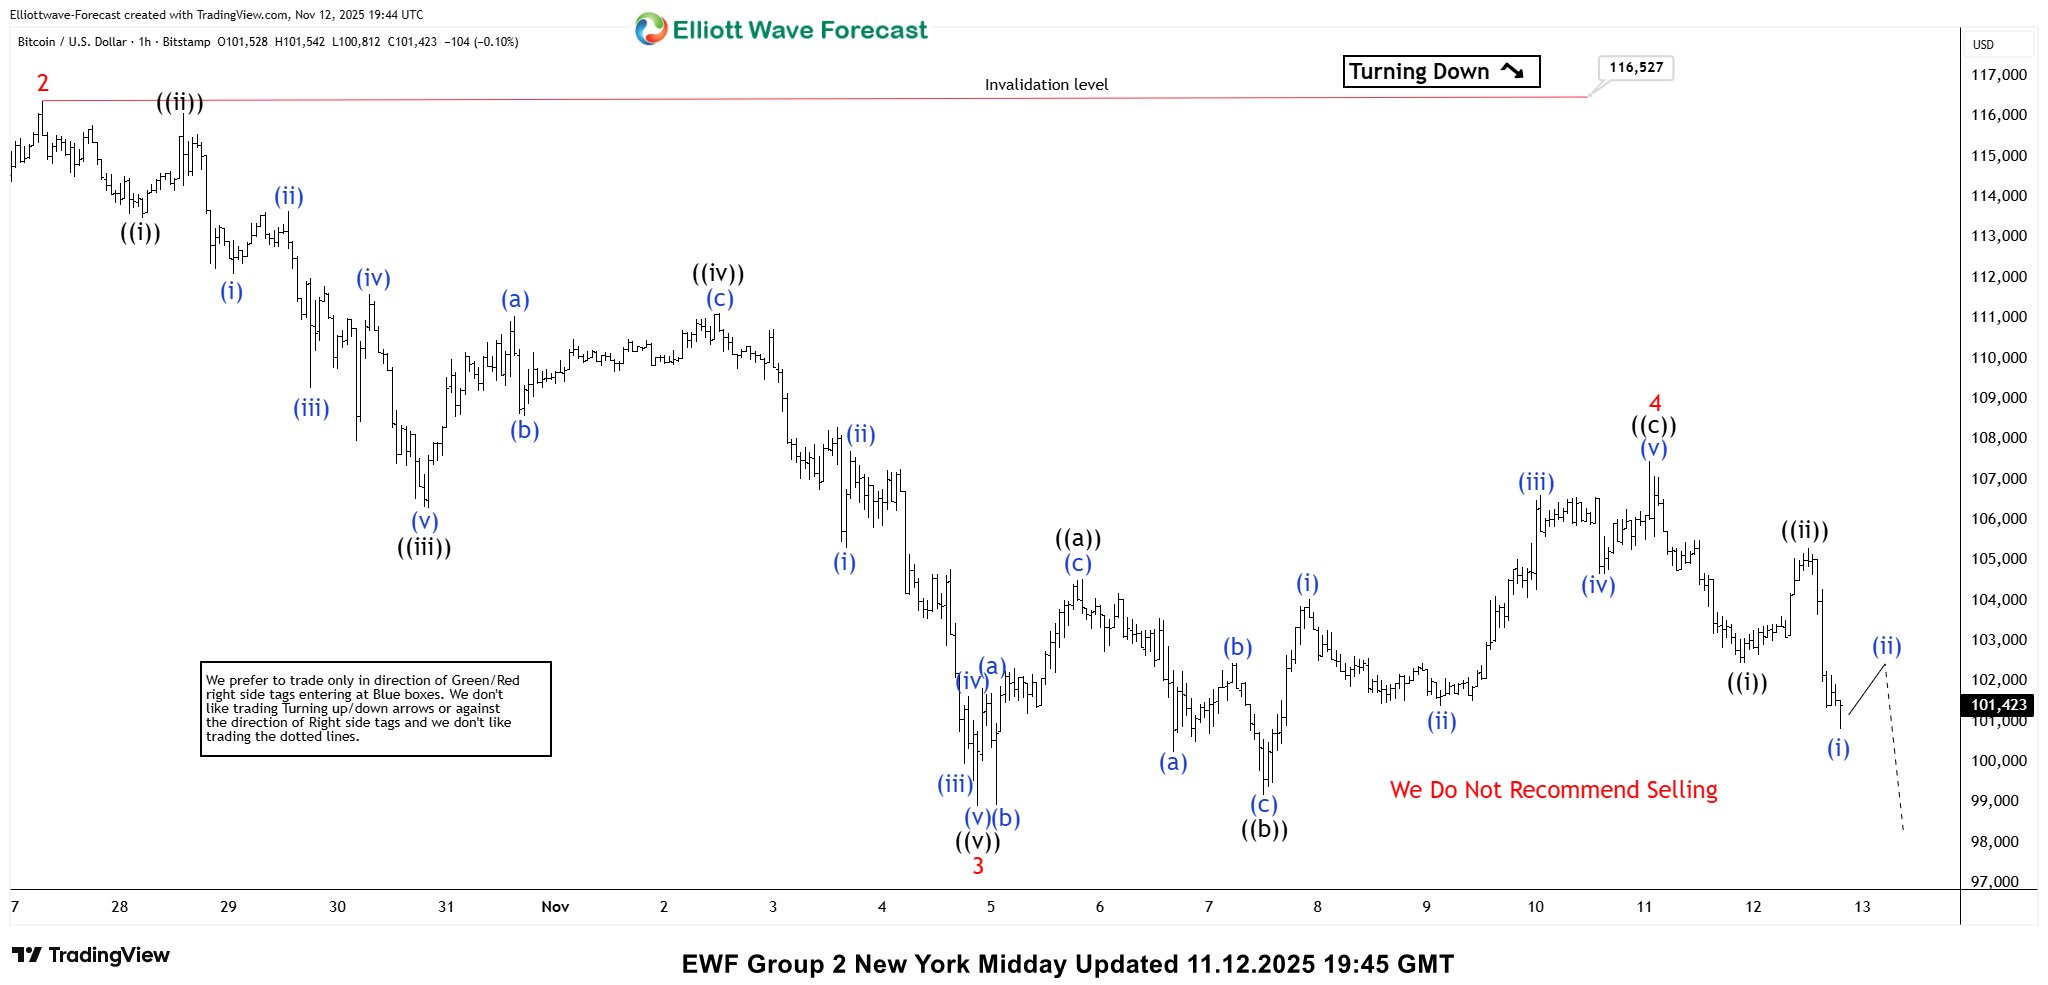
BTCUSD Elliott Wave 1 Hour Chart 11.12.2025
The crypto ended wave 4 within the mentioned area, and we got a decent decline as expected. Ideally, the price should break below the previous low – wave 3 red – to confirm that wave 5 is in progress toward the 96,962–93,704 area. Keep in mind, we don’t recommend selling Bitcoin. The overall trend remains bullish according to higher time frames, and we will treat any pullback as a potential buying opportunity. For trading setups, please follow our Live Trading Room.
WTI Oil Dives 4%: Black Gold Freefalls After OPEC Report – Outlook
After yesterday’s 1.7% rally, many participants believed that the bottom was finally in for Oil—and for good reason.
Exxon (XOM) shares surged to 2025 highs, while a series of headlines about India and other major buyers of Russian oil reinforced strong fundamentals to the fakeout.
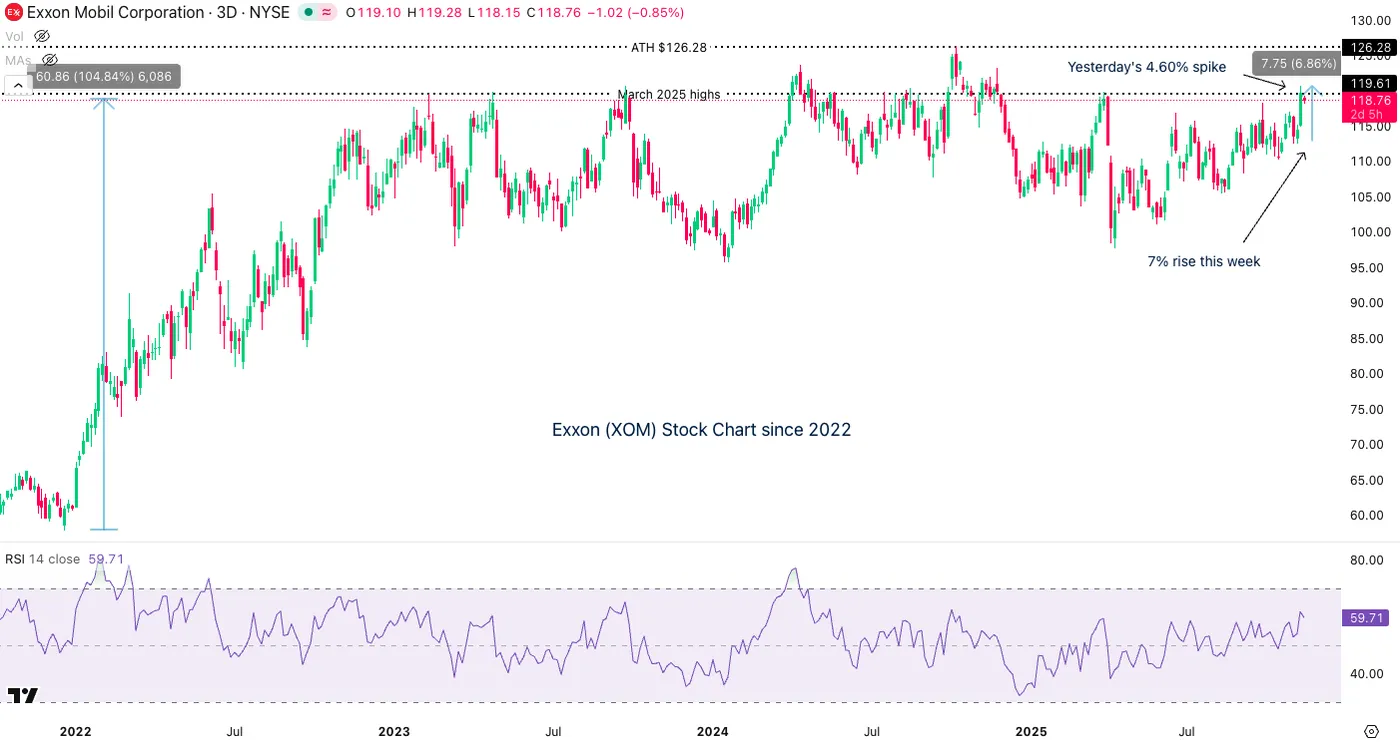
Exxon (XOM) 3-Day Chart, November 12, 2025 – Source: TradingView
But that would hardly fit this year’s pattern for Oil, which has preferred to zig-zag in a cloud of pricing confusion.
As discussed in last month’s Oil analysis, almost every price pop has been followed by a sharp correction, resulting in a rangebound-but-downtrending market.
The latest catalyst came from the Monthly OPEC report released this morning. It highlighted high US strategic reserves, sluggish Chinese growth, and persistent oversupply from nations funding their conflicts—such as Russia and Iran.
The report offers a mine (pun intended) of insightful charts and is worth even a quick glance – You can access it right here.
This dynamic may extend across the energy complex, as other commodities have stalled since the 2022 price spikes, plateauing through much of this year.
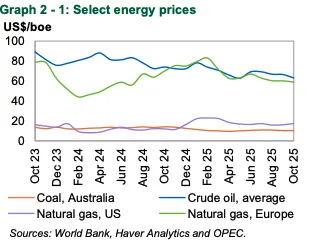
Trends in Energy Commodities throughout the year, November 12, 2025 – Source: OPEC
OPEC+’s internal rivalries only add to the pressure, with member states competing for market share while the major producers continue to flood the market amid elevated supply regimes.
Let's dive in our multi-timeframe analysis for WTI Oil.
US Oil multi-timeframe analysis
Daily Chart
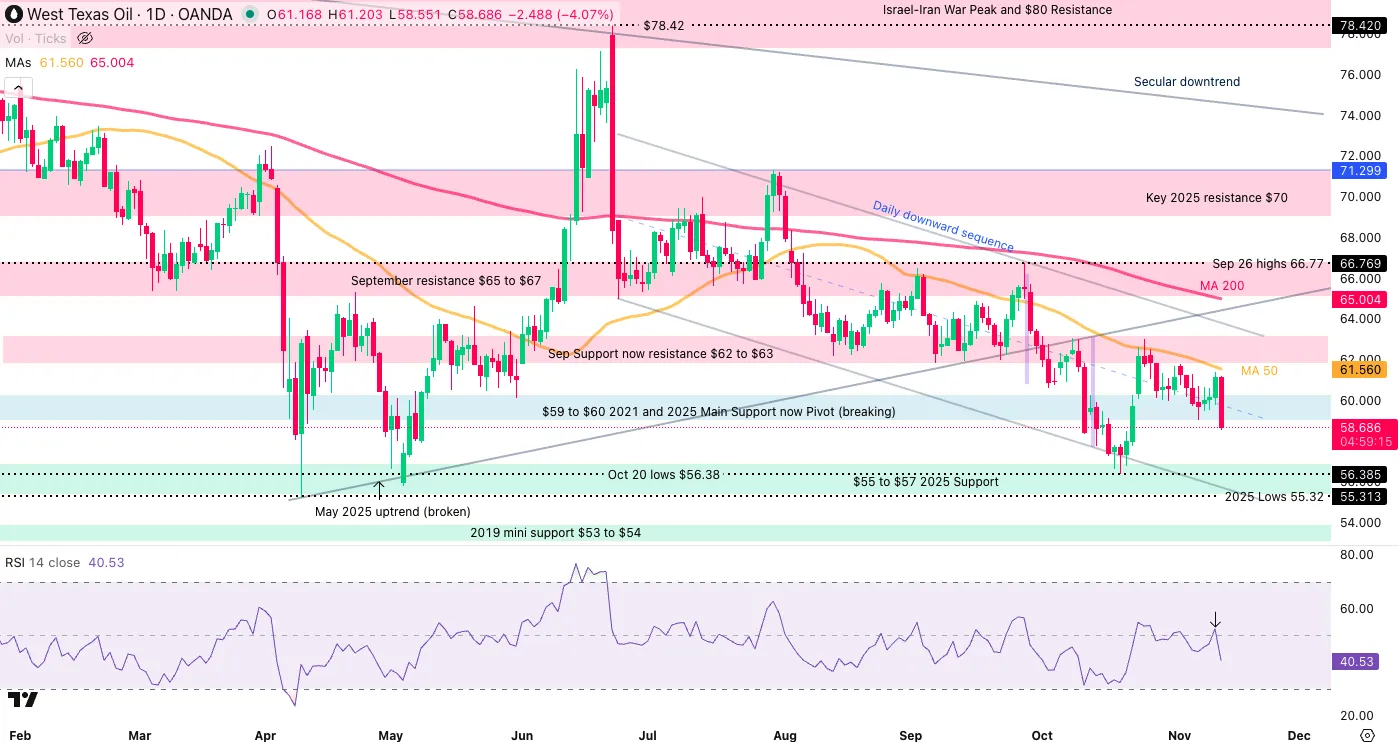
US Oil (WTI) Daily Chart, November 12, 2025 – Source: TradingView
Still evolving in a key downward channel, Oil has been contained by its 50-Day moving average throughout the past week and really stands out as the key technical indicator to watch.
Breaking below its $59 to $60 support yet again, there isn't much to restrain prices from re0-entering the 2025 low support region between $55 to $57.
The lows of the channel is a level to keep in mind at around $55.70 which would come very close to the Liberation Day lows.
As long as prices fail to break and close above the 50-Day MA, the downtrend has more probabilities to hold.
4H Chart and levels
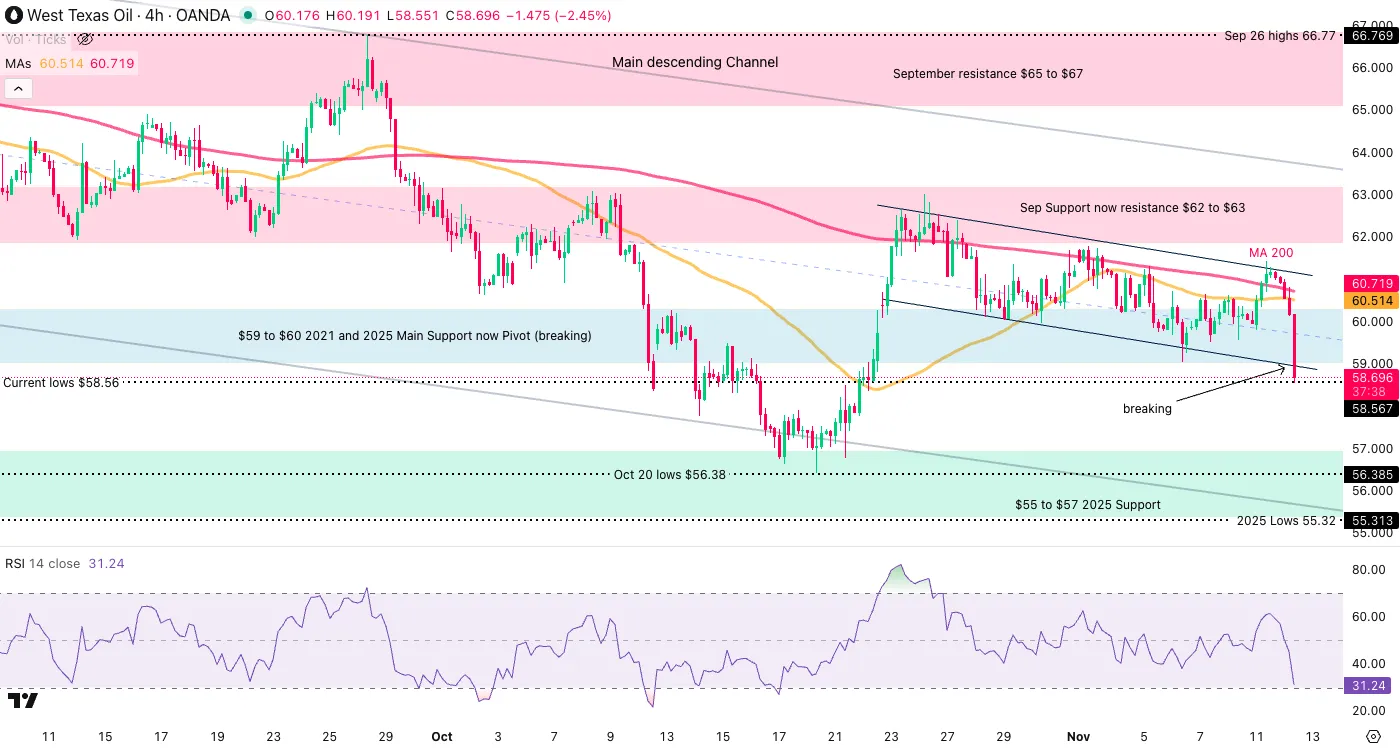
US Oil (WTI) 4H Chart, November 12, 2025 – Source: TradingView
Levels to place on your WTI charts:
Resistance Levels
- Key September Resistance $65 to $66
- Sep Support now resistance $62 to $63
- $61.50 50-Day MA
- $59 to $60 2021 Support now Pivot (breaking)
Support Levels
- $55 to $57 2025 Support
- Oct 20 lows $56.38
- $55.70 channel lows
- Current lows $58.56
1H Chart
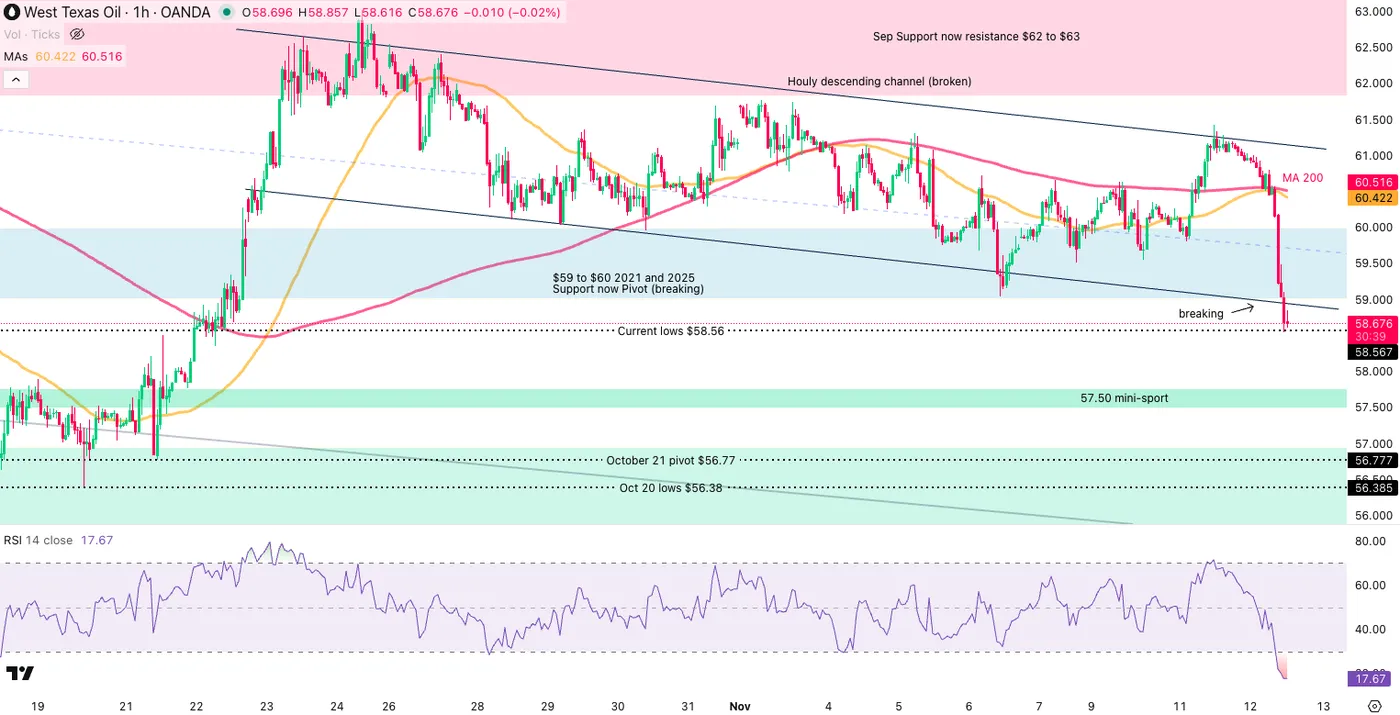
US Oil (WTI) 1H Chart, November 12, 2025 – Source: TradingView
The 1H picture shows one of bear dominance in this morning of price action which even led to the breakdown of this week's fresh Downward hourly channel.
Still, the 1H RSI is oversold, which is slowing the current fall.
A daily Close below hints at further downside, while a return within keeps a more balanced-bearish outlook.
Expect more volatility looking forward and keep an eye on geopolitical headlines.
Safe Trades!