
Sample Category Title
WTI Oil Dives 4%: Black Gold Freefalls After OPEC Report – Outlook
After yesterday’s 1.7% rally, many participants believed that the bottom was finally in for Oil—and for good reason.
Exxon (XOM) shares surged to 2025 highs, while a series of headlines about India and other major buyers of Russian oil reinforced strong fundamentals to the fakeout.
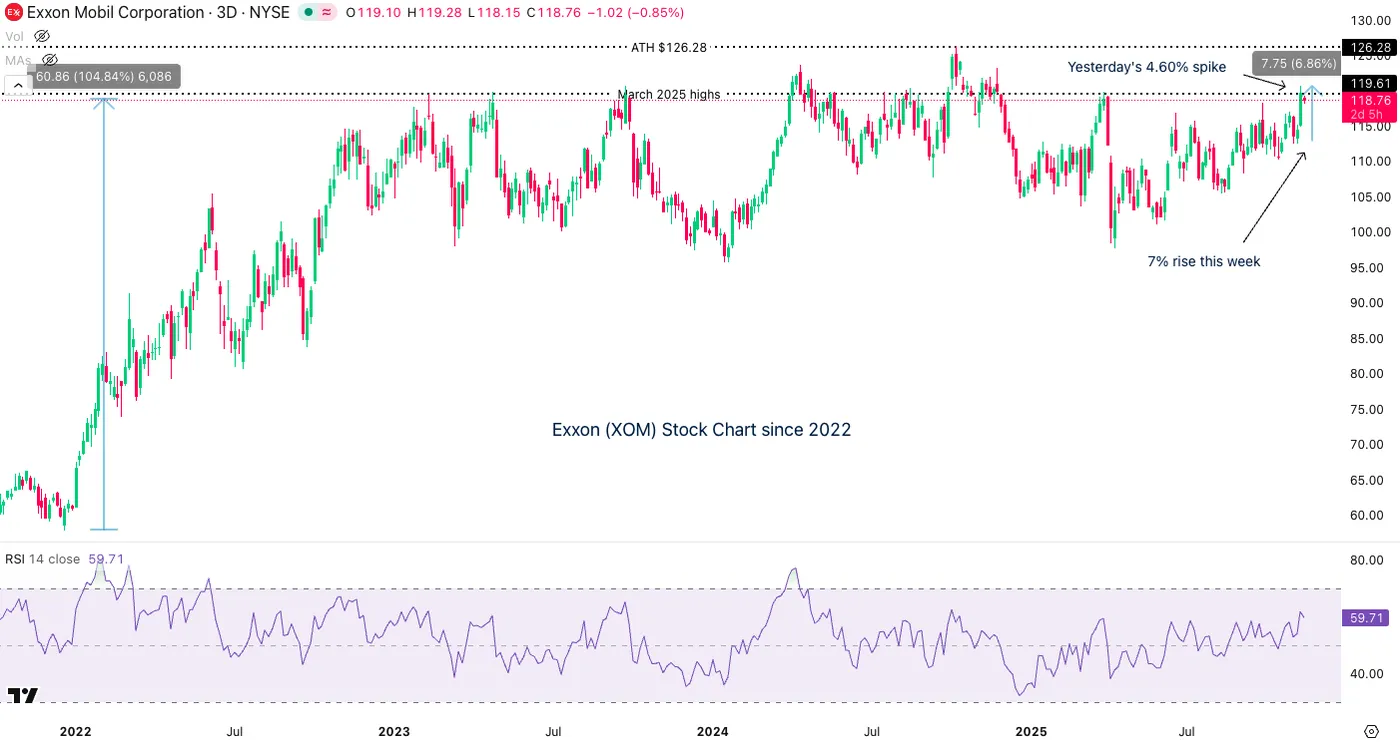
Exxon (XOM) 3-Day Chart, November 12, 2025 – Source: TradingView
But that would hardly fit this year’s pattern for Oil, which has preferred to zig-zag in a cloud of pricing confusion.
As discussed in last month’s Oil analysis, almost every price pop has been followed by a sharp correction, resulting in a rangebound-but-downtrending market.
The latest catalyst came from the Monthly OPEC report released this morning. It highlighted high US strategic reserves, sluggish Chinese growth, and persistent oversupply from nations funding their conflicts—such as Russia and Iran.
The report offers a mine (pun intended) of insightful charts and is worth even a quick glance – You can access it right here.
This dynamic may extend across the energy complex, as other commodities have stalled since the 2022 price spikes, plateauing through much of this year.
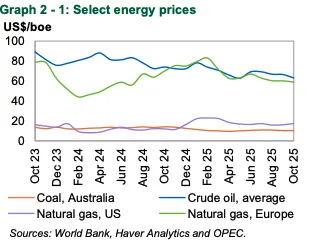
Trends in Energy Commodities throughout the year, November 12, 2025 – Source: OPEC
OPEC+’s internal rivalries only add to the pressure, with member states competing for market share while the major producers continue to flood the market amid elevated supply regimes.
Let's dive in our multi-timeframe analysis for WTI Oil.
US Oil multi-timeframe analysis
Daily Chart
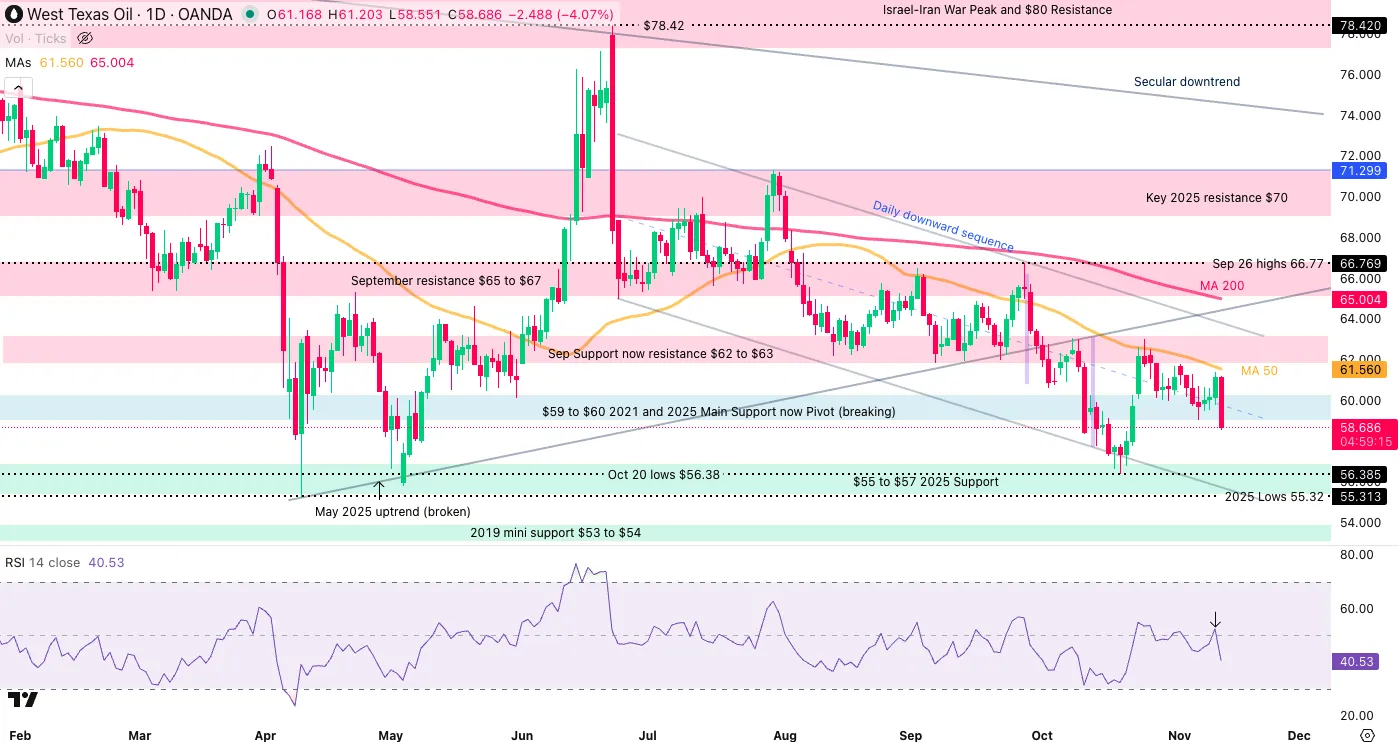
US Oil (WTI) Daily Chart, November 12, 2025 – Source: TradingView
Still evolving in a key downward channel, Oil has been contained by its 50-Day moving average throughout the past week and really stands out as the key technical indicator to watch.
Breaking below its $59 to $60 support yet again, there isn't much to restrain prices from re0-entering the 2025 low support region between $55 to $57.
The lows of the channel is a level to keep in mind at around $55.70 which would come very close to the Liberation Day lows.
As long as prices fail to break and close above the 50-Day MA, the downtrend has more probabilities to hold.
4H Chart and levels
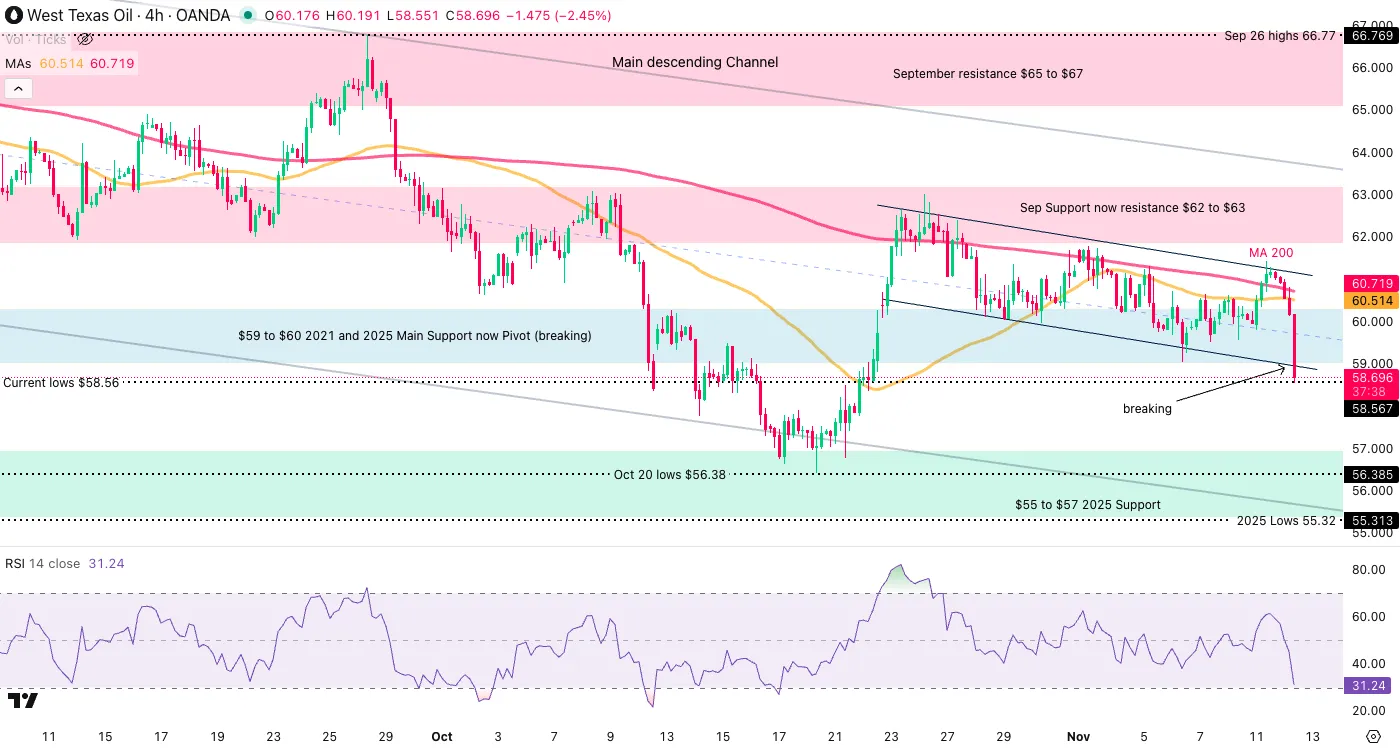
US Oil (WTI) 4H Chart, November 12, 2025 – Source: TradingView
Levels to place on your WTI charts:
Resistance Levels
- Key September Resistance $65 to $66
- Sep Support now resistance $62 to $63
- $61.50 50-Day MA
- $59 to $60 2021 Support now Pivot (breaking)
Support Levels
- $55 to $57 2025 Support
- Oct 20 lows $56.38
- $55.70 channel lows
- Current lows $58.56
1H Chart
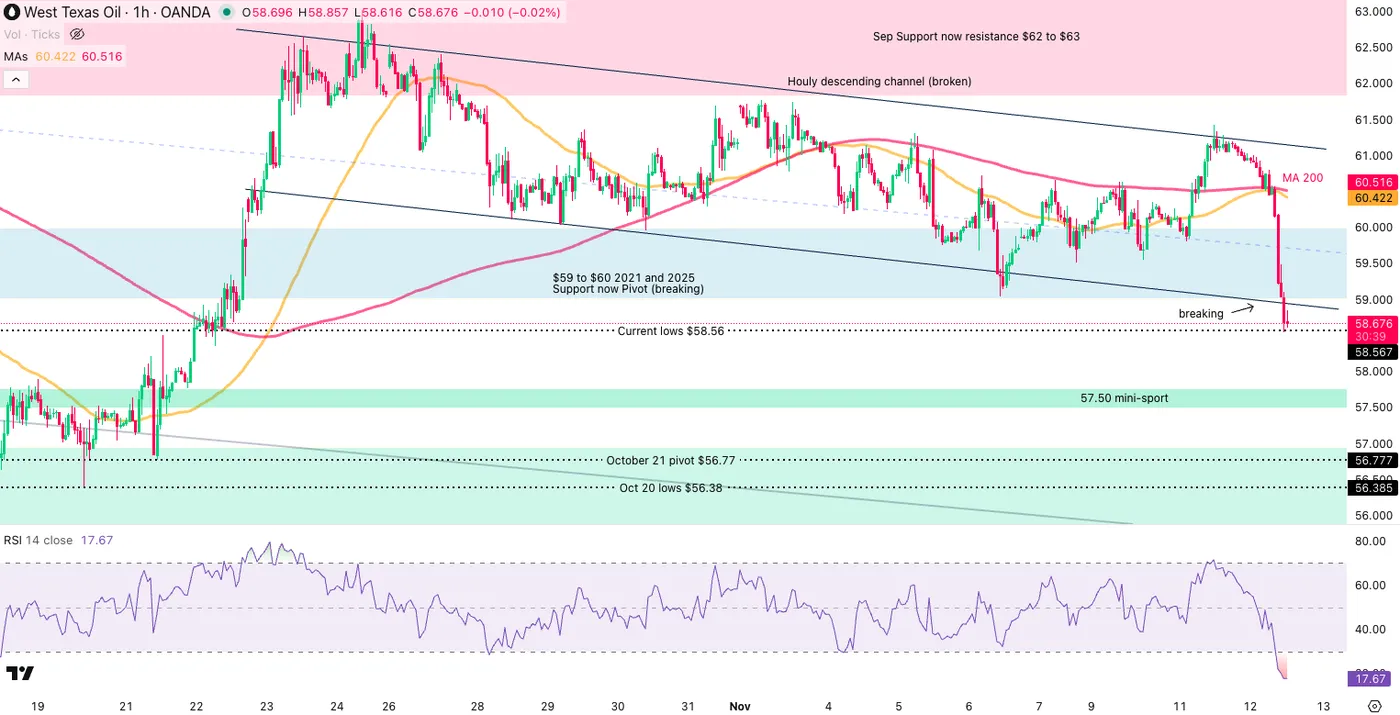
US Oil (WTI) 1H Chart, November 12, 2025 – Source: TradingView
The 1H picture shows one of bear dominance in this morning of price action which even led to the breakdown of this week's fresh Downward hourly channel.
Still, the 1H RSI is oversold, which is slowing the current fall.
A daily Close below hints at further downside, while a return within keeps a more balanced-bearish outlook.
Expect more volatility looking forward and keep an eye on geopolitical headlines.
Safe Trades!
USD/JPY Outlook as It Hits 155.00: PM Takaichi Drives the Pair to New Cycle Highs
When the USD/JPY was free-falling toward 146.00 before the election results, few traders could have imagined such a sharp reversal was about to unfold.
Appointed in early October as a replacement for the departed Prime Minister Ishiba, PM Sanae Takaichi immediately turned on the taps of massive economic support for the Japanese economy.
The issue for yen bulls is that the Bank of Japan was on track to normalize monetary policy—after two decades of ultra-loose conditions—amid a return of inflation.
That trajectory now faces resistance from a prime minister eager to influence the BoJ, saying she “strongly hopes the BOJ conducts policy appropriately” in a speech at the Japanese Parliament.
Such remarks often trigger strong market reactions, as traders progressively price a not-so-independent central bank and politic influences hurting a stable resolution of inflation – both not good for any currency.
As a result, USD/JPY has surged more than 800 pips (about 0.56%), now trading just below the 155.00 handle, a level that has already prompted verbal intervention from the Finance Minister, who condemned the yen’s rapid slide.
In any case, let’s dive into a multi-timeframe analysis of USD/JPY to identify where the pair could be heading next.
USD/JPY multi-timeframe analysis
Daily chart
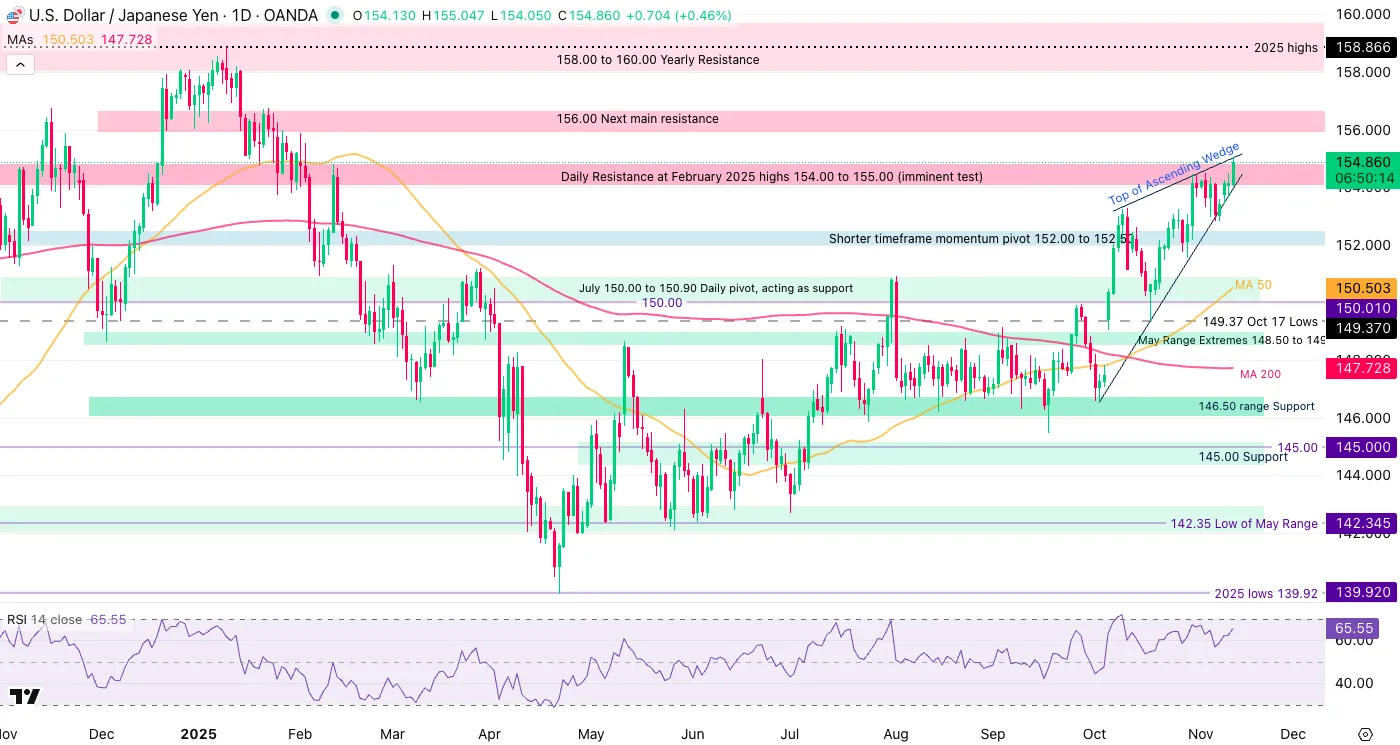
USD/JPY Daily Chart, November 12, 2025 – Source: TradingView
USD/JPY bulls launch a new offensive to break the 154.50 to 155.00 resistance which will act as a last barrier to a full-on breakout in the pair.
With the Bank of Japan still hesitant to pull the trigger on a hike, only a few technical barriers are stalling the move.
The 155.00 level is acting strong and will be a key point to monitor towards the session close:
- Expect large reactions if the pair closes above the level.
- Failing to close above will give more points for mean-reversion, with the market assuming that today's comments were priced in.
An ascending wedge is also largely in place which contains the price action for now but also gives another element to watch on breakout/rejection scnearios.
Let's take a closer look.
4H Chart and levels
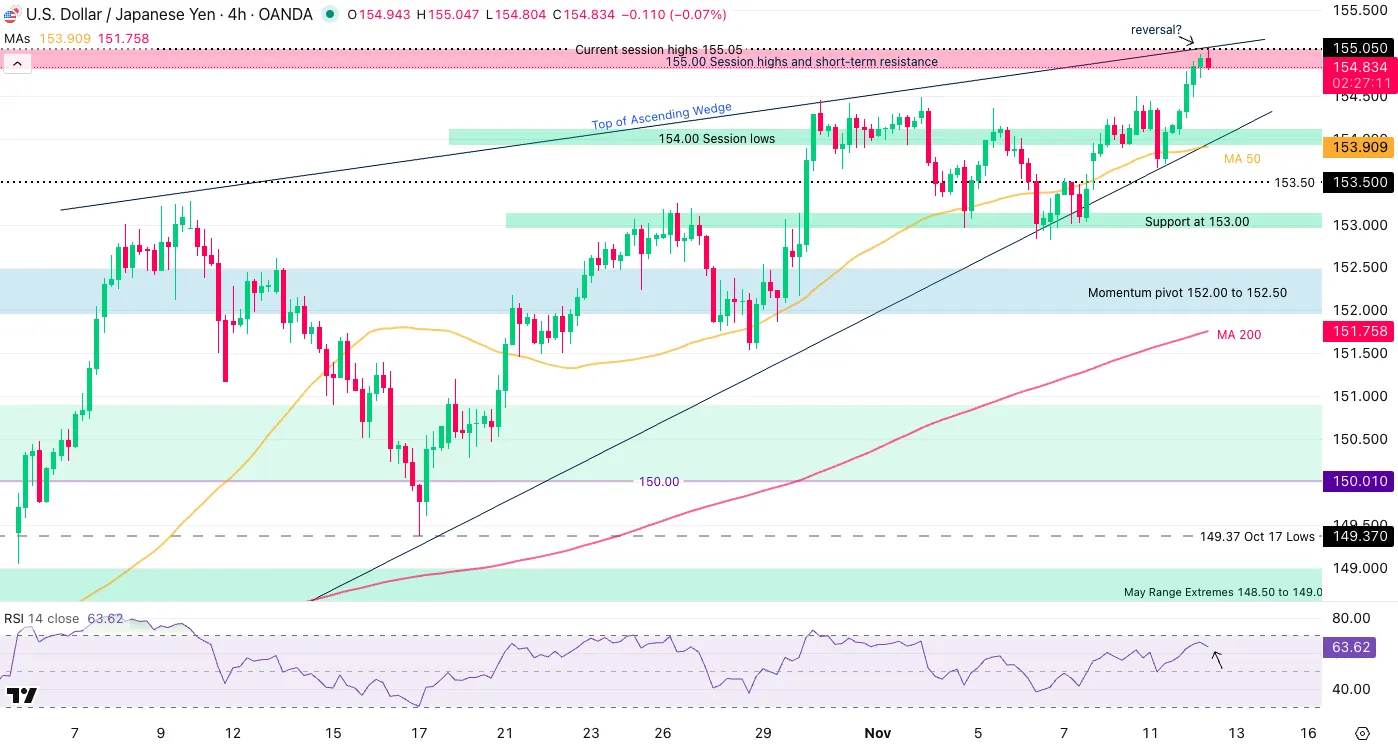
USD/JPY 4H Chart, November 12, 2025 – Source: TradingView
USD/JPY technical levels of interest:
Support Levels:
- Session lows and short-term support 154.050
- Short-term support 153.50
- Momentum pivot 152.00 to 152.50
- 151.50 Oct 28 rebound (minor support)
Resistance Levels:
- Session highs 155.047
- Daily Resistance at February 2025 highs 154.50 to 155.00 (imminent resistance)
- 156.00 to 156.70 Next main resistance
- 158.00 to 160.00 Yearly Resistance
1H Chart
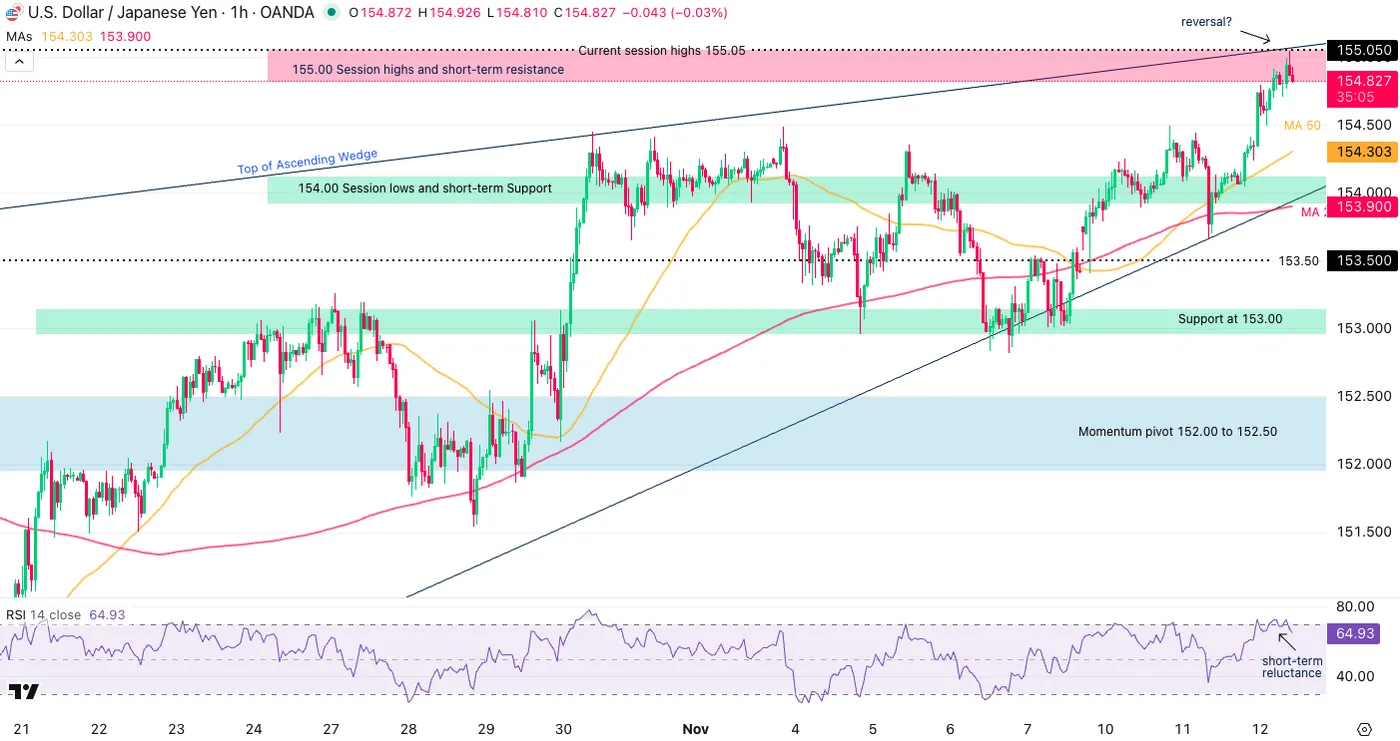
USD/JPY 1H Chart, November 12, 2025 – Source: TradingView
The shorter timeframe shows a more balanced price action on the short-term, with some bull-exhaustion towards overbought levels.
This gives that much more emphasis on the 155.00 handle which will be the level which dictates upcoming trends.
If a small retracement extends from here, watch the reactions at the bottom trendline of the wedge to spot if buyers recharge – Failing to do so may prompt further downside.
Safe Trades!
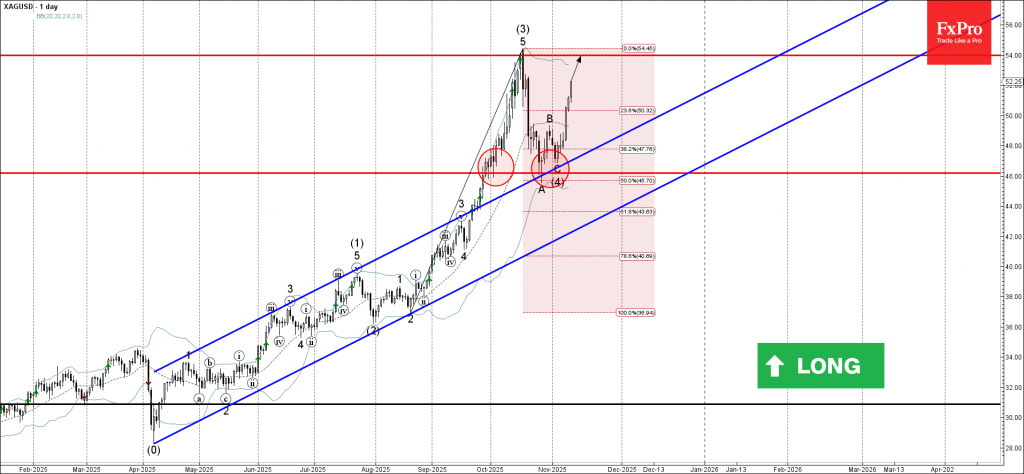
Silver Wave Analysis
Silver: ⬆️ Buy
- Silver broke round resistance level 50.00
- Likely to reach resistance level 54.00
Silver continues to rise inside the intermediate impulse wave (5), which started earlier from the support zone between the support level 46.00, lower daily Bollinger Band and the 50% Fibonacci correction of the upward impulse from August.
The price earlier broke the round resistance level 50.00 – which accelerated the active impulse wave (5).
Given the strong daily uptrend, Silver can be expected to rise further to the next resistance level 54.00 (which stopped the earlier impulse wave (3) in October).
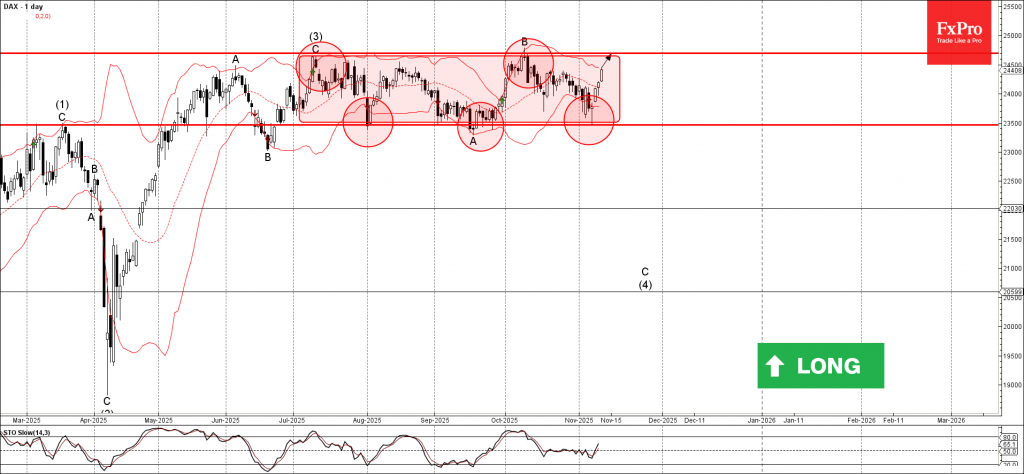
DAX index Wave Analysis
DAX index: ⬆️ Buy
- DAX index reversed from support level 23500.00
- Likely to rise to resistance level 24695.00
DAX index recently reversed with the daily Hammer from the support level 23500.00 (lower border of the sideways price range inside which the index has been moving from July, as can be seen from the daily DAX chart below).
The support level 23500.00 was strengthened by the lower daily Bollinger Band.
Given the clear daily uptrend, DAX index can be expected to rise further to the next resistance level 24695.00 (upper border of the active sideways price range, which stopped earlier waves (3) and B).
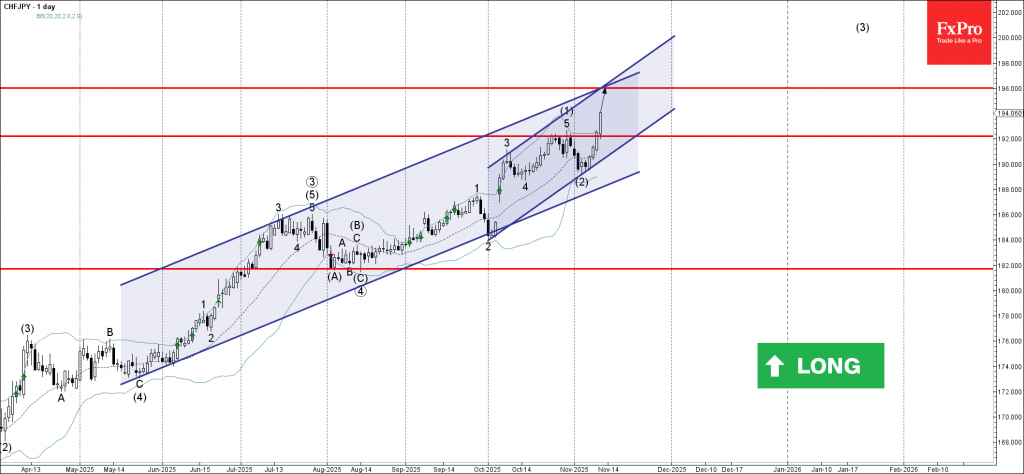
CHFJPY Wave Analysis
CHFJPY: ⬆️ Buy
- CHFJPY broke pivotal resistance level 192.00
- Likely to rise to resistance level 196.00
CHFJPY currency pair recently broke above the pivotal resistance level 192.00 (which stopped the previous impulse wave (1), as can be seen from the daily CHFJPY chart below).
The breakout of the resistance level 192.00 accelerated the active intermediate impulse wave (3) from the start of November.
Given the overriding daily uptrend, CHFJPY currency pair can be expected to rise to the next resistance level 196.00 (coinciding with the resistance trendlines of the two up channels from October and May).
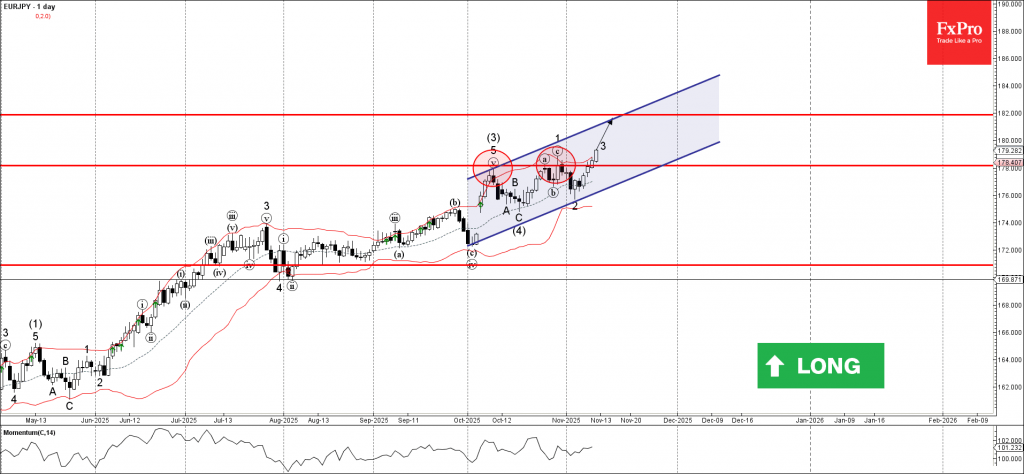
EURJPY Wave Analysis
EURJPY: ⬆️ Buy
- EURJPY broke strong resistance level 178.00
- Likely to rise to resistance level 182.00
EURJPY currency pair recently broke above the strong resistance level 178.00 (which has been reversing the price from the start of October, having stopped the previous waves (3) and 1, as can be seen below).
The breakout of the resistance level 0.9325 accelerated the active impulse wave 3 of the intermediate impulse wave (5) from the middle of October.
Given the strong daily uptrend and the bearish yen sentiment seen today, EURJPY currency pair can be expected to rise to the next resistance level 182.00.
USDJPY Elliott Wave View: Extends Rally After Buyers Zone Reaction
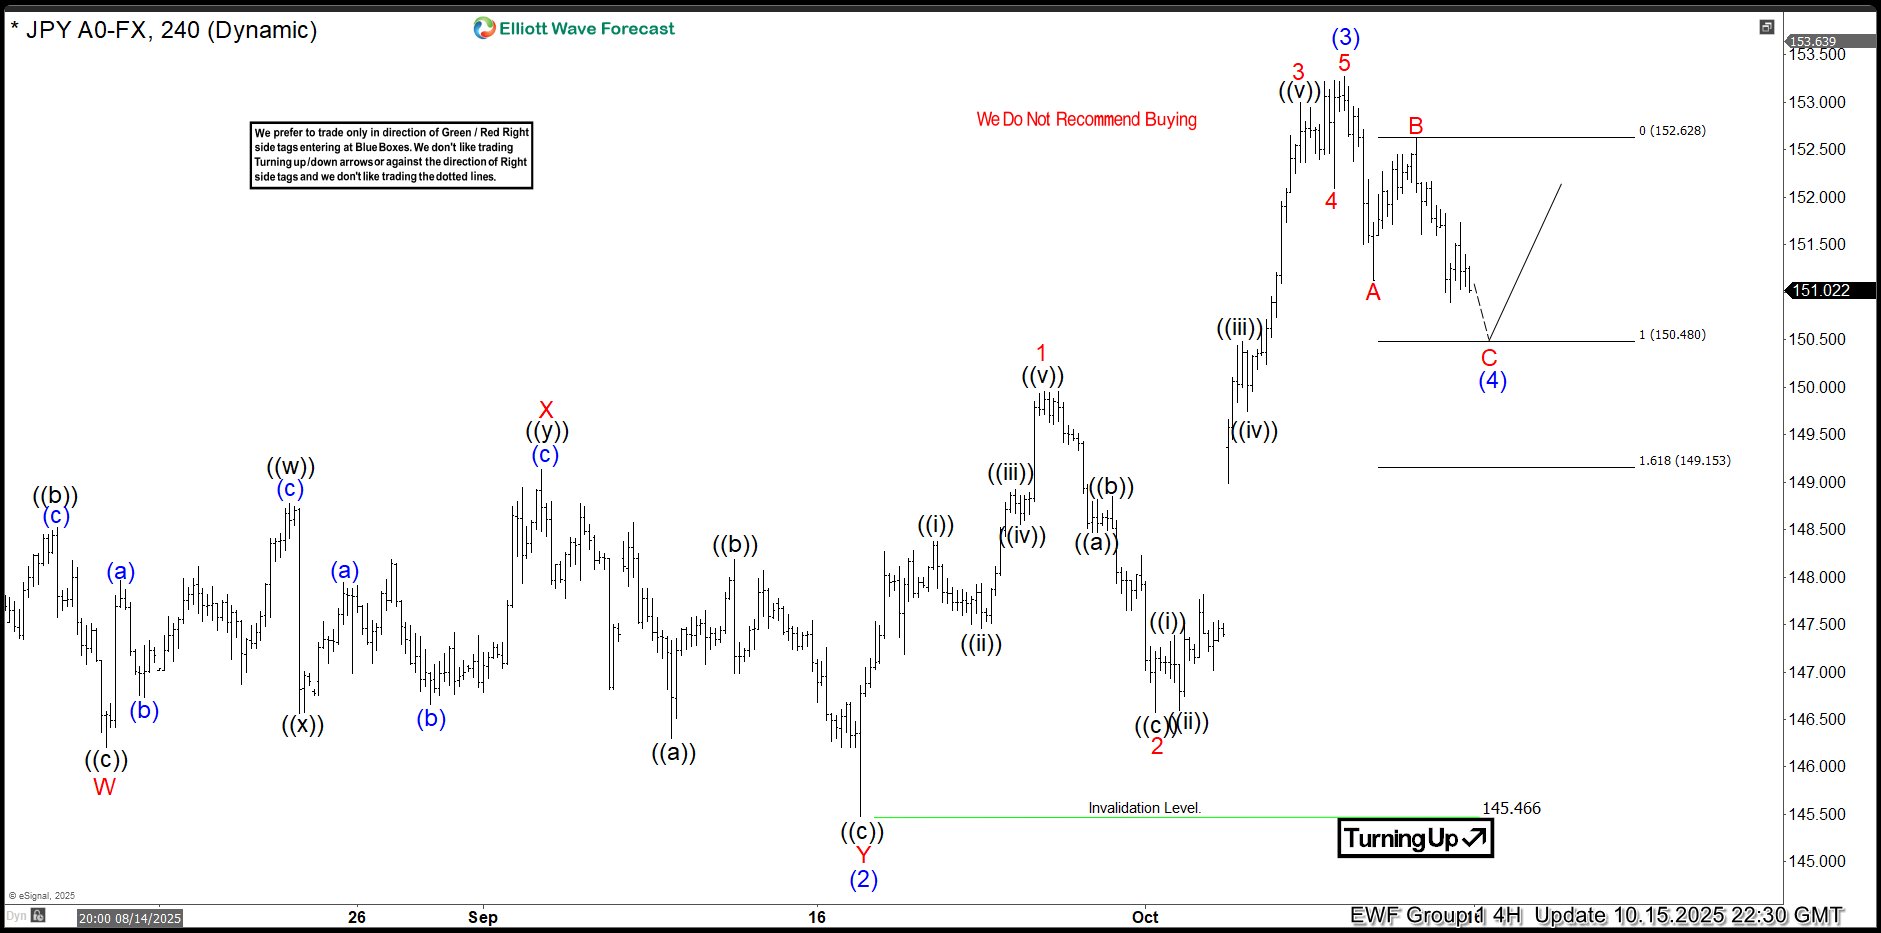
Hello fellow traders. In this technical article we’re going to take a look at the Elliott Wave charts of USDJPY Forex pair published in members area of the website. As our members know USDJPY is in overall bullish trend. Recently the pair made a clear three-wave correction. The pull back completed right at the extreme area ( buyers zone) and made rally as we expected. In this discussion, we’ll break down the Elliott Wave forcast.
USDJPY Elliott Wave 4 Hour Chart 10.15.2025
USDJPY is forming a Zig Zag pullback. The correction shows incomplete sequences at the moment. We expect to see an extension down toward the marked equal legs zone at 150.48–149.15. In that area, buyers should appear again and take the lead. Ideally, we expect a rally toward new highs, or at least a 3-wave bounce as an alternative view. We advise against selling $USDJPY and instead favor the long side from the marked equal legs area at 150.48–149.15.
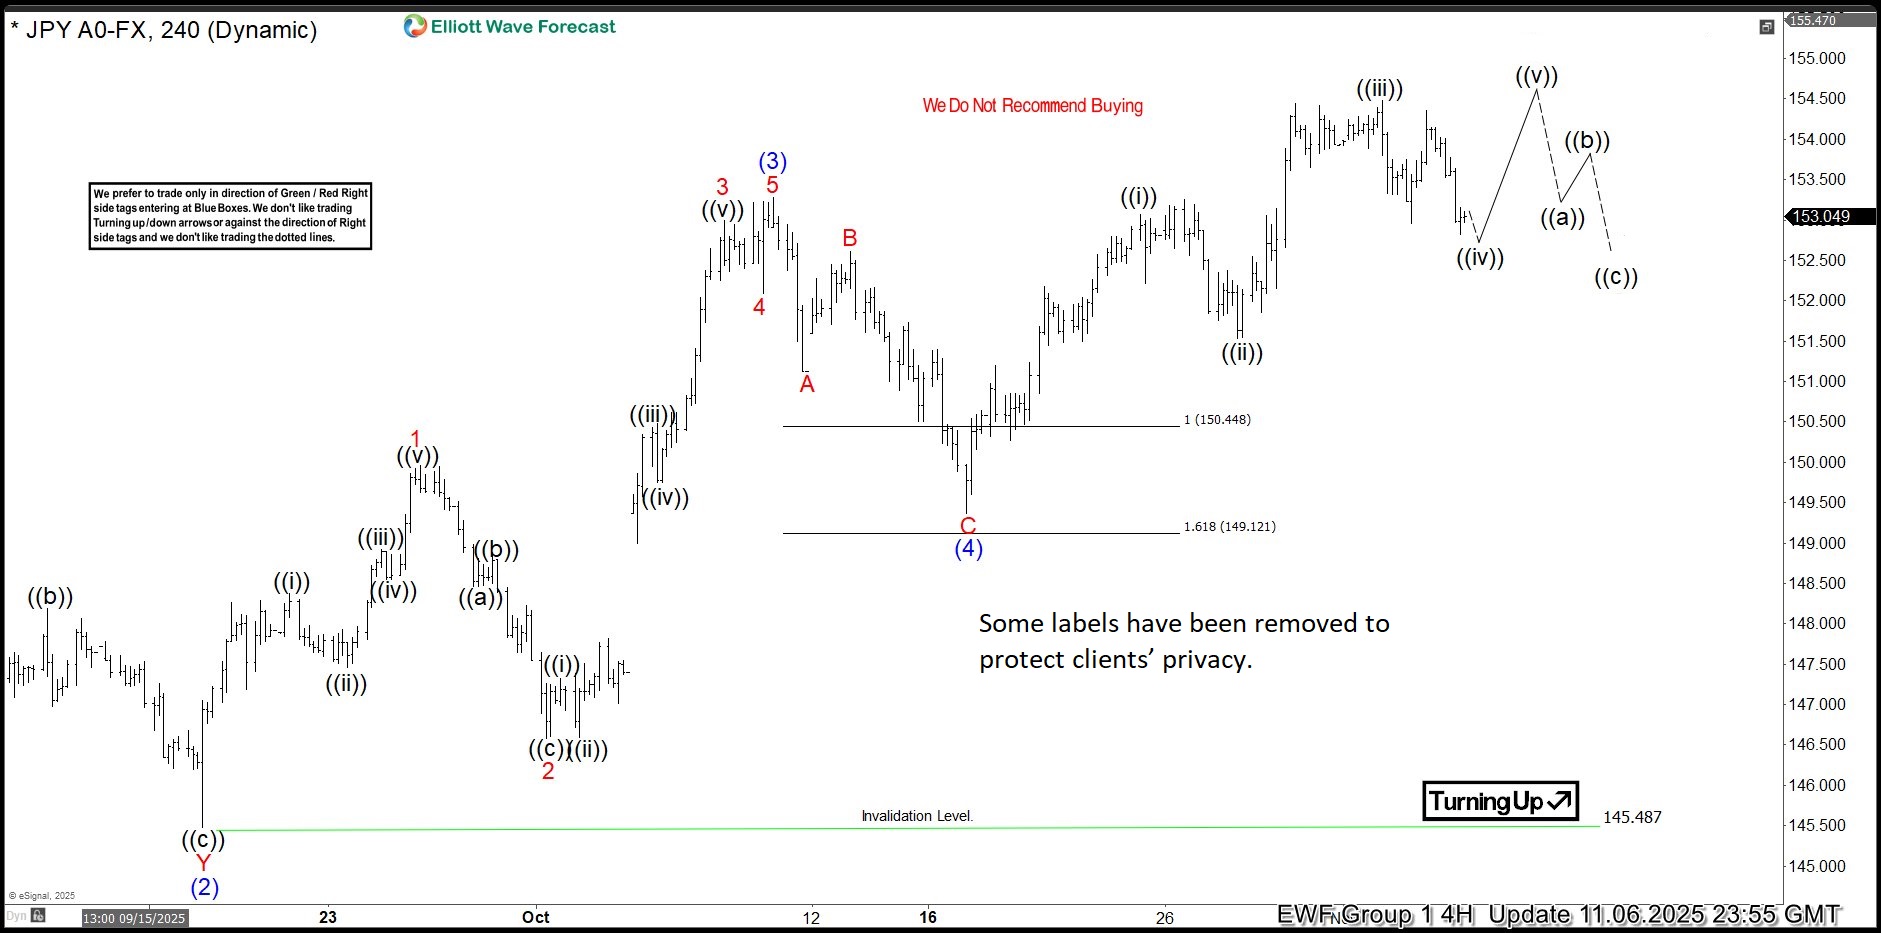
USDJPY Elliott Wave 4 Hour Chart 10.15.2025
USDJPY found buyers at the equal legs zone as expected. The forex pair has reacted strongly and eventually we got a break toward new highs.
Keep in mind that market is dynamic and presented view could have changed in the mean time.
XAU/USD: Takes a Breather After Recent Rally But Bulls Remain in Control Above $4,100
Gold price holds in consolidating mode for the second consecutive day, as bulls take a breather after strong rally on Monday, which broke above some key barriers and generated fresh bullish signals.
Very limited profit taking keeps the price afloat above $4100 (reverted to solid support) while upticks were capped at $4145 and so far unable to register close above cracked important Fibo resistance at $4134 (50% retracement of $4381/$3886/daily Kijun-sen/bull-channel upper boundary), clear break of which to spark fresh acceleration higher.
Daily studies show MA’s in full bullish setup but countered by 14-d momentum stuck at the centreline and overbought stochastic that currently lacks clear near-term direction signal.
However, the metal’s price holds steady after the latest rally that contributes overall bullish bias and keep focus at the upside.
Pause in the latest recovery was mainly caused by expectations of the US House vote on a deal to reopen the government and release delayed economic data which would provide more details about the condition of the US economy and Fed’s monetary policy path.
Bullish scenario sees sustained break of $4134 as a catalyst for fresh advance towards $4192/$4200 (Fibo 61.8% / psychological) and $4264 (Fibo 76.4%) in extension.
Broken $4100 level should ideally hold dips and guard a lower breakpoint at $4075 (broken Fibo 38.2% / 20DMA) loss of which will be bearish.
Res: 4100; 4134; 4150; 4192.
Sup: 4100; 4075; 4046; 4038.

Sunset Market Commentary
Markets
Market moves in FI and FX space are small and technically irrelevant today. They ignore the bullish risk sentiment lifting stock markets to new all-time highs. ECB speeches grabbed some attention in absence of eco data today. Austrian national bank governor Kocher expects that not much will happen with interest-rate policy in the next months. He didn’t see the strong reduction in growth rates and the inflationary effects of the trade conflicts materializing that were anticipated in March and April. The difficulty now is to assess whether there will still be some effects trickling down in the next couple of months or perhaps even years. If any, it’s hard to tell whether this will be overall inflationary or disinflationary, according to Kocher who recently replaced one of the most hawkish voices inside the ECB, governor Holzmann. Bank of France governor Villeroy talked about the country’s growth forecasts, but these might also influence the overall set for the euro zone when the ECB meets next in December. Villeroy believes that current French growth projections of 0.7% for this year and 0.9% for 2026 should now be considered as minimums as the economy continued to show resilience to political turmoil in Q3. For the overall EMU growth trajectory, the central bank penciled in 1.2%-1%-1.3% in September with a first indication for 2028 being available on December 18. When it comes to inflation, the central projected an average 2.1%-1.7%-1.9% over the policy horizon. The 2027 forecast might be subject to a downgrade after an EU parliamentary committee at the beginning of the week backed amendments to the draft climate law including a one-year delay to the Emissions Trading System 2. Without ETS2 taking effect, the inflation undershoot will be larger ceteris paribus. The ETS system caps emissions and lets companies trade allowances with ETS2 extending the concept to buildings and road transport from energy generation, aviation,… ECB Simkus is one the governors who emphasized that a return to 2% inflation by 2027 heavily depends on ETS2. Finally, hawkish ECB board member Schnabel thinks that (growth and inflation) risks are rather tilted a little bit to the upside. Her personal view is one of an economy that is recovering, with a closing output gap, expecting a significant fiscal impulse which stimulates the economy. Disinflationary pressures likes the danger of cheap Chinese goods or an extension of the euro rally are currently out of play while sticky services inflation and still pretty strong food price increases deserve attention.
News & Views
The Norwegian central bank (NB) published its H2 financial stability today. The Norwegian financial system is resilient as households and firms have adequate debt-servicing capacity and as banks are solid. Several events could weaken financial stability though. Norwegian households have high debt-to-income (DTI) ratios, but debt growth has been slower than income growth in recent years. The commercial real estate market is stable, but still challenging for developers. The NB assesses Norwegian banks’ commercial real estate (CRE) exposure as substantial. In recent years, the situation has become more difficult for CRE firms owing to higher financing costs and lower property values, but high employment and increased rental income have enabled most firms to cover expenses with current earnings. Solvency in the CRE sector as a whole improved somewhat. Somewhat higher bank losses on loans to real estate developers are likely though. On the financial sector as a whole; the NB denominates losses as low with banks satisfying capital and liquidity requirements. No reaction in the Norwegian krone with EUR/NOK holding near 11.65.
Indian headline inflation dropped in October to 0.25% Y/Y, down from 1.44% in September, the lowest level ever. The decline was for an important part driven by a sharp 3.72% Y/Y decline in prices of food and beverages. The Ministry of Statistics says that the decline in headline inflation and food inflation is mainly attributed to a full month’s impact of a decline in GST (sales tax) and a favorable base effect. The Reserve bank of India has an inflation target range of 2-6%. According to Bloomberg data, core inflation rose to 4.7% Y/Y (from 4.6%), but this was mainly due to higher gold prices (57.8%). Core CPI excluding gold and sliver in this respect also eased to 2.5% from 2.8%. Even as the inflation dynamics in October maybe reached the bottom, it still supports the case for further easing by the Reserve Bank of India at its early December meeting. The RBI currently has its policy rate at 5.50% after cutting the policy rate by 100 bps YTD. The rupee trades little changed near USD/INR 88.64.