
Sample Category Title
EUR/GBP Daily Outlook
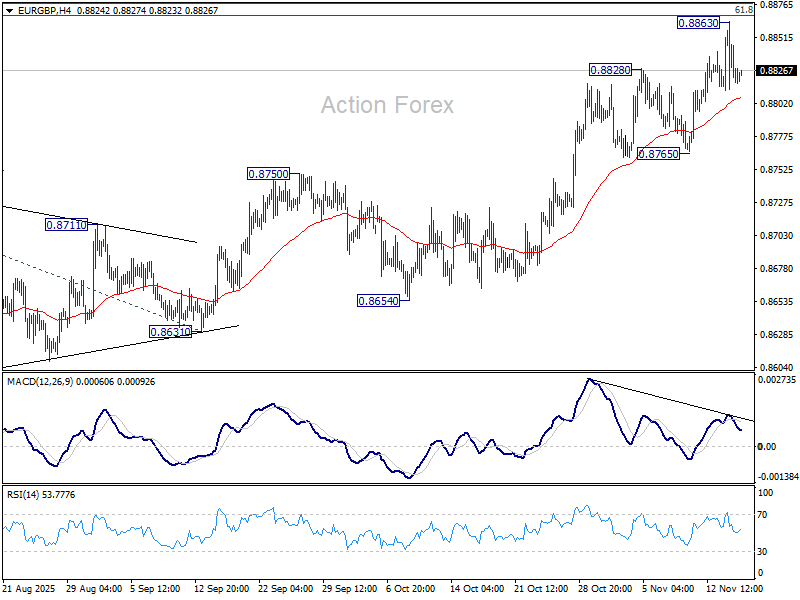
Daily Pivots: (S1) 0.8802; (P) 0.8834; (R1) 0.8854; More…
Intraday bias in EUR/GB remains neutral at this point. Considering bearish divergence condition in 4H MACD, firm break of 0.8765 support will confirm short term topping. Deeper fall should then be seen back to 55 D EMA (now at 0.8729) even still as a correction. On the upside, however, sustained trading above 0.8867 fibonacci level will carry larger bullish implications. Next near term target will be 100% projection of 0.8354 to 0.8752 from 0.8631 at 0.9029.
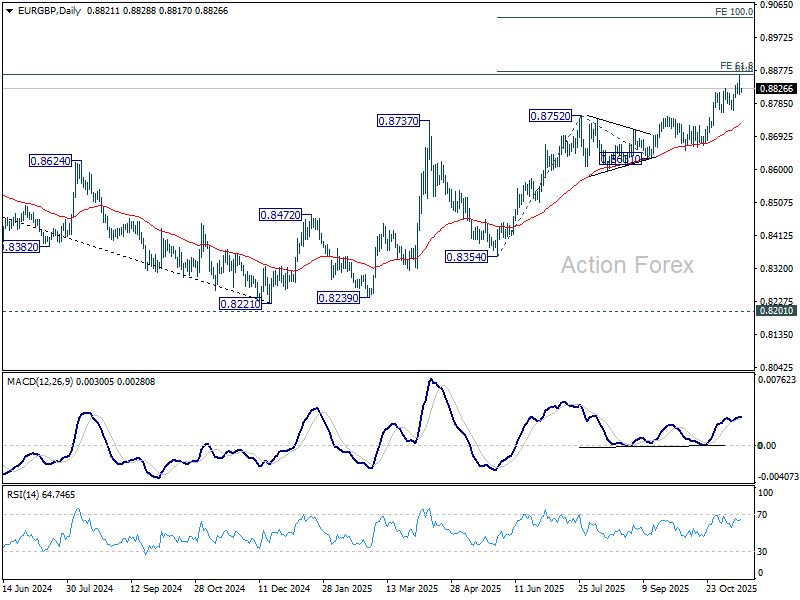
In the bigger picture, rise from 0.8221 medium term bottom is still seen as a corrective move. Upside should be limited by 61.8% retracement of 0.9267 to 0.8221 at 0.8867. Sustained trading below 55 W EMA (now at 0.8589) should confirm that this corrective bounce has completed. However, decisive break of 0.8867 will suggest that EUR/GBP is already reversing whole decline from 0.9267 (2022 high). That should pave the way back to 0.9267.
EUR/AUD Daily Outlook
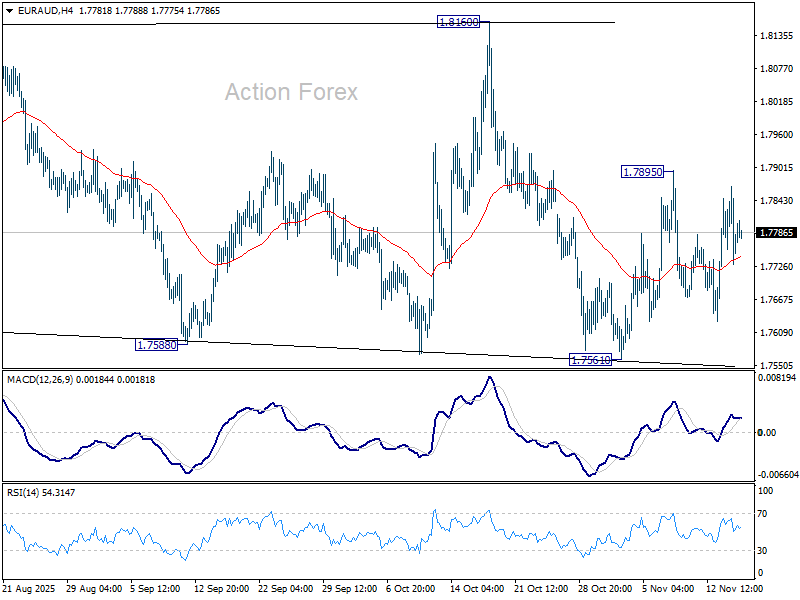
Daily Pivots: (S1) 1.7717; (P) 1.7794; (R1) 1.7856; More...
Range trading continues in EUR/AUD and intraday bias remains neutral. .Outlook is mixed. On the downside, break of 1.7561 support will revive the bearish case that corrective pattern from 1.8554 is in the third leg, and target 1.7245 support. On the upside, though, above 1.7895 will resume the rebound from 1.7561 to 1.8160 resistance.
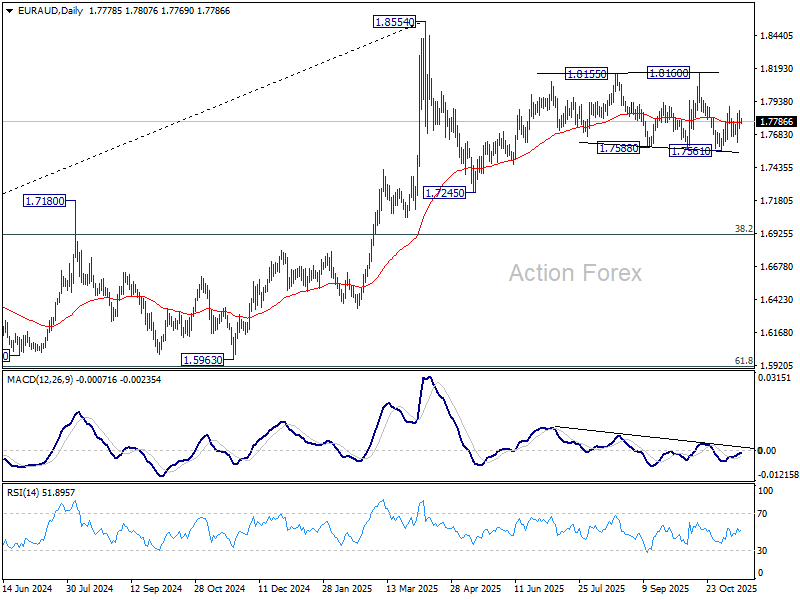
In the bigger picture, price actions from 1.8554 medium term top are seen as a corrective pattern. Sustained break of 55 W EMA (now at 1.7426) will suggest that it's correcting the whole rally from 1.4281 (2022 low). In this case, deeper decline would be seen to 38.2% retracement of 1.4281 to 1.8554 at 1.6922. Nevertheless, strong rebound from 55 W EMA will likely bring resumption of the up trend sooner.
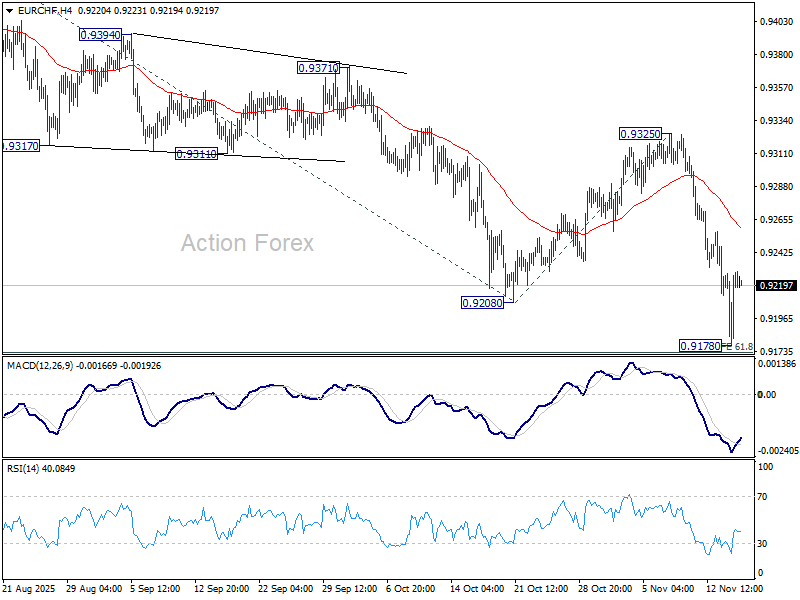
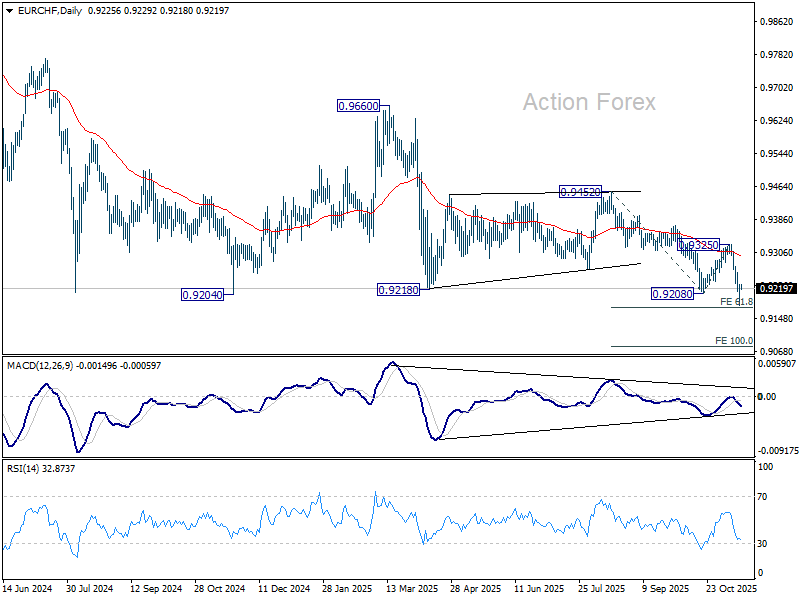
EUR/CHF Daily Outlook
Daily Pivots: (S1) 0.9196; (P) 0.9213; (R1) 0.9247; More....
Intraday bias in EUR/CHF remains neutral and some consolidations could be seen above 0.9178 temporary low. . Recovery should be limited below 0.9325 resistance to bring another fall. Firm break of 0.9178 will extend the larger down trend and target 100% projection of 0.9452 to 0.9208 from 0.9325 at 0.9082.
In the bigger picture, outlook remains bearish with EUR/CHF staying well inside long term falling channel after multiple rejection by 55 W EMA (now at 0.9377). Next target is 61.8% projection of 1.1149 to 0.9407 from 0.9928 at 0.8851. Break of 0.9452 resistance is needed to be the first sign of medium term bottoming. Otherwise, outlook will stay bearish in case of strong rebound.
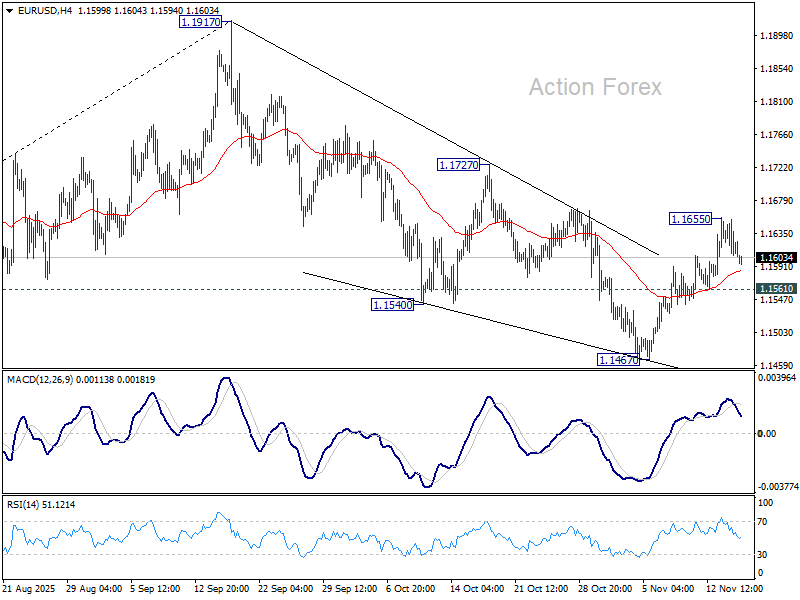
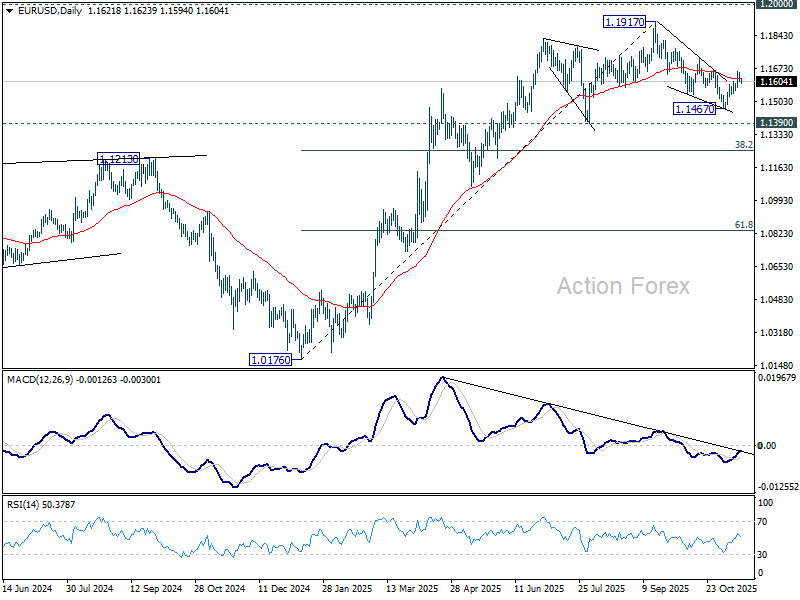
EUR/USD Daily Outlook
Daily Pivots: (S1) 1.1601; (P) 1.1628; (R1) 1.1649; More…
Intraday bias in EUR/USD stays neutral first. Current development suggests that fall from 1.1917 might have completed as a three wave correction at 1.1467. Above 1.1655 will target 1.1727 resistance first. Firm break there will solidify this bullish case and bring retest of 1.1917 high. However, break of 1.1561 will revive near term bearishness and target 1.1467 low instead.
In the bigger picture, considering bearish divergence condition in D MACD, a medium term top is likely in place at 1.1917, just ahead of 1.2 key psychological level. As long as 55 W EMA (now at 1.1328) holds, the up trend from 0.9534 (2022 low) is still in favor to continue. Decisive break of 1.2000 will carry larger bullish implications. However, sustained trading below 55 W EMA will argue that rise from 0.9534 has completed as a three wave corrective bounce, and keep long term outlook bearish.
USD/JPY Daily Outlook
Daily Pivots: (S1) 153.85; (P) 154.31; (R1) 154.99; More...
Intraday bias in USD/JPY remains neutral and more consolidations could be seen below 155.03 temporary top. On the upside, break of 155.03 will target 100% projection of 146.58 to 153.26 from 149.37 at 156.05. Break there will pave the way to 158.85 key structural resistance. However, considering bearish divergence condition in 4H MACD, firm break of 152.81 support will indicate short term topping, and bring deeper pullback to 55 D EMA (now at 151.30).
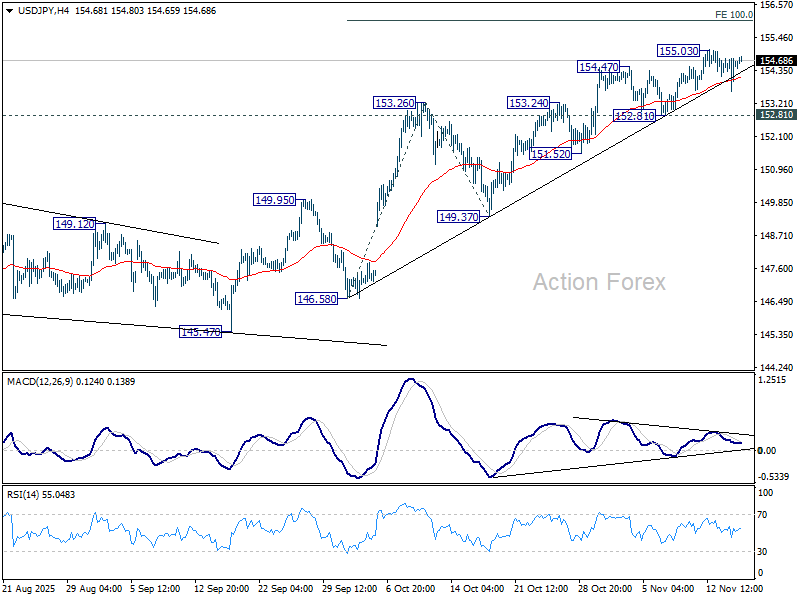
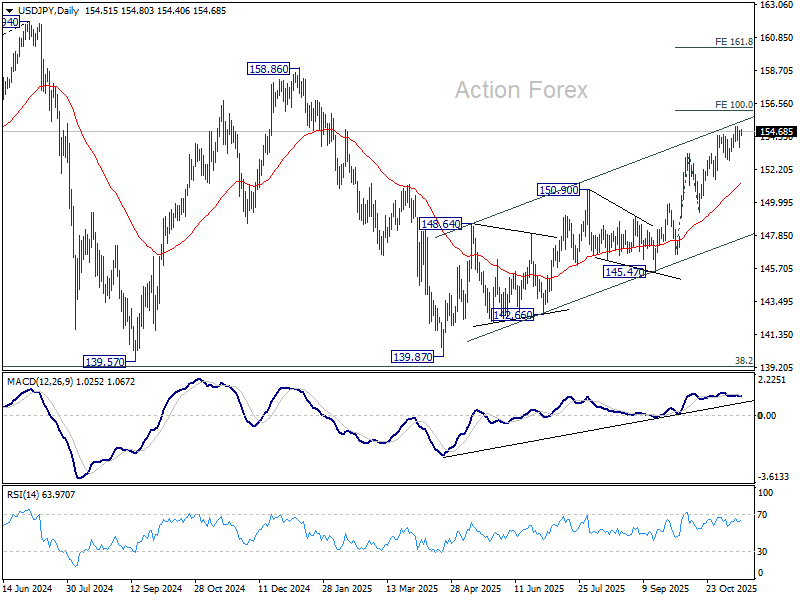
In the bigger picture, current development suggests that corrective pattern from 161.94 (2024 high) has completed with three waves at 139.87. Larger up trend from 102.58 (2021 low) could be ready to resume through 161.94 high. On the downside, break of 149.37 support will dampen this bullish view and extend the corrective pattern with another falling leg.
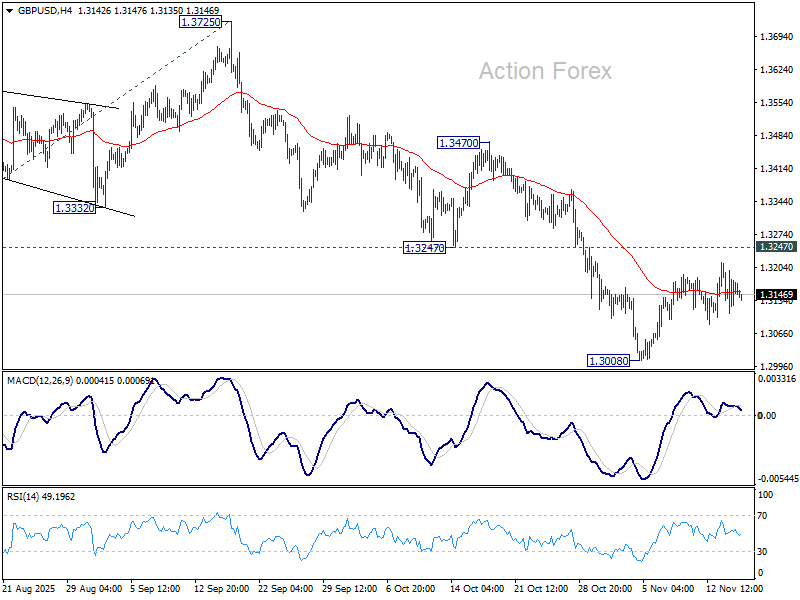
GBP/USD Daily Outlook
Daily Pivots: (S1) 1.3120; (P) 1.3162; (R1) 1.3216; More...
Sideway consolidations continue in GBP/USD and intraday bias remains neutral. Further decline is expected as long as 1.3247 support turned resistance holds. Break of 1.3008 will resume the fall from 1.3787, and target 138.2% projection of 1.3787 to 1.3140 from 1.3725 at 1.2831). Nevertheless, firm break of 1.3247 will suggest that fall from 1.3787 has completed as a corrective move already.
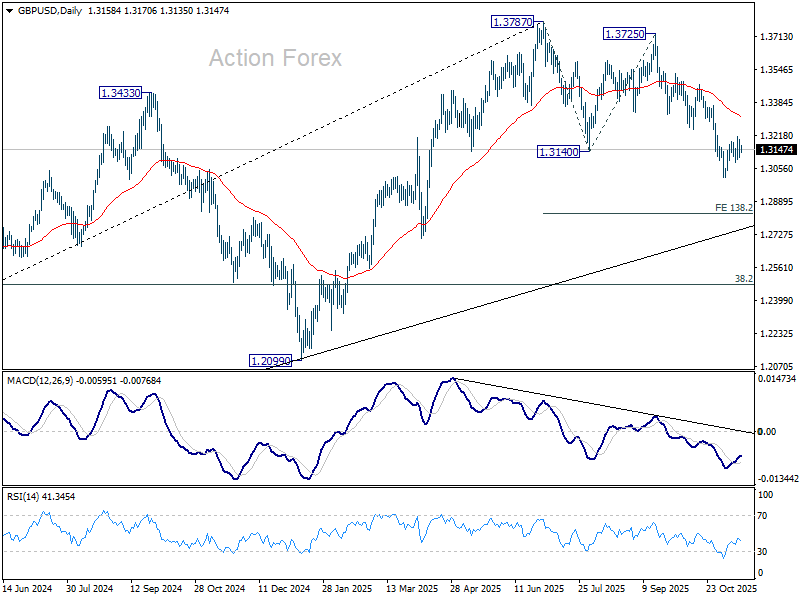
In the bigger picture, the break of 55 W EMA (now at 1.3182) is taken as the first sign that corrective rise from 1.0351 (2022 low) has completed. Decisive break of trend line support (now at 1.2824) will solidify this case and target 38.2% retracement of 1.0351 to 1.3787 at 1.2474 next. Meanwhile, in case of another rise, strong resistance should emerge below 1.4248 (2021 high) to cap upside to preserve the long term down trend.
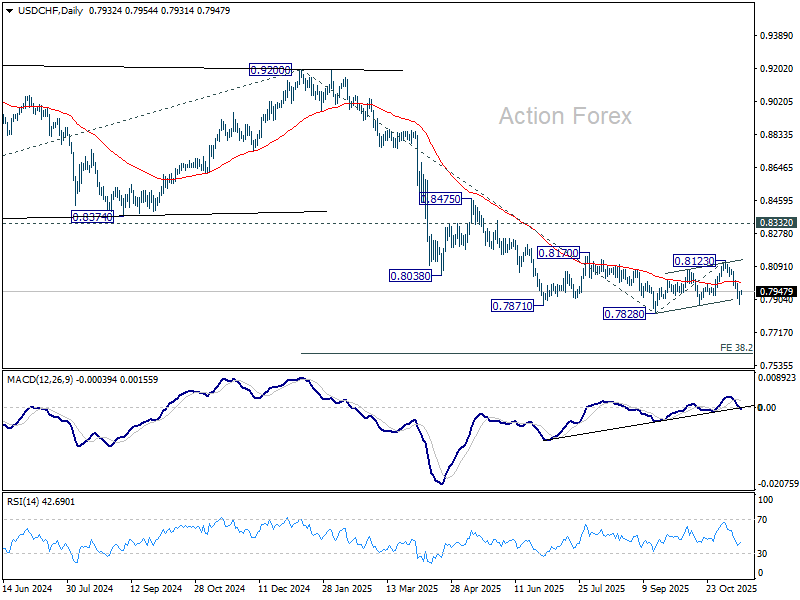
USD/CHF Daily Outlook
Daily Pivots: (S1) 0.7897; (P) 0.7923; (R1) 0.7967; More…
Intraday bias in USD/CHF remains neutral and some consolidations could be seen above 0.7877 temporary low. Outlook is unchanged that corrective rebound from 0.7828 has completed with three waves up to 0.8123. Break of 0.7872 support will pave the way through 0.7828 to resume the larger down trend. Next near term target is 38.2% projection of 0.9200 to 0.7828 from 0.8123 at 0.7599. However, sustained break of 55 4H EMA (now at 0.792) will mix up the outlook.
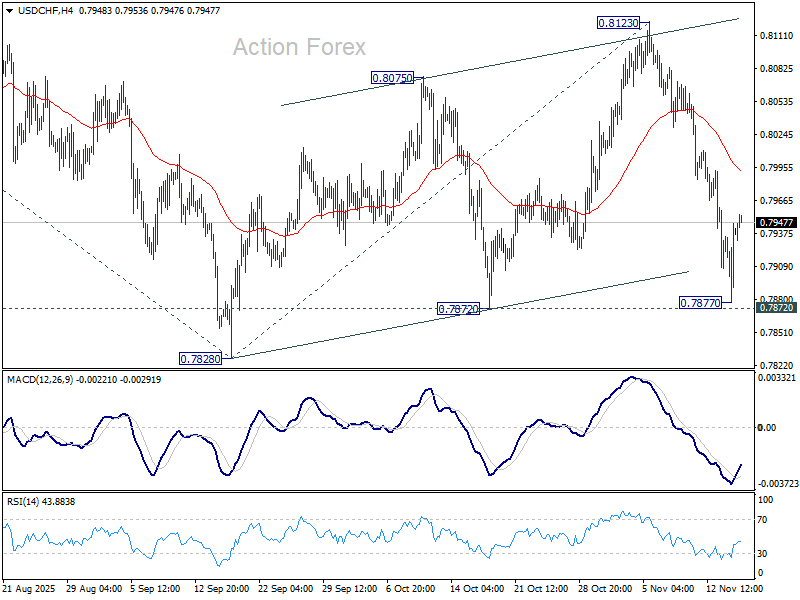
In the bigger picture, long term down trend from 1.0342 (2017 high) is still in progress. Next target is 100% projection of 1.0146 (2022 high) to 0.8332 from 0.9200 at 0.7382. In any case, outlook will stay bearish as long as 0.8332 support turned resistance holds (2023 low).
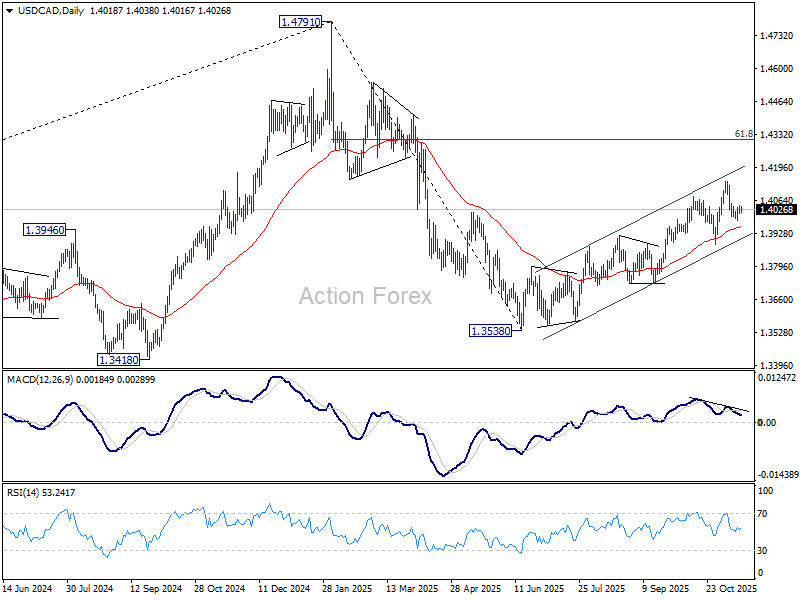
USD/CAD Daily Outlook
Daily Pivots: (S1) 1.4010; (P) 1.4028; (R1) 1.4041; More...
Intraday bias in USD/CAD remains neutral for the moment. On the upside, firm break of 1.4039 minor resistance will bring stronger rebound to retest 1.4139 high. On the downside, below 1.3984 will target 1.3886 support next. Overall, rise from 1.3538 is in favor to continue as long as 1.3886 support holds.
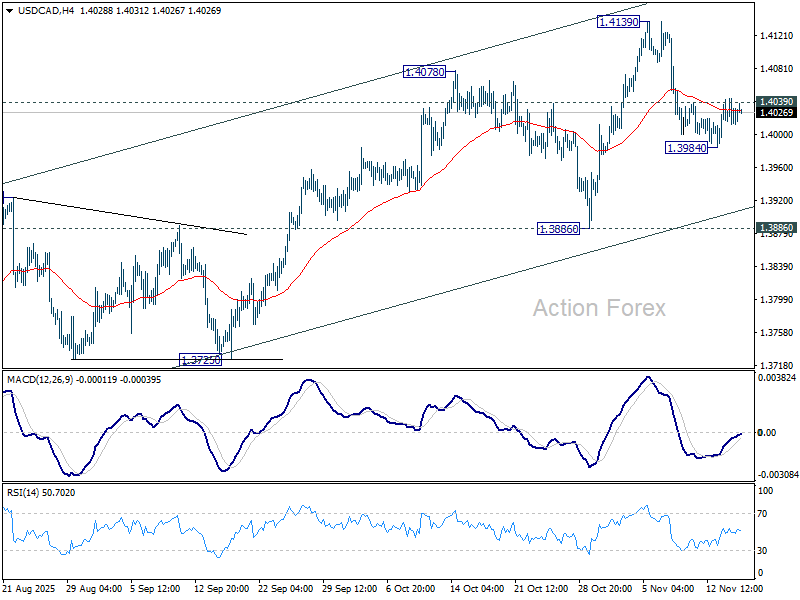
In the bigger picture, price actions from 1.4791 medium term top is likely just unfolding as a correction to up trend from 1.2005 (2021 low), with rise from 1.3538 as the second leg. A third leg should follow before up trend resumption. That is, range trading is set to extend for the medium term. For now, this will remain the favored case as long as 1.3886 support holds. However, firm break of 1.3886 will revive the case that fall from 1.4791 is indeed a larger scale correction.
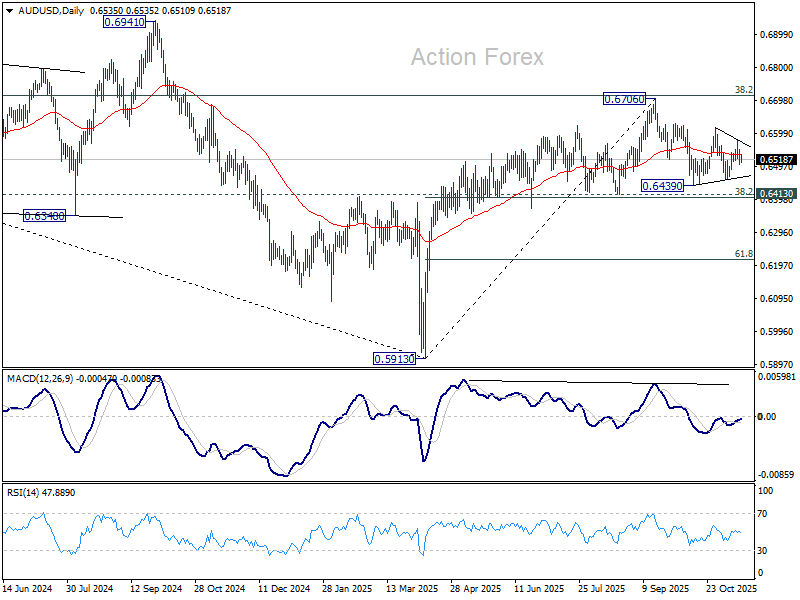
AUD/USD Daily Report
Daily Pivots: (S1) 0.6510; (P) 0.6531; (R1) 0.6557; More...
Intraday bias in AUD/USD remains neutral as sideway trading continues. On the downside, break of 0.6457 will target 0.6413 cluster (38.2% retracement of 0.5913 to 0.6706 at 0.6403). Decisive break there will carry larger bearish implications. On the upside, break of 0.6579 will bring stronger rise to 0.6616 resistance. Firm break there will target a retest of 0.6706 high.
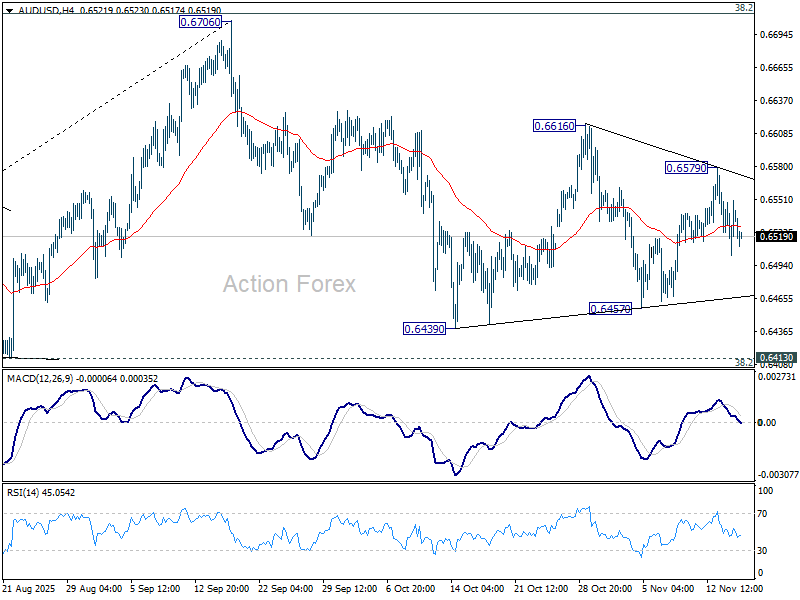
In the bigger picture, there is no clear sign that down trend from 0.8006 (2021 high) has completed. Rebound from 0.5913 is seen as a corrective move. Outlook will remain bearish as long as 38.2% retracement of 0.8006 to 0.5913 at 0.6713 holds. Break of 0.6413 support will suggest rejection by 0.6713 and solidify this bearish case. Nevertheless, considering bullish convergence condition in W MACD, sustained break of 0.6713 will be a strong sign of bullish trend reversal, and pave the way to 0.6941 structural resistance for confirmation.
Sentiment Cautious But Not Negative, US Data Reboot Awaited
Sentiment in Asian markets started the week on the softer side, though the pullback has been well contained so far. The tone was more cautious than negative, with investors reluctant to take strong positions ahead of a busy global data schedule and the return of U.S. macro releases.
The dominant theme is anticipation. With U.S. data flow finally resuming after the government shutdown, traders are positioning defensively. Thursday’s release of the September US nonfarm payrolls report will be a key event. Markets are keen to understand whether the slowdown seen in summer was already deepening before reporting disruptions kicked in.
Meanwhile, today’s major highlight comes from Canada, where October CPI is expected to show headline inflation easing to 2.2%. The stickier question lies within the core measures, which are likely to remain close to the upper end of the BoC’s 1–3% target band. That should reinforce expectations that the BoC maintains its prolonged pause at 2.25%, the bottom of its neutral range. Such an outcome also solidifies the view that Canada’s easing cycle has effectively ended. With inflation drifting gradually lower but not collapsing, the central bank has little incentive to cut further.
Beyond Canada, the week brings a series of important releases: FOMC and RBA minutes, inflation reports from the UK and Japan, and PMI readings across several major economies.
In currency markets, Dollar leads the board for the day so far, while Loonie and Yen are following. At the weaker end, Aussie is the softest performer, trailed by Kiwi and then Euro. Sterling and Swiss Franc are positioned firmly in the middle. Still, despite these relative moves, most major pairs and crosses remain locked inside last week’s ranges, as the markets are in wait-and-see mode.
In Asia, at the time of writing, Nikkei is down -0.22%. Hong Kong HSI is down -0.96%. China Shanghai SSE is down -0.59%. Singapore Strait Times is down -0.09%. Japan 10-year JGB yield is up 0.028 at 1.730.
Japan's GDP avoids deeper Q3 slump as public spending cushions demand
Japan’s economy contracted in the third quarter, but the decline was smaller than markets anticipated. GDP fell -0.4% qoq versus expectations of -0.6%. The annualized figure showed -1.8% drop compared with forecasts of -2.5%. The softer-than-expected contraction reflected pockets of resilience in domestic demand despite broader weakness.
Government spending rose 0.5% qoq and private consumption edged up 0.1% qoq, helping to offset some of the slowdown. Public demand grew 0.5% qoq and contributed 0.1 percentage point to overall GDP. However, private demand was a significant drag, falling -0.4% qoq as residential investment plunged -9.4% qoq, subtracting 0.3 percentage point from output.
External demand also weakened. Exports of goods and services fell -1.2% qoq after a strong 2.3% qoq rise in the previous quarter, with net exports contributing to a 0.2 percentage point drop in GDP.
Slight uptick in NZ BNZ services in October, but weakness persists
New Zealand’s services sector remained under heavy strain in October, with the BusinessNZ Performance of Services Index inching up from 48.3 to 48.7 but still locked firmly in contraction.Activity, employment, and new orders all hovered below 50, extending the sector’s downturn to 20 straight months and keeping the headline reading well below the long-term average of 52.8.
Businesses cited weak demand as the principal drag, linking the slowdown to reduced household spending, ongoing cost-of-living pressures, and diminished confidence. While the proportion of negative comments fell from 58.0% to 54.1%, responses still pointed to a market struggling with inconsistent sales flows and hesitant customers. The continued decline in new orders signals that firms are not yet seeing a meaningful turn in forward demand.
Operating costs, competitive intensity, workflow delays, and cancelled projects are adding further strain, tightening cashflow and limiting the ability of firms to absorb volatility.
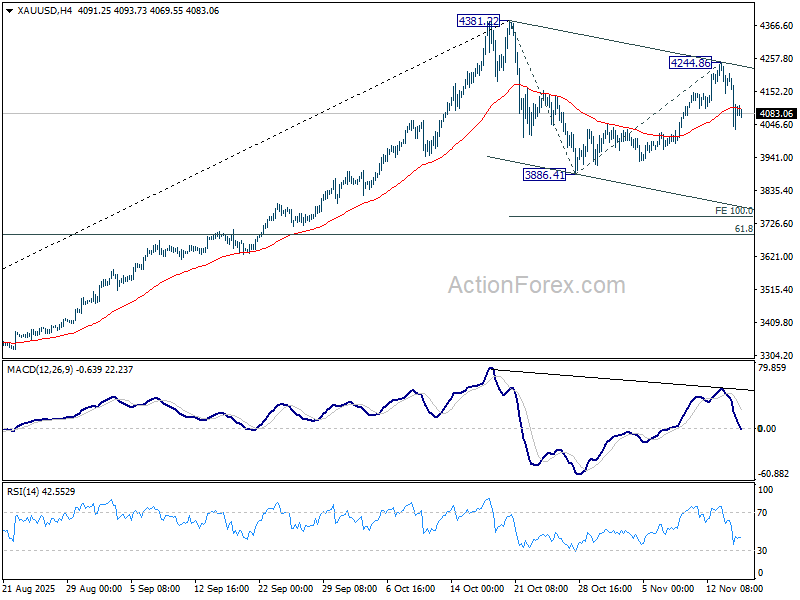
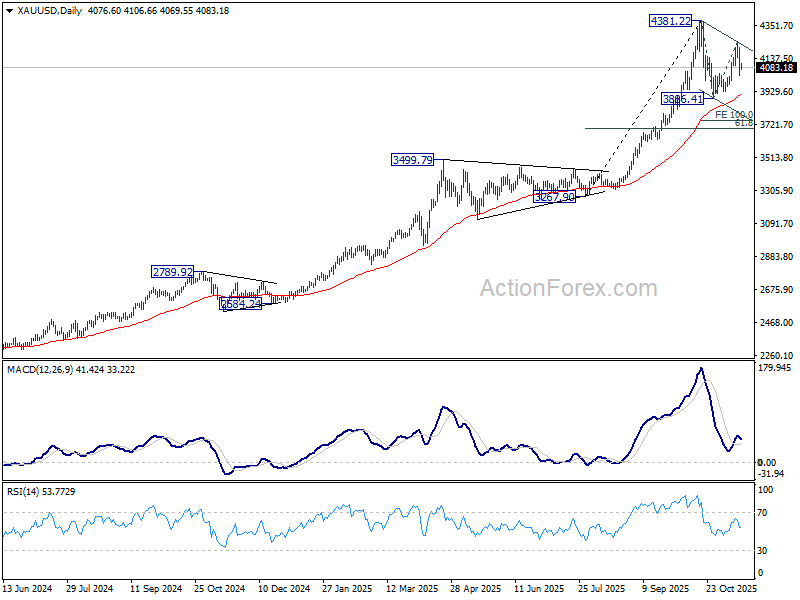
Gold, Silver stay capped, macro haze holds breakout timing to early 2026
Gold and Silver’s late-week slide marked the continuation of a corrective pattern that has been unfolding since both metals hit record highs in mid-October. The sequence of the initial decline, the early-November rebound, and now the latest retreat all form part of a consolidation phase, reflecting that the markets are still searching for direction after months of decisive trending.
Both fundamental and technical backdrops suggest that this period of indecisiveness will continue in the near term. The broader uptrend remains firmly intact, but without a clear catalyst, price action is likely to stay choppy. New record highs remain part of the medium-term outlook, though the timetable leans toward early next year rather than the remainder of 2025.
On the fundamental side, the slowdown in Gold and Silver’s up trend began as U.S.–China trade tensions eased under their one-year arrangement blocking further tariff and non-tariff escalations. That agreement removed a significant layer of risk premium that had supported heavy hedging flows into precious metals. With geopolitical pressure reduced, markets have lacked urgency to extend the rally.
The latest leg lower was driven more by shifts in Fed expectations. A December cut is now regarded as a coin toss, softening the near-term appeal of non-yielding assets. Still, the larger policy direction remains downward, and an easing cycle next year should restore support for Gold and Silver once the current fog clears.
The challenge is that macro visibility will not improve immediately. Even though U.S. data releases are resuming after the shutdown ended last week, neither the Fed nor markets will have full clarity on underlying economic conditions until the release schedule fully normalizes in December. This leaves policymakers cautious and investors reluctant to build strong directional positions.
Technically, in Gold, the decline from 4,381.22 to 3,886.41 forms the first leg of a corrective pattern to uptrend from 3,267.90. The second leg has likely completed at 4,244.86 last week. Deeper move toward 55 D EMA (now at 3907.78) is favored. Support could emerge there, but firm break will target 100% projection of 4381.22 to 3886.41 from 4244.86 at 3750.05, where the correction should complete.
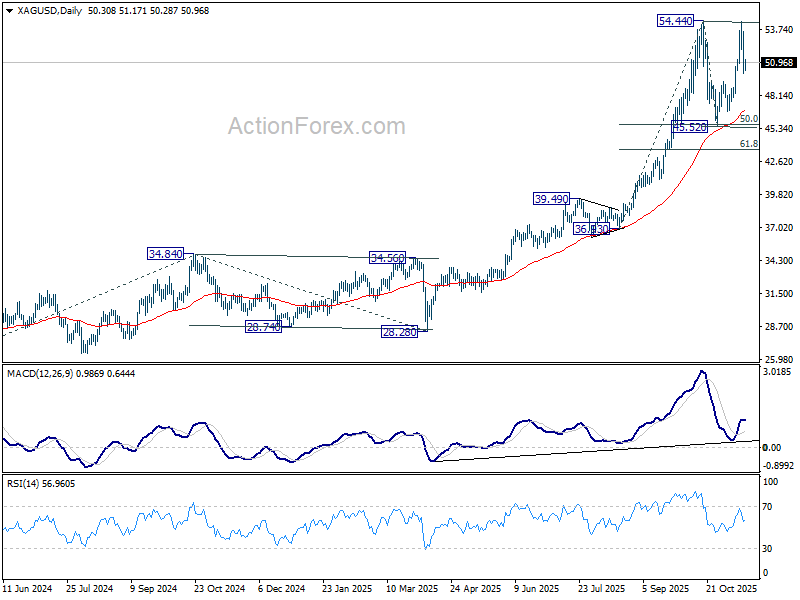
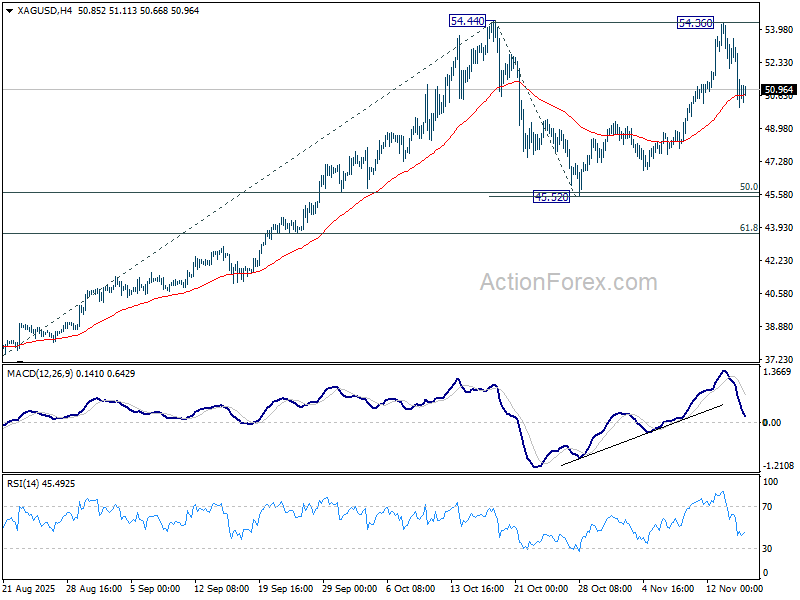
Silver shows a parallel pattern. The initial fall from 54.44 to 45.52 was followed by a second-leg rise to 54.36 last week, narrowly missing the prior high. Sustained trading below the 55 4H EMA (now at 50.678) would confirm the corrective structure and open a move toward the 55 D EMA (now at 46.99) or a bit lower. Strong support is expected from 45.52 cluster (50% retracement of 36.93 to 54.44 at 45.68) to contain downside to complete the consolidations pattern.
NFP and FOMC minutes to set tone for December Fed debate
U.S. economic data finally returns to focus this week, with the September nonfarm payrolls report set for release on Thursday following the reopening of the federal government. While the numbers will be somewhat dated, the report may become the last complete employment update the Fed receives before its December meeting. Any October labor figures, even if published, could carry omissions or reliability issues due to the data-collection disruptions during the shutdown.
Before the jobs report lands, Thursday’s FOMC minutes will offer the first detailed look at internal debates from the last meeting. Recent comments from Fed officials have shown clear hesitation toward committing to a December cut, and futures markets now price the probability of easing below 50%. The minutes should provide valuable insight into how divided policymakers were. The hawk-dove balance will be closely scrutinized, particularly given the Fed’s emphasis on.
RBA minutes on Tuesday add another central-bank highlight. With markets widely expecting no further cuts this year, attention will turn to how the Board frames the criteria for a possible February reduction. Any indication that some members view the current easing cycle as effectively complete would recalibrate expectations for 2026.
A packed international calendar rounds out the week. CPI releases from the UK, Canada, and Japan will guide inflation expectations, while Friday brings PMI updates from Australia, Japan, Eurozone, UK, and the U.S.
Highlights for the week ahead:
- Monday: New Zealand BNZ services; Japan GDP; Canada CPI; US Empire state manufacturing.
- Tuesday: RBA minutes; US NAHB housing index.
- Wednesday: New Zealand PPI; Japan trade balance; Australia wage price index; UK CPI, PPI; Eurozone CPI final; FOMC minutes.
- Thursday: China rate decision; Swiss trade balance; Germany PPI; Canada IPPI and RMPI; US non-farm payrolls, jobless claims, Philly Fed survey.
- Friday: New Zealand trade balance; Australia PMIs; Japan CPI, PMIs; UK Gfk consumer confidence; retail sales, PMIs; Eurozone PMIs; Canada retail sales; US PMIs.
AUD/USD Daily Report
Daily Pivots: (S1) 0.6510; (P) 0.6531; (R1) 0.6557; More...
Intraday bias in AUD/USD remains neutral as sideway trading continues. On the downside, break of 0.6457 will target 0.6413 cluster (38.2% retracement of 0.5913 to 0.6706 at 0.6403). Decisive break there will carry larger bearish implications. On the upside, break of 0.6579 will bring stronger rise to 0.6616 resistance. Firm break there will target a retest of 0.6706 high.
In the bigger picture, there is no clear sign that down trend from 0.8006 (2021 high) has completed. Rebound from 0.5913 is seen as a corrective move. Outlook will remain bearish as long as 38.2% retracement of 0.8006 to 0.5913 at 0.6713 holds. Break of 0.6413 support will suggest rejection by 0.6713 and solidify this bearish case. Nevertheless, considering bullish convergence condition in W MACD, sustained break of 0.6713 will be a strong sign of bullish trend reversal, and pave the way to 0.6941 structural resistance for confirmation.