Sample Category Title
RBA’s Jones warns on geopolitical risk underpricing, notes Gold shift
RBA Assistant Governor Brad Jones cautioned that global markets may be underestimating geopolitical risks and systemic fragmentation. At a conference today, he highlighted that risk premiums across major asset classes have fallen to “concerning lows,” suggesting investors are failing to fully price in potential shocks.
“We’re just surprised that there’s not a bit more reflected in spreads given what we observe,” Jones said, pointing to what he called “a confronting set of potential risks.”
Jones also drew attention to shifting dynamics in global reserve management, noting “emerging evidence of fragmentation” in how central banks allocate their assets. He said a distinct group of countries has driven the recent surge in official Gold holdings, reflecting a growing desire to diversify away from dollar- and euro-denominated assets amid heightened concerns about "risk of asset seizure sanctions".
USD/CHF Slides Below 0.80 as Tariff Relief Talks Lift Swiss Franc
It's a holiday in many OECD countries for the Remembrance of the Great War (World War I).
As most banks are closed throughout Europe and North America, Swiss banks maintain their regular activity, and traders are not sleeping on the latest trade news.
US President Donald Trump confirmed yesterday that Washington is "working on a deal to get the tariffs a little lower" after Swiss business leaders stepped in to drive talks forward.
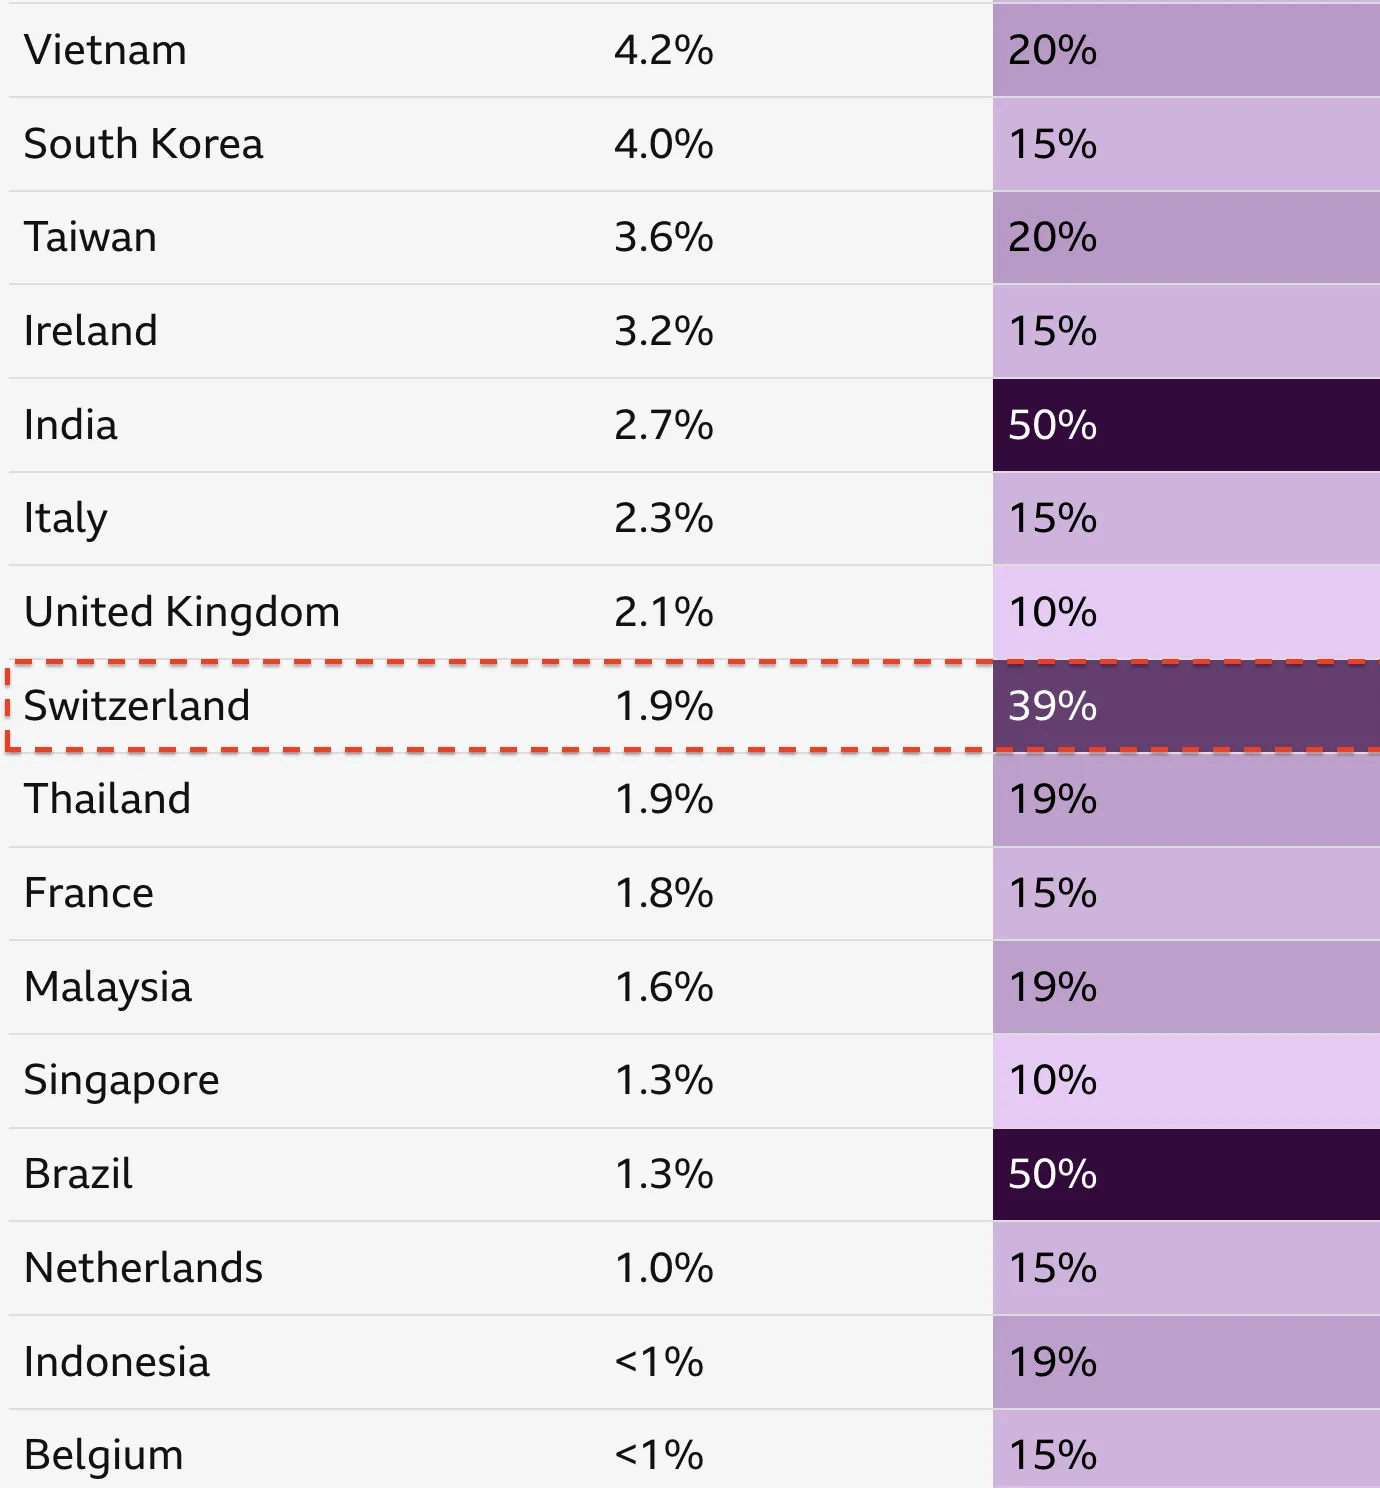
Different tariff rates per economy – Source: BBC
Switzerland is reportedly closing in on securing a much more contained 15% tariff rate—a vast improvement compared to the harsh 39% tariffs imposed in August, which were the highest levies faced by any developed economy.
With the current punitive tariffs already starting to bite into Swiss economic activity, impacting GDP growth in Q3, traders are now pricing in a more stable outlook ahead which put CHF in front of the FX board.
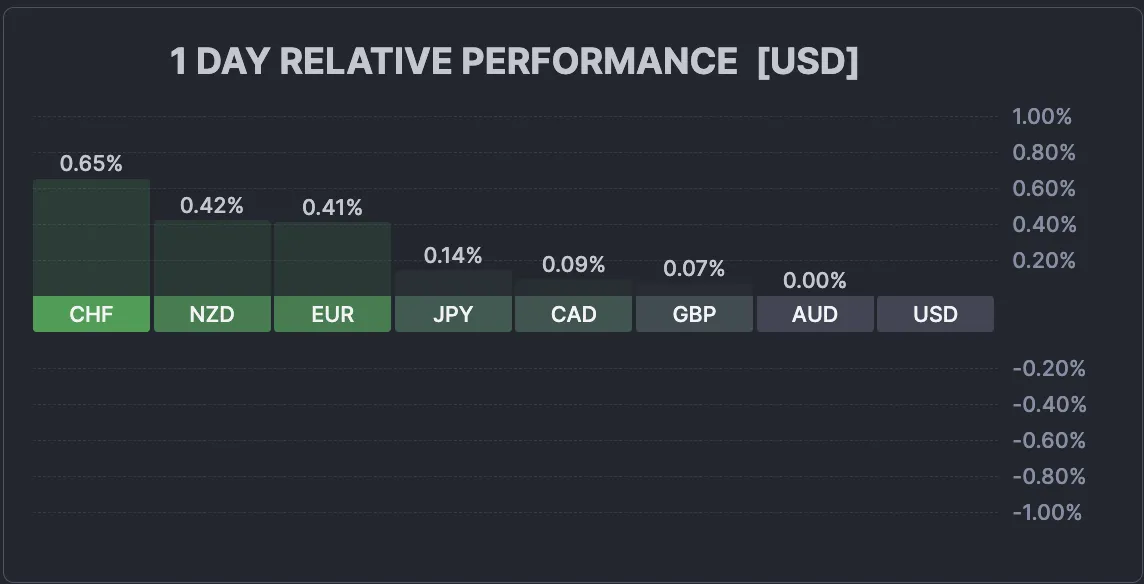
Daily FX performance board – Source: Finviz – November 11, 2025 at 9:47 AM
The rest is to see if the talks, which involved Switzerland's top trade diplomat Helene Budliger Artieda and Swiss corporate executives, materialize into something concrete within the speculated timeframe of several weeks.
Let's dive into a multi-timeframe analysis and trading levels for USD/CHF, the most volatile major pair of the session.
USD/CHF Multi-timeframe technical analysis
Daily Chart
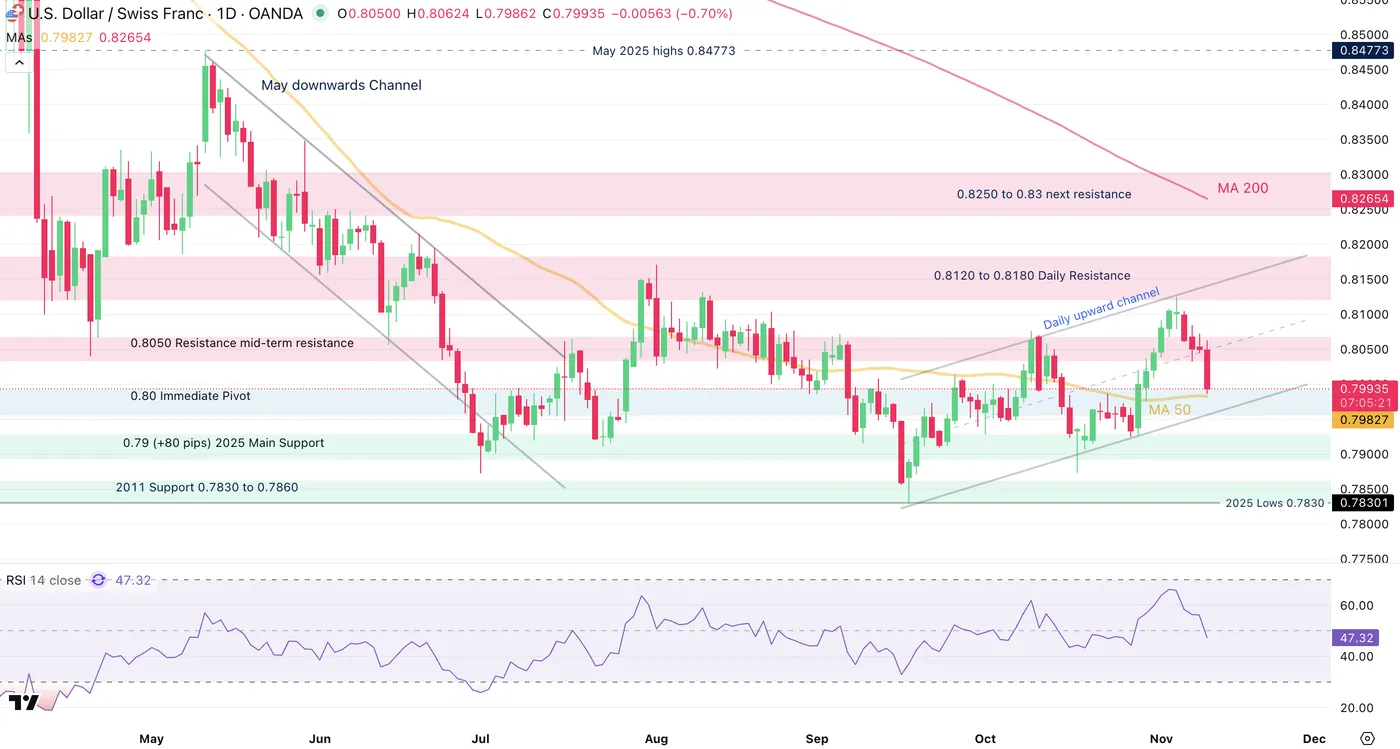
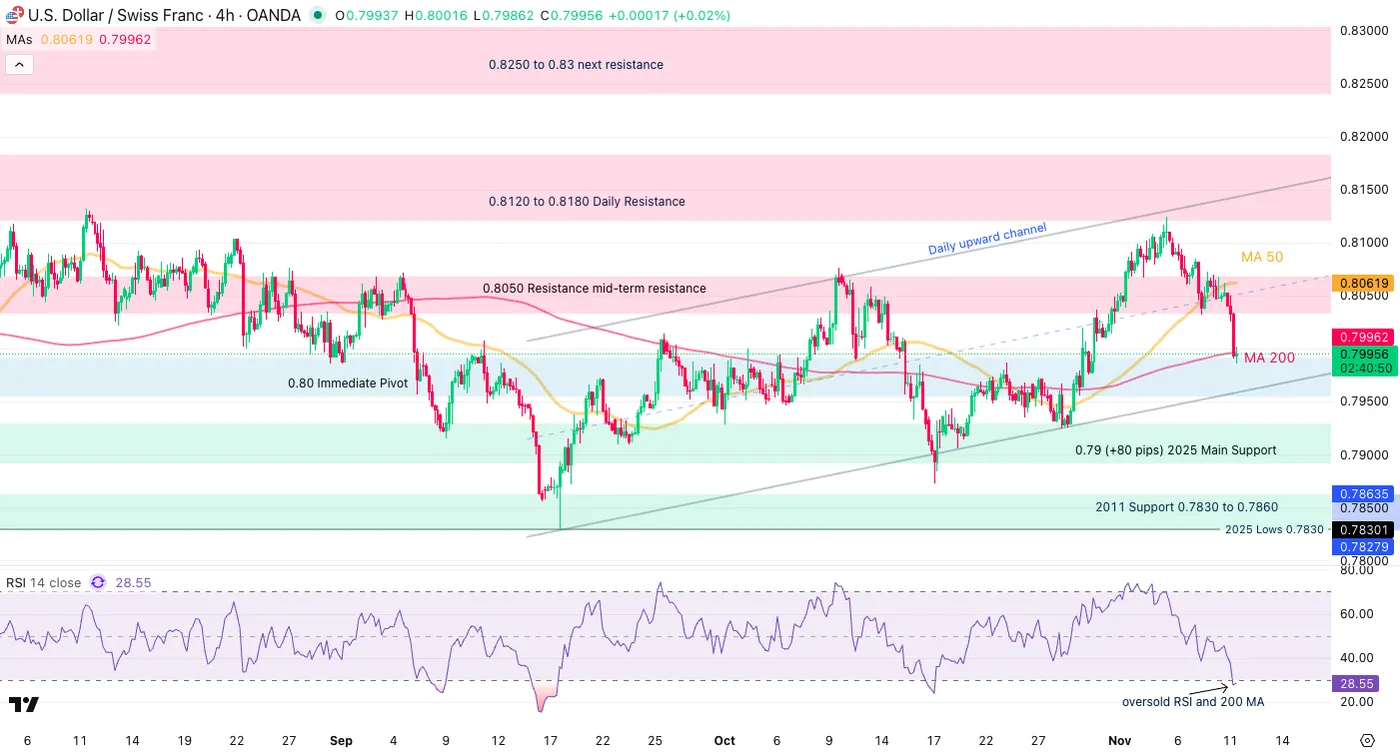
USD/CHF Daily Chart, November 11, 2025 – Source: TradingView
USD/CHF has been moving in up/down yo-yos since the July (1st) bottom in the pair.
Some new yearly lows (0.7830) got reached just ahead of the September FOMC, however no trend has materialized since, which leads to general rangebound conditions in the pair.
The rest will be to see if the appearance of a new deal could generate enough traction to create a new trend in the pair as it reaches the Pivot zone just around the 0.80 level (+/- 100 pips).
RSI Momentum is moving below the neutral level, but looking at the upward channel that appeared from the recent highs, it will be interesting to see how the Market reacts to its lower bound test (around 0.7960).
4H Chart and technical levels
USD/CHF 4H Chart, November 11, 2025 – Source: TradingView
Levels to place on your USD/CHF charts:
Resistance Levels
- Past week highs 0.81244
- 0.8050 Resistance mid-term resistance
- 0.8120 to 0.8180 Daily Resistance
- 0.8250 to 0.83 next resistance
Support Levels
- Pivot zone 0.80 level (+/- 100 pips)
- 0.79 (+80 pips) 2025 Main Support
- 2011 Support 0.7830 to 0.7860
- 2025 Lows 0.7830
1H Chart
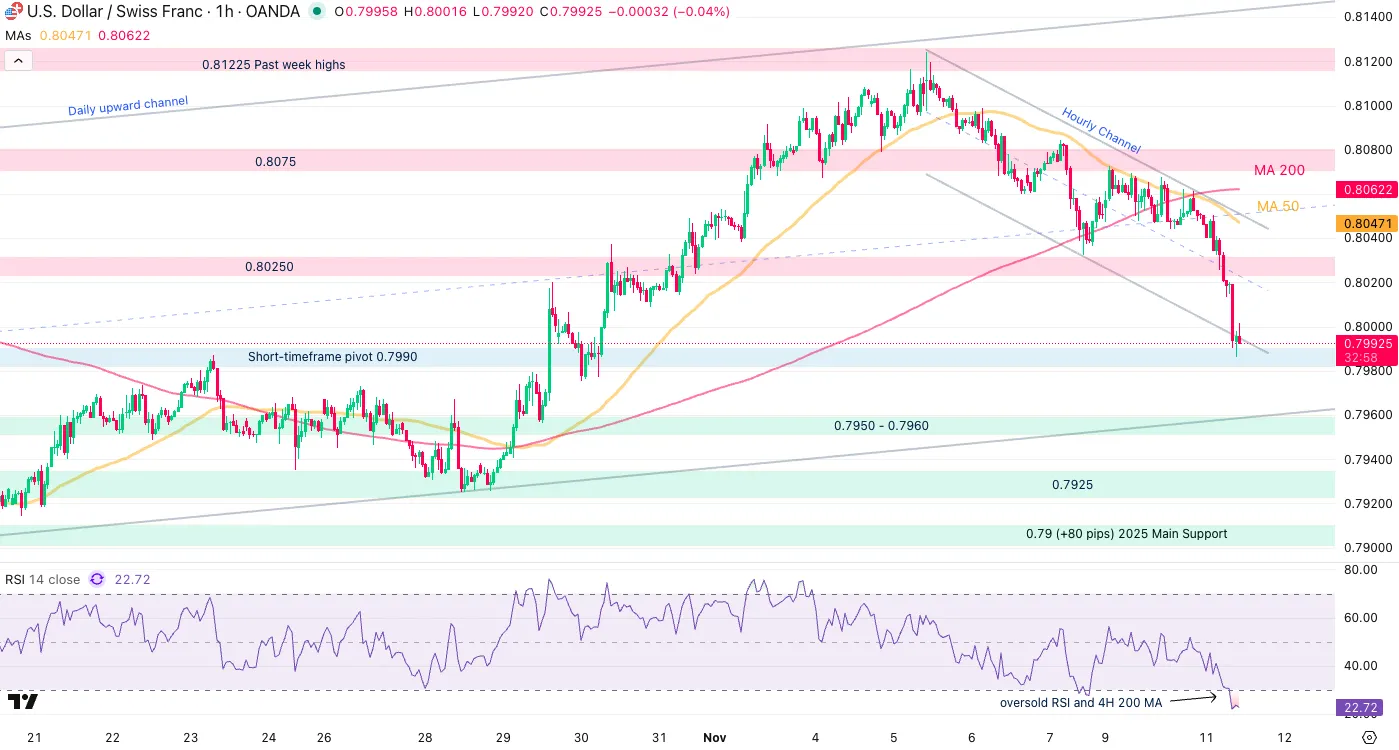
USD/CHF 1H Chart, November 11, 2025 – Source: TradingView
The pair formed a downward channel on shorter timeframes and comes at a key technical point.
The higher timeframe and shorter timeframe pivot zones are converging just below the 0.80 level.
A close below will point to at least a test of the Daily Upward channel lower bound.
A rebound here could retest the zone which sees a confluence of the 50 and 200 Hour MAs.
Safe Trades!
WTI Oil Up 1.7% as Markets Grapple with Geopolitical Shocks and Structural Supply Glut
Oil prices went up by 1.7% on Tuesday as markets grappled with the latest US sanctions on Russian Oil against optimism that the US Government shutdown could end soon.
The challenge for bulls is that concerns continue to linger around oversupply in Q4 of 2025 and beyond.
Global Supply Audit and Inventory Accumulation
Concerns around a supply glut is down to major oil producers, including the United States, the members of OPEC, and Russia, are all pumping very large amounts. The resilience of US shale output, combined with the difficulty in coordinating deep, sustained cuts across the OPEC+ alliance, has maintained production at levels that consistently exceed utilization.
The physical consequences of this glut are evident in global inventory dynamics. There has been a recent spike in crude oil stored onboard ships, often termed "floating storage," particularly in Asian waters.
Furthermore, substantial volumes of unsold cargoes are accumulating in the Middle East
This accumulation on both land and at sea points directly to softening immediate demand and signals a profound weakness in the physical spot market. When sellers must compete to offload stockpiles, it raises fears of prolonged price weakness.
This has been playing on the mind of market participants for the last few months which has no doubt kept Oil prices subdued.
Macroeconomic Headwinds and Currency Effects
Adding further downward pressure to the market are significant macroeconomic headwinds.
Global oil demand growth remains sluggish, contributing to the existing surplus. Furthermore, the sustained strength of the US dollar of late, influenced by delays in anticipated Federal Reserve rate cuts, makes dollar-denominated crude oil more expensive for international buyers. This currency effect acts as a marginal dampener on demand, exacerbating the supply/demand mismatch.
The fact that inventory accumulation is so widespread implies that the market structure is either in contango or rapidly moving toward it, where future prices significantly exceed spot prices.
This structure compensates traders for the cost of storage, reinforcing the bearish view that immediate supply far exceeds current needs, thereby favoring strategic stockpiling over immediate consumption.
A significant downside risk stems from the potential fragility of OPEC+ compliance. Despite the current surplus, there remains the risk of further increases in OPEC+ production targets.
Should compliance falter, or should high-volume producers abandon output restraint, the glut would worsen instantly, potentially accelerating the technical move toward the $55.00 level.
The Lukoil Sanctions Shock
Another factor affecting Oil prices was the trouble faced by the Russian company Lukoil in Iraq due to US sanctions. Because of the sanctions, Lukoil could not handle international payments, forcing it to stop certain activities at the West Qurna-2 oil field. This field is very important to Iraq, producing about 480,000 barrels of oil a day, or about 9% of their total output.
Right now, Iraq's oil authorities have stopped all payments both cash and oil shipments owed to Lukoil because they must follow US and UK sanctions. This payment freeze is causing immediate operational problems.
The biggest long-term risk is that if the payment issues aren't fixed, Lukoil has threatened to completely stop production and leave the massive West Qurna-2 field within six months. Losing such a huge producer would be very hard for Iraq to manage and represents a major, long-term risk that could seriously reduce global oil supply in the future.
Furthermore, these sanctions are having an indirect effect on the current oil oversupply. Sanctions are forcing big Asian buyers like China and India to purchase less Russian oil and instead buy more from the Middle East. This unsold Russian oil is then being stored on ships or in reserves, adding to the existing global oil surplus and pushing prices down.
Technical Analysis - WTI Oil
From a technical analysis standpoint, WTI crude oil has been stuck in a consolidation phase in the critical $59.50 to $62.00 zone, an area that has exhibited significant "market memory" from previous trading periods.
The long-term descending trendline is being tested at present at the same time the RSI period-14 has crossed above the 50 neutral level.
Is this a precursor to a trendline break?
Even if it is, recent price action suggests that bullish momentum may fade quickly. This is also backed up by the overarching macroeconomic factors discussed above.
WTI Oil Daily Chart, November 11, 2025
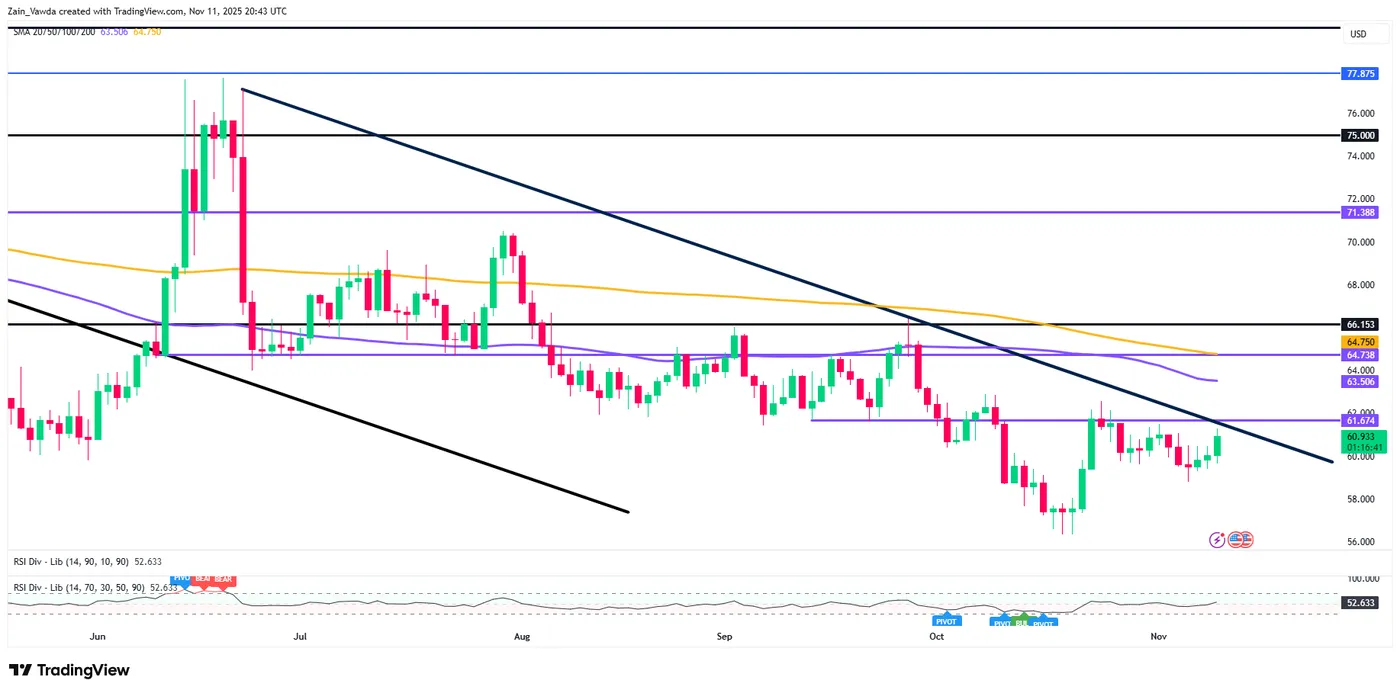
Source: TradingView (click to enlarge)
Client Sentiment Data
Looking at OANDA client sentiment data and market participants are long on WTI with 86% of traders net-long. I prefer to take a contrarian view toward crowd sentiment and thus the fact that so many traders are long means WTI prices could decline in the near-term.
Large Rotation from Tech as ADP Employment Scares Again
Log in to today's North American session Market wrap for November 11.
Many traders were off during today's session as the world celebrates the 108th birthday of the resolution of World War I
Nevertheless, US stocks and cryptocurrencies were open, allowing for significant rotation towards more defensive sectors and assets.
Initial fears of Critical mineral export controls scaring participants subsided after China announced a one-year temporary suspension of export controls on rare earths, lithium battery materials, and other key metals.
However, the market quickly pivoted to domestic concerns.
The catalyst for the downside was a weekly ADP private employment report, a new series providing a high-frequency look at the labor market.
This weekly pulse offered a view contrary to the October monthly report (which saw a gain of 42K jobs): the latest numbers indicate that private employers reduced an average of 11,250 jobs a week over the past four weeks.
This suggests that recent strength observed could be already a thing of the past.
This bad employment news immediately drove further downside in Tech and AI-linked shares, with the Nasdaq Composite struggling and closing 0.3% lower – Nvidia lost close to 3% today.
Conversely, the Dow Jones Industrial Average appreciated, rising 1.2% to close at a new record high as money rotated towards more defensive, health care and energy-related sectors, a clear rebalancing away from high-beta tech.
Remember to take today's trading with a pinch of salt as volumes were much lower than the usual.
Cross-Assets Daily Performance
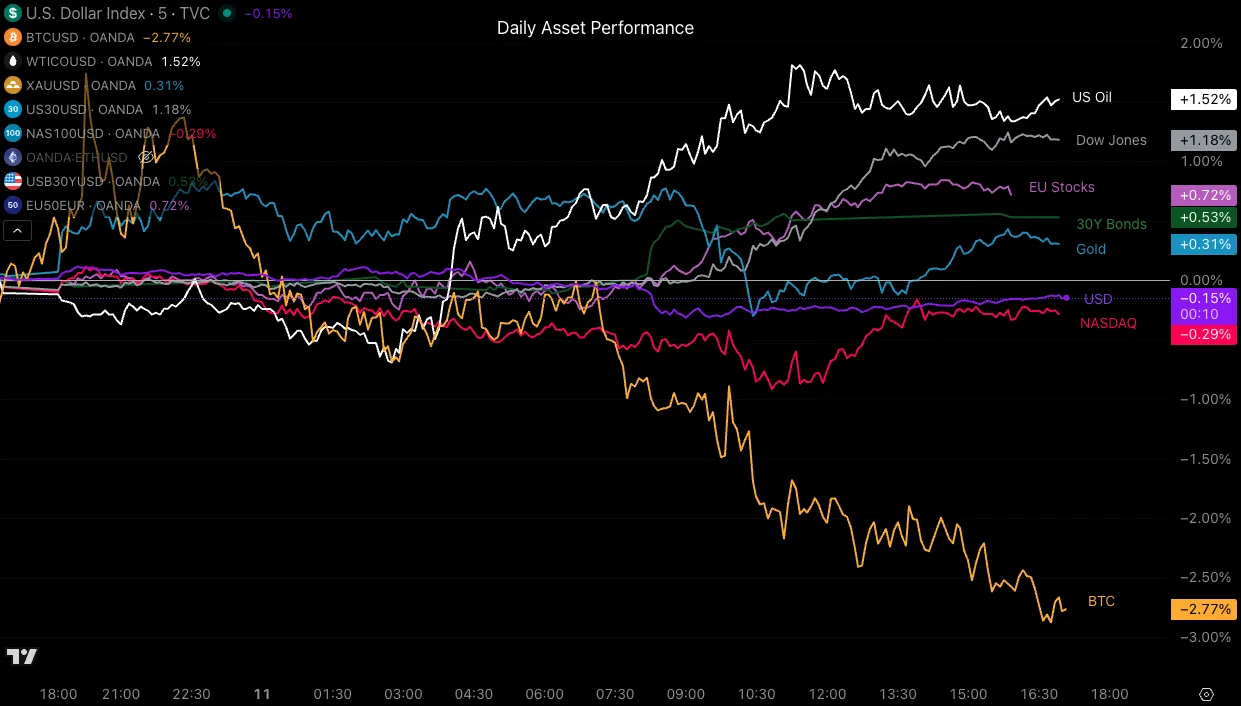
Cross-Asset Daily Performance, November 11, 2025 – Source: TradingView
Two noticeable patterns appeared today: One with the rotation happening from tech to defensive sectors which will be one to keep an eye on looking forwards.
The second being Oil and Nat Gas prices, which have began to take off in today's session amid the geopolitical turmoil happening with Russian oil purchases and much else.
(To learn more, I invite you to check out our recent Oil analysis)
A picture of today's performance for major currencies
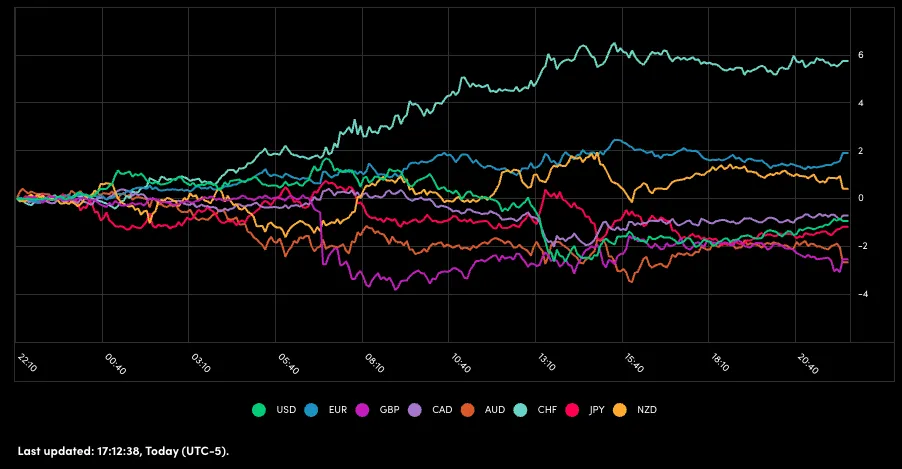
Currency Performance, November 11 – Source: OANDA Labs
The Swissie really demarcated itself today with the ongoing US-Switzerland tariff talks.
For the rest, balanced price action took out some steam off of the more risk-on antipodean currencies. Keep in mind that volumes were heavily subdued.
A look at Economic data releasing throughout tonight and tomorrow's sessions
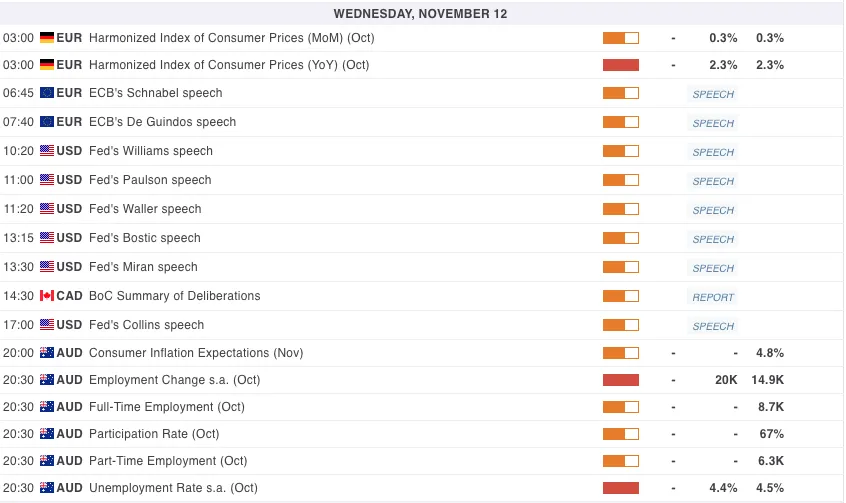
For all market-moving economic releases and events, see the MarketPulse Economic Calendar.
Wednesday will be data-heavy from Europe through Asia-Pacific, offering several directional drivers.
Early in the day, Germany’s CPI will confirm inflation holding steady (+0.3% MoM, +2.3% YoY), keeping the ECB on pause but watchful – Several ECB officials (Schnabel, De Guindos) will be speaking afterward.
The USD session features a full Fed speaker lineup — Williams, Waller, Bostic, and Collins — which will be interesting after the consecutive dovish employment reports.
Late in the global day, attention turns to the Australian jobs report, where markets expect +20K new positions and an unemployment rate steady at 4.5%.
Any miss here could strengthen bets for earlier RBA easing, especially if Inflation Expectations (4.8%) show further moderation.
The Bank of Canada’s Summary of Deliberations also lands mid-session, offering deeper insight into its latest policy hesitation.
Safe Trades!
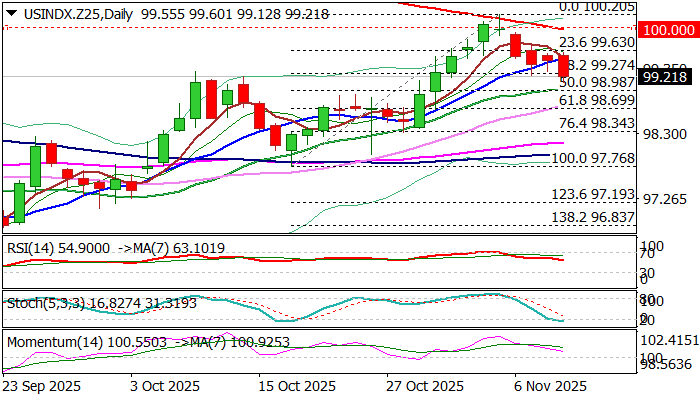
USD INDEX Eases Further on Rate Cut Expectations/Stronger Gold
The dollar index remains in red for the fourth consecutive day and extends the pullback that emerged after a failure to clearly break psychological 100 barrier and a bear trap at falling 200DMA, which reinforces the resistance.
Renewed expectations for Fed rate cut in December on optimistic view that the US economy remains resilient and inflation is not expected to rise significantly, as well as signs that the US government would reopen in coming days, continues to weigh on greenback, with fresh strength of gold price, adding pressure.
Traders, however, remain cautious and await release of a batch of US economic data, once the government reopens, which would provide a lot of information about the performance of the economy and have a clearer picture.
Fresh weakness broke below initial support at 99.51 (10DMA) and cracked Fibo 38.2% of 97.76/100.20 upleg (99.27) exposing more significant 99.00 support (50% retracement / 20DMA / round figure) violation of which to generate reversal signal.
Technical pictures are weaker on daily chart (converged 5/10 DMA about to form bear-cross / fading positive momentum), although more work at the downside will be required for bears to regain stronger control.
Near-term to remain biased lower while the price stays below 10DMA.
Res: 99.51; 99.64; 100.00; 100.20
Sup: 99.00; 98.69; 98.34; 98.00
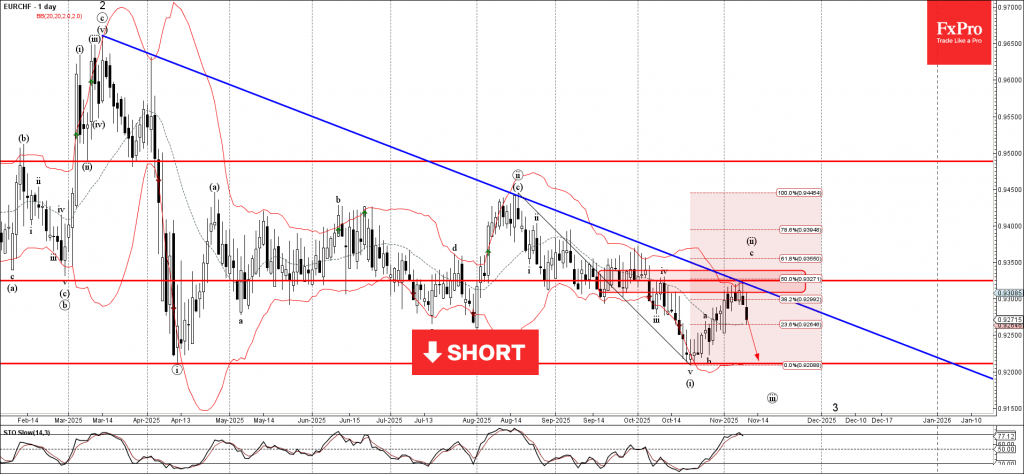
EURCHF Wave Analysis
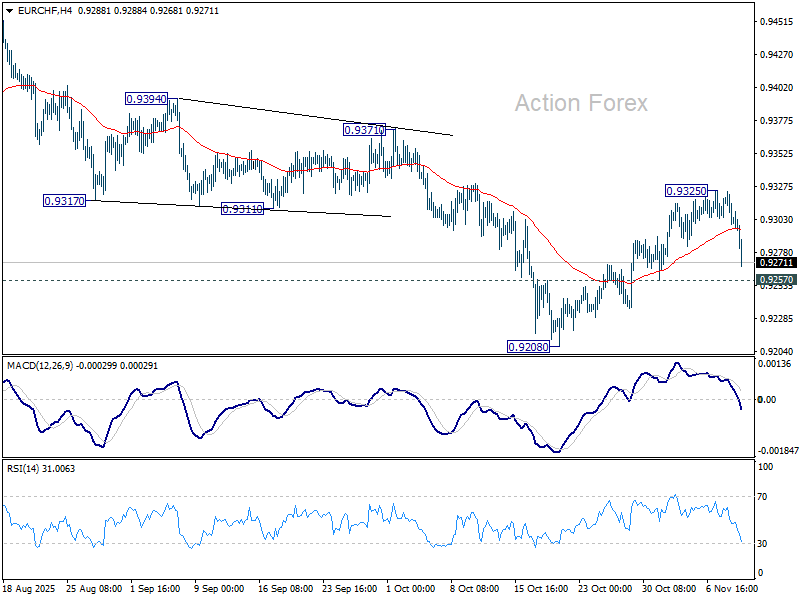
EURCHF: ⬇️ Sell
- EURCHF reversed from resistance area
- Likely to fall to support level 0.9210
EURCHF currency pair recently reversed from the resistance area between the key resistance level 0.9325 (which has been reversing the price from October), upper daily Bollinger band and the 50% Fibonacci correction of the downward impulse from August.
The downward reversal from this resistance area stopped the previous short-term ABC correction (ii).
Given the strong daily downtrend, EURCHF currency pair can be expected to fall to the next support level 0.9210 (previous monthly low from April and October).
EUR/CHF Mid-Day Outlook
Daily Pivots: (S1) 0.9295; (P) 0.9311; (R1) 0.9321; More....
EUR/CHF's fall from 0.9325 accelerates lower today, and focus is back on 0.9257 support. Firm break there will indicate that rebound from 0.9208 has completed. Retest of this low should be seen next. On the upside, break of 0.9325 will resume the rebound from 0.9208.
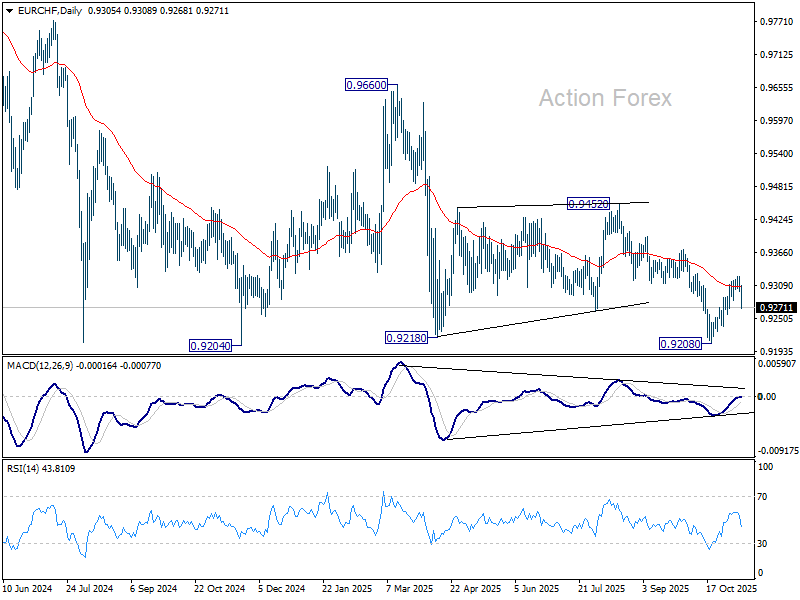
In the bigger picture, outlook remains bearish with EUR/CHF staying well inside long term falling channel after multiple rejection by 55 W EMA (now at 0.9383). Firm break of 0.9204 will resume the whole down trend from 1.2004 (2018 high). Next target is 61.8% projection of 1.1149 to 0.9407 from 0.9928 at 0.8851. However, break of 0.9452 resistance will now be the first sign of medium term bottoming.
EUR/USD Mid-Day Outlook
Daily Pivots: (S1) 1.1538; (P) 1.1560; (R1) 1.1580; More…
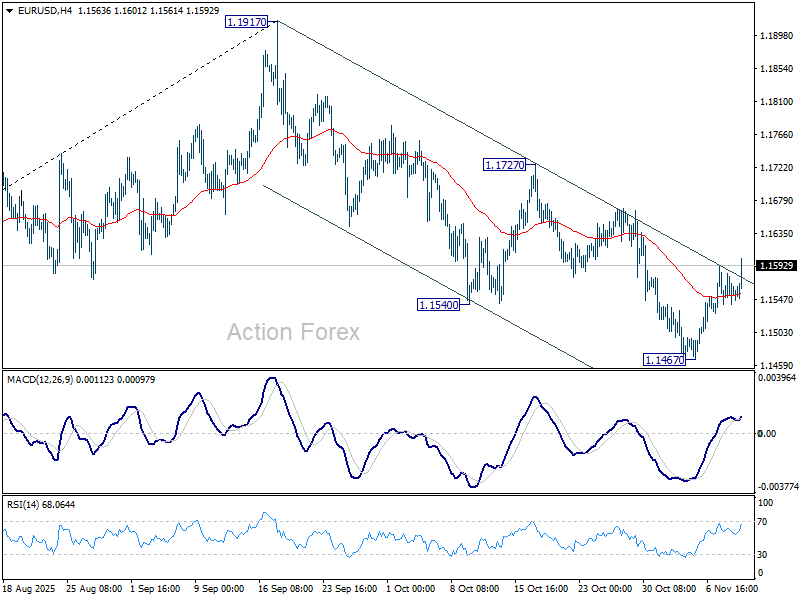
EUR/USD's rebound from 1.1467 extends higher today. But it's still staying below 55 D EMA (now at 1.1623). Further decline will remain mildly in favor. Below 1.1467 will resumed the decline from 1.1917 to 1.1390 support next. However, sustained trading above 55 D EMA will argue that fall from 1.1971 has completed as a correction only, and bring further rise to 1.1727 resistance next.
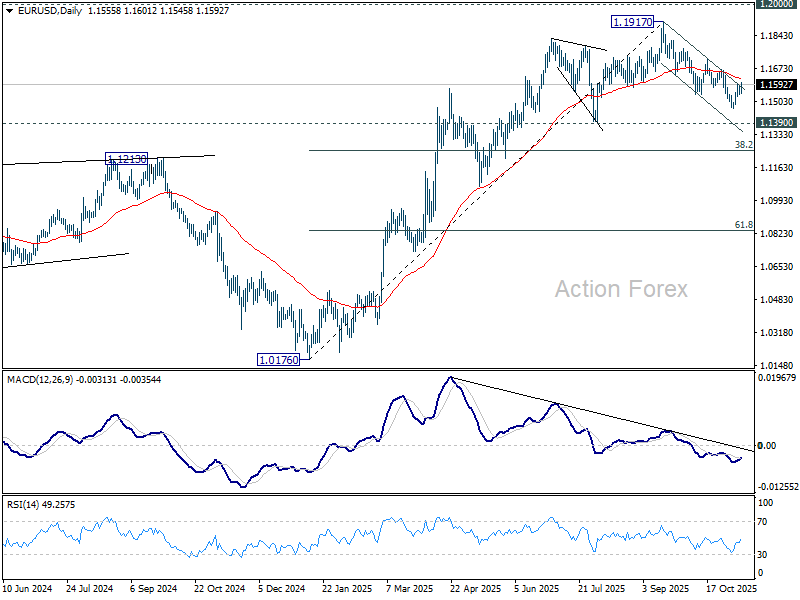
In the bigger picture, considering bearish divergence condition in D MACD, a medium term top is likely in place at 1.1917, just ahead of 1.2 key psychological level. As long as 55 W EMA (now at 1.1306) holds, the up trend from 0.9534 (2022 low) is still expected to continue. Decisive break of 1.2000 will carry larger bullish implications. However, sustained trading below 55 W EMA will argue that rise from 0.9534 has completed as a three wave corrective bounce, and keep long term outlook outlook bearish.
GBP/USD Mid-Day Outlook
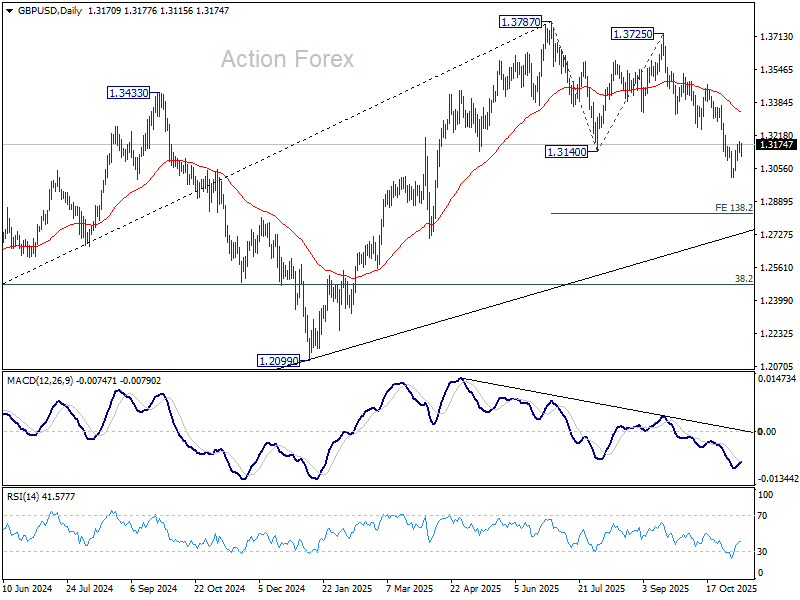
Daily Pivots: (S1) 1.3144; (P) 1.3168; (R1) 1.3198; More...
No change in GBP/USD's outlook and intraday bias stays neutral. More consolidations would be seen above 1.3008. Further decline is expected as long as 1.3247 support turned resistance holds. Break of 1.3008 will target 138.2% projection of 1.3787 to 1.3140 from 1.3725 at 1.2831. Nevertheless, firm break of 1.3247 will suggest that fall from 1.3787 has completed as a corrective move already.
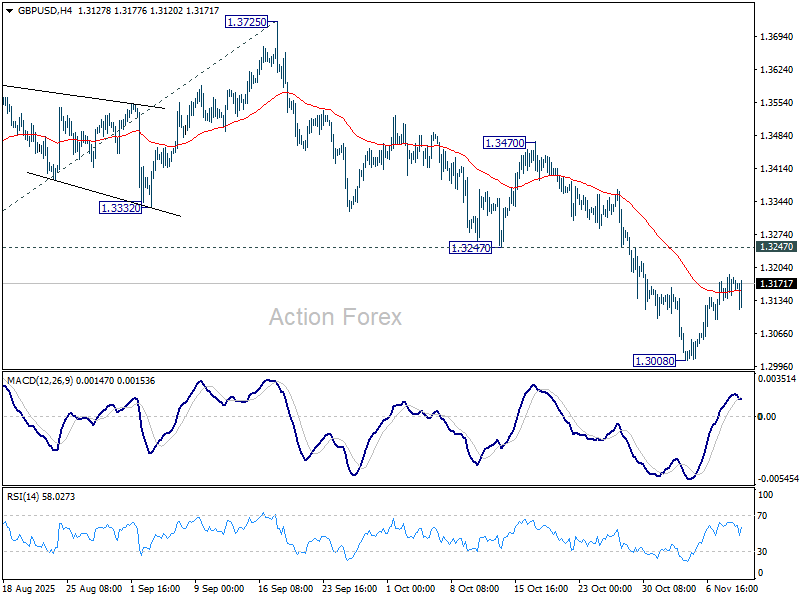
In the bigger picture, the break of 55 W EMA (now at 1.3185) is taken as the first sign that corrective rise from 1.0351 (2022 low) has completed. Decisive break of trend line support (now at 1.2780) will solidify this case and target 38.2% retracement of 1.0351 to 1.3787 at 1.2474 next. Meanwhile, in case of another rise, strong resistance should emerge below 1.4248 (2021 high) to cap upside to preserve the long term down trend.