Sample Category Title
A Key Day for EUR/USD as the Fed Decision Looms
The EUR/USD pair declined to 1.1642 on Wednesday, with investor attention firmly fixed on the Federal Reserve's impending policy decision. The central bank is widely expected to cut interest rates by 25 basis points.
Market participants will scrutinise the subsequent commentary from Chair Jerome Powell for any signals regarding the path for further policy easing. A further rate cut in December is already partially priced into the market.
Additional attention is being drawn to the upcoming meeting between Donald Trump and Xi Jinping, at which the parties may approve a framework trade agreement. The document provides for the suspension of new US tariffs and Chinese restrictions on exports of rare earth metals.
Meanwhile, the US dollar continues to weaken against the Japanese yen. This follows discussions between Japanese Finance Minister Satsuki Katayama and US Treasury Secretary Scott Bessent, in which they addressed recent volatility in the currency markets. Bessent’s call for a "prudent monetary policy" was interpreted by investors as a veiled criticism of the slow pace of interest rate normalisation in Japan.
Technical Analysis: EUR/USD
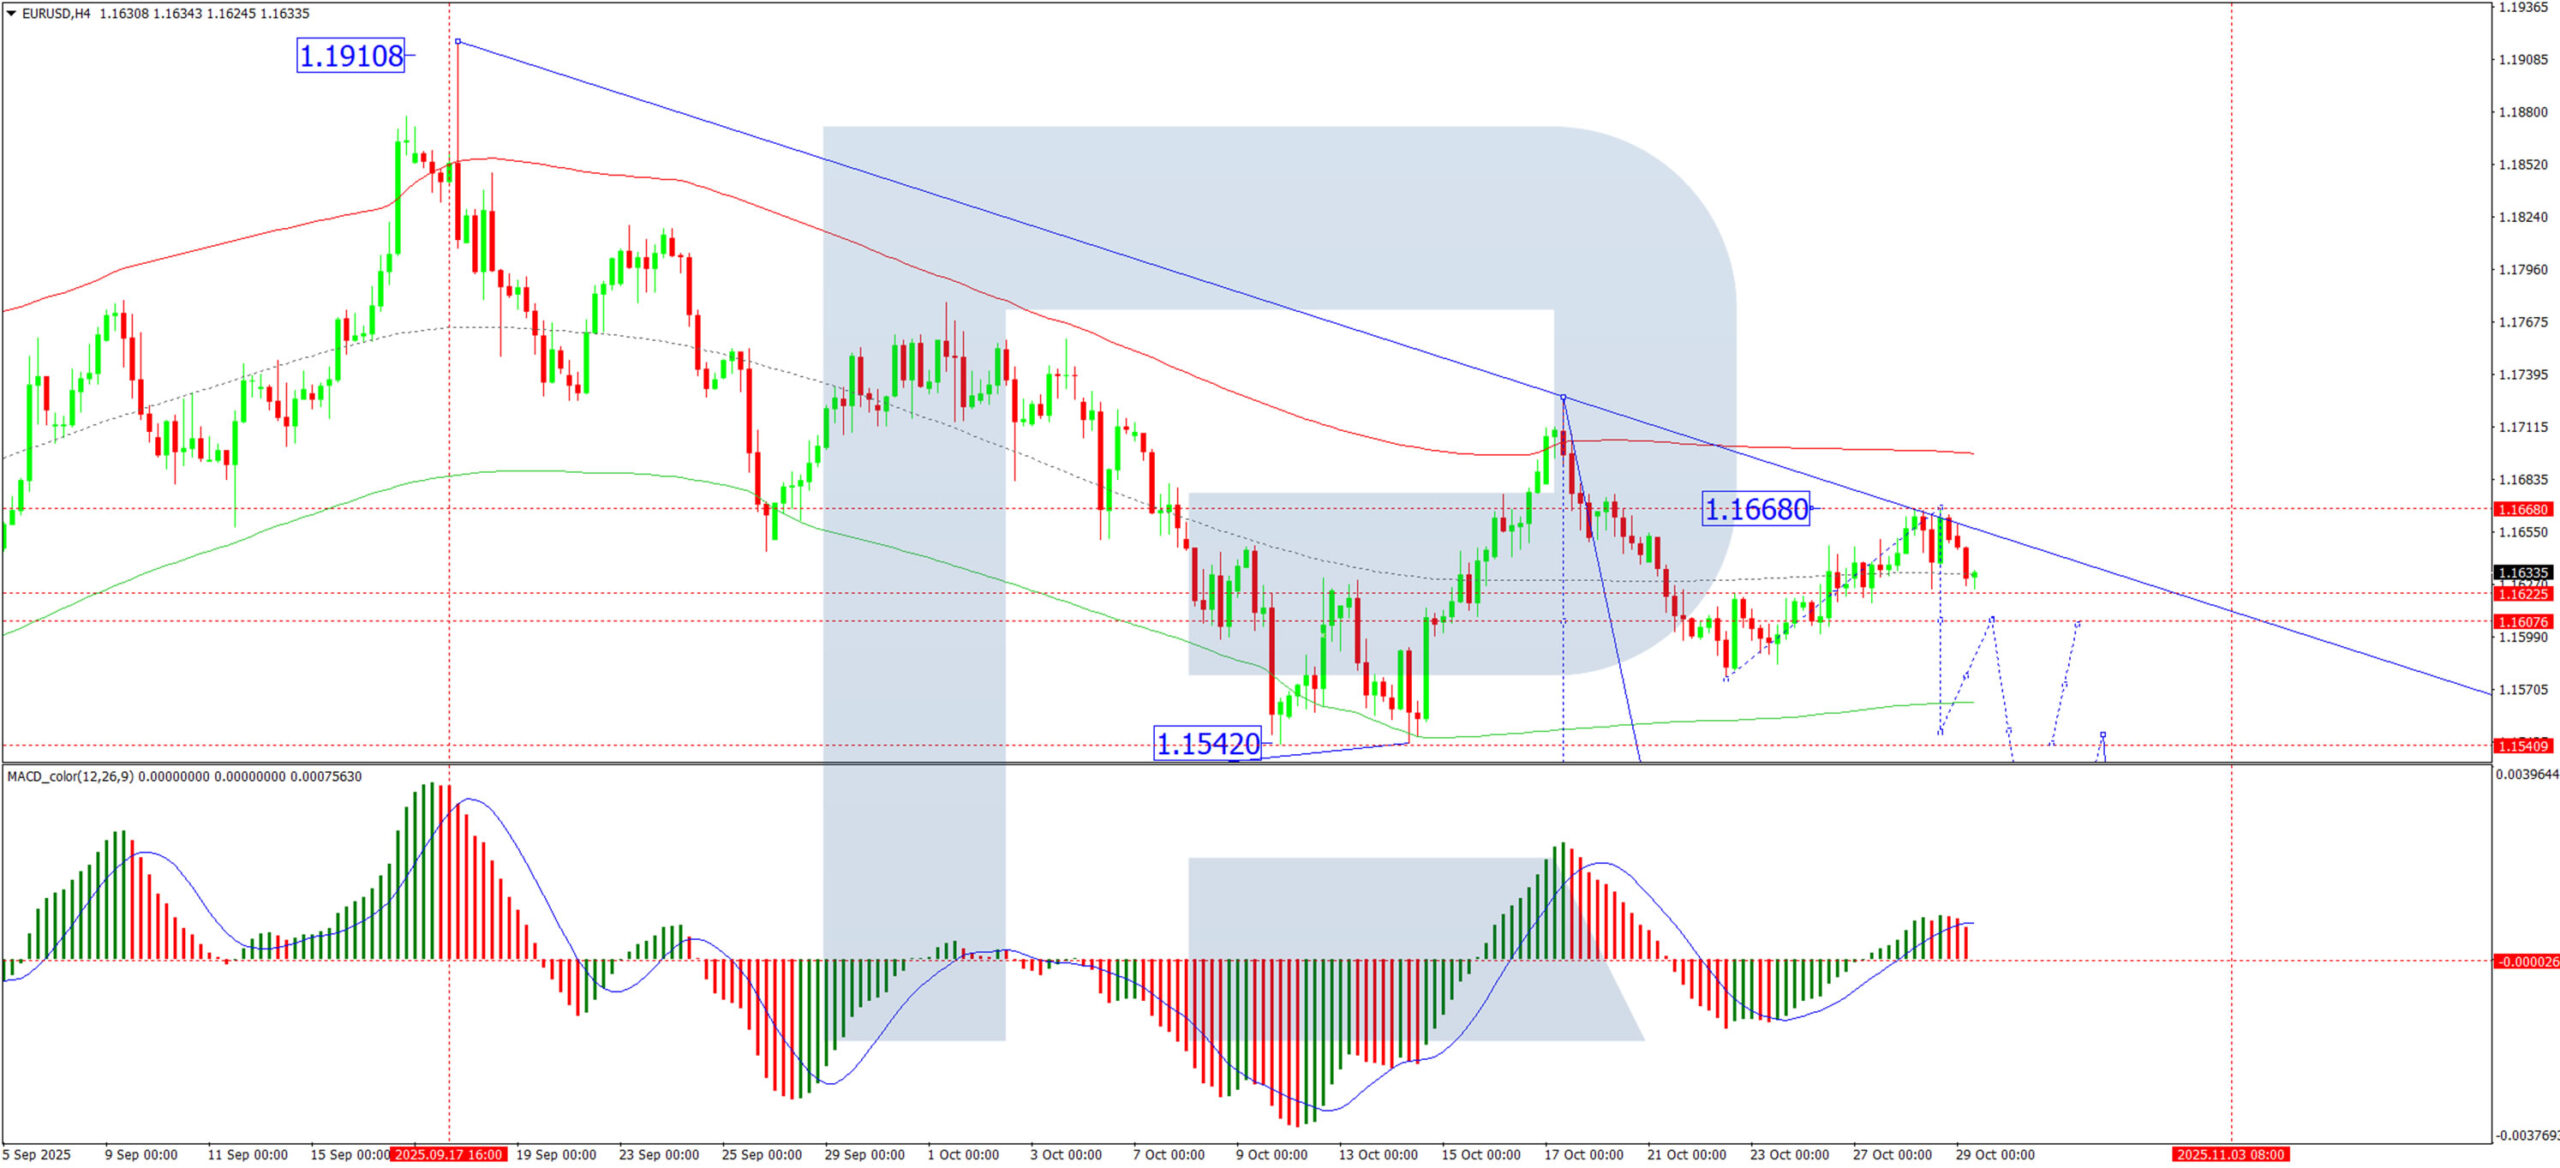
H4 Chart:
On the H4 chart, the EUR/USD pair formed a tight consolidation range around the 1.1600 level. After an upward breakout, the pair completed a correction to 1.1680. With that correction now over, a new decline has begun. The next target for this bearish wave is 1.1540, which is considered only the first leg of the downtrend. Following a minor correction back towards 1.1600, the decline is expected to extend to at least 1.1488. This scenario is technically confirmed by the MACD indicator. Its signal line is above zero but has diverged from the histogram and is pointing decisively downward, indicating sustained bearish momentum.
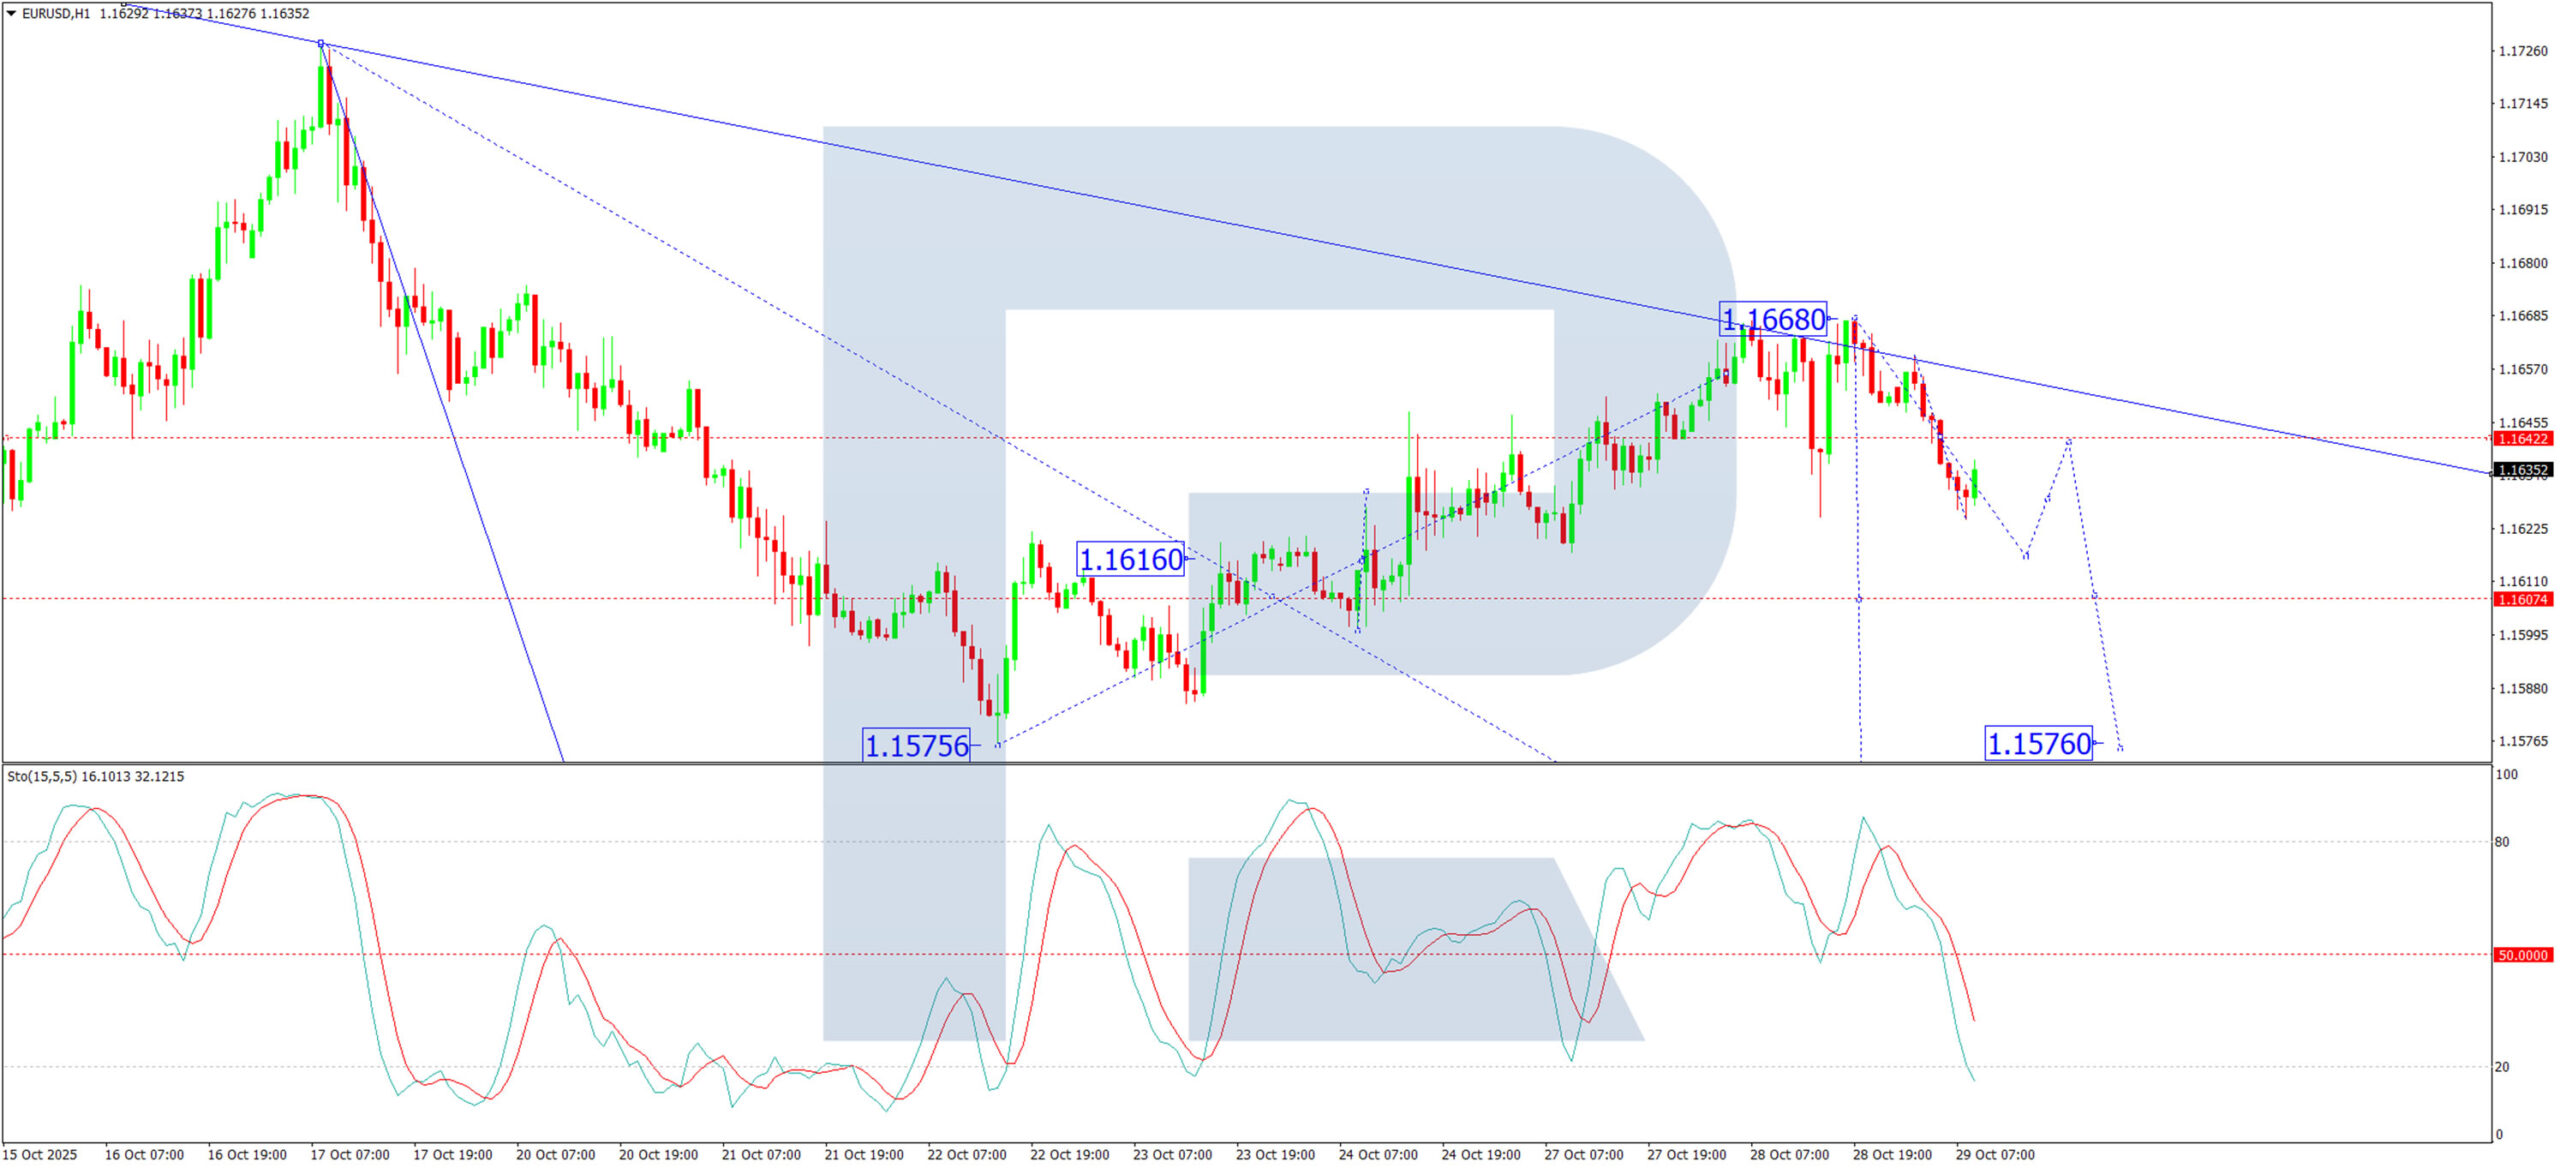
H1 Chart:
On the H1 chart, the market is forming a downward wave structure targeting 1.1616. The pair is effectively establishing the boundaries of a new consolidation range around this level. An upward breakout could trigger another correction towards 1.1640. However, the primary expectation is for a resumption of the downtrend to 1.1576, with the potential to extend the wave to 1.1540. This would represent only the first half of the third wave within the broader downward trend. The Stochastic oscillator supports this outlook. Its signal line is below 50 and is falling confidently towards 20, suggesting that short-term downward potential remains.
Conclusion
The fundamental focus is squarely on the Fed, with technicals pointing to a bearish resolution for the EUR/USD. The overall structure suggests any rallies are likely corrective within a broader downtrend, with key targets situated near 1.1540 and potentially 1.1488.
Disclaimer:
Any forecasts contained herein are based on the author’s particular opinion. This analysis may not be treated as trading advice. RoboForex bears no responsibility for trading results based on trading recommendations and reviews contained herein.
AUD/USD Poised for More Upside
- AUDUSD extends recovery phase toward October’s highs.
- Short-term bias remains positive, but key barriers still lie ahead.
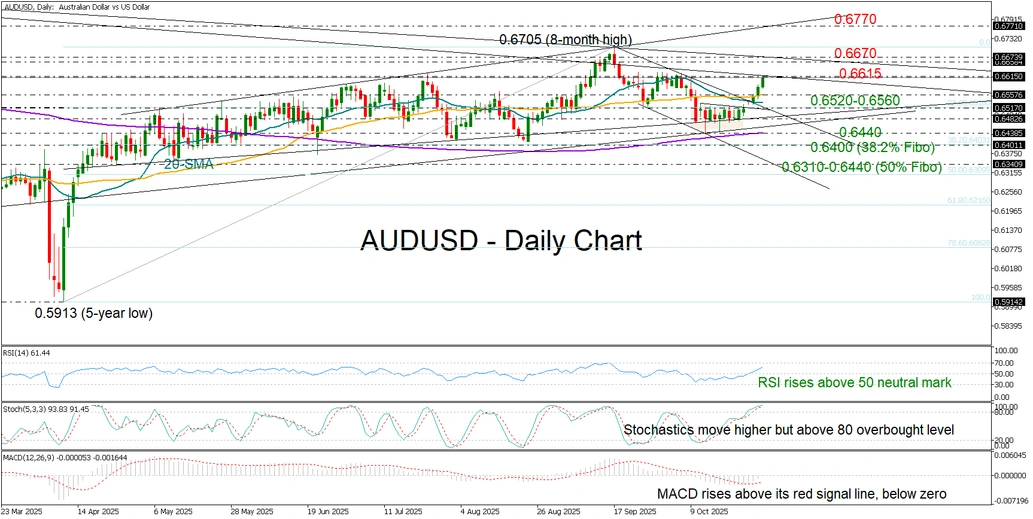
AUDUSD continues its recovery, extending toward October’s highs near 0.6625 after the Reserve Bank of Australia (RBA) downplayed the chances of further rate cuts while inflation ticked higher. The shift in expectations helped lift the currency out of a brief consolidation phase.
In contrast, the U.S. Federal Reserve is expected to maintain its easing stance. While rate reductions are already priced in for this year, markets are watching for hints of additional cuts in early 2026. If confirmed, such expectations could fuel further gains in AUDUSD. However, the Fed will not update its rate or economic projections when its two-day policy meeting concludes today.
Technically, the pair’s break above the simple moving averages (SMAs) has improved the short-term picture. The positive trajectory in the RSI and the stochastic oscillator also support bullish momentum. Still, the pair remains capped below the long-term descending trendline connecting the 2021 and 2024 highs around 0.6615. The nearby 200-weekly SMA near 0.6670 is another critical resistance. A decisive move above these barriers could open the way toward 0.6770.
On the downside, the 0.6520–0.6560 region, containing the short-term SMAs and the 23.6% Fibonacci retracement of the April–September rally, may buffer downside movements. Further weakness below 0.6480 or 0.6400 could shift the outlook to bearish, shifting the spotlight to 0.6340.
Overall, the short-term bias for AUDUSD remains positive, with a close above 0.6615 likely to confirm renewed bullish momentum.
Crypto Market Continues to Retreat
Market Overview
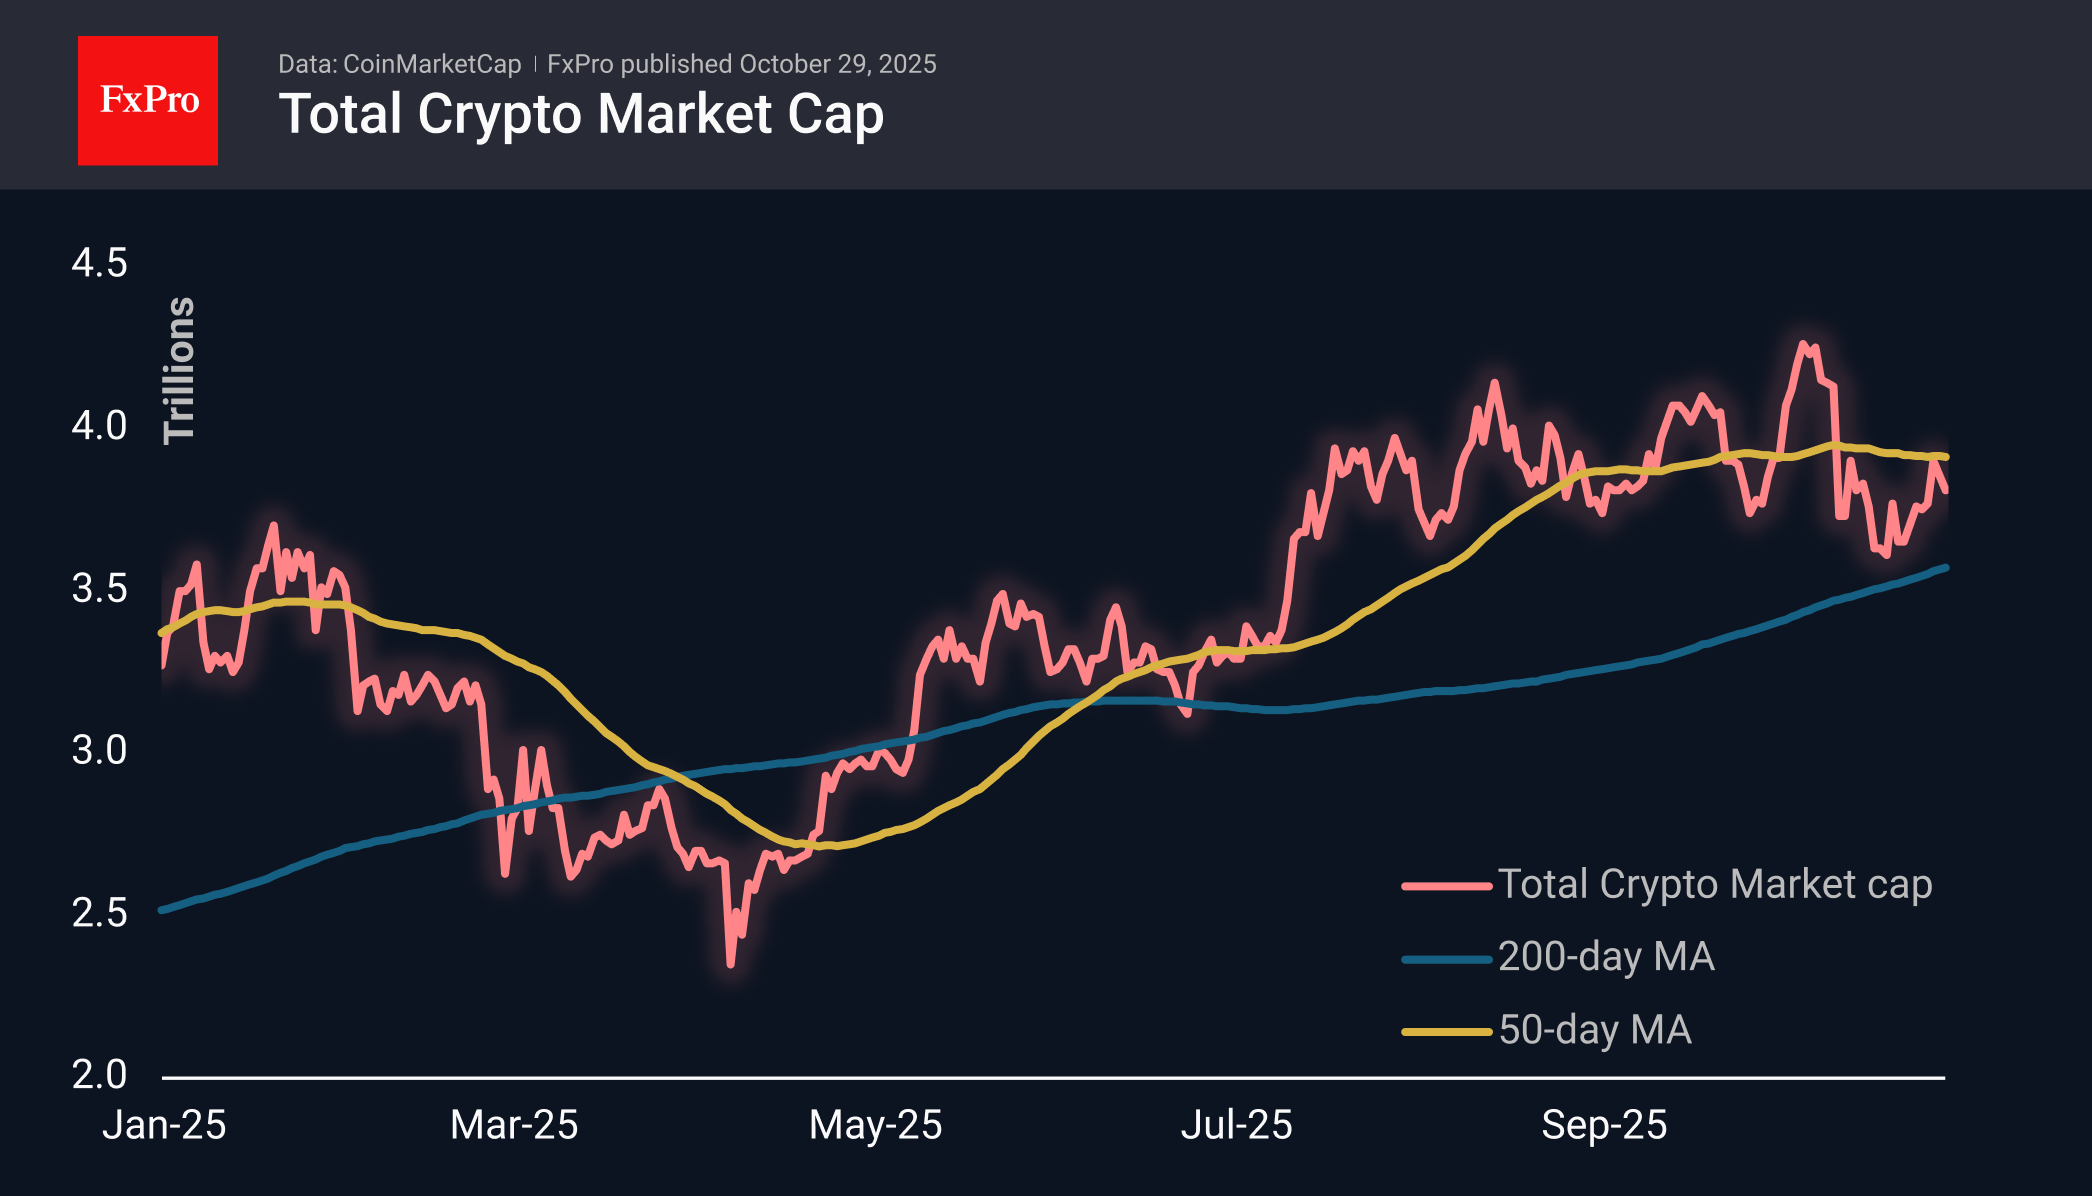
The crypto market cap fell by another 1% to $3.81 trillion over the past 24 hours, continuing its retreat. On Monday, the 50-day moving average acted as resistance, stumbling the market’s recovery. The Trump coin is bucking the market trend, gaining more than 15% in 24 hours and 35% in 7 days.
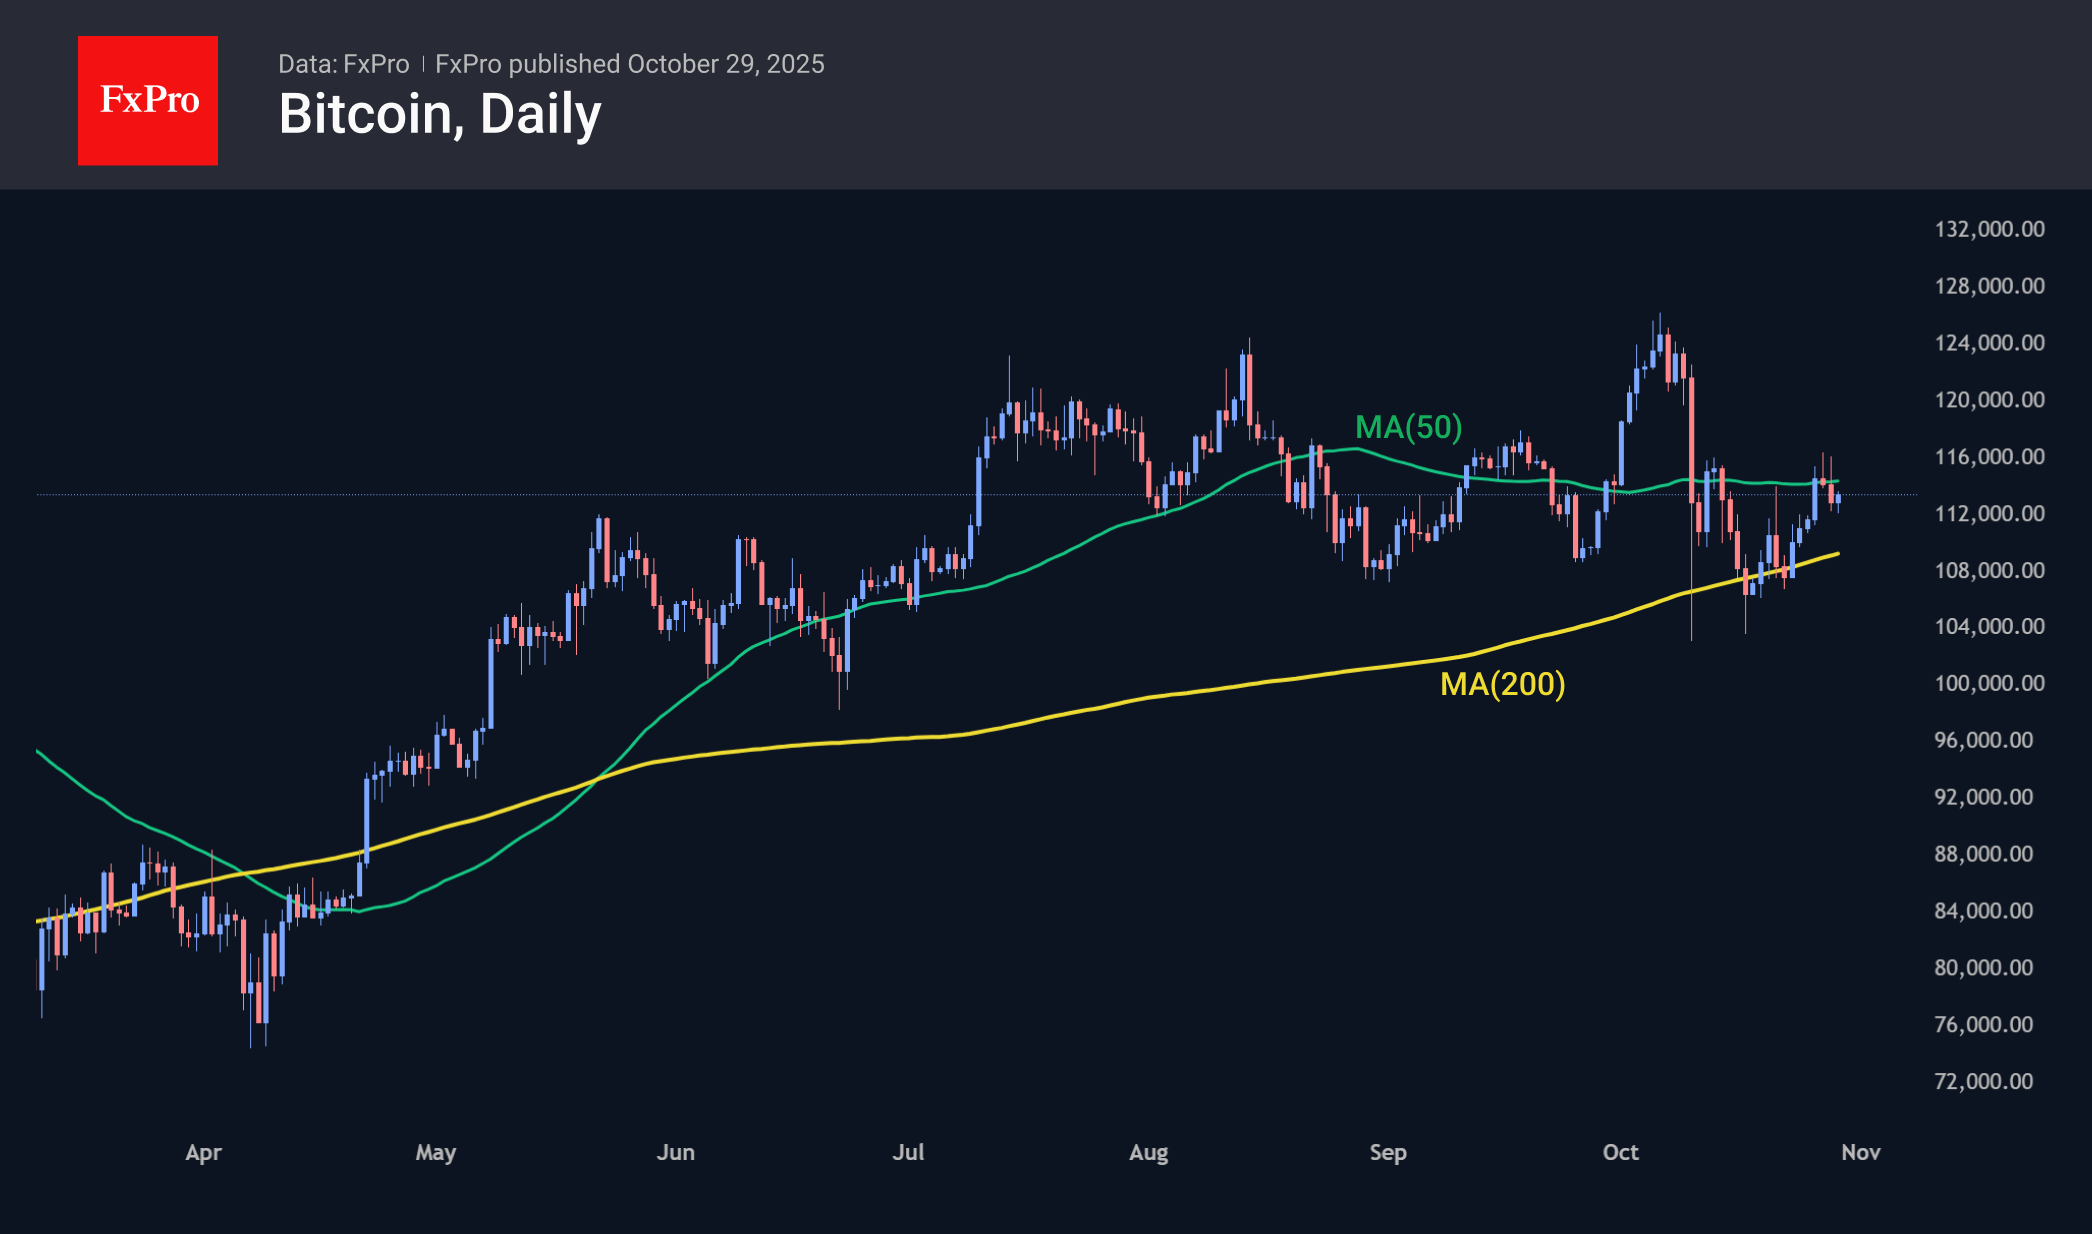
Bitcoin has gained slightly since the start of the day to $113.4K but is down 0.7% from the previous day’s level. The first cryptocurrency remains between two essential moving averages, the 50-day above and the 200-day below. So far this week, we have seen sales on the rise towards $115K. This performance contrasts with stock indices, which are constantly updating their all-time highs. We view this dynamic as an indicator of the fragility of global investor sentiment beneath the mask of general positivity.
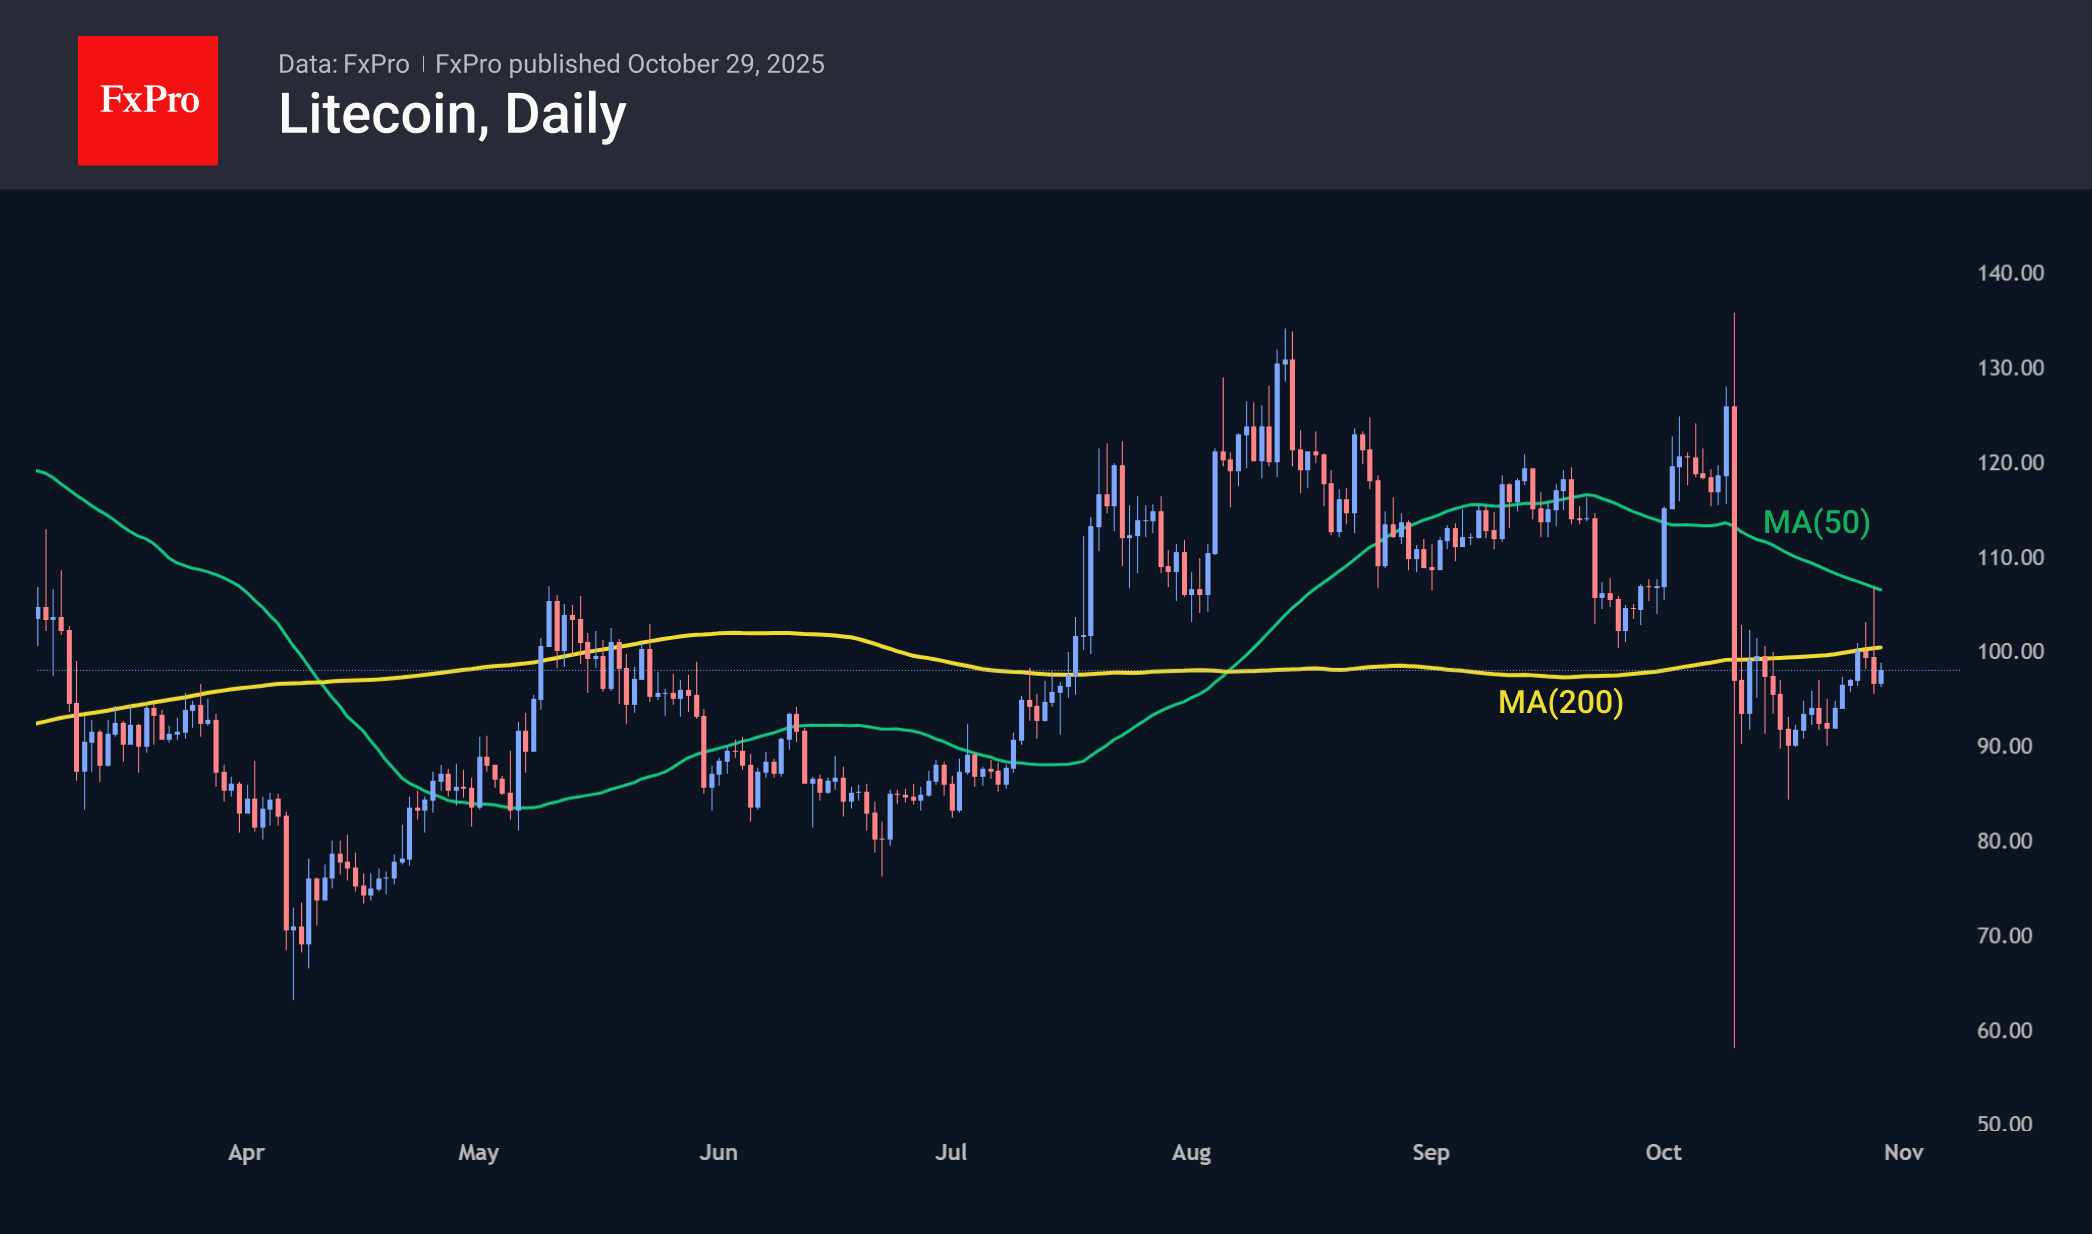
Litecoin has fallen more than 8% to $97 from Tuesday’s peak. As with the whole crypto market and Bitcoin, the coin failed to take the 50-day MA, which was tested later than in the first two cases. However, in this case, LTC immediately fell below the 200-day MA, and a death cross is brewing in the coin due to the downward 50-day MA.
News Background
To continue its rally to new highs, Bitcoin must hold the support level at $114K, where the 200-day moving average is located, Swissblock notes.
Bitcoin’s ability to overcome resistance at $116K is limited by the lack of significant inflows and low activity on the network, according to Glassnode. Continued growth requires an increase in spot trading volume and on-chain activity.
S&P Global Ratings has assigned Strategy a B- credit rating, classifying its securities as junk bonds. This is because of the company’s excessive concentration of assets in Bitcoin with debt obligations in US dollars.
In recent months, Strategy has sharply slowed the pace of BTC purchases due to difficulties in raising capital. TD Cowen remains optimistic about the company and its shares.
The Bitplanet crypto exchange will become the first public company in South Korea to create its own Bitcoin reserve. Bitplanet has already purchased its first 93 BTC and plans daily purchases to bring its reserves to 10,000 BTC.
EUR/USD Holds Weak, USD/CHF Retreats From Highs
EUR/USD started a downside correction from 1.1665. USD/CHF failed to clear 0.8000 and recently started a downside correction.
Important Takeaways for EUR/USD and USD/CHF Analysis Today
- The Euro seems to be facing strong resistance at 1.1665 against the US Dollar.
- There is a bullish trend line forming with support at 1.1635 on the hourly chart of EUR/USD at FXOpen.
- USD/CHF is correcting gains below 0.7960 and 0.7950.
- There is a declining channel or a bullish flag pattern forming with resistance at 0.7950 on the hourly chart at FXOpen.
EUR/USD Technical Analysis
On the hourly chart of EUR/USD at FXOpen, the pair gained pace for a move above 1.1635. The Euro tested 1.1665 and recently corrected gains against the US Dollar.
The pair dipped below 1.1645, the 50-hour simple moving average, and the 23.6% Fib retracement level of the upward move from the 1.1576 swing low to the 1.1668 high. The pair is now testing a bullish trend line forming with support at 1.1635.
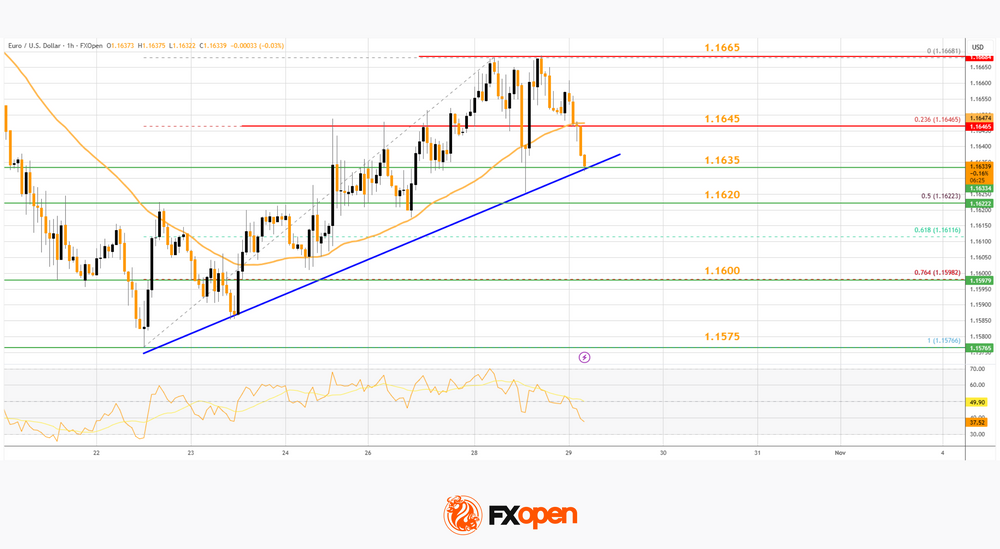
If the trend line holds, the pair could attempt a fresh increase. Immediate resistance on the upside is near 1.1645. The next key hurdle for the bulls could be near 1.1665.
An upside break above 1.1665 might send the pair toward 1.1700. Any more gains might open the doors for a move toward 1.1740. On the downside, immediate support on the EUR/USD chart is seen near the trend line.
The next major area of interest is 1.1620 and the 50% Fib retracement. A downside break below 1.1620 could send the pair toward the 1.1600 handle.
USD/CHF Technical Analysis
On the hourly chart of USD/CHF at FXOpen, the pair attempted a fresh increase above 0.7950. However, the US Dollar struggled near 0.7985 and recently started a fresh decline against the Swiss Franc.
The pair dipped below 0.7950 and the 50-hour simple moving average. The decline was such that the pair even spiked below the 50% Fib retracement level of the upward move from the 0.7872 swing low to the 0.7986 high.
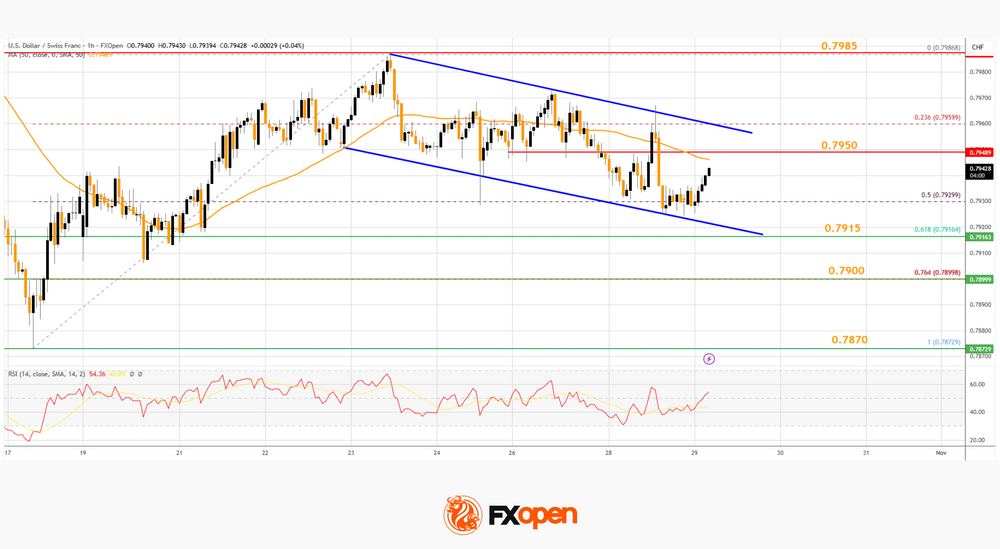
On the other hand, there is a declining channel or a bullish flag pattern forming with resistance at 0.7950 and the 50-hour simple moving average. To start a fresh increase, the pair must settle above the channel.
The next major area of interest could be 0.7985. The main sell region could be near 0.8000. If there is a clear break above 0.8000 and the RSI remains above 60, the pair could start another increase. In the stated case, it could test 0.8050.
If there is another decline, the pair might test 0.7915 and the 61.8% Fib retracement. The first major support on the USD/CHF chart is near 0.7900.
A downside break below 0.7900 might spark bearish moves. The next key target for the bears might be 0.7870. Any more losses may possibly open the doors for a move toward 0.7820 in the near term.
Trade over 50 forex markets 24 hours a day with FXOpen. Take advantage of low commissions, deep liquidity, and spreads from 0.0 pips. Open your FXOpen account now or learn more about trading forex with FXOpen.
This article represents the opinion of the Companies operating under the FXOpen brand only. It is not to be construed as an offer, solicitation, or recommendation with respect to products and services provided by the Companies operating under the FXOpen brand, nor is it to be considered financial advice.
Australian Dollar Rises Above $0.660
According to the AUD/USD chart today, the Australian dollar has climbed to its highest level in three weeks. The currency’s strength stems from the following factors:
→ Australia’s monthly consumer price index (CPI) came in stronger than expected. According to Forex Factory, annual inflation reached 3.5%, compared with analysts’ forecasts of 3.1%. This marks the highest reading since July 2024, pointing to renewed inflationary pressure.
→ As a result, traders have significantly reduced bets on further monetary easing. Data from Trading Economics shows that the probability of the Reserve Bank of Australia keeping its interest rate unchanged at 3.6% at its 4 November meeting is now close to 90%.
Technical Analysis of the AUD/USD Chart
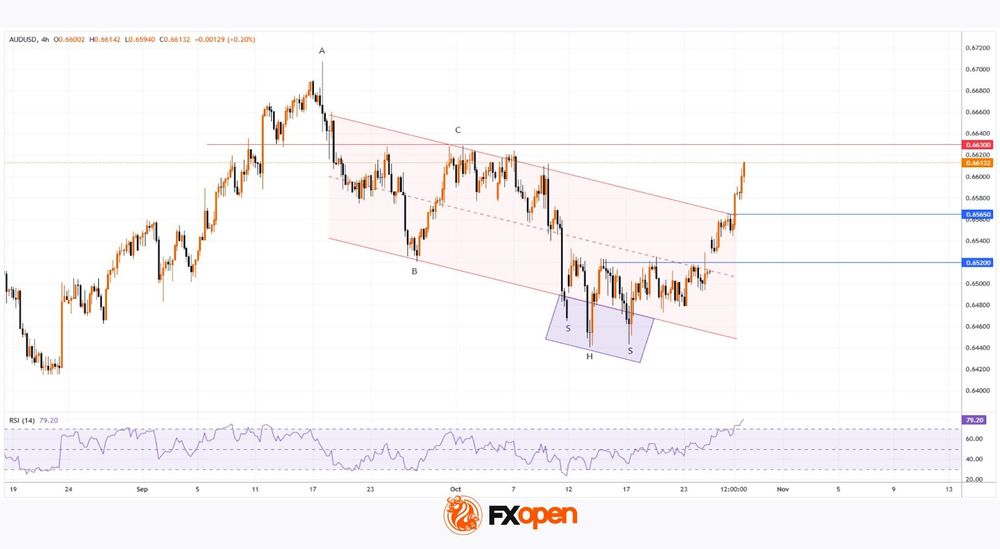
Since mid-September, movements in the AUD/USD pair have formed a descending channel (shown in red), built on a series of lower highs and lows starting from point A.
However, note that in mid-October:
→ the price dipped below the lower boundary;
→ the RSI indicator entered oversold territory;
→ candles displayed large bodies;
→ an inverted head and shoulders reversal pattern emerged.
From a Smart Money Concept perspective, it is reasonable to assume that within the area marked by the purple rectangle, Smart Money was accumulating sellers’ liquidity to build long positions.
Following this, the Australian dollar showed strong momentum as the price broke through:
→ resistance at 0.6520 near the channel’s median (forming a bullish gap in the process);
→ the upper boundary of the red channel around 0.6565.
Building on this view → the price now appears to be moving towards a liquidity zone, where Smart Money could find sufficient buy-side liquidity. This area may lie above the 0.6630 level, which previously acted as resistance in early October.
It is also possible that today’s Federal Reserve decision (the Federal Funds Rate announcement scheduled for 21:00 GMT+3) will help this scenario play out.
Trade over 50 forex markets 24 hours a day with FXOpen. Take advantage of low commissions, deep liquidity, and spreads from 0.0 pips. Open your FXOpen account now or learn more about trading forex with FXOpen.
This article represents the opinion of the Companies operating under the FXOpen brand only. It is not to be construed as an offer, solicitation, or recommendation with respect to products and services provided by the Companies operating under the FXOpen brand, nor is it to be considered financial advice.
FI and FX Markets Zooming in on Fed Tonight.
Markets
US president Trump is considering to cut a punitive 20% tariff over Chinese fentanyl exports to 10%. The rumour reported yesterday and confirmed by the man himself this morning encouraged the bulls and supported US stocks towards new record highs (again). The Nasdaq outperformed by eking out a 0.8% gain. The fentanyl tariff will be one of the topics presidents Trump and Xi will discuss during their meeting tomorrow. Add to the list: Nvidia’s state-of-the-art “super-duper” Blackwell chips. Trump in overnight comments said he’s open to providing China with access to it as part of a trade deal in what would be a major U turn by POTUS. China in turn is said to have bought the first US soybean cargoes in months in return as a sweetener ahead of the meeting. Everything is set for another risk-on vibe across markets today. European futures pare losses. Wall Street (though early to tell) is set for a higher open. The US dollar snaps a 5-day losing streak against the euro (EUR/USD 1.163). AUD outperforms (see below). The pound remains in the defensive after an already disastrous day yesterday. Multiple technical support zones broke, pushing EUR/GBP currently to its highest level since May 2023 just shy of 0.88. The trigger was BRC October price data showing that food inflation dropped the most since December 2020, stripping the hawks at the Bank of England from key arguments not to lower rates. The market implied probability for a BoE rate cut next week rises to 35%.
Today’s a big day for all corners in the market. Several European countries including Spain and Belgium release Q3 GDP numbers. Equities are eyeballing day one of after-market earnings from big tech including Alphabet, Meta and Microsoft. They are followed by Amazon and Apple tomorrow and, carrying around a quarter of the S&P500’s weight, could be crucial in entertaining the current risk rally. FI and FX markets are zooming in on the Fed tonight. A 25 bps rate cut is all but certain. Investors are keen to spot hints for future moves but we’re not sure whether chair Powell is in a position to give them since there’s virtually no official data rolling in. That could temper the market reaction. We don’t expect him to actively push back against markets pricing an additional move in December though. The end to QT could steal the rate cut’s thunder instead. Powell announced it two weeks ago at the NABE conference amid commercial bank reserves at the central bank dwindling to below $3tn. That’s less than 10% of GDP Fed Waller suggested as a minimum some years ago. That ballpark figure was based on the liquidity squeeze in 2019 which saw a spike in the short-term SOFR interbank rate. The level of bank reserves back then had dropped below 8% of GDP. The SOFR in recent days climbed back above the Fed’s upper bound rate again, potentially signaling growing liquidity pressures. We expect the chair to be queried about it. The current roll-off cap for Treasuries stands at $5bn per month, a limited amount anyway. MBS’s are capped at $35bn but the monthly amount in practice is often lower.
News & Views
Australian inflation quickened more than expected in Q3, rising by 1.3% Q/Q (up from +0.7% in Q2 & vs +1.1% consensus). It was the fastest quarterly pace since Q1 2023. The main contributors to the quarterly rise were housing (+2.5%), recreation and culture (+1.9%) and transport (+1.2%). The rise in electricity costs (+9%) was a significant contributor to the growth in housing inflation. Annual inflation (compared with Q3 2024) hit its highest level since Q2 2024 at 3.2% (up from 2.1% vs 3% expected). A monthly CPI report moreover pointed at an accelerating intra-quarter dynamic with inflation rising from 3% Y/Y in August to 3.5%. Stripping out for the biggest quarterly price swings, the trimmed mean CPI measure accelerated more than thought as well, from 0.7% Q/Q to 1% Q/Q and from 2.7% Y/Y to 3% Y/Y. Other details showed annual food inflation rising by 3.1% Y/Y in Q3, annual goods inflation going from 1.1% Y/Y to 3% Y/Y and annual services inflation hitting 3.5% Y/Y (from 3.3%). Today’s inflation numbers help convince markets that more RBA rate cuts are no foregone option. RBA governor Bullock recently also pushed back against the idea. The market implied probability of a 25 bps rate cut before year-end dropped from 91% just a week ago to currently 21%. The positive trade vibe between the US and China is the other thing at play. The AUD swap rate curve bear flattens with yields rising by 4.3 bps (30-yr) to 11.2 bps (2-yr). The Aussie dollar benefits, extending this week’s rally to currently AUD/USD 0.66.
Japanese consumer confidence rose from 35.3 to 35.8 in October (vs 35.5 consensus), the highest level since December 2024. Details showed a broad-based improvement with metrics like the overall livelihood, expectations for income growth and employment and willingness to purchase durable goods all hitting multi-month best levels.
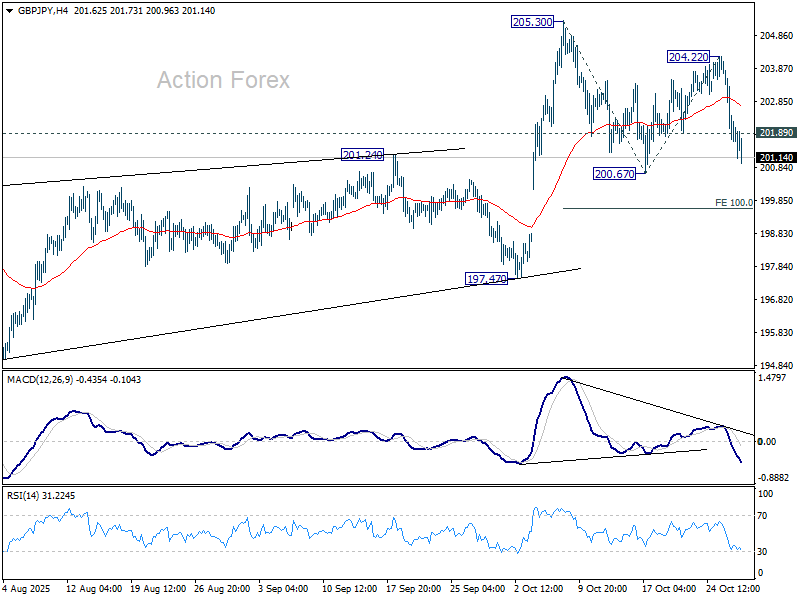
GBP/JPY Daily Outlook
Daily Pivots: (S1) 201.06; (P) 202.54; (R1) 203.41; More...
GBP/JPY's break of 201/89 minor support suggests that rebound from 200.67 has completed. Intraday bias is back on the downside for 200.67. Firm break there will resume whole fall from 205.30, and target 100% projection of 205.30 to 200.67 from 204.22 at 199.59. For now, risk will stay on the downside as long as 204.22 resistance holds, in case of recovery.
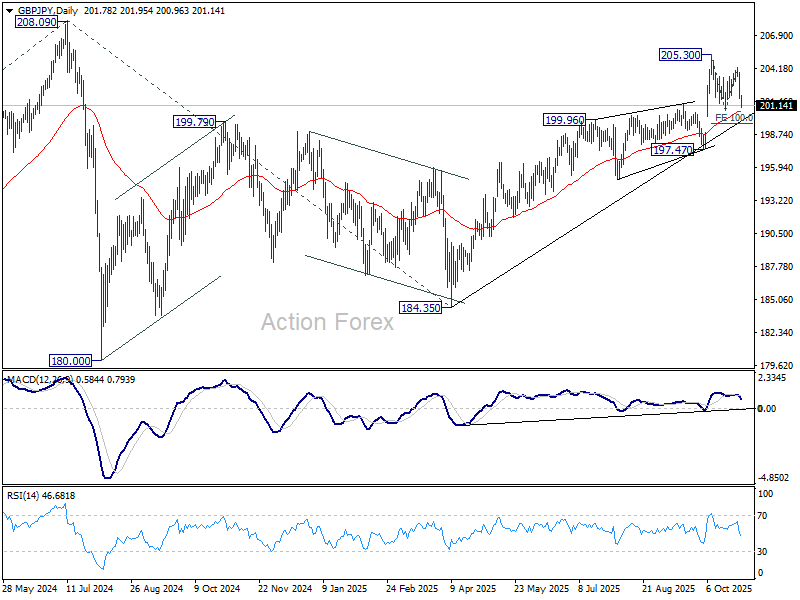
In the bigger picture, price actions from 208.09 (2024 high) are seen as a corrective pattern which might have completed at 184.35. Firm break of 208.09 high will resume the up trend from 123.94 (2020 low). Next target is 61.8% projection of 148.93 to 208.09 from 184.35 at 220.90. However, decisive break of 197.47 support will dampen this view and extend the corrective pattern with another fall.
EUR/JPY Daily Outlook
Daily Pivots: (S1) 176.81; (P) 177.44; (R1) 177.89; More...
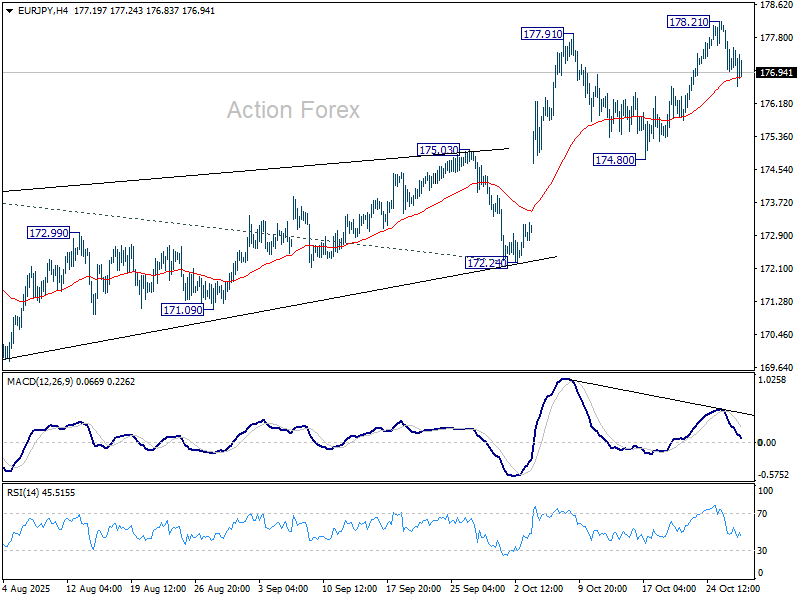
Intraday bias in EUR/JPY remains neutral and more consolidations could be seen below 178.21. Downside should be contained well above 174.80 to bring another rally. On the upside, break of 178.21 will resume larger up trend to 61.8% projection of 161.06 to 173.87 from 172.24 at 180.15 next.
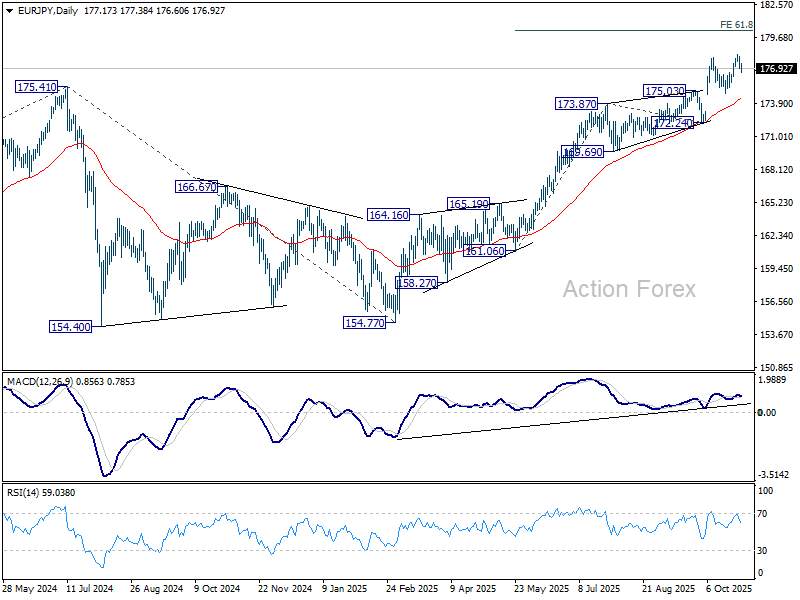
In the bigger picture, up trend from 114.42 (2020 low) is in progress and should target 61.8% projection of 124.37 to 175.41 from 154.77 at 186.31. Firm break of 172.24 support will suggests that it has turned into consolidations again. But still, outlook will continue to stay bullish as long as 55 W EMA (now at 167.87) holds, even in case of deep pullback.
EUR/GBP Daily Outlook
Daily Pivots: (S1) 0.8737; (P) 0.8764; (R1) 0.8804; More…
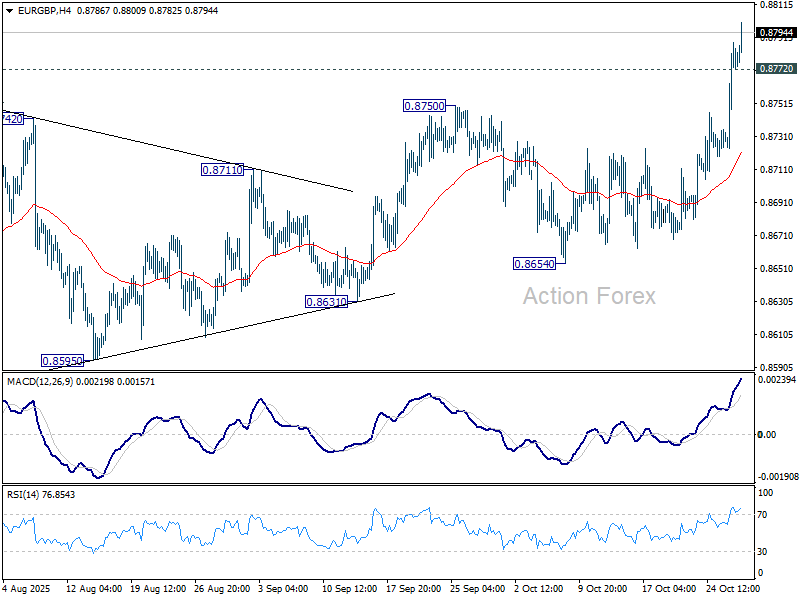
EUR/GBP's rally accelerates higher today and intraday bias stays on the upside for 0.8867 fibonacci level. On the downside, below 0.8718 minor support will turn intraday bias neutral again first. But near term outlook will now stay bullish as long as 0.8654 support holds, in case of retreat.
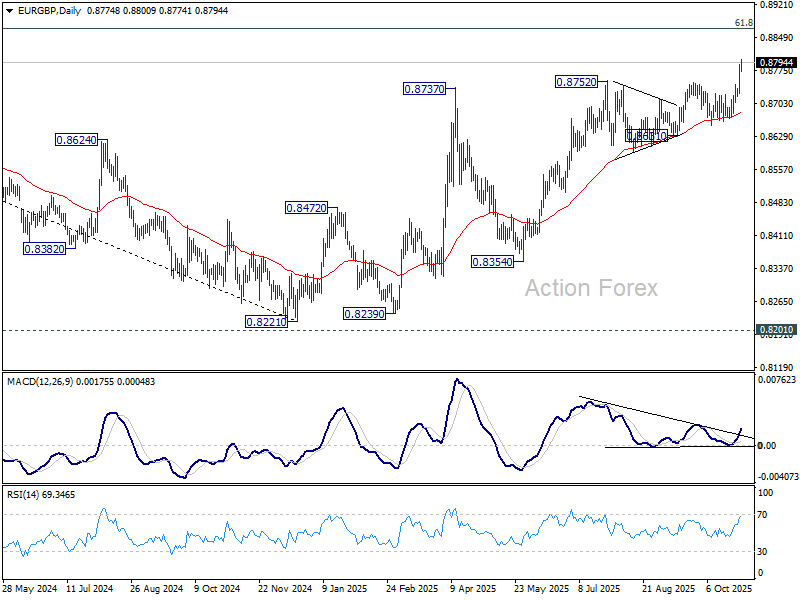
In the bigger picture, rise from 0.8221 medium term bottom is seen as a corrective move. While further rally cannot be ruled out, upside should be limited by 61.8% retracement of 0.9267 to 0.8221 at 0.8867. Firm break of 0.8654 support will be the first sign that this corrective bounce has completed. However, decisive break of 0.8867 will suggest that EUR/GBP is already reversing whole decline from 0.9267 (2022 high).
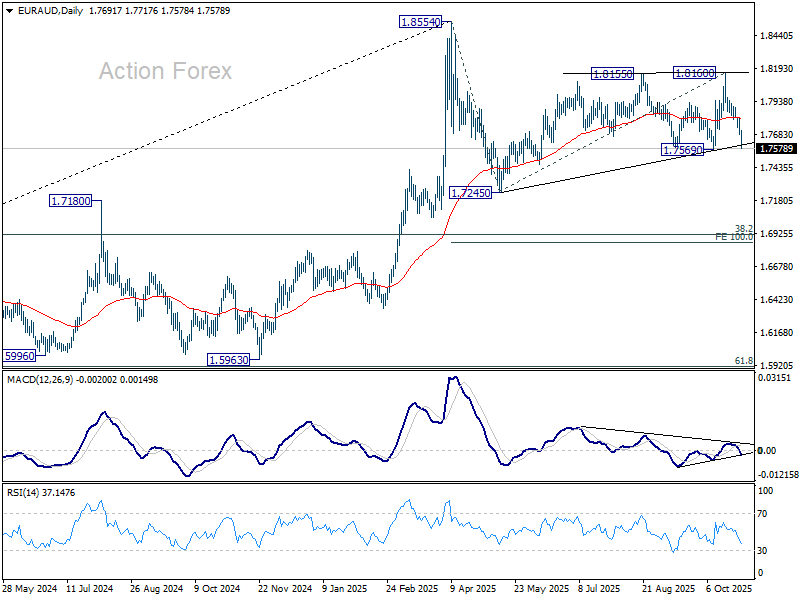
EUR/AUD Daily Outlook
Daily Pivots: (S1) 1.7654; (P) 1.7734; (R1) 1.7777; More...
EUR/AUD's fall from 1.8160 accelerates lower today and intraday bias remains on the downside. Firm break of 1.7569 support will confirm that pattern from 1.8554 already in its third leg, and target 1.7245 next. On the upside, above 1.7717 minor resistance will turn intraday bias neutral and bring consolidations first, before staging another decline.
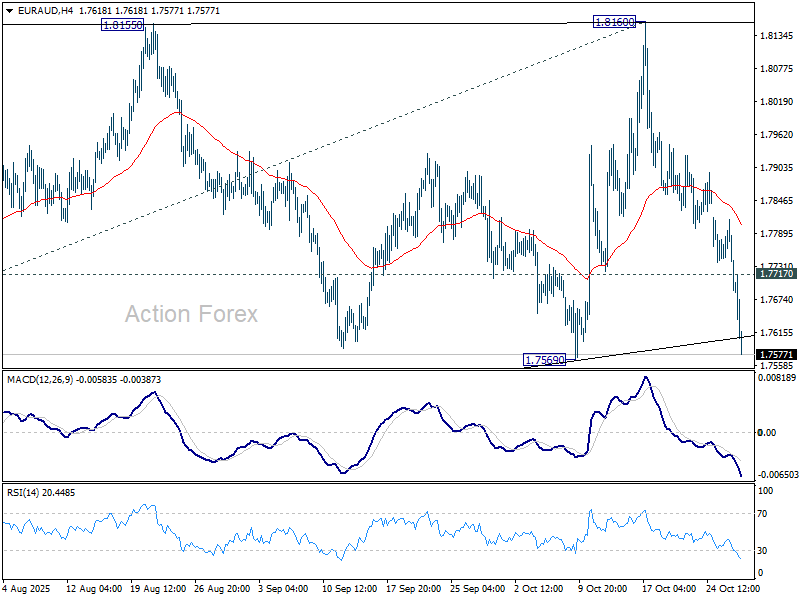
In the bigger picture, price actions from 1.8554 medium term top are seen as a corrective pattern. Sustained break of 55 W EMA will suggest that it's correcting the whole rally from 1.4281 (2022 low). In this case, deeper decline would be seen to 38.2% retracement of 1.4281 to 1.8554 at 1.6922. Nevertheless, strong rebound form 55 W EMA will likely bring resumption of the up trend sooner.