
Sample Category Title
EUR/GBP Mid-Day Outlook
Daily Pivots: (S1) 0.8721; (P) 0.8729; (R1) 0.8738; More…
EUR/GBP's break of 0.8750 resistance confirms resumption of whole rally from 0.8221. Intraday bias is back on the upside for 0.8867 fibonacci level. On the downside, below 0.8718 minor support will turn intraday bias neutral again first. But near term outlook will now stay bullish as long as 0.8654 support holds, in case of retreat.
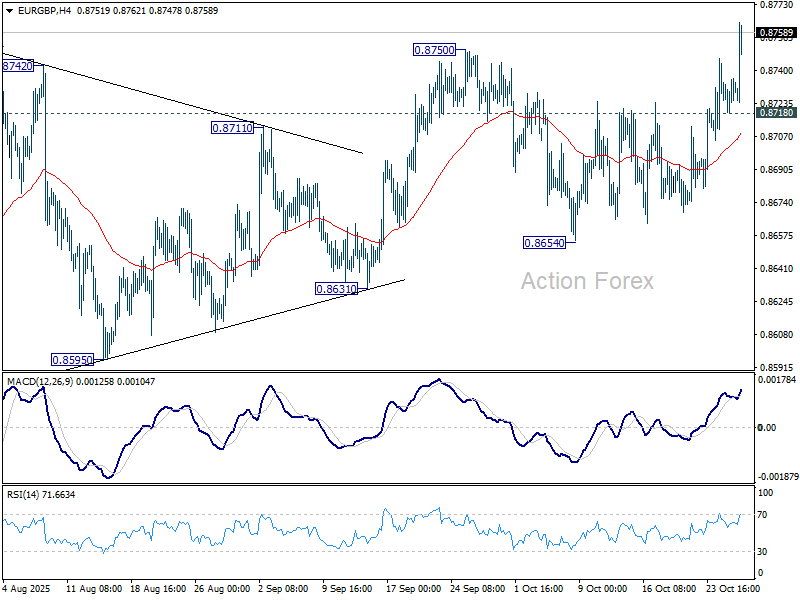
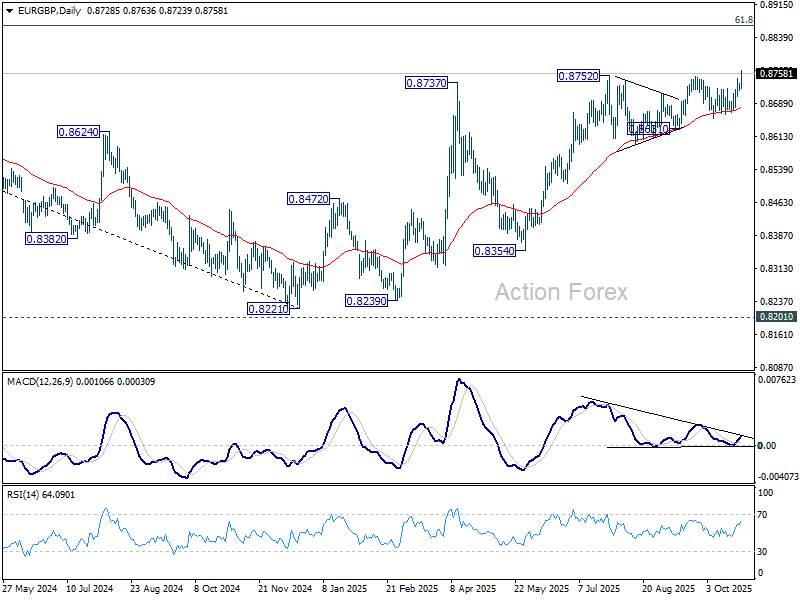
In the bigger picture, rise from 0.8221 medium term bottom is seen as a corrective move. While further rally cannot be ruled out, upside should be limited by 61.8% retracement of 0.9267 to 0.8221 at 0.8867. Considering bearish divergence condition in D MACD, firm break of 0.8654 support will be the first sign that this corrective bounce has completed. However, decisive break of 0.8867 will suggest that EUR/GBP is already reversing whole decline from 0.9267 (2022 high).
Sterling Sinks on UK Fiscal Shock; Aussie Steady Ahead of CPI
Sterling tumbled sharply today, hitting its lowest level against Euro in nearly a year as renewed fiscal concerns dominated sentiment. The selloff followed reports from the Financial Times that UK Chancellor Rachel Reeves will face a deeper-than-expected deterioration in the UK’s public finances, delivering an early setback ahead of next month’s crucial Budget.
According to the report, the Office for Budget Responsibility is preparing to slash its long-term productivity growth forecast by 0.3 percentage points, a more severe downgrade than markets had anticipated. The revision reflects persistent weakness in productivity growth since the 2008 financial crisis and would force the Treasury to account for roughly GBP 20–21B in additional borrowing by 2029–30.
The Institute for Fiscal Studies, which provided the underlying calculations cited by the Financial Times, noted that each 0.1-point reduction in productivity growth adds roughly GBP 7B to public borrowing. Markets had previously expected a smaller downgrade of between 0.1 and 0.2 points, implying a fiscal hit closer to GBP 7–14B. The larger revision leaves Chancellor Reeves with far less room for maneuver .
Elsewhere, Aussie traded mixed as risk sentiment cooled ahead of the highly anticipated Q3 CPI report due in the next Asian session. Economists expect headline inflation to rise 1.1% qoq, lifting the annual rate to 3.0% yoy from 2.1%. The trimmed mean CPI—the RBA’s preferred core measure—is forecast to rise 0.8% qoq, keeping the yearly rate steady at 2.7% yoy.
RBA Governor Michele Bullock signaled this week that an upside surprise in core inflation could be a “material miss.” She warned that a 0.9% quarterly increase—just 0.3 percentage points above the RBA’s own forecast—would raise concerns about inflation persistence. Her comments dampened market expectations for near-term rate cuts.
Money markets now assign just a 40% probability of a 25bps cut in November, down sharply from near 60% before Bullock’s remarks and over 80% a week ago. The CPI data will therefore be pivotal in shaping the RBA’s near-term guidance and the path of Australian Dollar into year-end.
In the broader currency space, Aussie remains the week’s top performer, followed by Yen and Kiwi. Sterling sits at the bottom. Dollar and Loonie also trade soft, while Euro and Swiss Franc hold mid-range. The configuration underscores a market leaning toward risk neutrality — cautious on Sterling, patient on the RBA, and positioning ahead of key macro catalysts later in the week.
In Europe, at the time of writing, FTSE is up 0.20%. DAX is down -0.04%. CAC is down -0.07%. UK 10-year yield is down -0.011 at 4.394. Germany 10-year yield is flat at 2.620. Earlier in Asia, Nikkei fell -0.58%. Hong Kong HSI fell -0.33%. China Shanghai SSE fell -0.22%. Singapore Strait Times rose 0.23%. Japan 10-year JGB yield fell -0.035 to 1.640.
ECB survey shows inflation expectations edge lower to 2.7%
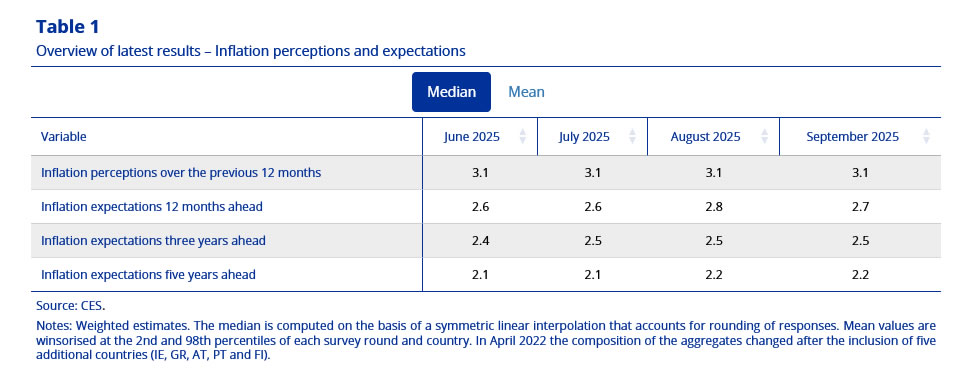
The ECB’s September Consumer Expectations Survey showed a modest easing in near-term inflation expectations, with the median outlook for the next 12 months slipping to 2.7% from 2.8%.
Expectations for three years ahead were unchanged at 2.5%, while five-year projections held steady at 2.2%, suggesting longer-term views remain well anchored. Uncertainty around the 12-month outlook also stayed unchanged, indicating little shift in household sentiment.
On the growth side, consumers’ expectations for economic performance over the next year remained negative but stable, holding at –1.2%. The data continue to reflect subdued confidence in the near-term recover.
Unemployment expectations were similarly steady at 10.7% for the 12-month horizon, signaling limited change in labor-market sentiment.
EUR/GBP Mid-Day Outlook
Daily Pivots: (S1) 0.8721; (P) 0.8729; (R1) 0.8738; More…
EUR/GBP's break of 0.8750 resistance confirms resumption of whole rally from 0.8221. Intraday bias is back on the upside for 0.8867 fibonacci level. On the downside, below 0.8718 minor support will turn intraday bias neutral again first. But near term outlook will now stay bullish as long as 0.8654 support holds, in case of retreat.
In the bigger picture, rise from 0.8221 medium term bottom is seen as a corrective move. While further rally cannot be ruled out, upside should be limited by 61.8% retracement of 0.9267 to 0.8221 at 0.8867. Considering bearish divergence condition in D MACD, firm break of 0.8654 support will be the first sign that this corrective bounce has completed. However, decisive break of 0.8867 will suggest that EUR/GBP is already reversing whole decline from 0.9267 (2022 high).
GOLD (XAUUSD) Elliott Wave: Incomplete Sequences Suggest the Path
Hello fellow traders. In this technical article, we are going to present Elliott Wave charts of GOLD (XAUUSD). In the following sections, we’ll break down the Elliott Wave structure in detail and explain the forecast and present the target levels.
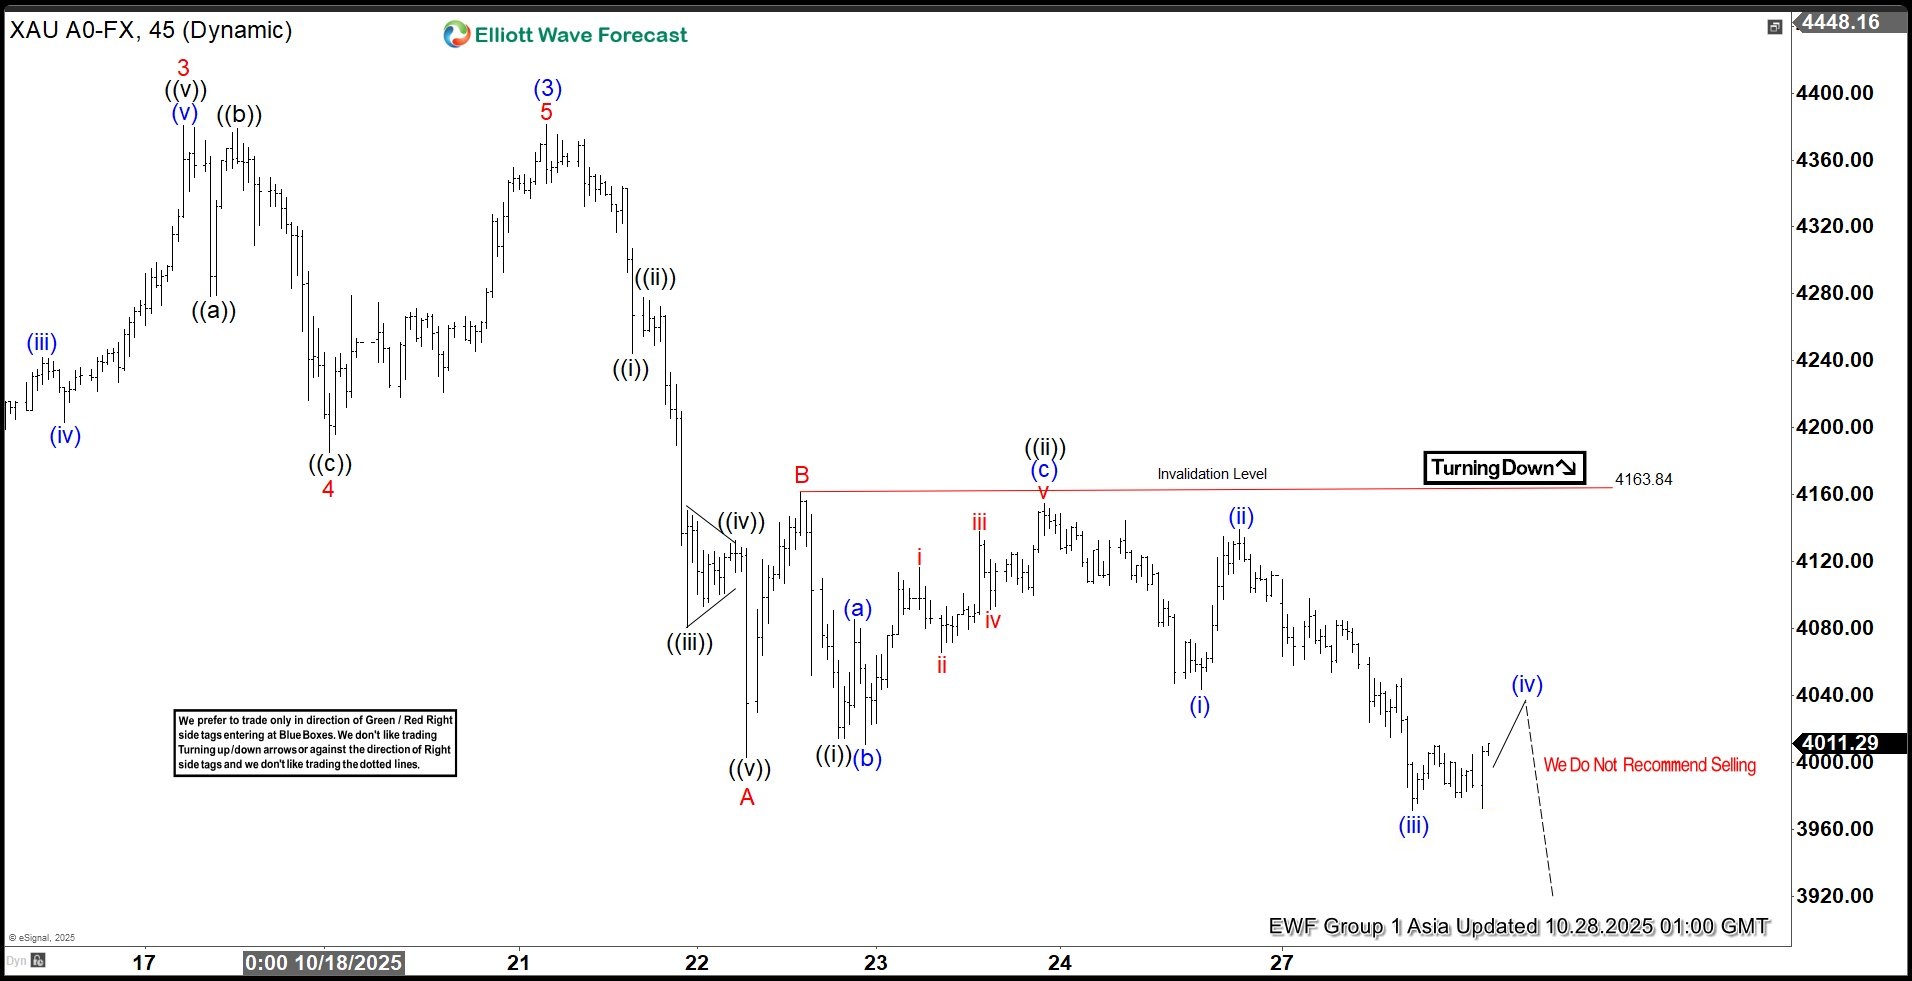
GOLD Elliott Wave 1 Hour Chart 10.28.2025
GOLD has broken the previous low at 4012.3, marked as A red on the chart. This break has made the swing sequences from the 4382.5 peak incomplete, confirming further downside extension. The commodity is potentially forming an Elliott Wave Zigzag pattern, due to the fact that the first leg shows a 5-wave structure. As long as the price holds below the 4163.8 peak, we can continue to expect lower prices within the C red leg, targeting the 3927–3865 area next
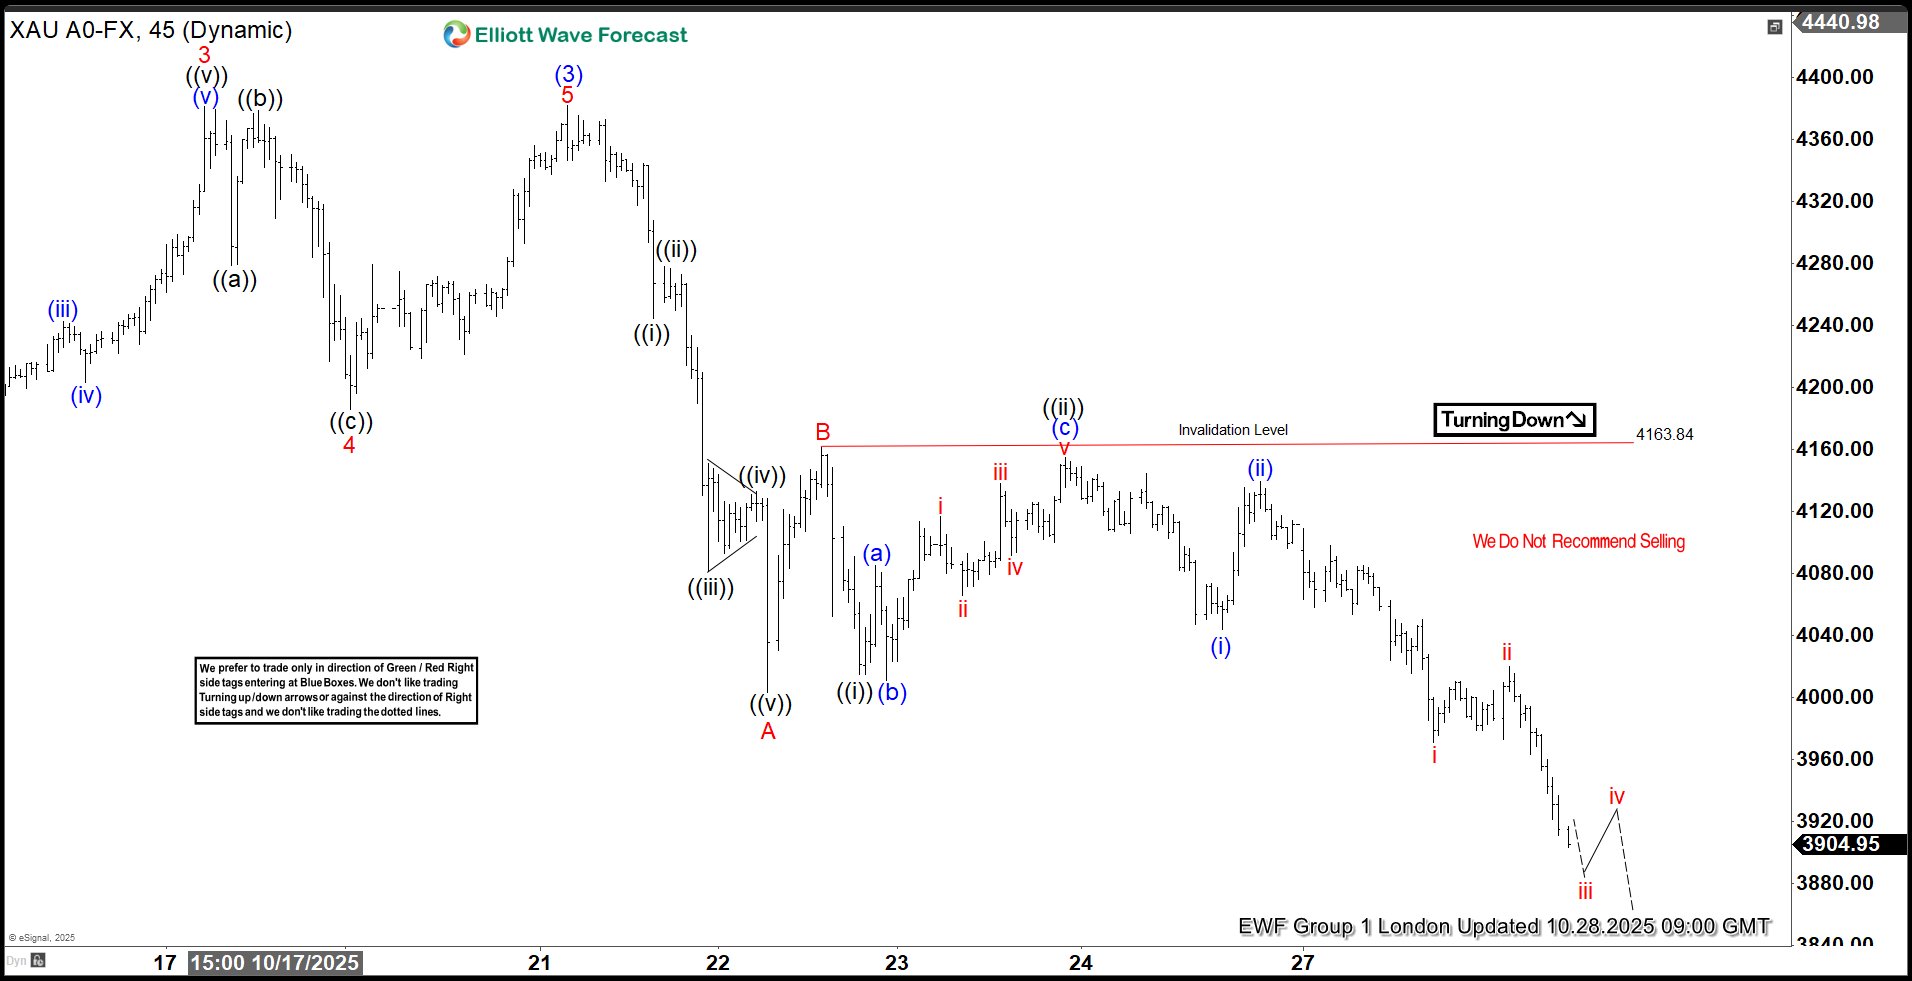
GOLD Elliott Wave 1 Hour Chart 10.28.2025
GOLD continued trading lower as expected. The first target area at 3927–3865 has been reached. The main target comes around the 3785 area, where we would like to be buyers again if it gets reached.
Crypto Market Confused About Who to Follow
Market Overview
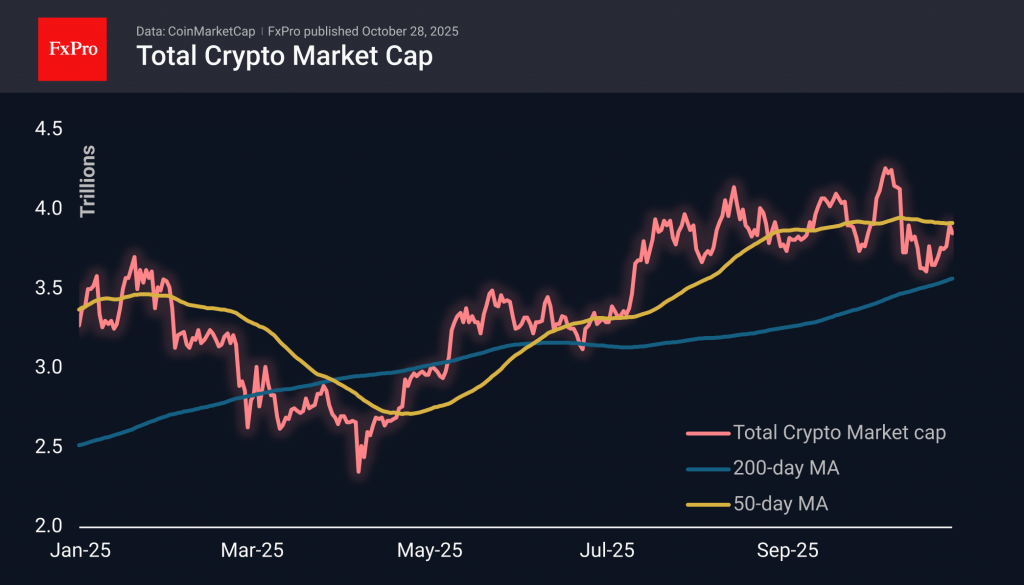
The crypto market cap fell by 1.7% to $3.85 trillion in 24 hours. External conditions are a mixture of new highs in stock indices and a rapid sell-off of gold, confusing cryptocurrency investors. The Trump coin is up about 10% daily, likely fuelled by negotiations in Asia. Zcash, among the day’s outsiders, is down 9% but still showing 500% growth over 30 days.
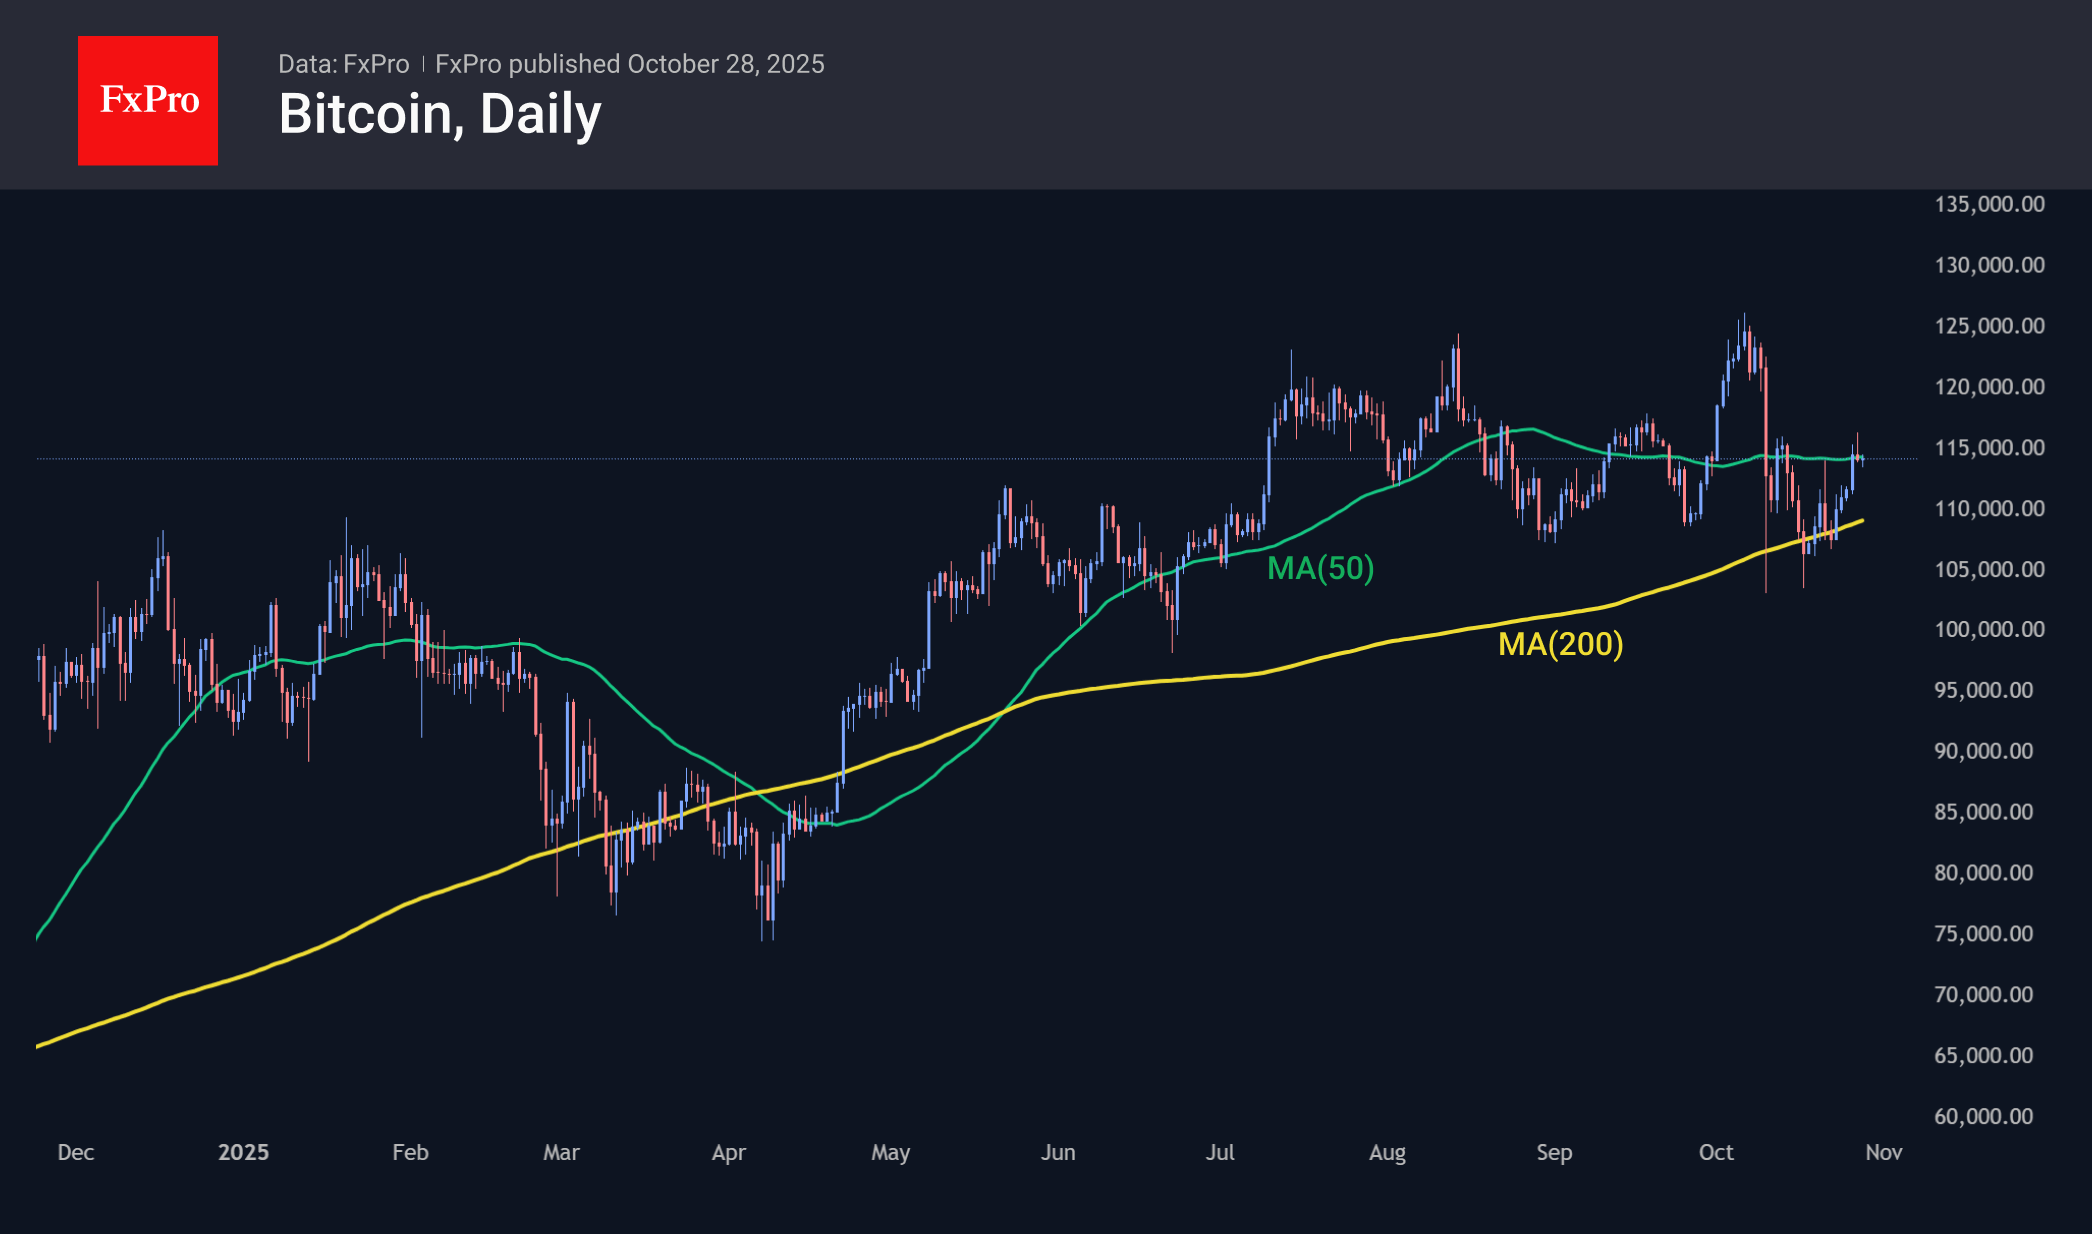
Bitcoin has fallen back to $114K, remaining stuck to the 50-day moving average. At the start of the week, there was an attempt to break out of the range defined by the 50- and 200-day moving averages. The price pullback at the end of Monday does not allow us to declare victory for the bulls. If Bitcoin is still digital gold, this is bad news for buyers.
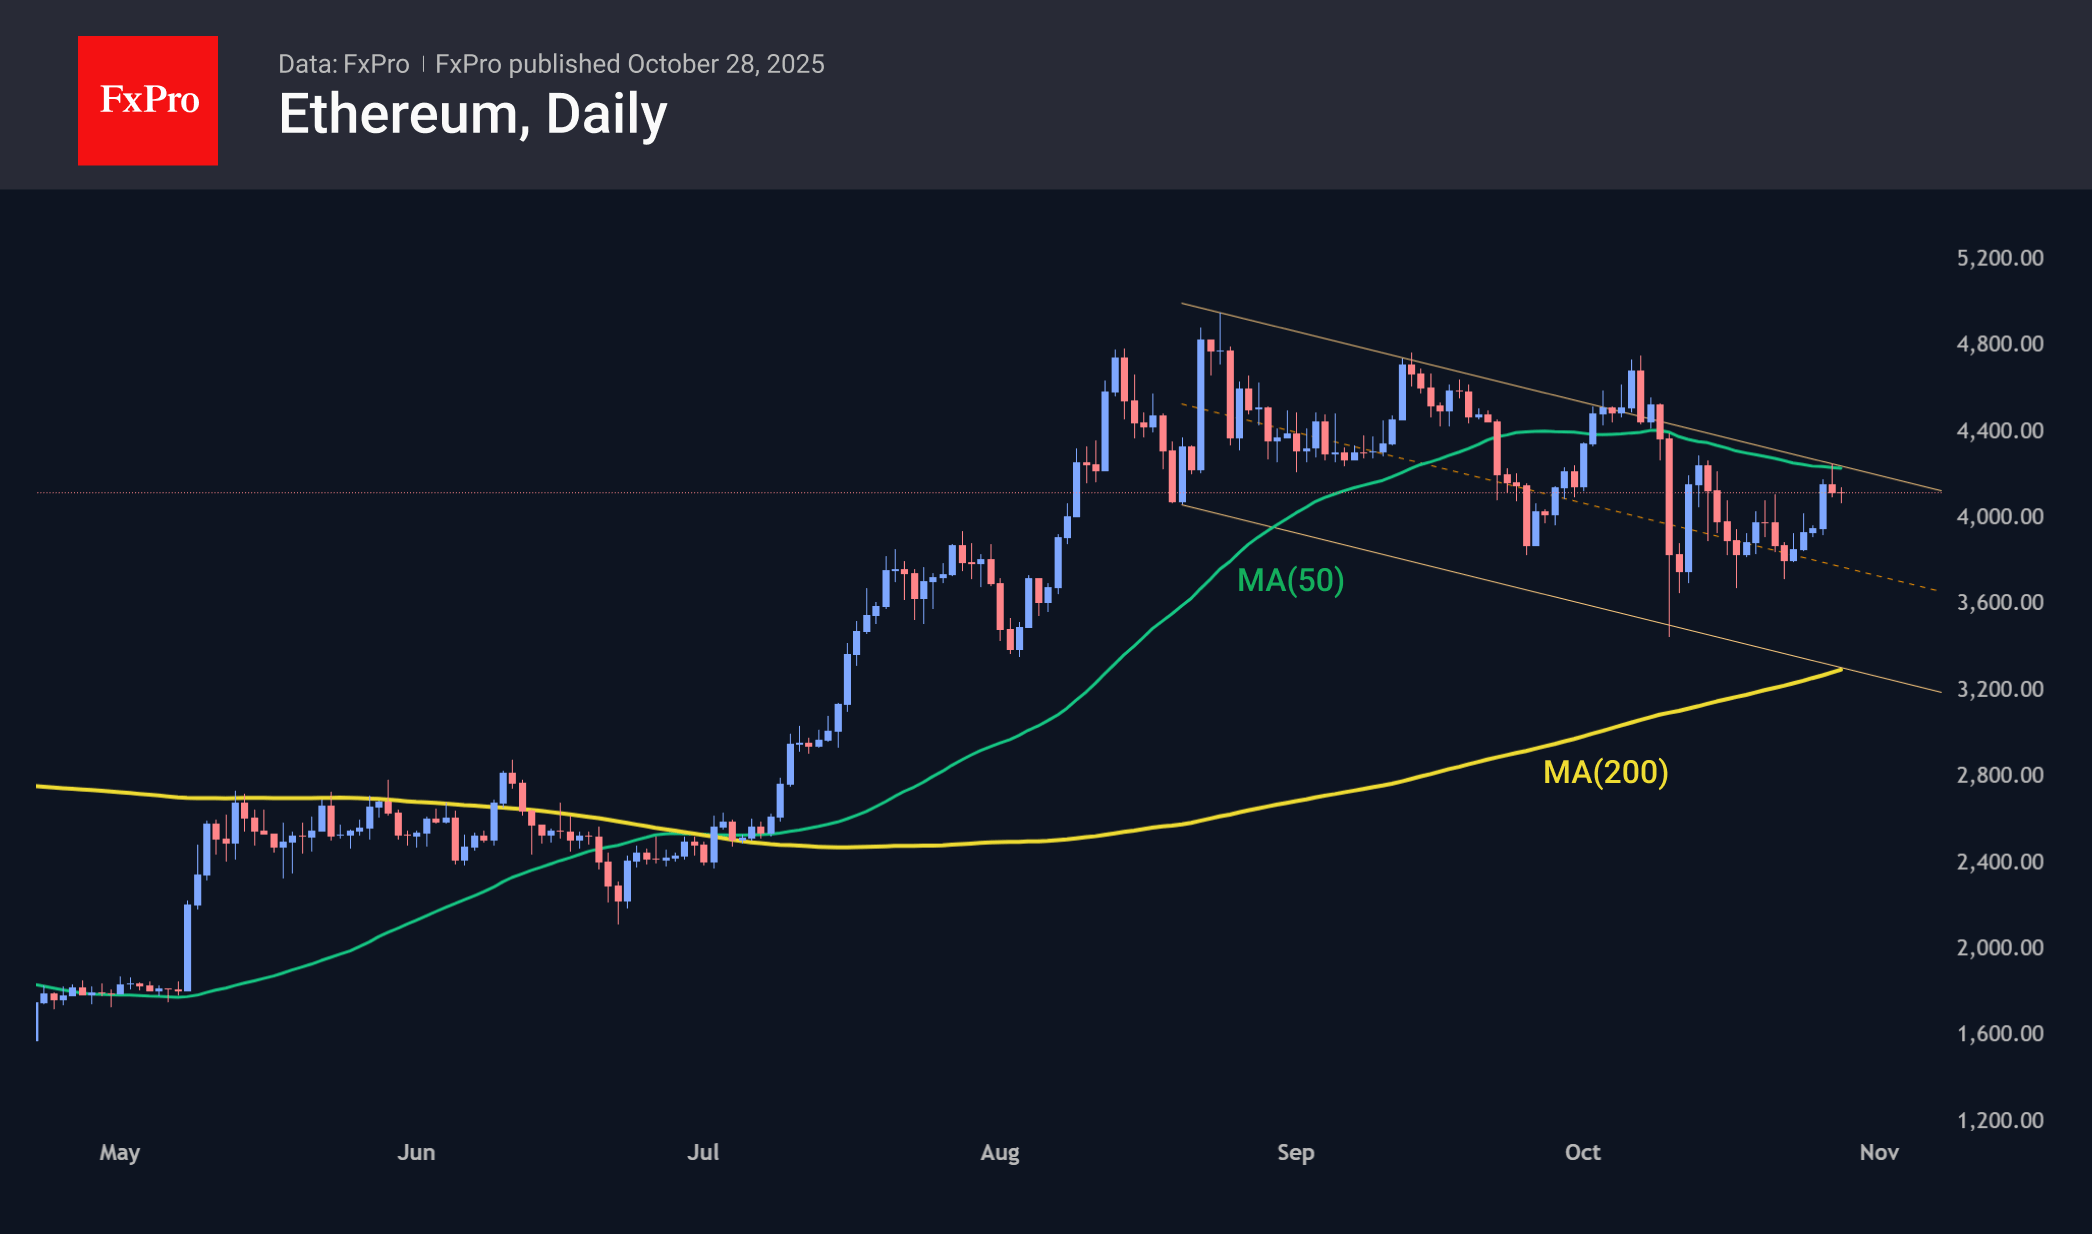
Ethereum is trading near $4,100. Attempts to break above $4,200 and overcome resistance in the form of the 50-day average on Monday were unsuccessful. Since August, ETHUSD has been on a downward trend with lower local lows and highs. We can only discuss a break in this trend after it consolidates above $4,300.
News Background
According to CoinShares, global investment in crypto funds rose by $921 million last week after an outflow the week before. Investments in Bitcoin increased by $931 million, XRP by $84 million, and Solana by $29 million. Investments in Ethereum decreased by $169 million, and Sui by $9 million.
Bitcoin has returned above the short-term holders’ cost basis (STH-Cost Basis), which is a constructive signal for a bull market, according to Checkonchain.
Since mid-October, long-term investors have withdrawn about 62,000 BTC from their wallets. The growth in market supply could hinder Bitcoin’s rally in the absence of intense demand, according to Glassnode.
BitMine increased its reserves to 3.3 million ETH, buying 77,055 ETH over the past week. BitMine’s total cryptocurrency reserves reached $14.2 billion.
Strategy bought 390 BTC over the past week. The company now has 640,808 BTC on its balance sheet, with a total value of $47.44 billion at an average purchase price of $74,032.
The bankrupt crypto exchange Mt.Gox has postponed the deadline for payments to creditors from 31 October 2025 to 31 October 2026. This is the third postponement of payments, which were initially planned to be completed by 31 October 2023.
Gold Extends Its Decline Below the $4,000 Level
As the chart shows, the XAU/USD quote has fallen below $3,945 today — its lowest level since 6 October. The downward momentum is being driven by traders’ caution ahead of two key events:
→ the U.S. Federal Reserve’s upcoming interest rate decision;
→ the meeting between U.S. and Chinese leaders, which could help ease tensions between the world’s two largest economies.
Technical Analysis of the XAU/USD Chart
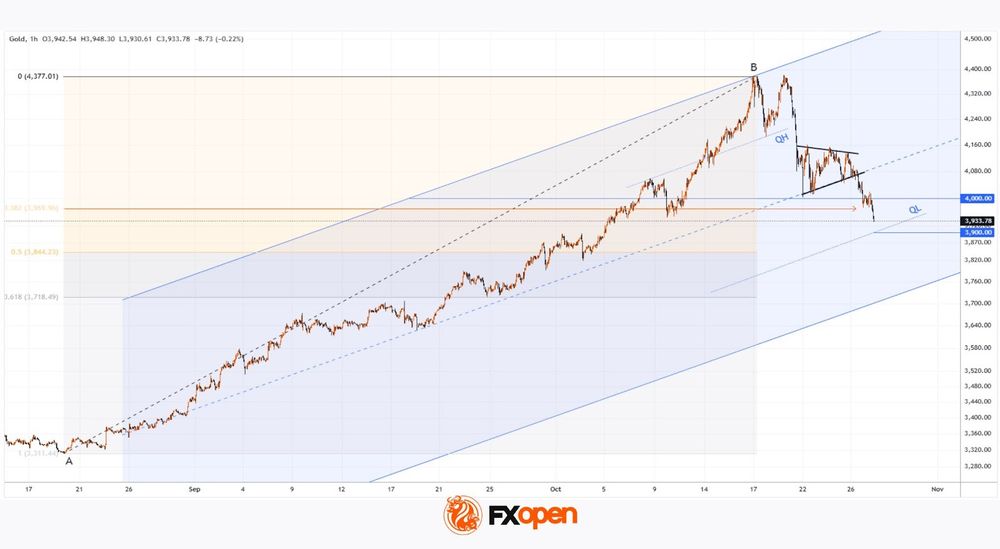
The ascending channel (shown in blue) illustrates gold’s remarkable rally from the 20 August low (point A):
→ throughout September, the median line acted as strong support;
→ the peak at point B coincided with the upper boundary of the channel;
→ the QH line — dividing the upper half into quarters — alternated between resistance and support.
The black lines mark the consolidation zone observed between 21 and 27 October:
→ its lower boundary aligns with the median;
→ the shape resembles a Symmetrical Triangle pattern, which has since been broken to the downside.
The chart highlights the confidence of sellers — bears managed to push prices through the key support area defined by:
→ the psychological $4,000 level;
→ the 0.382 Fibonacci retracement (indicated by the orange arrow).
The next potential target for the ongoing decline lies near the QL line, which coincides with the round-number level of $3,900. However, this may only serve as a temporary barrier before bears attempt to drive the price lower — towards the bottom boundary of the primary channel.
Start trading commodity CFDs with tight spreads. Open your trading account now or learn more about trading commodity CFDs with FXOpen.
This article represents the opinion of the Companies operating under the FXOpen brand only. It is not to be construed as an offer, solicitation, or recommendation with respect to products and services provided by the Companies operating under the FXOpen brand, nor is it to be considered financial advice.
Gold Rebounds to 4,000 USD Mark
Gold prices returned to the 4,000 USD per troy ounce mark on Tuesday, partially recovering from the previous day's 3.2% decline. The initial sell-off was triggered by encouraging developments in US-China trade negotiations.
According to officials, the two sides reached a framework agreement on tariffs and several key issues during talks in Malaysia. This paves the way for a final approval by the US and Chinese leaders at their upcoming meeting in South Korea later this week.
The metal found renewed support as investor attention shifted to the impending US Federal Reserve meeting. Markets are now pricing in a 25 basis point rate cut following the release of softer-than-anticipated inflation data, making this one of the most significant events in a week packed with risk.
Technical Analysis: XAU/USD
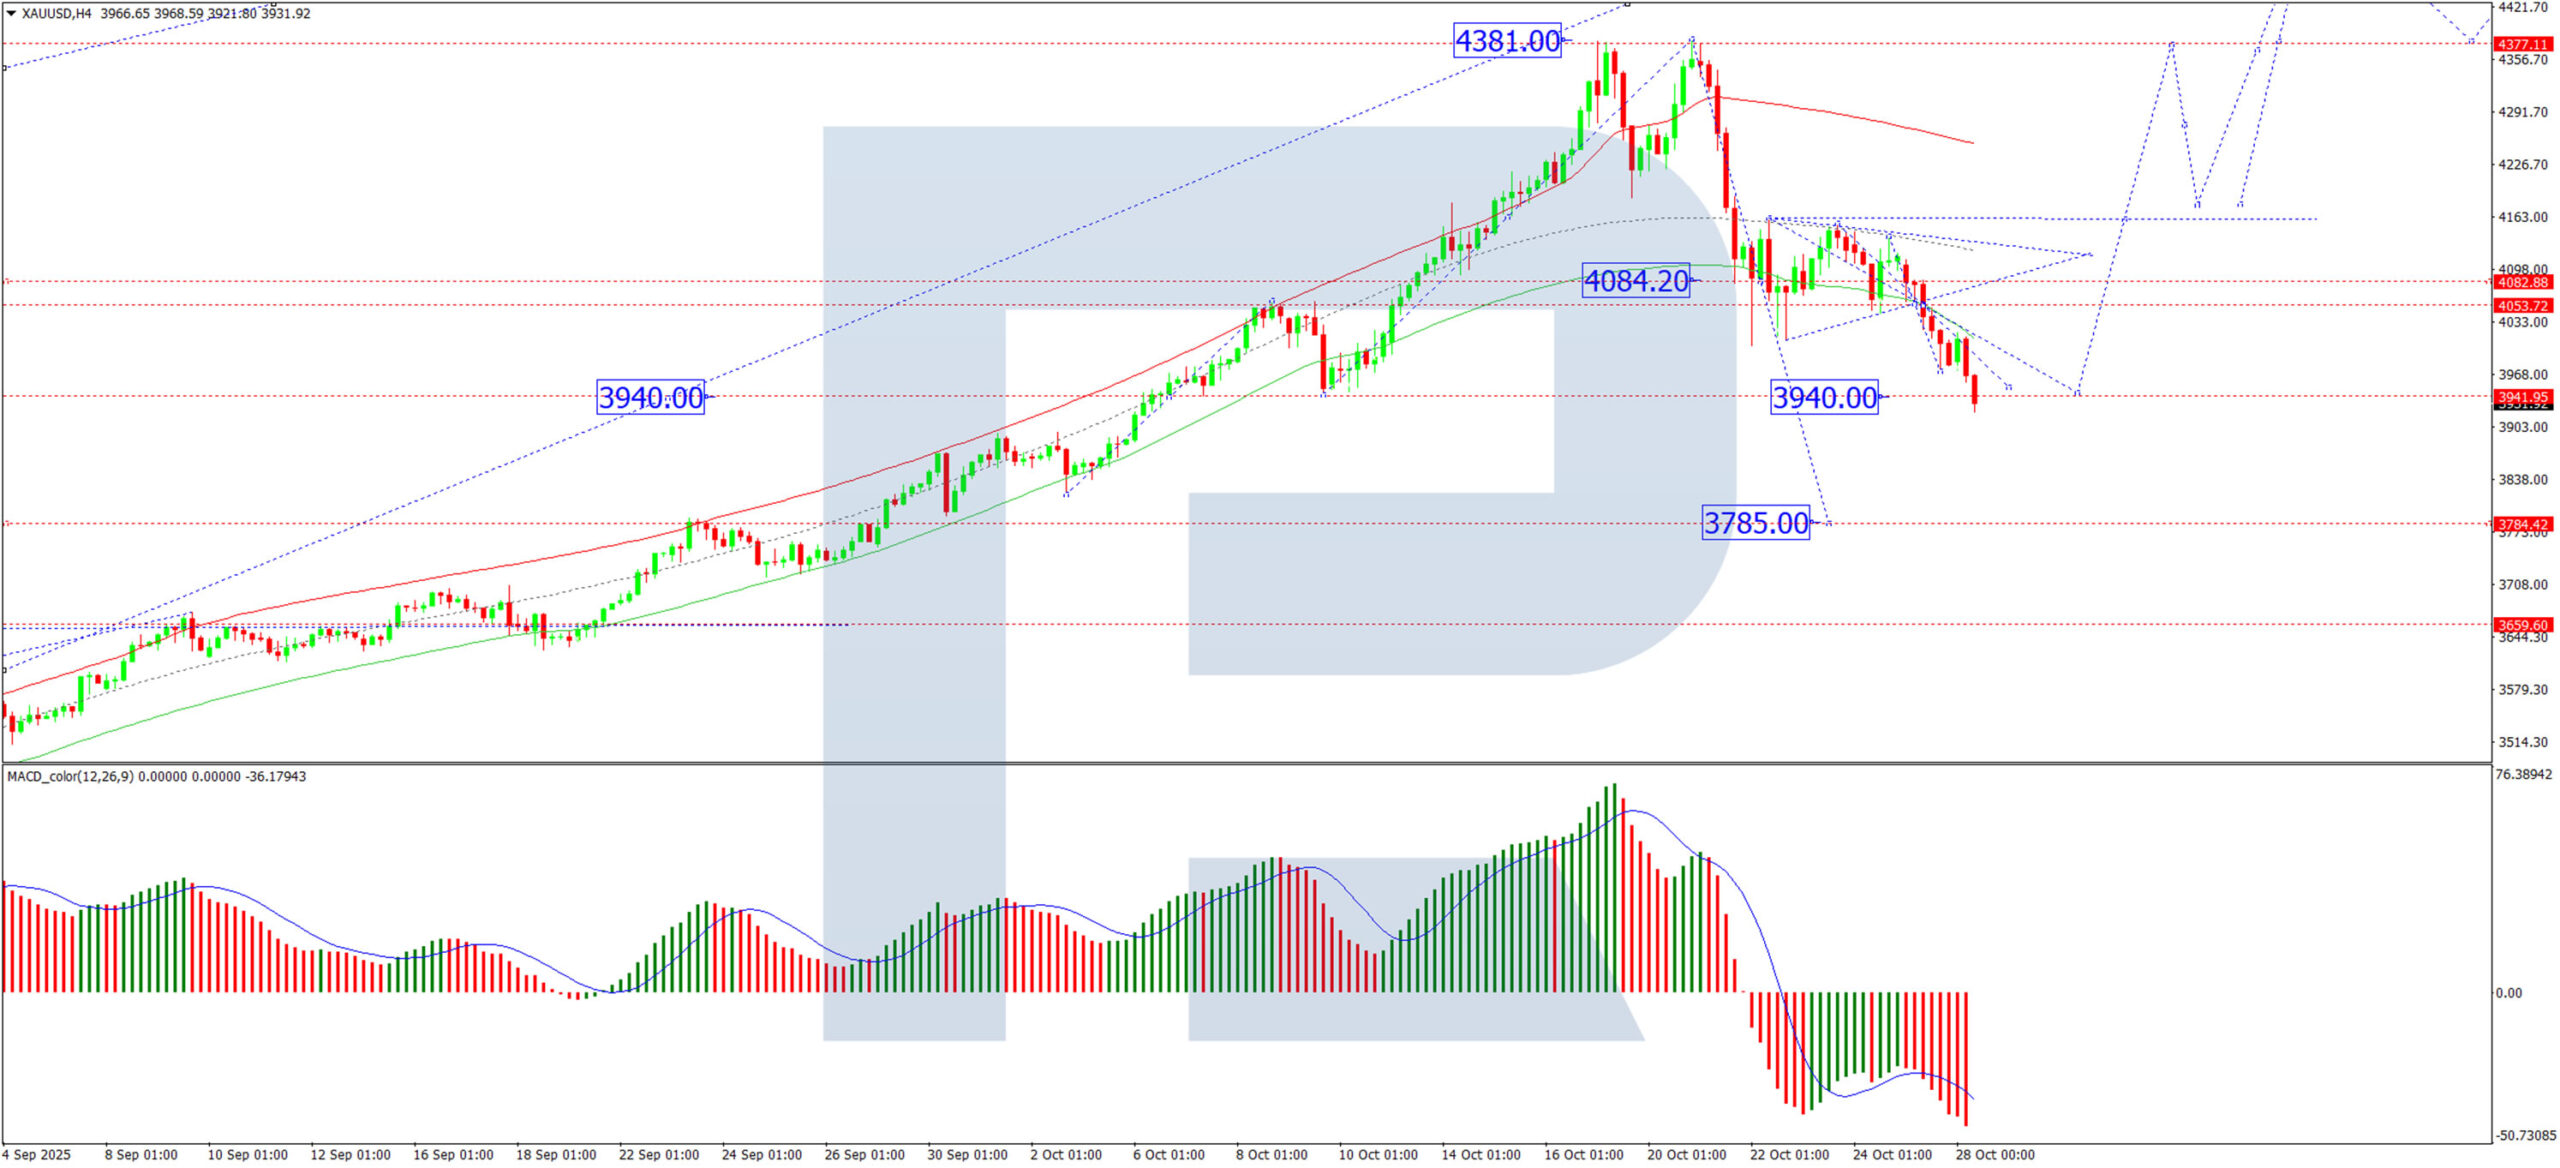
H4 Chart:
On the H4 chart, XAU/USD formed a consolidation range around 4,085 USD before breaking decisively to the downside. The market appears to be developing the second leg of this downward wave, with a subsequent target projected at 3,785 USD. This bearish near-term outlook is supported by the MACD indicator. Its signal line is pointing downward, and the histogram has moved into negative territory, suggesting the corrective phase is not yet complete.
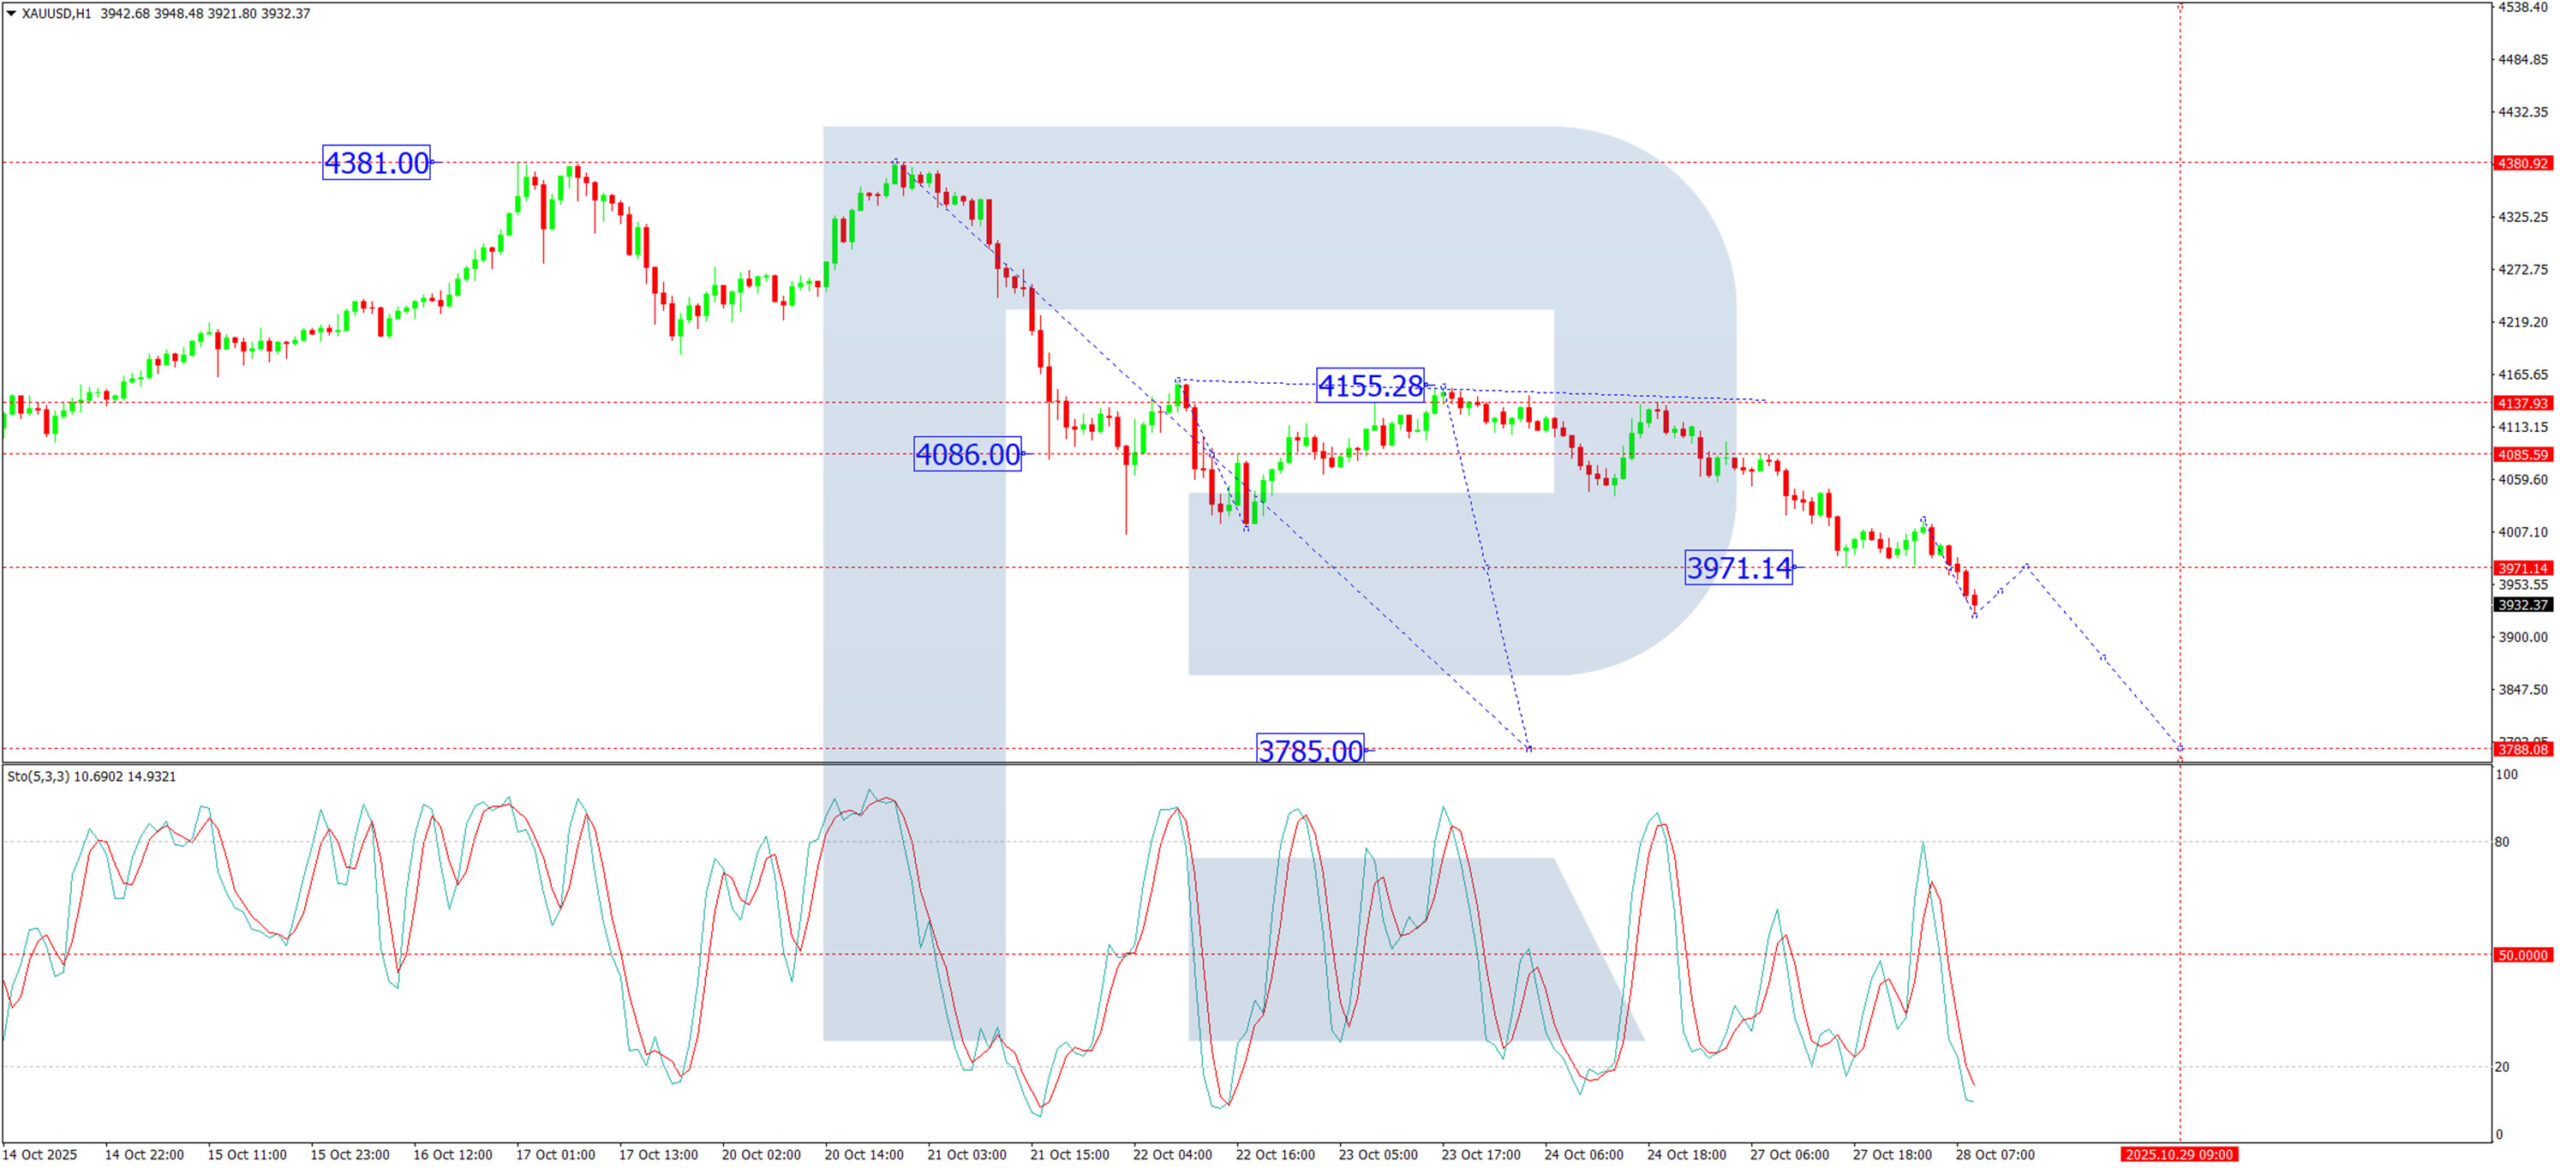
H1 Chart:
On the H1 chart, the pair is developing a downward structure toward 3,785 USD. A consolidation range has formed around 3,971 USD; a break below this level would signal a continuation of the decline toward the stated target. The Stochastic oscillator confirms this momentum, with its signal line positioned below 50 and trending downward toward 20, reflecting strengthening selling pressure.
Conclusion
While gold has rebounded on shifting expectations for Fed policy, the technical structure points to further potential downside. The primary focus for traders will be the Fed's decision, which will determine whether this current correction extends toward 3,785 USD or if the longer-term bullish trend can reassert itself.
ECB survey shows inflation expectations edge lower to 2.7%
The ECB’s September Consumer Expectations Survey showed a modest easing in near-term inflation expectations, with the median outlook for the next 12 months slipping to 2.7% from 2.8%.
Expectations for three years ahead were unchanged at 2.5%, while five-year projections held steady at 2.2%, suggesting longer-term views remain well anchored. Uncertainty around the 12-month outlook also stayed unchanged, indicating little shift in household sentiment.
On the growth side, consumers’ expectations for economic performance over the next year remained negative but stable, holding at –1.2%. The data continue to reflect subdued confidence in the near-term recover.
Unemployment expectations were similarly steady at 10.7% for the 12-month horizon, signaling limited change in labor-market sentiment.
USD/JPY Declines Amid Trump’s Visit to Japan
The Japanese yen strengthened on Monday, pushing the USD/JPY pair below the ¥152 mark. The move can be seen as a market reaction to U.S. President Donald Trump’s visit to Japan, where he met with the newly elected Prime Minister, Sanae Takaichi.
During the visit, the two leaders proclaimed a “new golden era” in U.S.–Japan relations and signed:
→ an official trade agreement introducing a 15% tariff on Japanese exports;
→ a deal on the supply of rare earth metals.
According to several media reports, Sanae Takaichi plans to nominate Donald Trump for the Nobel Peace Prize and invest around $550 billion in the U.S. economy.
Technical Analysis of the USD/JPY Chart
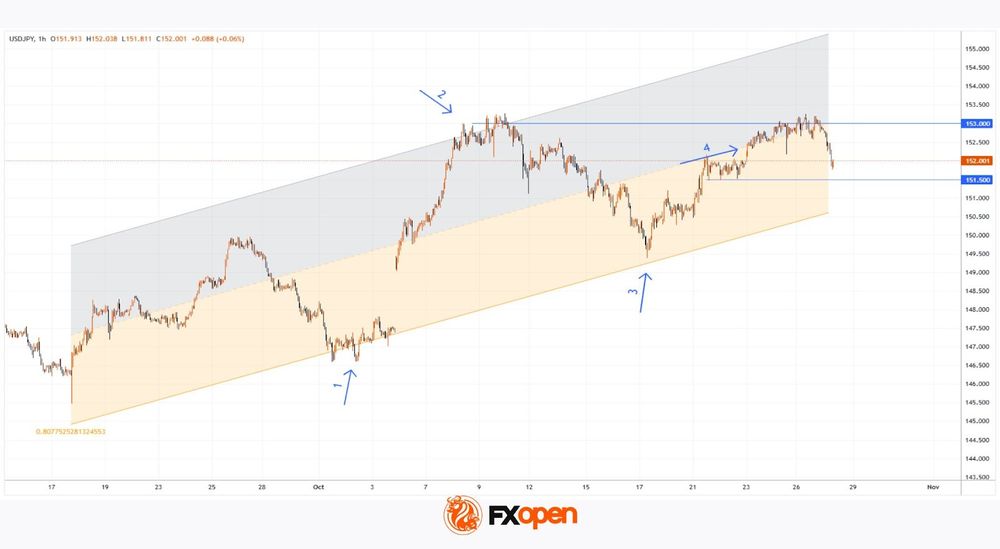
Applying a regression channel from the key low recorded on 17 September reveals a clear upward structure, which effectively illustrates major price movements (marked with arrows):
1 & 3 → rebounds from the lower boundary of the channel;
2 → reversal from the upper boundary;
4 → a consolidation phase near the median line, where supply and demand are balanced.
The latest decline from the median can be viewed as a sign of shifting sentiment, suggesting that sellers may now target the lower boundary of this channel. However:
→ the 151.50 level represents a notable support zone, having held firm on 21–22 October;
→ bearish conviction is also reinforced by the pair’s repeated failure to close above ¥153, forming what appears to be a Double Top pattern.
Whether the pair will reach the lower edge of the regression channel largely depends on the broader fundamental backdrop:
→ Trump’s international tour continues, with traders awaiting his meeting with China’s leadership;
→ this week’s key events include interest rate decisions from the Federal Reserve on Wednesday and the Bank of Japan on Thursday — the latter drawing particular attention given the recent change in Japan’s leadership.
These developments could significantly shift sentiment in the USD/JPY market — traders should be prepared for potential spikes in volatility.
Trade over 50 forex markets 24 hours a day with FXOpen. Take advantage of low commissions, deep liquidity, and spreads from 0.0 pips. Open your FXOpen account now or learn more about trading forex with FXOpen.
This article represents the opinion of the Companies operating under the FXOpen brand only. It is not to be construed as an offer, solicitation, or recommendation with respect to products and services provided by the Companies operating under the FXOpen brand, nor is it to be considered financial advice.
Little Overnight News to Sustain Risk Rally
Markets
Stock markets in Europe and the US soared to new record highs. Investors are banking on the US and China nearing a trade agreement, or at least an extension to the truce, after constructive talks last weekend. US president Trump and his Chinese counterpart Xi are expected to seal the deal during their in-person meeting on Thursday. The tech-heavy Nasdaq rallied 1.9%. The EuroStoxx50 had to settle for 0.6%. Core bond yields gapped higher at the open but pared losses going through the session. Net daily changes in the US varied between +0.9 (2-yr) to -4.1 bps (30-yr). The double US auction ($69bn 2-year and $70bn 5-yr) went without any hiccups. German rates finished flat to slightly lower at the very long end of the curve (-1.7 bps). Spreads across the euro area steadied, including in France, where the political atmosphere is growing tenser again. After a delayed vote on a wealth tax last Saturday, the Socialists are threatening to topple the government by the end of the week if there’s no significant tax increase on the wealthier segment in next year’s budget. The French parliament adopted an amendment yesterday that would increase taxes on the country’s largest companies but it’s yet unclear whether it suffices for the Socialist Party. The French topic has become an evergreen and an escalation could soon haunt the euro again. From a daily perspective, though, EUR/USD eked out another be it tiny gain for a fourth day straight. The pair rose to 1.1645. DXY turned south in technical irrelevant trading. The Aussie dollar outperformed global peers.
There’s little overnight news to sustain the risk rally, causing it to fizzle. It also makes sense against the backdrop of important central bank policy meetings from the Fed, ECB and BoJ, Q3 GDP and October inflation numbers in the euro area and five big US companies (accounting for about 25% of the S&P500) due to report earnings over the coming days. The eco calendar today has some interesting elements in store, even though they are most likely of secondary importance to trading. Consumer confidence (Conference Board) is on tap in the US. The Bank Lending Survey and Q3 negotiated wages are to be released for the euro area. Both are closely watched by the ECB but won’t change the expected rates status quo. We expected technical consideration to take over FI and FX trading. The Japanese yen stands out though. A combination of verbal warnings and a constructive meeting between Trump and Takaichi push USD/JPY towards 152. Some were worried ahead of the reunion that Japan’s increased defense spending efforts would have fallen short of US demands.
News & Views
By September 2025 year-to-date (YTD), new EU car registrations increased by 0.9% compared to the same period last year, marking the third consecutive month of growth. Recent momentum has been somewhat driven by the launch of new models, with September alone posting a strong 10% increase. The battery-electric car (BEV) market share held steady at 16.1% YTD (up from +13.1% YTD September 2024). Three of the four largest markets in the EU, accounting for 62% of BEV registrations, saw gains: Germany (+38.3%), Belgium (+12.4%), and the Netherlands (+3.9%). Hybrid-electric vehicles (HEV) remained the most popular power type choice among EU buyers (34.7%, up from 30.1%). The combined market share of petrol and diesel cars fell to 37%, down from 46.8% over the same period in 2024. The preferred power source of new car registrations in Belgium remains petrol (41.9% YTD 2025 vs 42.1% YTD 2024). Together with BEV’s (33.4% YTD 2025 share vs 27% YTD 2024) they account for over 75% of all new registrations.
The British Retail Consortium’s (BRC) shop price monitor showed retail prices falling by 0.3% M/M in October. It’s the first decline since March with both food (-0.4% M/M; largest drop since December 2020) and non-food prices (-0.2% M/M) falling. Lower food prices are important for the hawkish BoE members who warn for the outsized role they have in shaping inflation expectations. Last week’s official CPI numbers also showed lower food price growth (September) than feared. BRC CEO Dickinson highlighted fierce competition amongst retailers, widespread discounting and an easing of global sugar prices which helped to bring down prices of chocolate and confectionary ahead of Halloween. Some retailers already started promotions for electrical goods and beauty products before the Black Friday sales that typically fall in November. On an annual basis, overall retail price growth slowed from 1.4% Y/Y to 1% Y/Y with higher food prices (3.7% Y/Y) more than compensating for lower non-food prices (-0.4% Y/Y).
Not a Bubble Until It Bursts
Major global indices climbed yesterday — many to fresh all-time highs — on news that the US and China are inching closer to a trade deal that would prevent the two countries from imposing triple-digit tariffs on their mutual exports. Today, that optimism continues: talks between President Trump and Japan’s new Prime Minister, Sanae Takaichi, reportedly went very well, leading to an agreement on critical minerals trade. Trump praised Japan, calling this the “new golden age” for the US-Japan alliance. It could hardly have gone better.
On the Chinese front, investors are now bracing for a positive outcome as well. Yet fundamentally, the US and Chinese objectives remain difficult to align. The US wants to bring manufacturing back home — which comes at China’s expense — while also encouraging Beijing to spend more domestically, something Xi has tried and largely failed to achieve. As two Bloomberg journalists aptly wrote this morning, China’s latest five-year plan “appears to show Trump’s rebalancing dream to be — as far as Beijing is concerned — a fantasy.”
Still, personal rapport between the two leaders could help keep relations as stable as possible under the circumstances. But any trade deal is unlikely to mark an endgame or magically eliminate policy volatility under Trump. Fortunately, markets have acclimated to that since January. The S&P 500 hasn’t waited for perfect news to extend its rally to new highs — it’s been doing so since June — while Chinese and Hong Kong equities are clawing back past losses, led by tech names.
In Japan, the Nikkei on Monday crossed the 50’000 level for the first time in history, though we’re seeing some profit-taking this morning. But overall, the news flow remains supportive of risk-taking: trade deals with the US are lining up, the Federal Reserve (Fed) and the Bank of Canada (BoC) are both expected to cut rates this week, and the Bank of Japan (BoJ) outlook has turned softer under Takaichi.
What could go wrong? Time will tell — but for now, equity investors around the world are enjoying the rally, while safe-haven assets pull back. Gold, for instance, slipped below $4,000 per ounce, in what looks like a healthy correction after its exponential rally. The pullback could deepen by 10–20%, bringing prices back toward $3,400, the key 38.2% Fibonacci retracement of the past two-year surge. Above $3,400, gold’s uptrend remains intact, and bulls still have their eyes on $5,000.
Elsewhere in commodities, copper remains volatile but broadly positive, while US crude tested — but failed to clear — its 50-day moving average yesterday despite the trade optimism. Tactical bullish bets placed after last week’s sanctions against Rosneft and Lukoil are now being closed. There’s speculation the sanctions may prove less severe than initially feared, as Trump likely wants to avoid triggering a price spike. Add to that Saudi Arabia’s efforts to expand market share and expectations that OPEC will bring additional barrels to market, and the bears are likely to push for a return below $60 per barrel.
In FX, the US dollar retreated to a one-week low as the Fed began its two-day policy meeting. The central bank is widely expected to deliver a second 25-bp cut this year, amid growing speculation it may also announce an end to quantitative tightening (QT). Some suggest QT could end immediately, arguing that post-pandemic excess liquidity has now been fully absorbed and that the Fed wants to avoid draining it further. If that’s the case — if this week’s much-expected, fully priced-in rate cut is sweetened by the end of QT — equity bulls will have little reason to reverse the current rally. Short-term yields and the dollar would likely move lower.
Inside equities, AI and tech remain the centre of attention this week. While investors await Big Tech earnings on Wednesday and Thursday, Qualcomm stood out yesterday by announcing plans to launch new AI chips to compete with Nvidia and AMD in the rapidly expanding AI-chip market. Its AI200 and AI250 chips will hit the market next year, with Saudi Humane as its first customer. Nvidia and AMD could’ve felt queasy on the news — but no: both rose about 2.7–2.8%, as optimism spread that chip appetite keeps growing and there’s enough cake for everyone to have a generous slice. Qualcomm, meanwhile, jumped more than 20% intraday and closed the session roughly 11% higher.
In the coming days, we’ll find out Big Tech’s spending plans, which will directly affect chip-demand forecasts. Together, Amazon, Microsoft, Alphabet, and Meta are expected to have spent over $100 billion in Q3, most of it on chips and data centres. Bubble or not, the money is being spent, the rally is on — and it’s not a bubble until it bursts.