
Sample Category Title
USD/JPY Mid-Day Outlook
Daily Pivots: (S1) 152.45; (P) 152.76; (R1) 153.18; More...
Intraday bias in USD/JPY stays mildly on the upside for 153.26 and then 100% projection of 142.66 to 150.90 from 145.47 at 153.71. Firm break would extend the rise from 139.87 to 100% projection of 142.66 to 150.90 from 145.47 at 153.71. On the downside, below 152.25 minor support will turn intraday bias neutral again first.
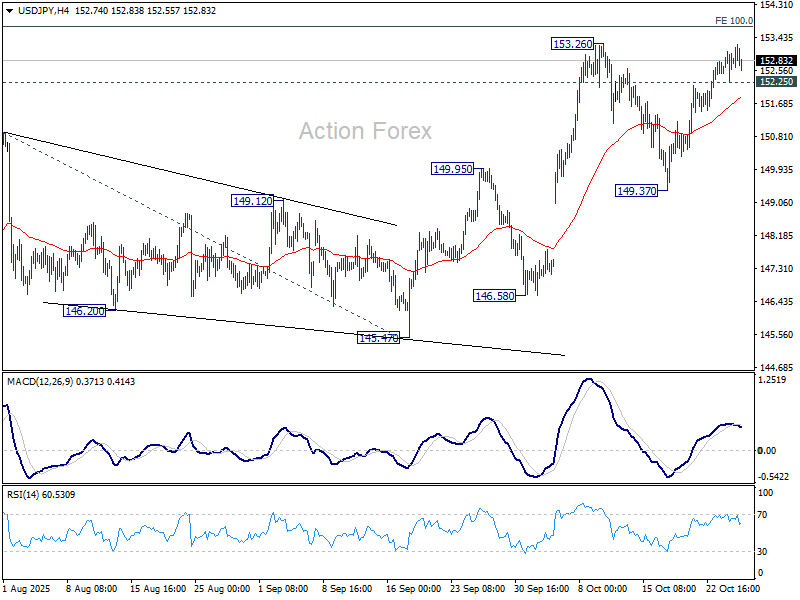
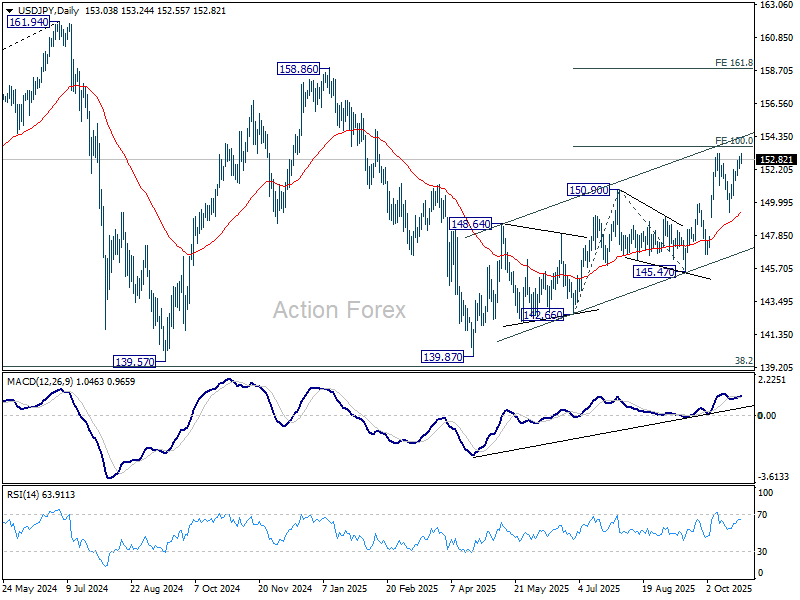
In the bigger picture, current development suggests that corrective pattern from 161.94 (2024 high) has completed with three waves at 139.87. Larger up trend from 102.58 (2021 low) could be ready to resume through 161.94 high. On the downside, break of 145.47 support will dampen this bullish view and extend the corrective pattern with another falling leg.
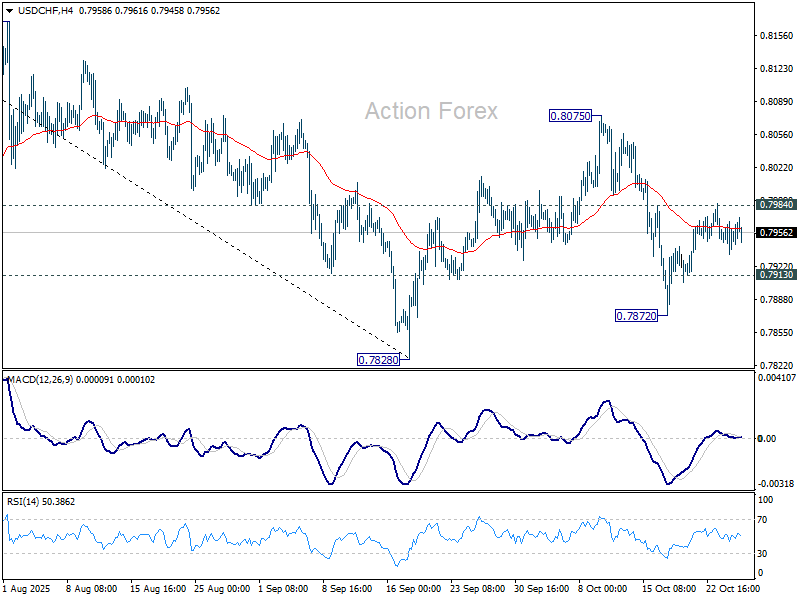
USD/CHF Mid-Day Outlook
Daily Pivots: (S1) 0.7939; (P) 0.7954; (R1) 0.7972; More…
Intraday bias in USD/CHF stays neutral as range trading continues. Deeper decline is still in favor with 0.7984 resistance intact. On the downside, below 0.7913 will turn bias to the downside for 0.7872 support, and then 0.7828 low. However, firm break of 0.7984 will suggest that corrective pattern from 0.7828 is extending with another rising leg, and target 0.8075 again.
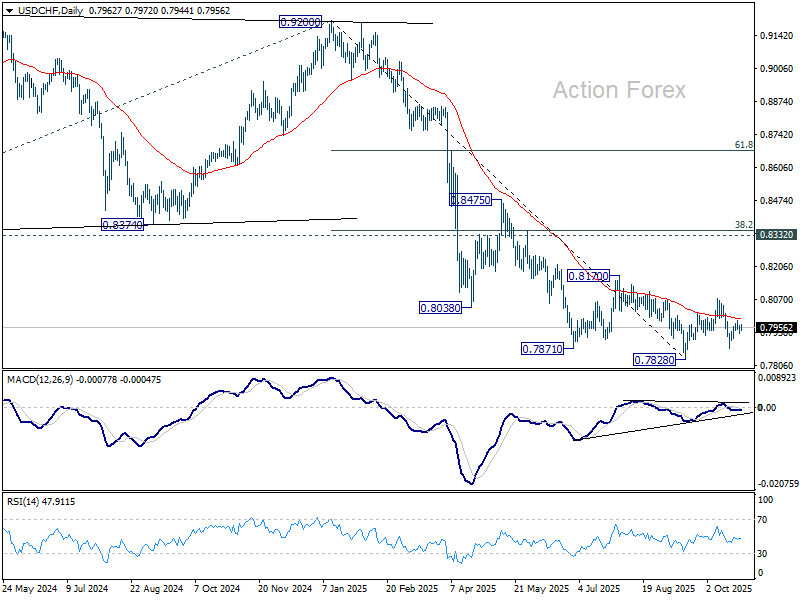
In the bigger picture, long term down trend from 1.0342 (2017 high) is still in progress. Next target is 100% projection of 1.0146 (2022 high) to 0.8332 from 0.9200 at 0.7382. In any case, outlook will stay bearish as long as 0.8332 support turned resistance holds (2023 low).
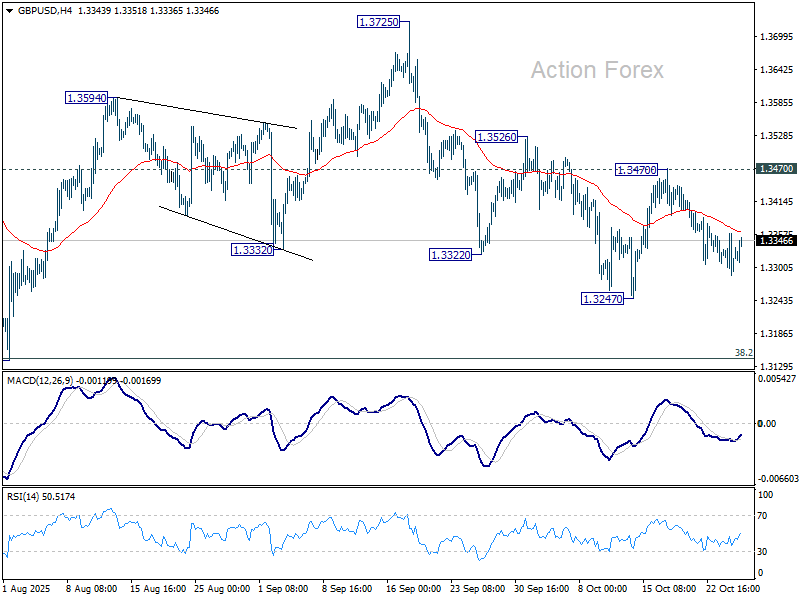
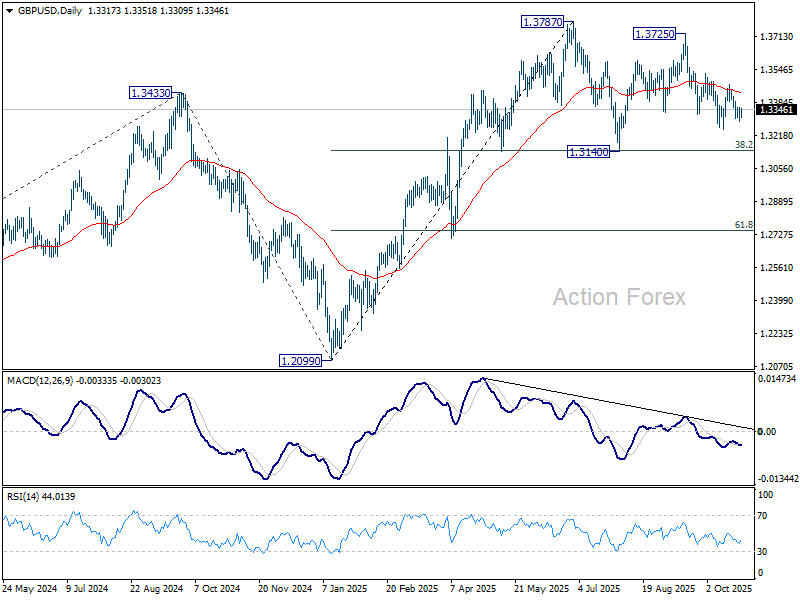
GBP/USD Mid-Day Outlook
Daily Pivots: (S1) 1.3280; (P) 1.3319; (R1) 1.3351; More...
GBP/USD is still bounded in range of 1.3247/3470 despite today's mild recovery. Intraday bias stays neutral for the moment. On the downside, break of 1.3247 will target 1.3140 cluster (38.2% retracement of 1.2099 to 1.3787 at 1.3142). Strong support is expected there to contain downside to complete the corrective pattern from 1.3787. On the upside, break of 1.3470 resistance will turn bias back to the upside for 1.3526, and then 1.3725/87 resistance zone.
In the bigger picture, rise from 1.0351 (2022 low) is still seen as a corrective move. Further rally could be seen to 61.8% projection of 1.0351 to 1.3433 (2024 high) from 1.2099 (2025 low) at 1.4004. But strong resistance could emerge from 1.4248 (2021 high) to limit upside. Sustained break of 55 W EMA (now at 1.3191) will argue that a medium term top has already formed and bring deeper fall back to 1.2099.
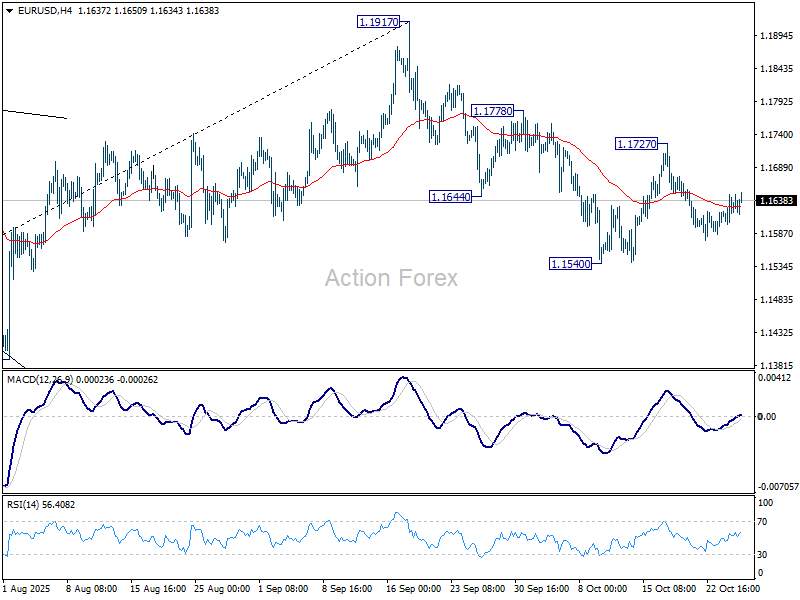
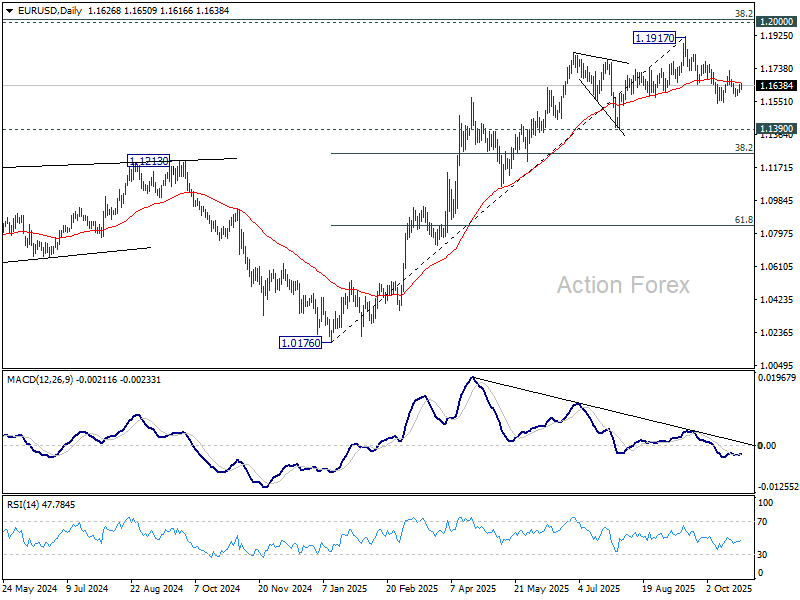
EUR/USD Mid-Day Outlook
Daily Pivots: (S1) 1.1603; (P) 1.1626; (R1) 1.1650; More…
EUR/USD recovers mildly today but remains bounded in range of 1.1540/1727. Intraday bias stays neutral and further decline is in favor. On the downside, below 1.1540 will resume the fall from 1.1917 and target 1.1390 support, or even further to 38.2% retracement of 1.0176 to 1.1917 at 1.1252. On the upside, though, break of 1.1727 resistance will turn bias back to the upside for 1.1778, and then retest of 1.1917 high instead.
In the bigger picture, considering bearish divergence condition in D MACD, a medium term top is likely in place at 1.1917, just ahead of 1.2 key psychological level. As long as 55 W EMA (now at 1.1301) holds, the up trend from 0.9534 (2022 low) is still expected to continue. Decisive break of 1.2000 will carry larger bullish implications. However, sustained trading below 55 W EMA will argue that rise from 0.9534 has completed as a three wave corrective bounce, and keep outlook bearish.
Dollar on Back Foot as Markets Cheer Prospects of US–China Tariff Truce
Optimism dominated Asian markets on Monday, with Japan’s Nikkei 225 surging to a fresh record high above the 50,000 mark. The risk-on tone carried through to U.S. futures, which pointed to another higher open as Wall Street looks set to continue its record-breaking run. In contrast, European markets lagged behind, trading mostly flat as regional investors adopted a more cautious stance.
The upbeat sentiment in Asia and the US was driven by renewed confidence that the U.S.–China trade conflict will avoid a fresh escalation. Reports suggested that the threatened 100% tariffs on Chinese goods, previously due to take effect on November 1, are now effectively off the table. This follows a weekend of constructive talks between top U.S. and Chinese trade officials that laid the groundwork for a broader framework agreement.
Investors are now looking ahead to Thursday’s highly anticipated meeting between U.S. President Donald Trump and Chinese President Xi Jinping at the APEC summit. The two leaders are expected to endorse the new framework, which reportedly includes a delay to China’s rare-earth export restrictions and the resumption of Chinese soybean purchases from the U.S. While the fate of the TikTok dispute remains uncertain, markets appear reassured that both sides are prioritizing de-escalation.
The tone from the weekend meetings was viewed as better than expected, reinforcing hopes that the trade truce will hold into next year. For now, traders are taking the view that a formal agreement between Trump and Xi would further cement global risk appetite and underpin equities, commodities, and pro-growth currencies.
In currency markets, Aussie remains the day’s top performer, followed by Kiwi and then Sterling. The Dollar is the weakest, trailed by Swiss franc and Yen, while Euro and Loonie sit mid-pack.
In Europe, at the time of writing, FTSE is up 0.12%. DAX is down -0.01%. CAC is down -0.12%. UK 10-year yield is down -0.01 at 4.425. Germany 10-year yield is up 0.007 at 2.635. Earlier in Asia, Nikkei rose 2.46%. Hong Kong HSI rose 1.05%. China Shanghai SSE rose 1.18%. Singapore Strait Times rose 0.41%. Japan 10-year JGB yield rose 0.015 to 1.674.
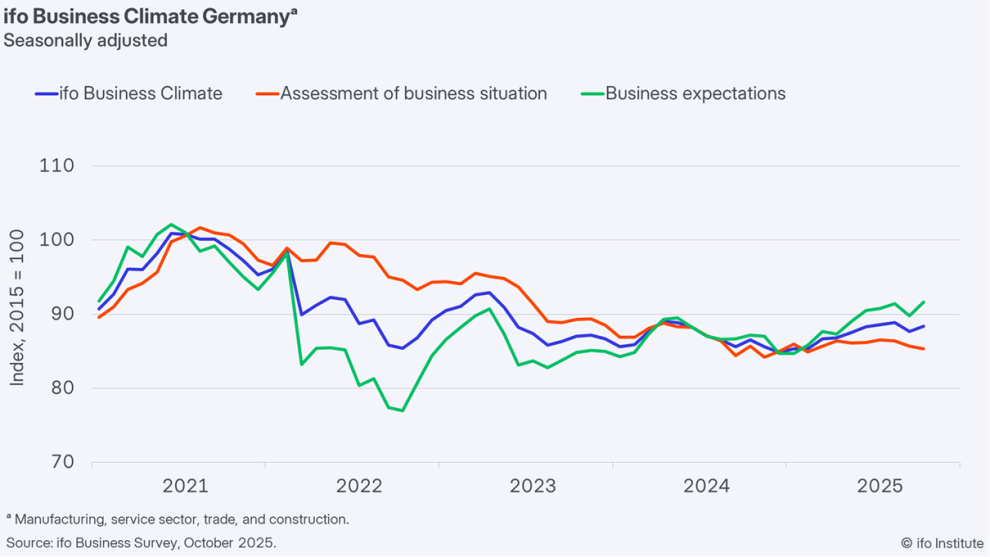
German Ifo rises to 88.4 as business expectations improve
Germany’s Ifo Business Climate Index rose to 88.4 in October from 87.7, topping expectations of 87.8. The uptick was driven mainly by stronger optimism about the outlook, even as assessments of current conditions softened. Expectations Index climbed to 91.6 from 89.8, while Current Assessment slipped to 85.3 from 85.7, highlighting that the recovery remains more hopeful than tangible.
By sector, the data painted a mixed but improving picture. Manufacturing sentiment strengthened from –13.2 to –11.7, with Ifo noting that “expectations in particular brightened” and the decline in new orders has “come to a halt.” The service sector saw a sharp rebound, rising from –3.0 to –0.1, as providers turned less skeptical about the coming months. Trade confidence also improved from –23.9 to –21.5, while construction slipped slightly from –14.8 to –15.0.
EUR/USD Mid-Day Outlook
Daily Pivots: (S1) 1.1603; (P) 1.1626; (R1) 1.1650; More…
EUR/USD recovers mildly today but remains bounded in range of 1.1540/1727. Intraday bias stays neutral and further decline is in favor. On the downside, below 1.1540 will resume the fall from 1.1917 and target 1.1390 support, or even further to 38.2% retracement of 1.0176 to 1.1917 at 1.1252. On the upside, though, break of 1.1727 resistance will turn bias back to the upside for 1.1778, and then retest of 1.1917 high instead.
In the bigger picture, considering bearish divergence condition in D MACD, a medium term top is likely in place at 1.1917, just ahead of 1.2 key psychological level. As long as 55 W EMA (now at 1.1301) holds, the up trend from 0.9534 (2022 low) is still expected to continue. Decisive break of 1.2000 will carry larger bullish implications. However, sustained trading below 55 W EMA will argue that rise from 0.9534 has completed as a three wave corrective bounce, and keep outlook bearish.
USD/JPY Tests Key February Highs
The USD/JPY pair rallied sharply on Monday, reaching the 153.00 level and testing levels not seen since February 2025. This bullish momentum is being driven by expectations of significant fiscal stimulus from Japan's new government and ongoing uncertainty surrounding the Bank of Japan's (BoJ) policy path.
The yen has been under sustained pressure since the election of Prime Minister Sanae Takaichi, whose administration is expected to pursue expansive fiscal spending while endorsing an accommodative monetary stance. Reports suggest a substantial stimulus package, valued at over ¥13.9 trillion, could be unveiled as early as November. The plan aims to support households and mitigate inflationary pressures.
While the BoJ is widely expected to keep interest rates unchanged at its meeting this week, market participants will be watching closely for any communication regarding the conditions for a future rate hike should inflationary pressures ease. Additionally, an upcoming meeting between Prime Minister Takaichi and US President Donald Trump is being monitored for further signals on the direction of Japan's economic policy.
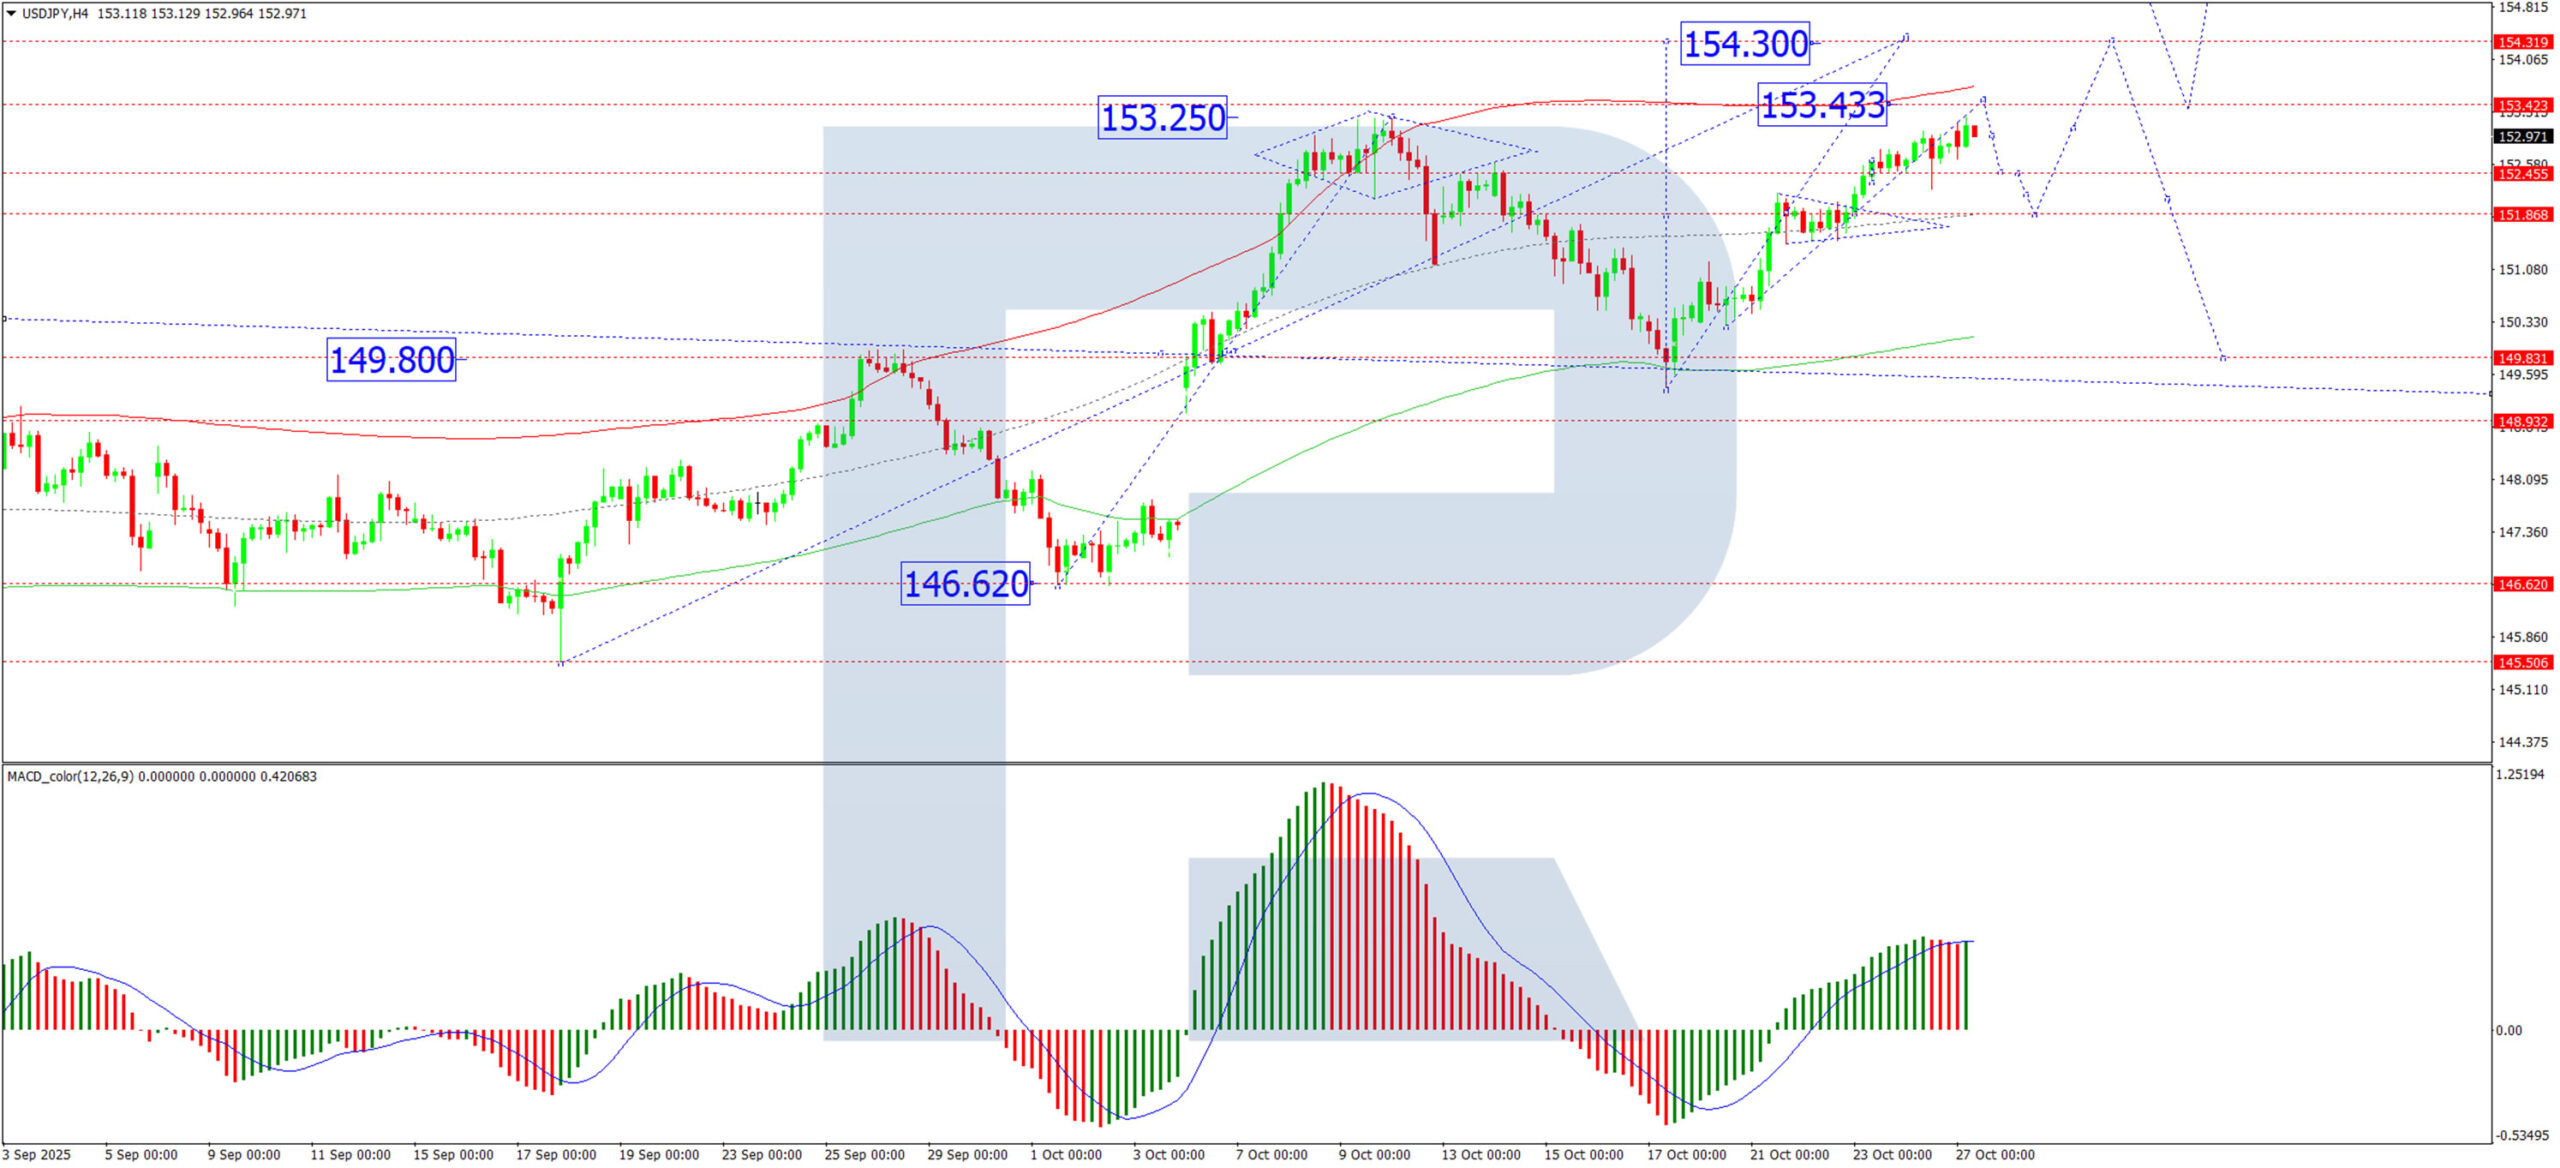
Technical Analysis: USD/JPY
H4 chart:
On the H4 chart, USD/JPY broke out upwards from a consolidation range around 151.80, confirming a renewed uptrend with an initial target at 153.43. The pair has since completed a leg higher to 153.24 and is now undergoing a technical retracement, currently testing the 152.43 level from above. We expect this pullback to be followed by another impulse higher towards the 153.43 target. Following that, a more pronounced correction towards 151.80 is anticipated before the broader uptrend resumes, with the next major objective at 154.33. The MACD indicator supports this outlook, with its signal line firmly above zero and pointing upwards, confirming sustained bullish momentum.
H1 chart:
The H1 chart shows the completion of an initial growth wave to 153.25. The immediate focus is on a further push to 153.33. Upon reaching this local target, a corrective decline to at least 152.43 is likely. Once this correction is complete, the next leg of the uptrend is projected to drive the pair towards 154.33. This scenario is technically confirmed by the Stochastic oscillator, whose signal line is above 50 and trending strongly towards 80, indicating that near-term bullish momentum remains intact.
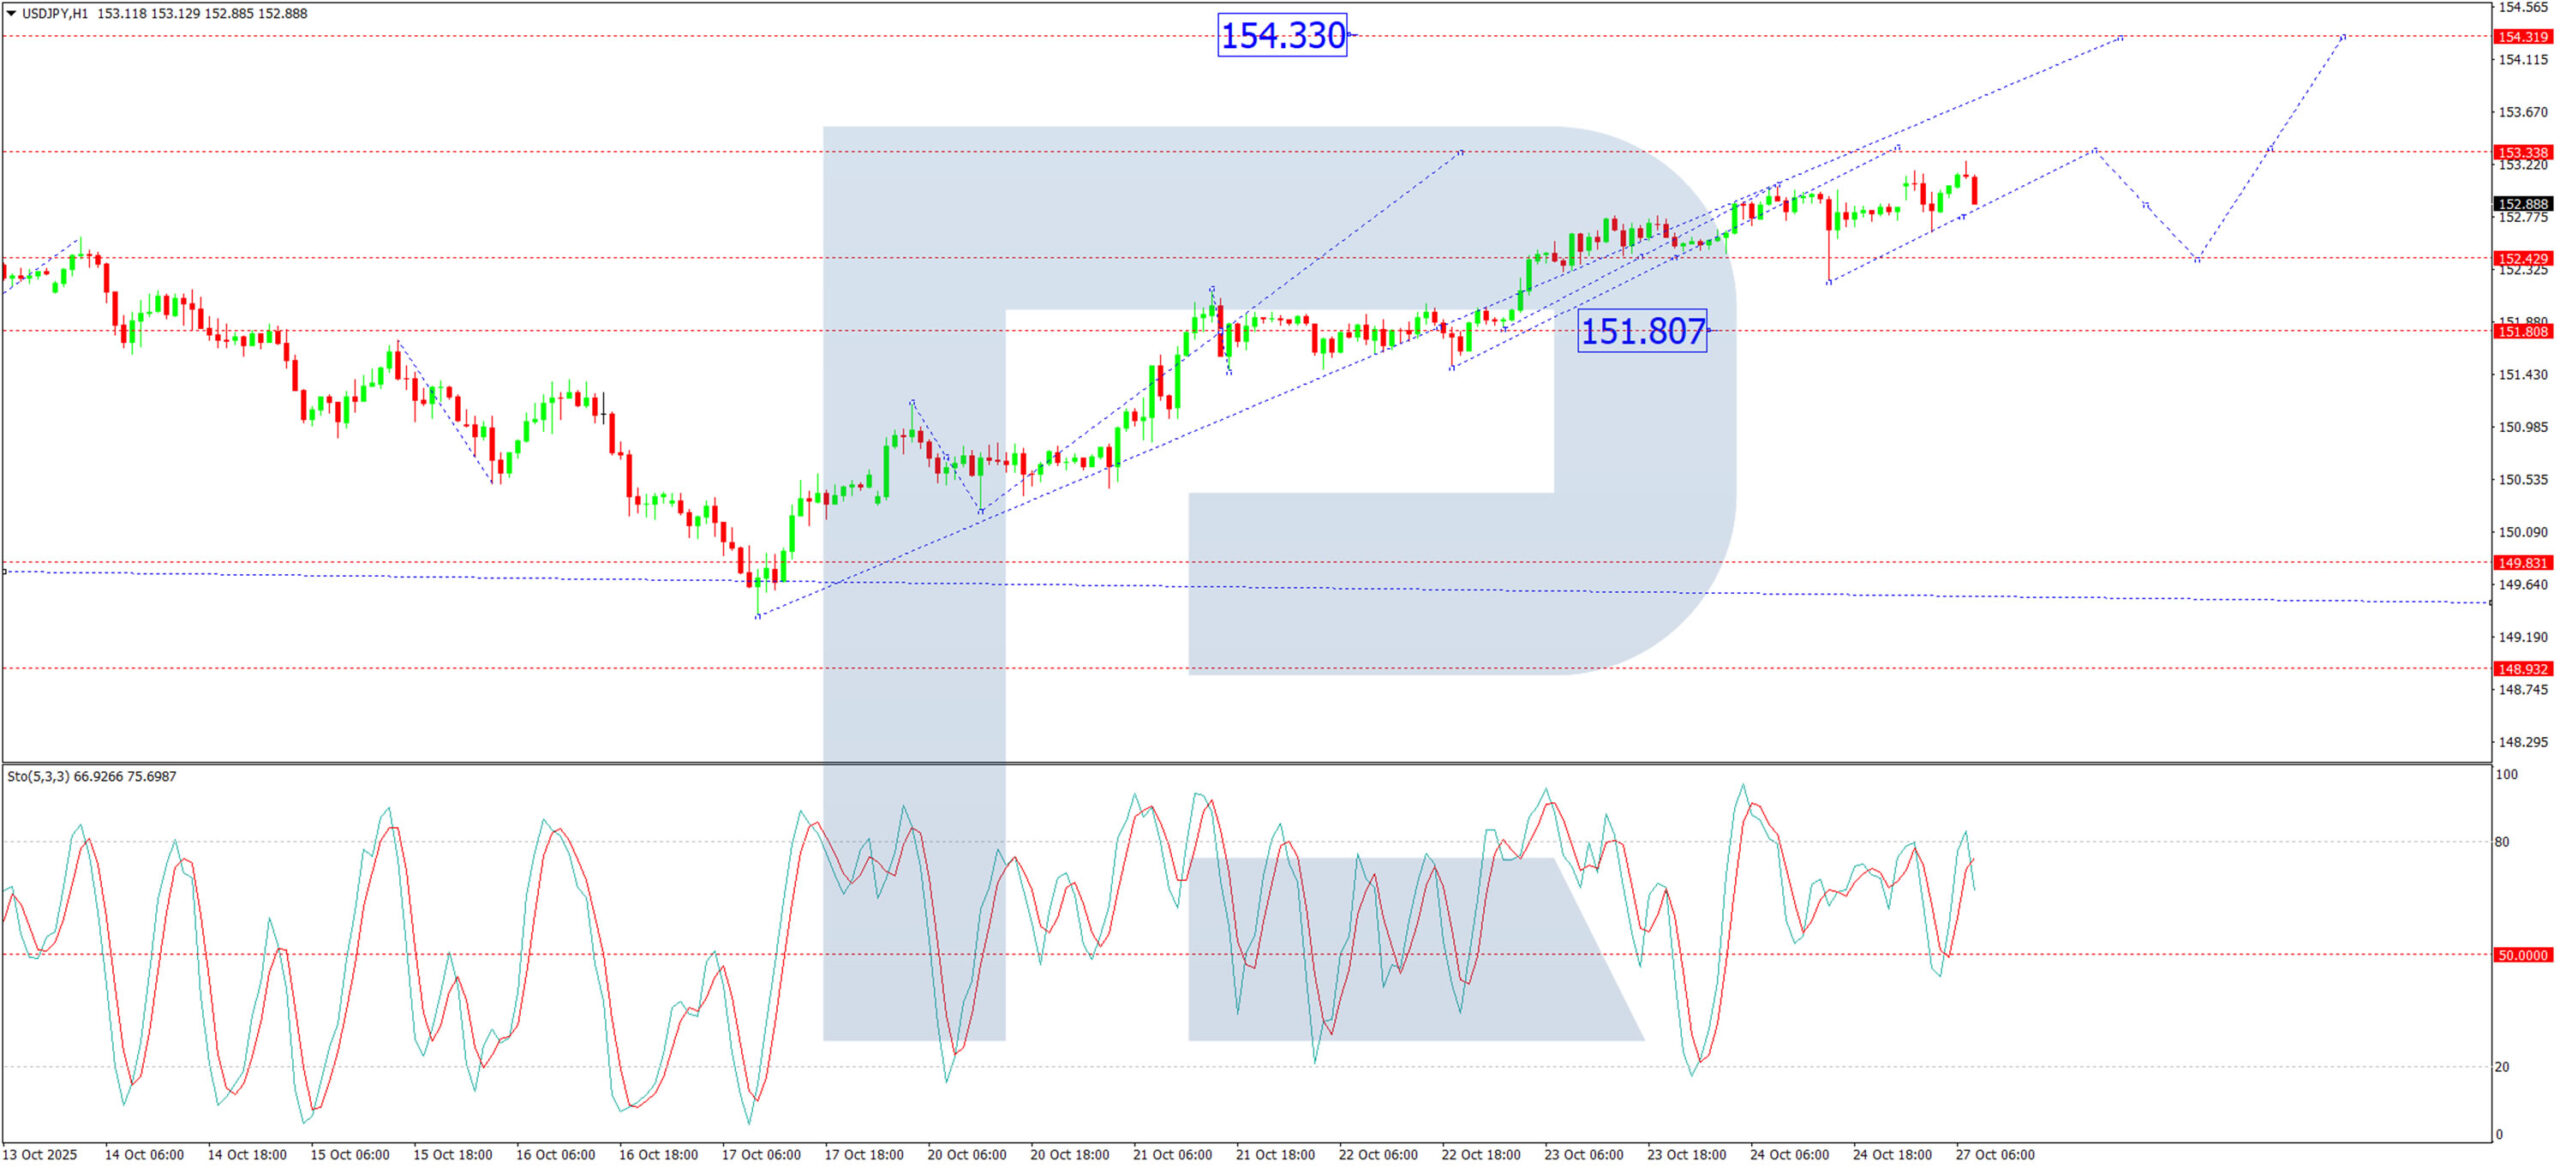
Conclusion
Fundamentally, the combination of anticipated Japanese fiscal stimulus and a steady BoJ continues to weigh on the yen, while technically, USD/JPY retains a constructive bullish bias. While a short-term correction is expected, the path of least resistance remains to the upside, with key targets at 153.43 and ultimately 154.33.
Nasdaq 100 Analysis: Index Reaches an All-Time High
As the chart shows, trading in the Nasdaq 100 (US Tech 100 mini on FXOpen) opened with a bullish gap today, with the price rising above the 25,600 mark for the first time in history.
The upbeat sentiment is being driven by:
→ expectations of a potential interest rate cut, with the Federal Reserve’s decision due on Wednesday;
→ the upcoming meeting between Chinese and U.S. leaders, where the presidents may announce a new trade agreement;
→ anticipation of quarterly earnings reports from major tech firms – Amazon (AMZN), Apple (AAPL), Microsoft (MSFT), Alphabet (GOOGL) and Meta Platforms (META) are all set to release results this week.
Technical Analysis of the Nasdaq 100 Chart
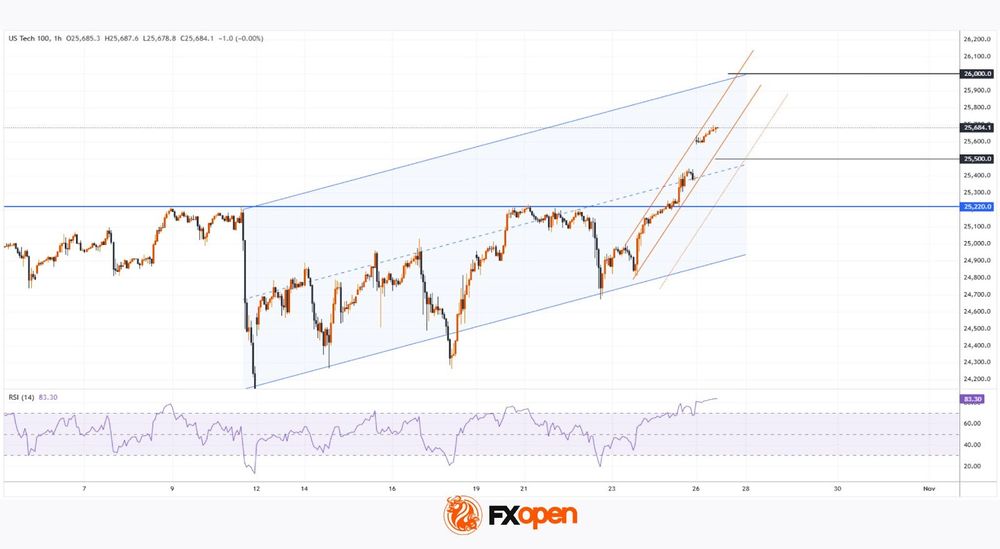
A closer look at the hourly Nasdaq 100 (US Tech 100 mini on FXOpen) chart, within the context of this month’s volatility, shows a steady recovery from the sharp drop on 10 October – the day President Trump suggested imposing 100% tariffs on Chinese goods.
The contours of that sell-off can now be used to outline an ascending channel, which neatly captures the market’s current price swings. Notably, today the index climbed into the upper half of that channel, overcoming resistance levels at:
→ the channel’s median line;
→ the 25,220 mark.
Since last Thursday’s low, the price has advanced by more than 3.5% – a strong rally – forming a steep upward trajectory (highlighted in orange). In this context:
→ the next potential target lies at the upper boundary of the blue channel, which would mark a new record high near 26,000 for the Nasdaq 100;
→ however, with RSI signalling overbought conditions, a short-term correction towards 25,500 would be a healthy development.
Should this week’s key events deliver the optimism investors are hoping for, the bulls may well succeed in reaching those ambitious targets.
Trade global index CFDs with zero commission and tight spreads. Open your FXOpen account now or learn more about trading index CFDs with FXOpen.
This article represents the opinion of the Companies operating under the FXOpen brand only. It is not to be construed as an offer, solicitation, or recommendation with respect to products and services provided by the Companies operating under the FXOpen brand, nor is it to be considered financial advice.
Crypto Has Positively Shaken Off Its Fears
Market Overview
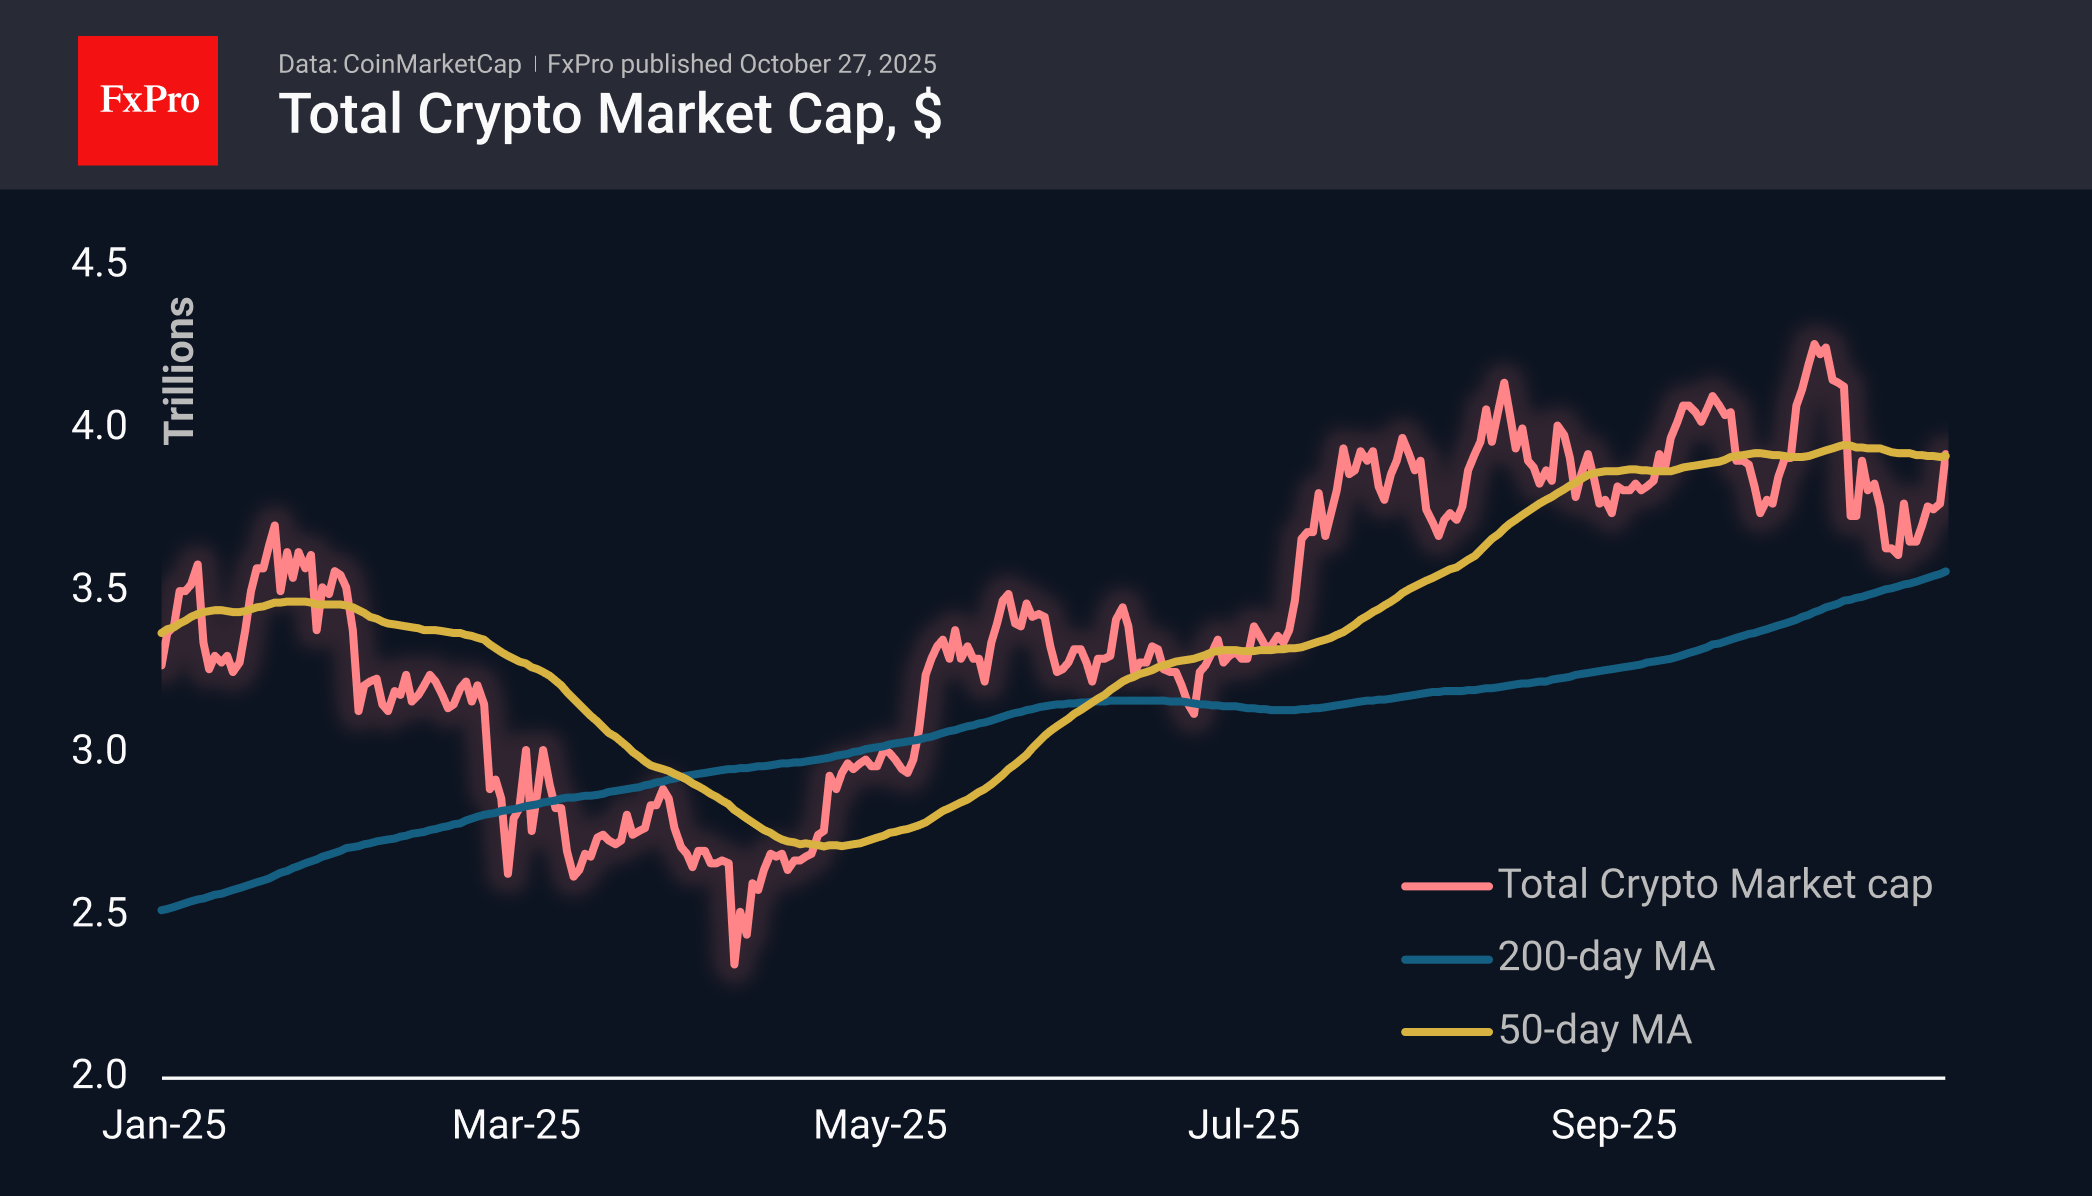
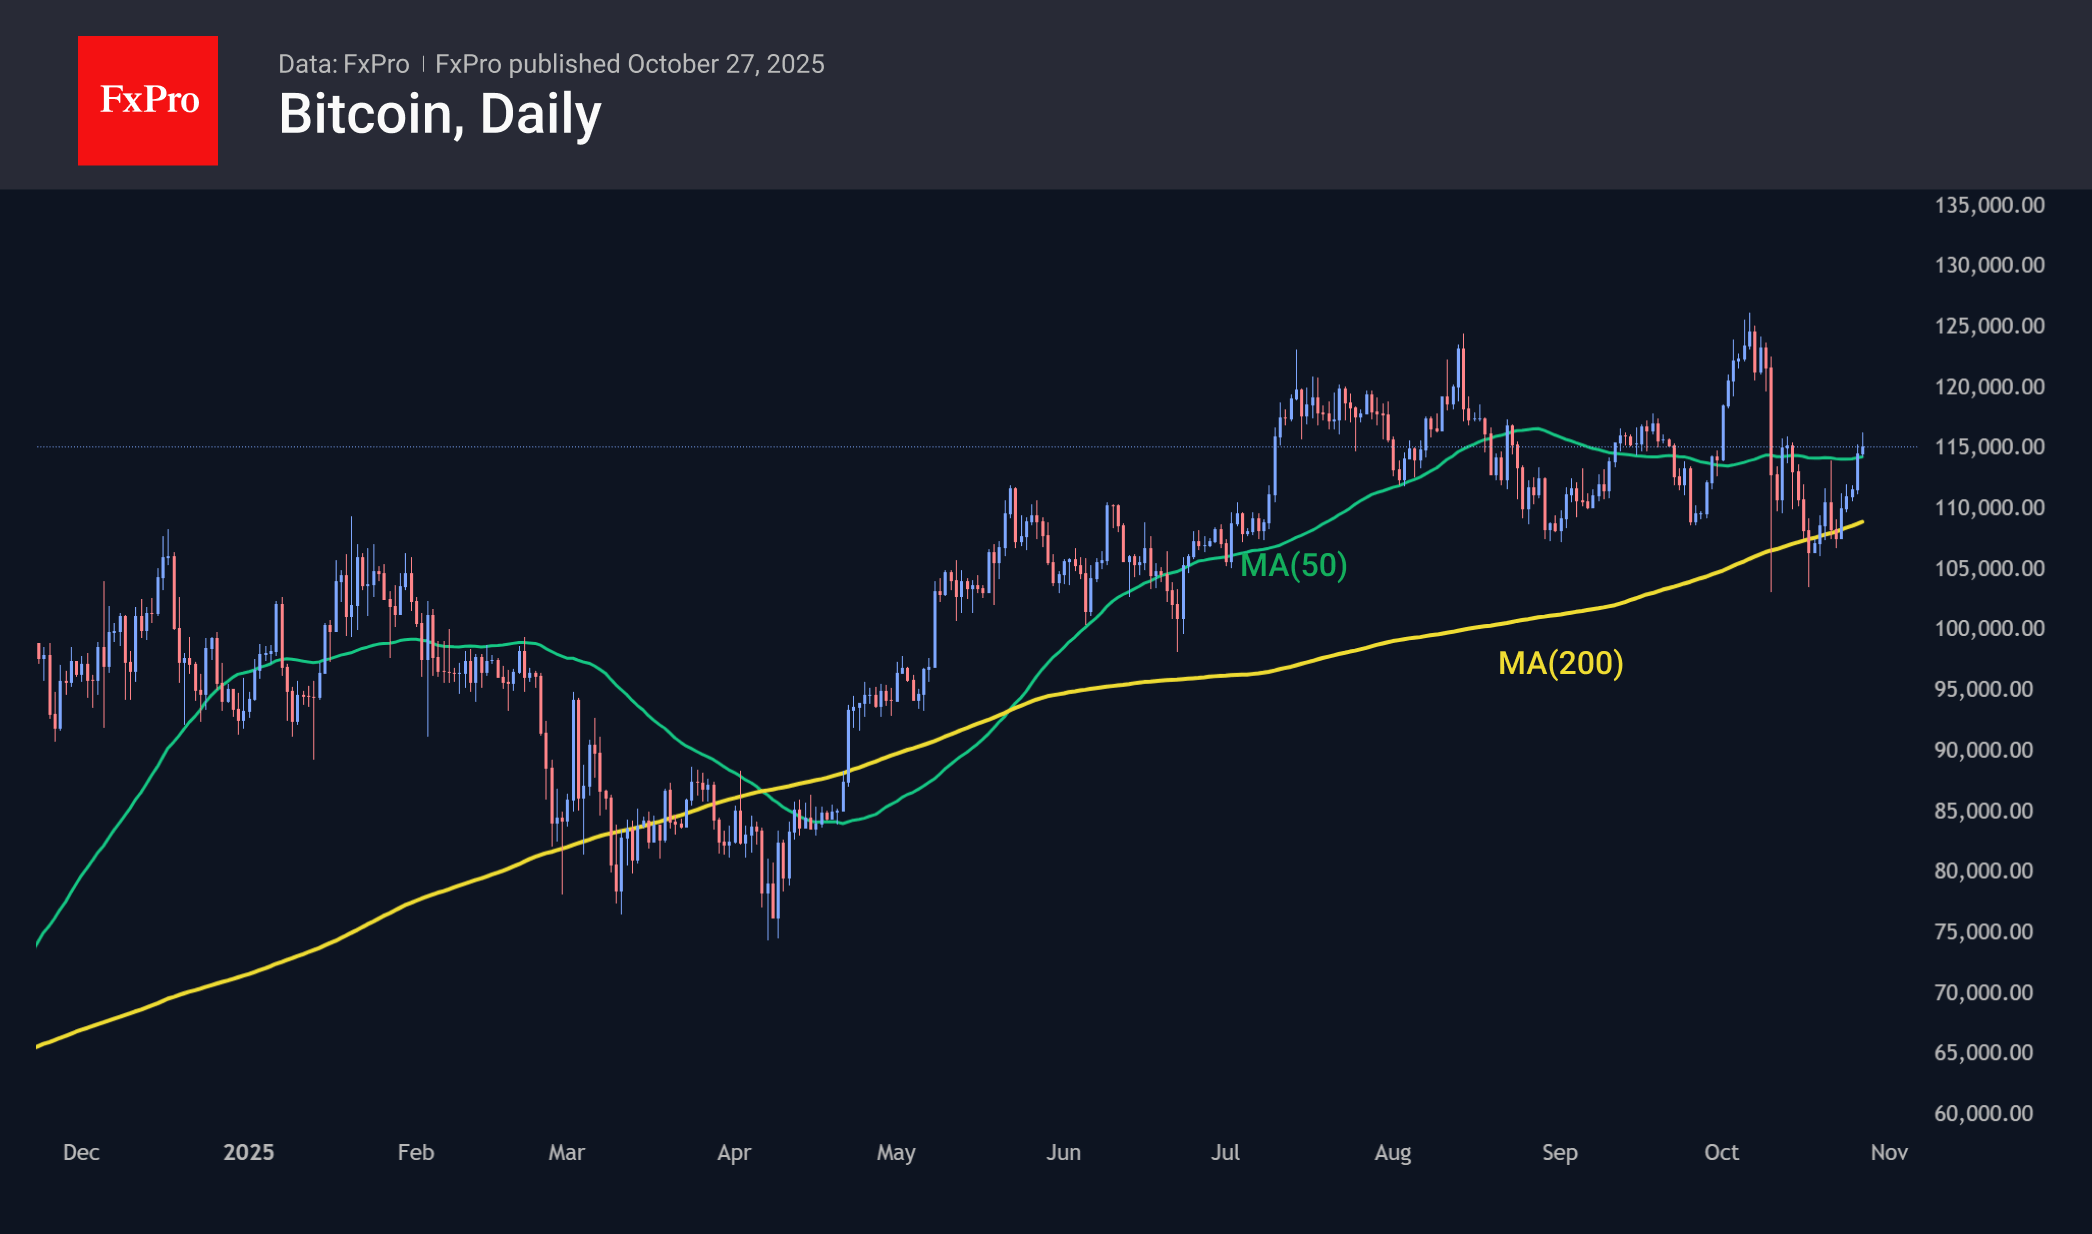
The crypto market capitalisation has gained 4% in 24 hours, confidently adding to positive signals from trade negotiations between China and the US. News from the two largest economies remains cyclical, with positive signals following meetings and high-level direct negotiations the day before. Total capitalisation reached $3.92 trillion, recovering to the 50-day moving average (MA), staying above the 200-day MA of $3.51 trillion at the start of last week.
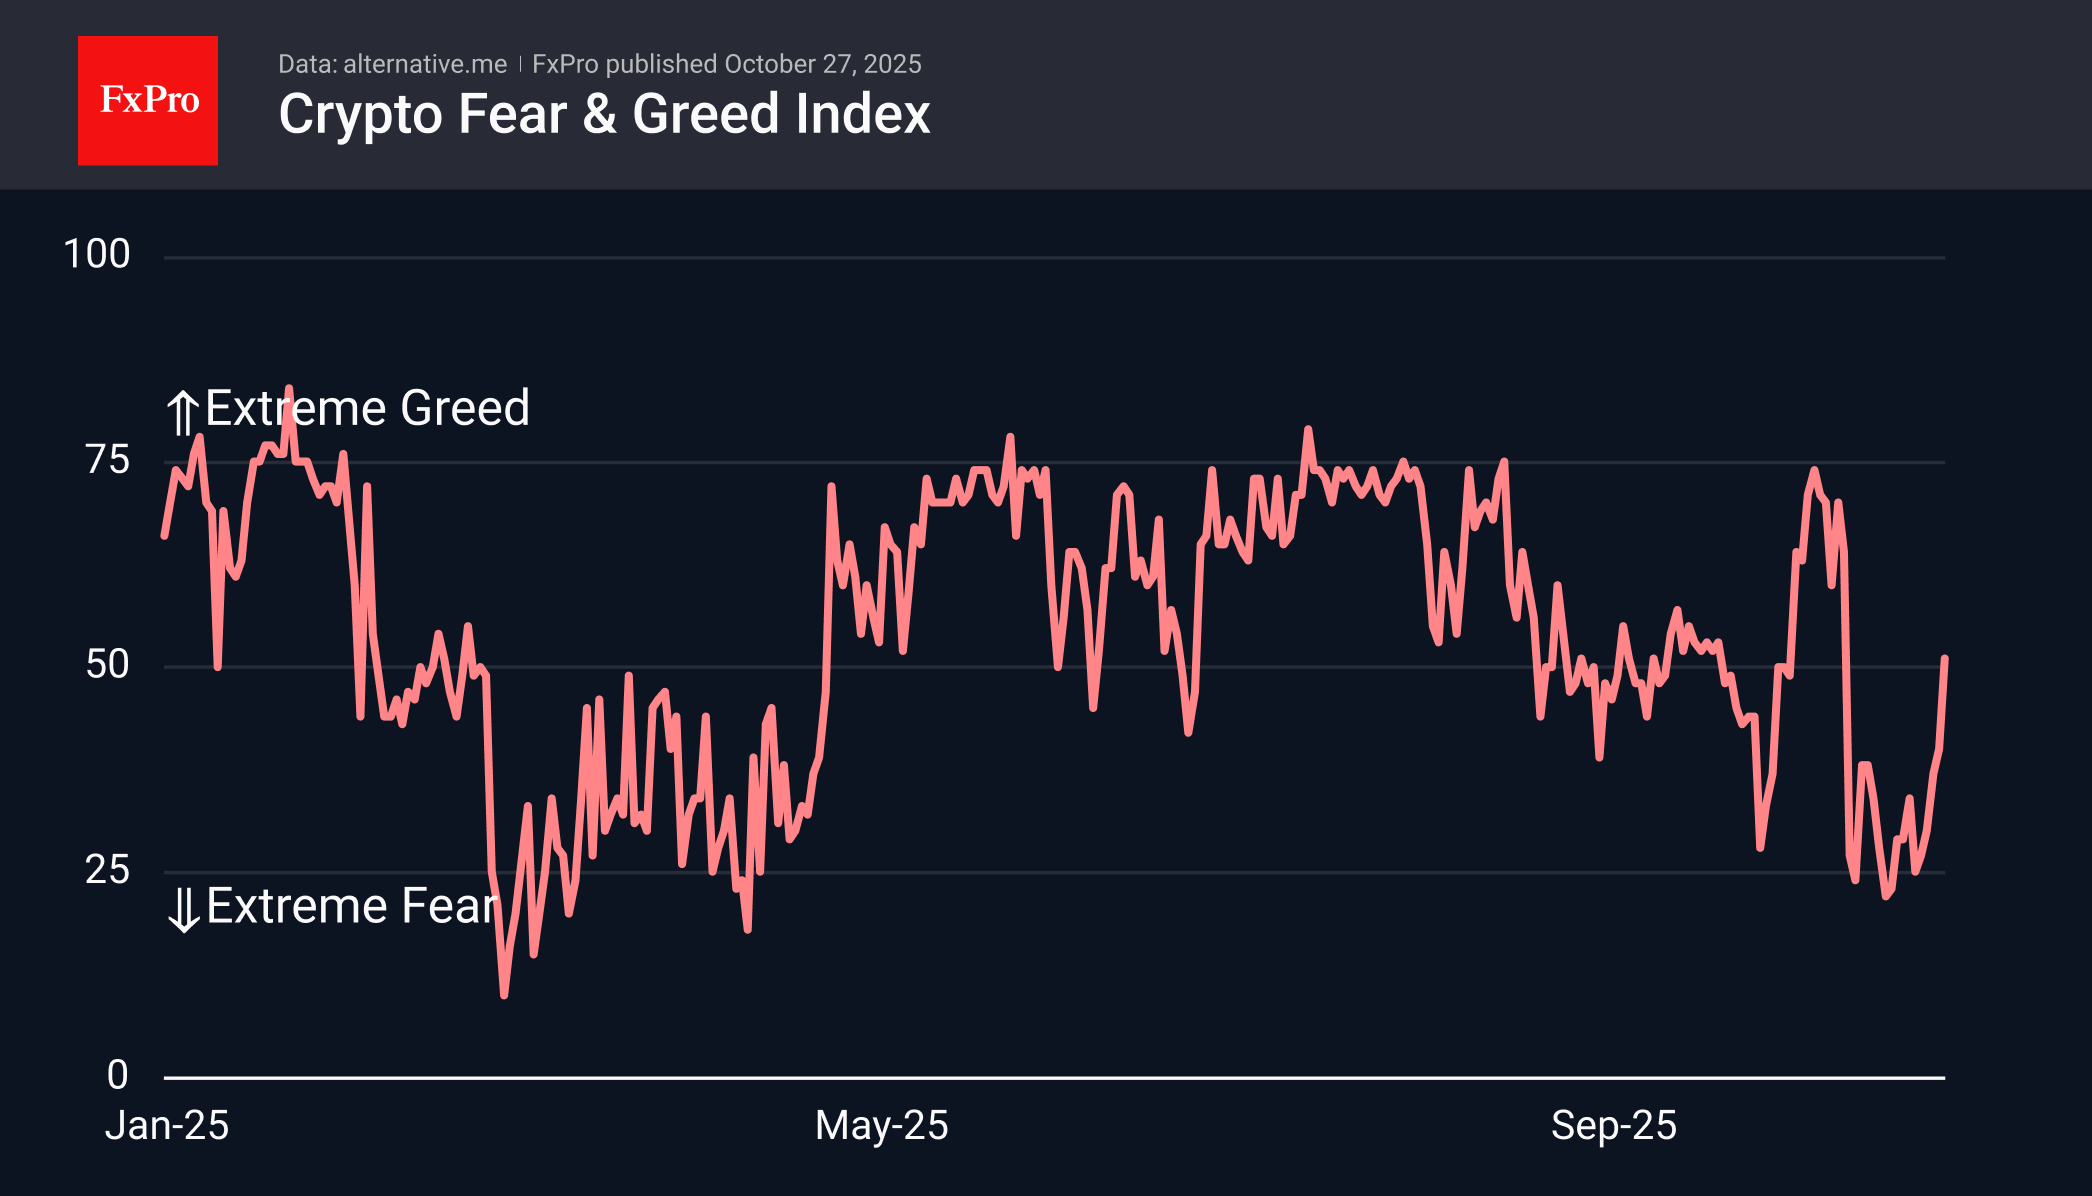
The sentiment index recovered to 51, quickly returning to neutral territory. Unlike the spring episode, this time the recovery came almost immediately after touching levels of extreme fear.
Bitcoin rose above $116K on Monday morning, pushing off the 200-day MA as support last week and exceeding the 50-day moving average at the start of the new week. The $117K–120K area is a strong resistance zone. The rallies in August and early October proved to be unsustainable. Perhaps, by bouncing off the 200-day MA, BTC, as it did in April, will gain enough momentum to renew its highs.
News Background
According to SoSoValue, net inflows into spot BTC ETFs totalled $446.4 million last week, marking the lowest level in the last seven weeks. This brings the total inflows since the approval of Bitcoin ETFs in January 2024 to $61.54 billion.
Net outflows from spot ETH ETFs fell to $243.9 million for the week, reducing the cumulative net inflow since the launch of ETFs in July 2024 to $14.35 billion.
According to OnChainSchool, the volume of bitcoins that have been inactive for more than seven years and have been moved since the beginning of the year has reached a historic high. Long-term BTC holders continue to take profits by actively selling coins.
Owners of 100-1,000 BTC, so-called Dolphins, control the largest share of bitcoins — about 26%, making their activity a key market factor in the late stage of the bullish phase, CryptoQuant notes. CryptoQuant considers ETFs, corporations and other large holders to be dolphins.
BitMine CEO Tom Lee suggested that Bitcoin could fall by 50% to $55,000 in the event of a significant correction in the US S&P 500 stock index.
Altcoins could have had $800 billion more in capitalisation this year were it not for BTC ETFs. Growing interest in Bitcoin and BTC ETFs could cause an even greater decline in the alternative coin market, according to 10x Research.
German Ifo rises to 88.4 as business expectations improve
Germany’s Ifo Business Climate Index rose to 88.4 in October from 87.7, topping expectations of 87.8. The uptick was driven mainly by stronger optimism about the outlook, even as assessments of current conditions softened. Expectations Index climbed to 91.6 from 89.8, while Current Assessment slipped to 85.3 from 85.7, highlighting that the recovery remains more hopeful than tangible.
By sector, the data painted a mixed but improving picture. Manufacturing sentiment strengthened from –13.2 to –11.7, with Ifo noting that “expectations in particular brightened” and the decline in new orders has “come to a halt.” The service sector saw a sharp rebound, rising from –3.0 to –0.1, as providers turned less skeptical about the coming months. Trade confidence also improved from –23.9 to –21.5, while construction slipped slightly from –14.8 to –15.0.
GBP/USD And USD/CAD Decline As Dollar Sees Mixed Flows
GBP/USD started a downside correction from the 1.3470 zone. USD/CAD declined and now consolidates below 1.4000.
Important Takeaways for GBP/USD and USD/CAD Analysis Today
- The British Pound started a fresh decline and settled below the 1.3400 zone.
- There is a connecting bearish trend line forming with resistance at 1.3330 on the hourly chart of GBP/USD at FXOpen.
- USD/CAD started a fresh decline after it failed to surpass 1.4065.
- There was a break below a key bullish trend line with support at 1.3995 on the hourly chart at FXOpen.
GBP/USD Technical Analysis
On the hourly chart of GBP/USD at FXOpen, the pair struggled above 1.3450. The British Pound started a fresh decline below 1.3400 against the US Dollar, as discussed in the previous analysis.
The pair dipped below the 1.3350 and 1.3300 levels. A low was formed at 1.32874 and the pair is now consolidating losses. On the upside, the pair is facing resistance near 1.3330 and a bearish trend line. It is close to the 23.6% Fib retracement level of the downward move from the 1.3471 swing high to the 1.3287 low.
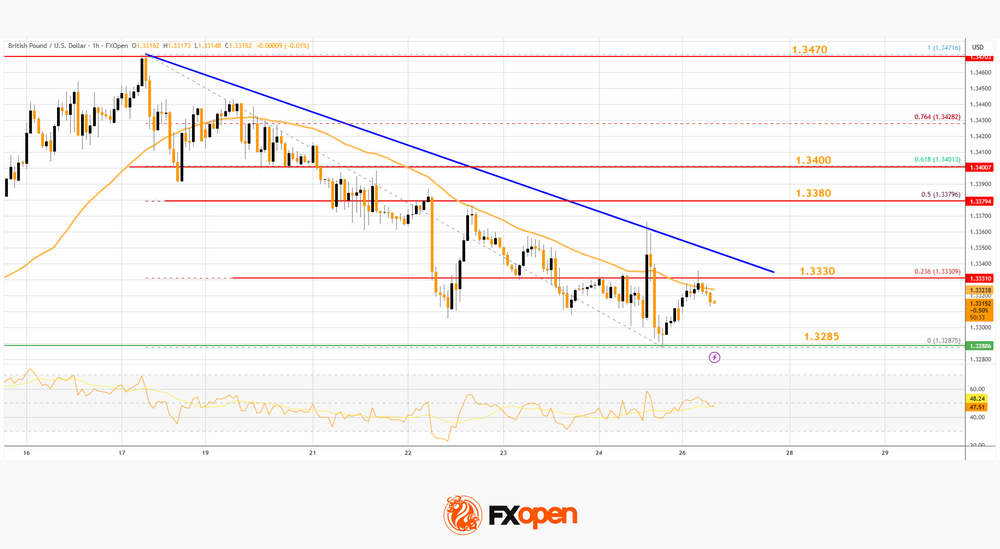
The next key hurdle on the GBP/USD chart could be near the 50% Fib retracement at 1.3380. The main breakout zone is 1.3400. An upside break above 1.3400 could send the pair toward 1.3470.
Any more gains might open the doors for a test of 1.3500. If there is another decline, the pair could find support near 1.3285. The first key zone for the bulls might be 1.3250. A clear move below 1.3250 might send GBP/USD toward 1.3220. The next target for the bears might be 1.3200, below which the price could dive and test 1.3050.
USD/CAD Technical Analysis
On the hourly chart of USD/CAD at FXOpen, the pair climbed toward 1.4065 before the bears appeared. The US Dollar formed a swing high near 1.4065 and recently declined below 1.4020 against the Canadian Dollar.
There was a break below a key bullish trend line with support at 1.3995. Finally, there was also a close below the 50-hour simple moving average and 1.4000. The bulls are now active near 1.3970. The pair is now consolidating losses below the 23.6% Fib retracement level of the downward move from the 1.4039 swing high to the 1.3978 swing low.
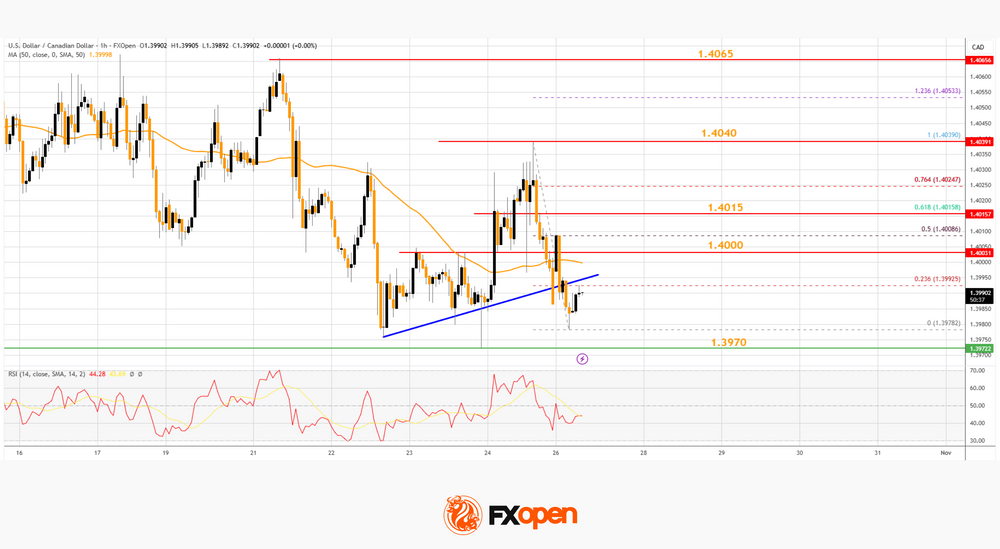
If there is a fresh increase, the pair could face resistance near 1.4000 and the 50-hour simple moving average. The first major pivot level is 1.4015 and the 61.8% Fib retracement.
The next stop for the bulls on the USD/CAD chart could be 1.4040. If there is an upside break above 1.4040, the pair could rise toward 1.4070. A close above 1.4070 might start a steady increase toward 1.4150.
If there is another decline, the pair might find bids near 1.3970. The first major support is near 1.3950. A close below the 1.3950 level might trigger a strong decline. In the stated case, USD/CAD might test 1.3880. Any more losses may possibly open the doors for a drop to 1.3840.
Trade over 50 forex markets 24 hours a day with FXOpen. Take advantage of low commissions, deep liquidity, and spreads from 0.0 pips. Open your FXOpen account now or learn more about trading forex with FXOpen.
This article represents the opinion of the Companies operating under the FXOpen brand only. It is not to be construed as an offer, solicitation, or recommendation with respect to products and services provided by the Companies operating under the FXOpen brand, nor is it to be considered financial advice.