Sample Category Title
Decline in Gold Has Just Begun
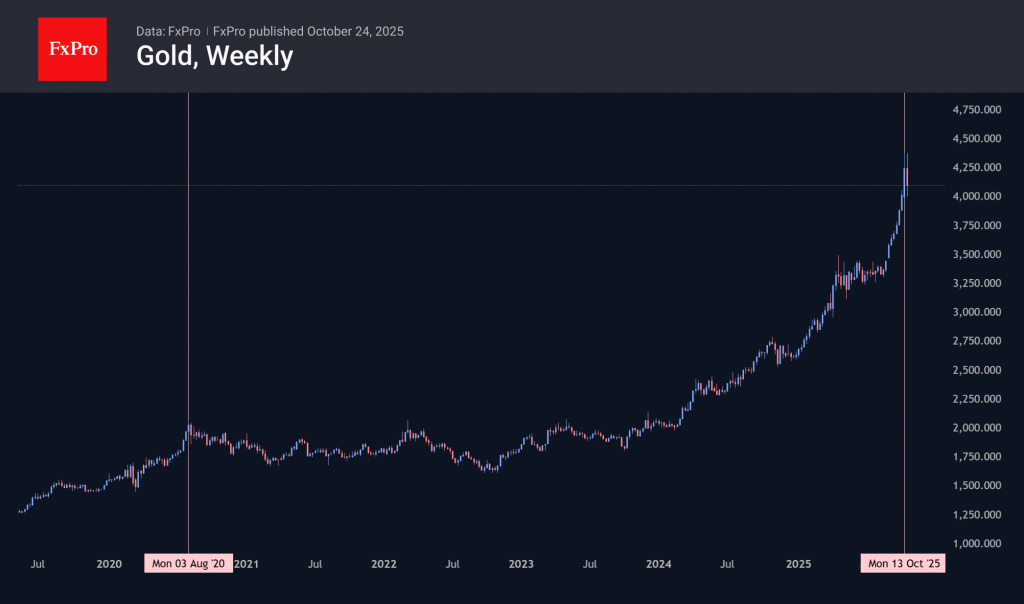
On Tuesday, gold experienced its most significant sell-off in 12 years. In dollar terms, Monday’s intraday drop of $230 per ounce was the worst in history. Gold has never risen for more than nine consecutive weeks in history. This time was no exception. However, the price remained above $4,000, fuelling optimism among those who saw the collapse at the start of the week as an opportunity to join the further rally.
Bespoke Investment Group notes that in the 21st century, there have been only six cases when the precious metal fell by 3% or more in a single day. And in the following month, it lost an average of 18%.
We believe that the situation is more similar to what we saw in August 2020, when a 30-week decline followed an outstanding rally and new historical highs, and the latest highs became the upper limit of the range for the next three years. A more pessimistic scenario takes us back to the peak in 2011, after which the bear market lasted for four years.
Global Risk Rally Reignites as US, UK, and Japan Hit All-Time Highs
Global markets resumed their risk-on momentum last week, buoyed by softer U.S. inflation data, easing political uncertainty, and renewed optimism over global trade. In the U.S., both DOW and S&P 500 climbed to fresh record highs after September CPI figures came in below expectations, cementing confidence that the Fed remains on track to deliver two more rate cuts by year-end. Sentiment was also underpinned by progress on the U.S.–China trade front, as high-level officials met in Malaysia to lay the groundwork for a Trump–Xi summit. Markets welcomed the prospect of de-escalation that could avert the next wave of tariffs in November.
In Europe, downside surprise in UK inflation further boosted risk appetite by reinforcing expectations that the BoE will continue its easing cycle. Combined with firmer oil prices and robust corporate earnings, FTSE 100 surged to a new record high. Meanwhile in Asia, Japan’s political clarity provided another lift to sentiment. The election of Sanae Takaichi as Japan’s first female prime minister removed a major source of uncertainty and drove the Nikkei to new all-time highs.
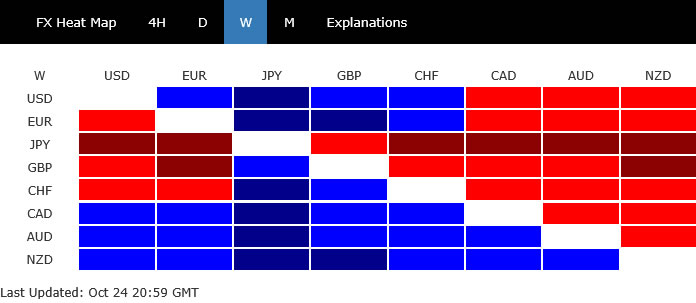
In currency markets, commodity-linked currencies led the way — with Kiwi, Aussie and Loonie as the top performers — reflecting a renewed global appetite for risk. Yen, by contrast, weakened sharply, while Sterling and Swiss Franc also softened. Dollar and Euro finished the week in middle positions.
CPI Miss Locks in Fed Cuts, DOW Extends Record-Breaking Rally
The U.S. inflation report for September was the most consequential data point of the week. Headline CPI ticked up from 2.9% to 3.0%, slightly below market expectations of 3.1%. Core CPI eased from 3.1% to 3.0%, its first slowdown since spring. For the Fed, some officials had long argued that while tariffs may keep inflation sticky in the short term, they would not cause an uncontrolled spike. The data supported that narrative
Also, the softer core reading offered a degree of reassurance to both policymakers and investors that underlying price pressures are no longer reaccelerating. The uptrend in core inflation that began in May has possibly peaked. Fed’s policy focus can shift more comfortably toward supporting growth and managing downside risks.
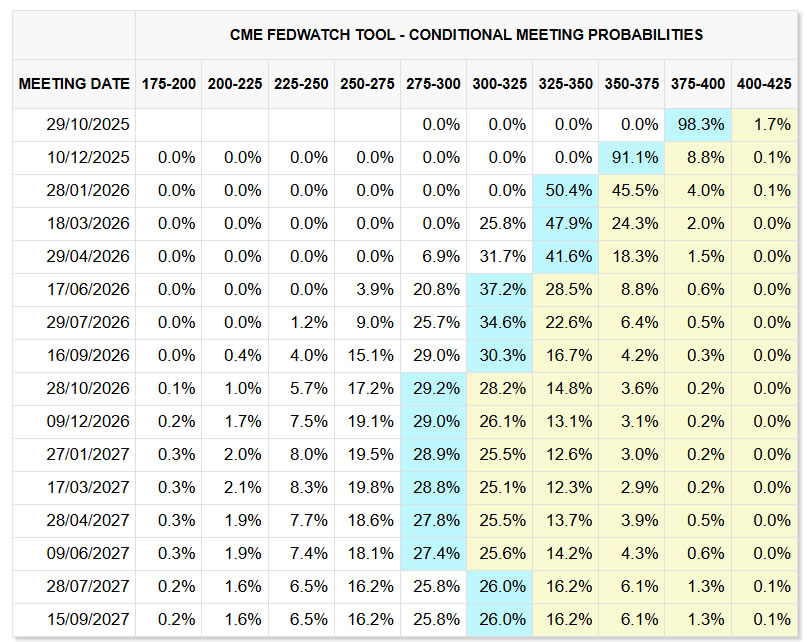
Fed fund futures now price in nearly a 100% probability of a 25bps rate cut at Wednesday’s FOMC meeting, which would bring the policy rate down to the 3.75–4.00% range. Expectations of another 25bps move in December have also solidified, with traders assigning more than 90% likelihood. The market now envisions the easing cycle extending into 2026, with three more cuts anticipated to lower rates toward 2.75–3.00% by late 2026 or early 2027.
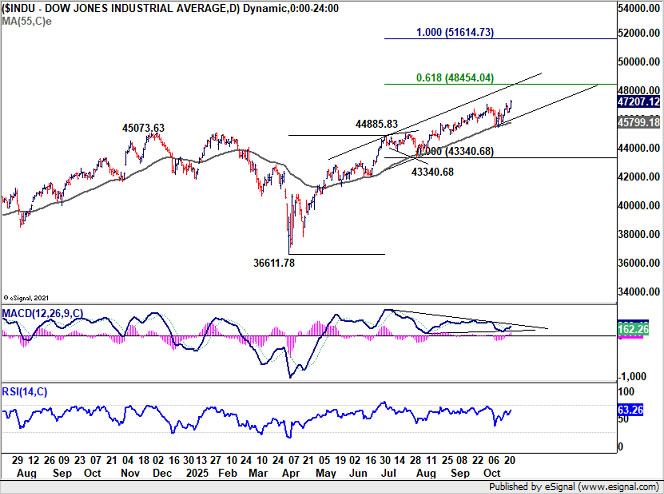
Technically, DOW remains comfortably within its near term ascending channel, and well supported by the rising 55 D EMA (now at 45,799). Friday’s decisive advance confirmed that the rally from 36,611 has resumed, targeting 61.8% projection of 36,611 to 44,885 from 43,340 at 48,454. The index could encounter some initial resistance near that level, which is close to the channel top. Even if short-term retreat occurs, outlook will stay as long as 55 D EMA holds firm.
10-Yields Trying to Stabilize Near 4%, Dollar Index Lacks momentum
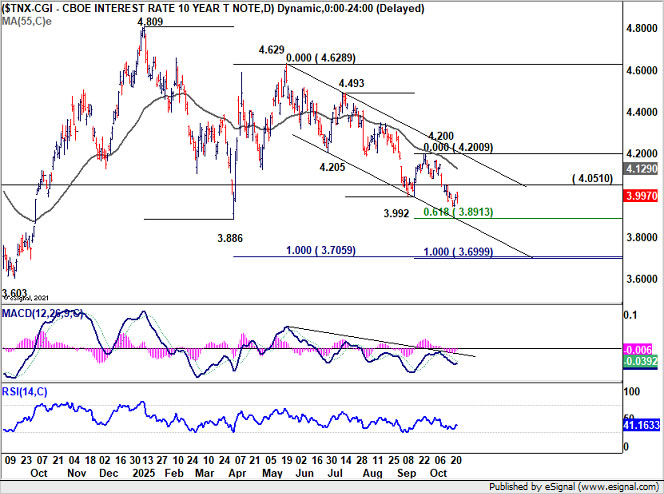
U.S. 10-year yield briefly dipped to 3.947 but stabilized from there. Technically, the yield’s downward momentum has started to flatten, as indicated by D MACD, suggesting that the selling pressure seen through late September is losing force.
Further decline remains possible in the near term, but firm support zone near 61.8% projection of 4.493 to 3.992 from 4.200 at 3.891 should contain the downside on the first test. If yields hold above that level and break back above 4.05, that would signal short-term bottoming, paving the way for rebound toward 55 D EMA (now at 4.129).
From a macro perspective, the next move in yields will serve as a litmus test for broader market confidence. With the absence of renewed stress in regional banks or credit markets like the prior week, 3.9% could emerge as a durable floor for the benchmark yield.
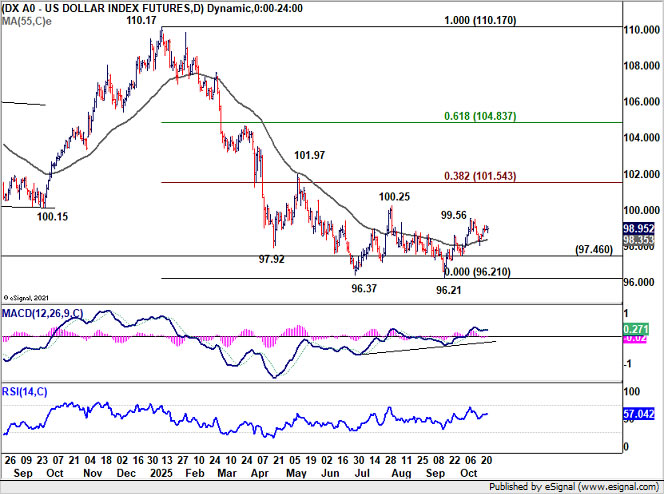
Meanwhile, Dollar Index rebounded after drawing support from 55 D EMA (now at 98.35), but upside momentum proved unconvincing. Dollar's rally attempts were capped by by falling yields and broad risk-on sentiments.
Overall outlook is unchanged that rebound from 96.21 is tentatively viewed as a corrective move. Break above 99.56 would extend the recovery toward 100.25 resistance. But upside should be capped near the 38.2% retracement of 110.17 to 96.21 at 101.54.
Failure to hold 97.46 support, however, would signal that the corrective phase has ended prematurely, setting up a retest of 96.21 low.
FTSE Hits Record High, EUR/GBP Bounces from 55 D EMA
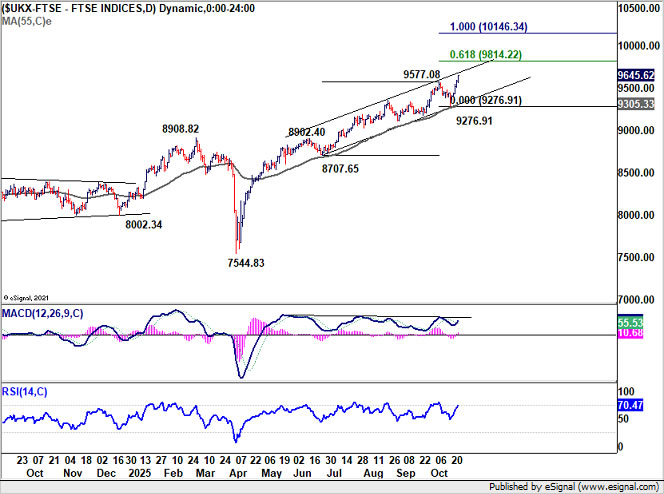
The latest UK inflation report revived hope that the BoE will continue easing later this year. Headline inflation held steady at 3.8%, defying expectations for an uptick to 4.0%, while core CPI slipped to 3.5% from 3.6%. The expectations sent FTSE to new record high and kept Sterling pressured.
However, a move at the November meeting still appears premature. BoE officials are expected to hold fire until after the government’s November 26 Budget, which could significantly influence the inflation and growth outlook. Chancellor Rachel Reeves reaffirmed last week that there would be “targeted action in the Budget around prices” to lower the cost of living, adding that she wants to see interest rates — already reduced five times in the past year — “come down further.” Against that backdrop, December remains the most likely timing for the next cut, with markets now pricing an 80% chance of a 25bps reduction to 3.75%.
Technically, FTSE’s up trend remains on track to 61.8% projection of 8,707.65 to 9,577.08 from 9,354.54 at 9,814.22. That level could act as interim resistance for the near term. There would be scope to challenge 100% projection at 10,146.34, if the Budget confirms a supportive fiscal tone. In any case, outlook will stay bullish as long as 55 D EMA (now at 9,305.33) holds.
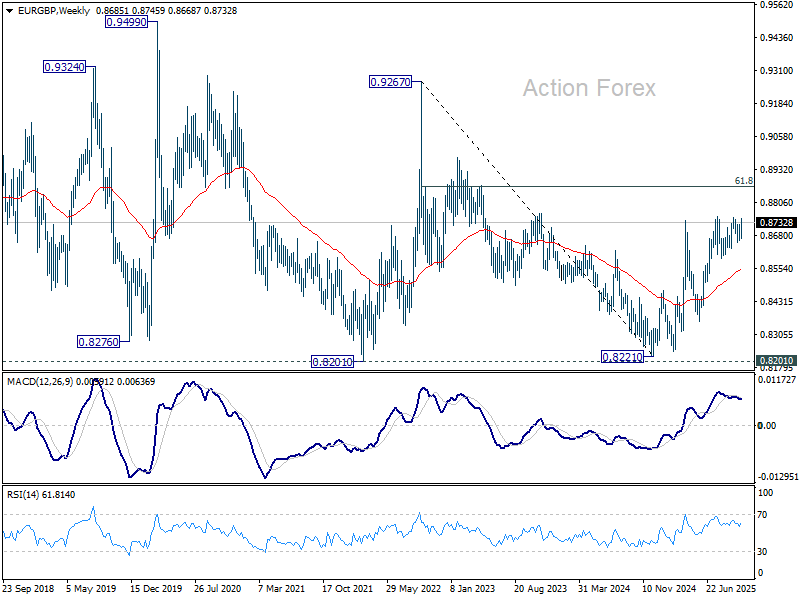
In the currency markets, EUR/GBP is showing renewed strength. Fundamentally, the cross is structurally supported by the policy divergence between the ECB and BoE — with the former firmly maintaining a hold stance and the latter leaning toward further easing.
Technically, EUR/GBP was repeatedly supported by 55 D EMA (now at 0.8676). Pullback from 0.8750 may have already run its course. Firm break above 0.8750 would signal resumption of the rise from 0.8221, with the next target 61.8% retracement of 0.9267 to 0.8221 at 0.8867.
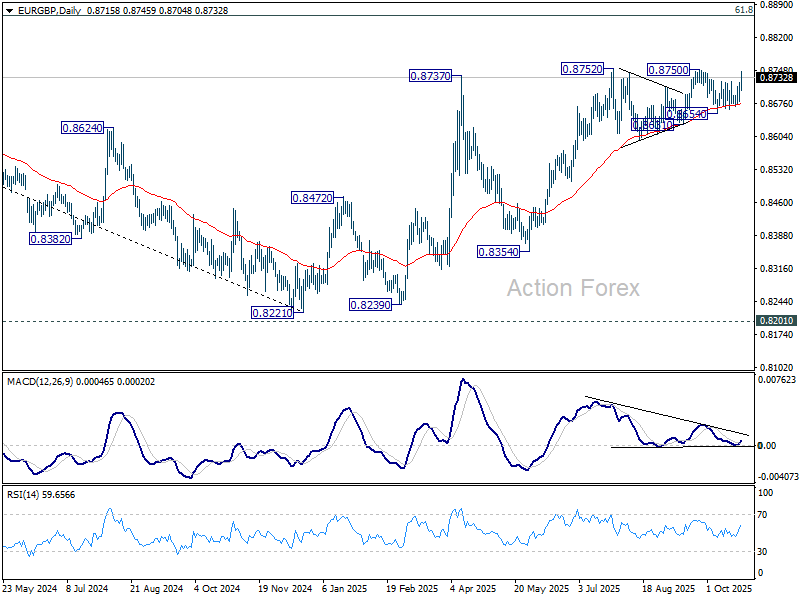
This 0.8867 level will be a key hurdle to test the underlying momentum of EUR/GBP. For now, considering bearish divergence condition in D MACD, it will more likely cap upside than not.
Nikkei Eyes 50k as Takaichi Era Begins; NZD/JPY Jumps on Yen Weakness
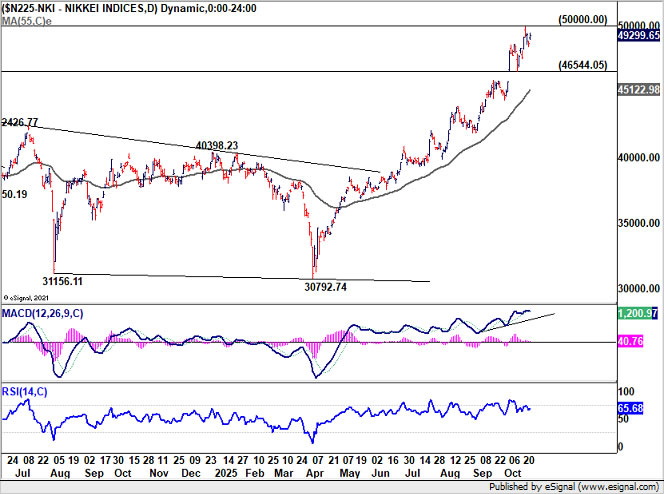
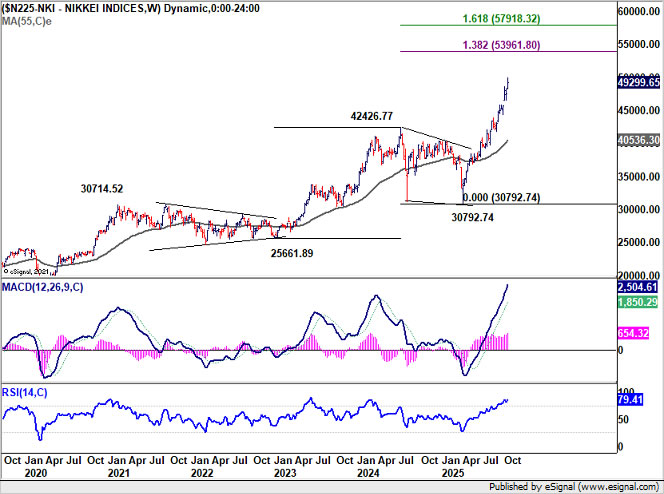
Japanese markets extended their strong run last week, with Nikkei 225 hitting a new record high before easing slightly below the psychological 50,000 mark. The rally came as political uncertainty faded after Sanae Takaichi formally secured her premiership, becoming Japan’s first female prime minister. Backed by a newly formed coalition between the Liberal Democratic Party and the Japan Innovation Party, Takaichi’s leadership has been broadly welcomed by investors anticipating continuity in pro-growth and pro-stimulus policies.
Despite minor profit-taking into the weekend, the overall tone in Tokyo remains upbeat. The shallow pullback from the 50,000 level did not trigger the kind of “sell-the-news” response some had feared. Also, the global risk-on environment would be a powerful tailwind for Japanese equities.
Another take on 50,000 market is likely in the near term. Though, whether Nikkei could sustain above 50,000 would very much depend on how Takaichi performs during her first 100 days in office.
Technically, near term outlook will stay bullish as long as 46,544.05 support holds. Sustained trading above 50,000 will extend the up trend to 138.2% projection of 25,661.89 to 42,426.77 from 30,792.74 at 43,961.80 in the medium term.
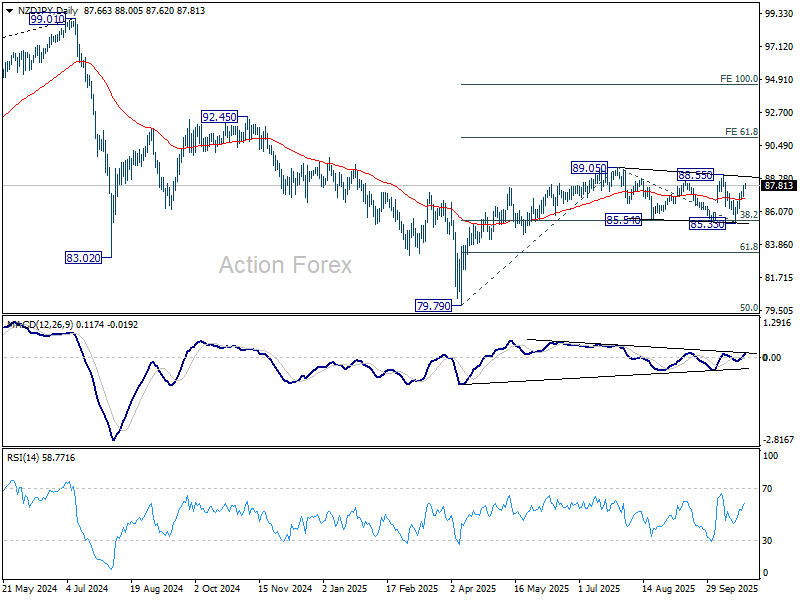
Meanwhile, Yen continues to underperform, with NZD/JPY ended as the top mover, registering 1.89% gain. Technically, for NZD/JPY, repeated support from 38.2% retracement of 79.79 to 89.05 at 85.51 keeps the rise from 79.79 intact. Indeed, it's possible that the corrective pattern from 89.05 has already completed with three waves to 85.33.
Near term focus will now be on 88.55 resistance. Firm break there will bolster the bullish case that rise from 79.79 is resuming. Further break of 89.05 will confirm and target 61.8% projection of 79.79 to 89.05 from 85.33 at 91.05 next.
EUR/CHF Weekly Outlook
EUR/CHF edged lower last week but recovered ahead of 0.9204 support. Initial bias remains neutral this week first, and some more consolidations could be seen. But upside should be limited below 0.9311 support turned resistance. On the downside, break of 0.9204 will confirm larger down trend resumption. Next target is 61.8% projection of 0.9660 to 0.9218 from 0.9452 at 0.9179. Firm break there will target 100% projection at 0.9010.
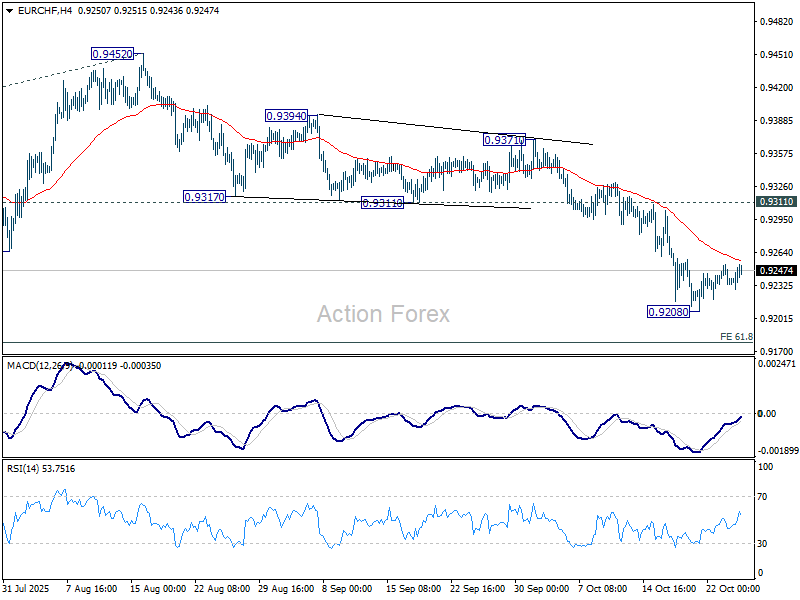
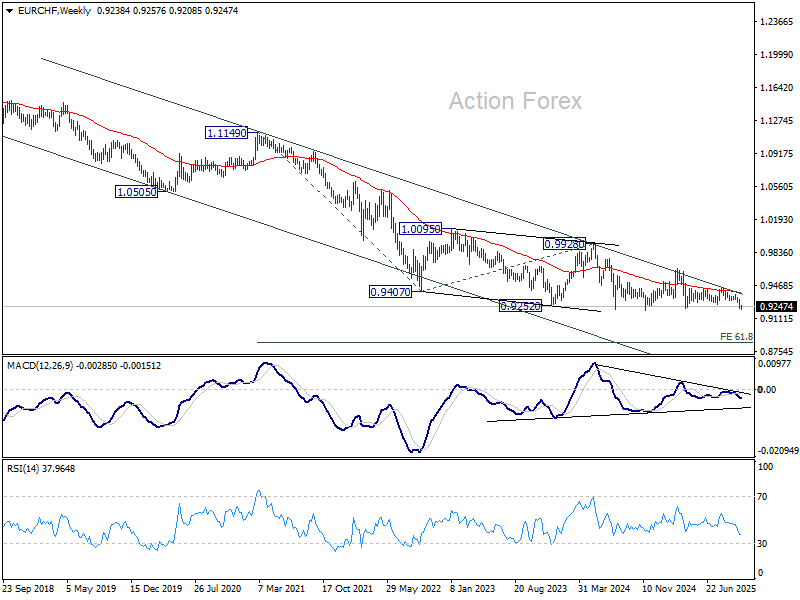
In the bigger picture, outlook remains bearish with EUR/CHF staying well inside long term falling channel after multiple rejection by 55 W EMA (now at 0.9395). Firm break of 0.9204 will resume the whole down trend from 1.2004 (2018 high). Next target is 61.8% projection of 1.1149 to 0.9407 from 0.9928 at 0.8851. Break of 0.9452 resistance is needed to be the first sign of medium term bottoming.
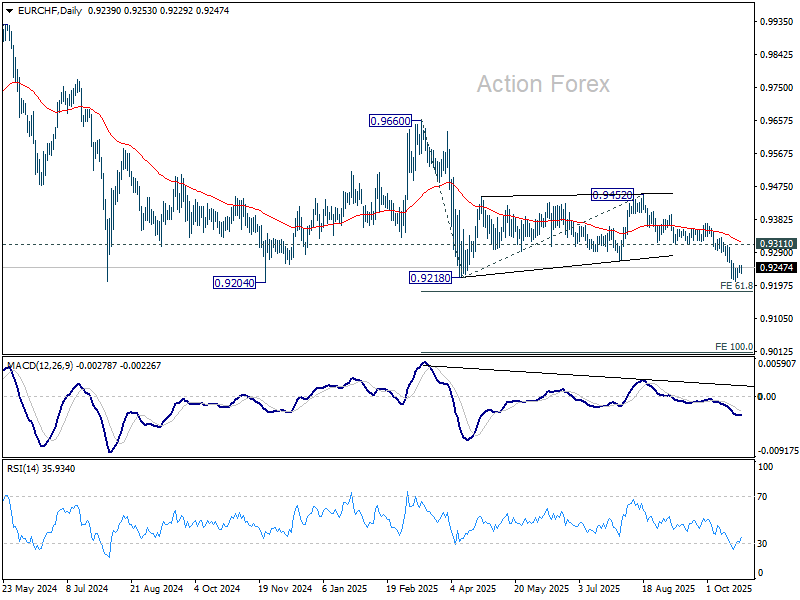
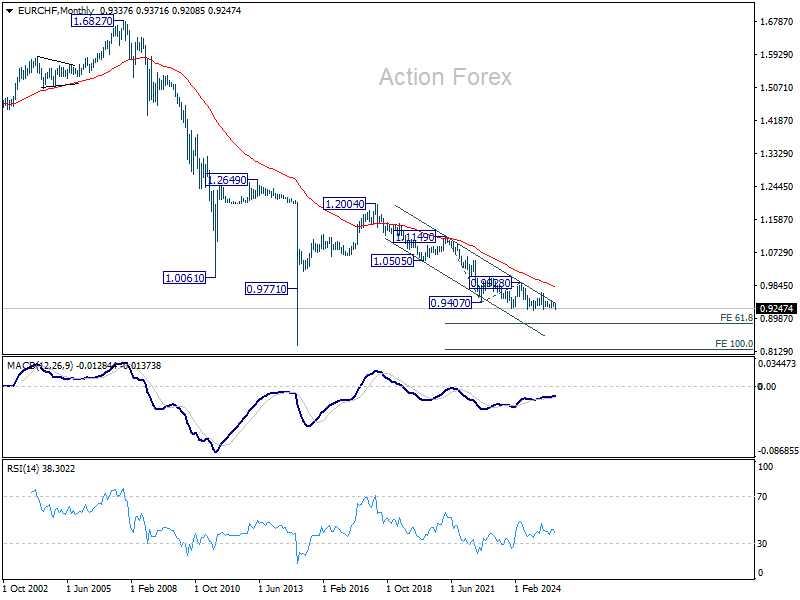
In the long term picture, overall long term down trend is still in progress in EUR/CHF. Outlook will continue to stay bearish as long as 55 M EMA (now at 0.9820) holds.
EUR/USD Weekly Outlook
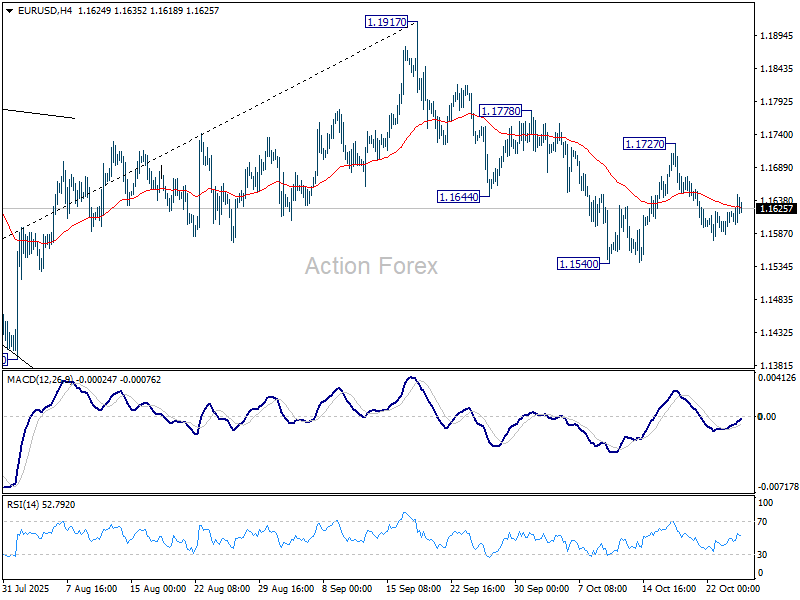
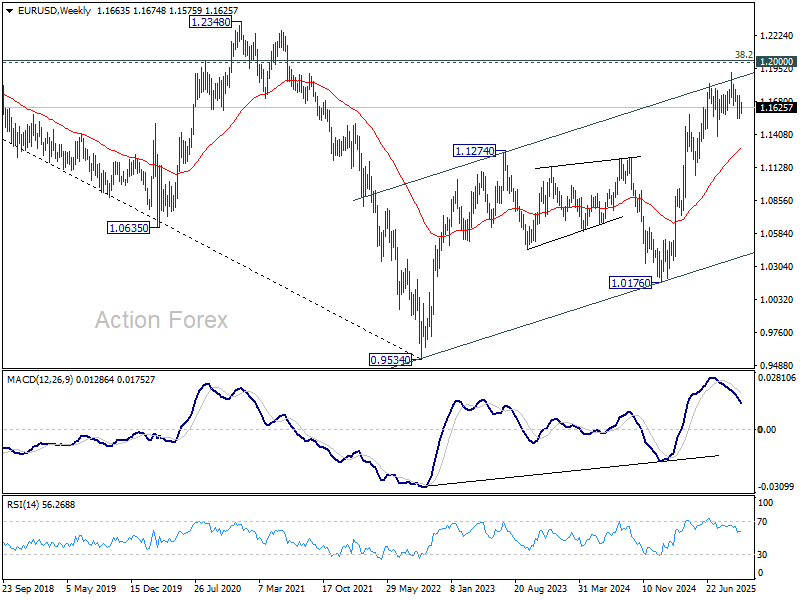
EUR/USD stayed in sideway trading above 1.1540 last week and outlook is unchanged. Initial bias remains neutral this week and further decline is expected with 1.1727 resistance intact. Break of 1.1540 will resume the decline from 1.1917 and target 1.1390 support, or even further to 38.2% retracement of 1.0176 to 1.1917 at 1.1252. On the upside, though, break of 1.1727 resistance will turn bias back to the upside for 1.1778, and then retest of 1.1917 high instead.
In the bigger picture, considering bearish divergence condition in D MACD, a medium term top is likely in place at 1.1917, just ahead of 1.2 key psychological level. As long as 55 W EMA (now at 1.1290) holds, the up trend from 0.9534 (2022 low) is still expected to continue. Decisive break of 1.2000 will carry larger bullish implications. However, sustained trading below 55 W EMA will argue that rise from 0.9534 has completed as a three wave corrective bounce, and keep outlook bearish.
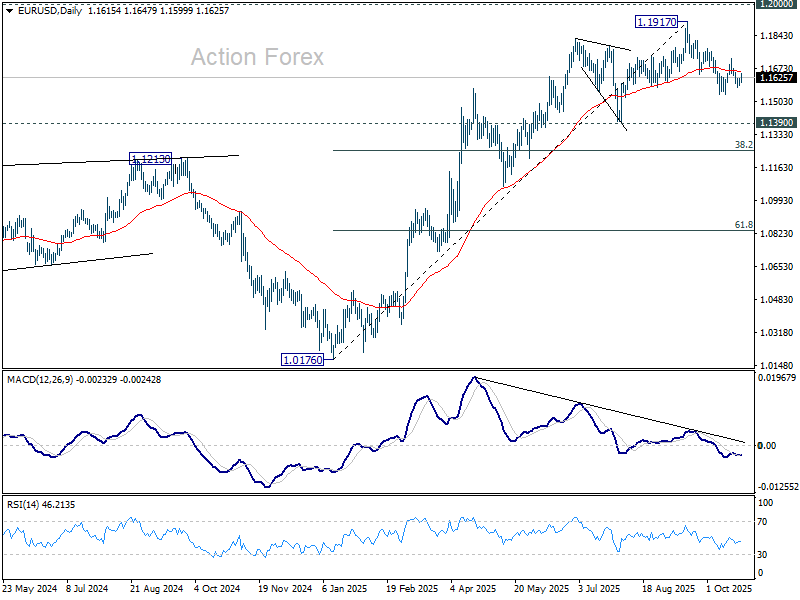
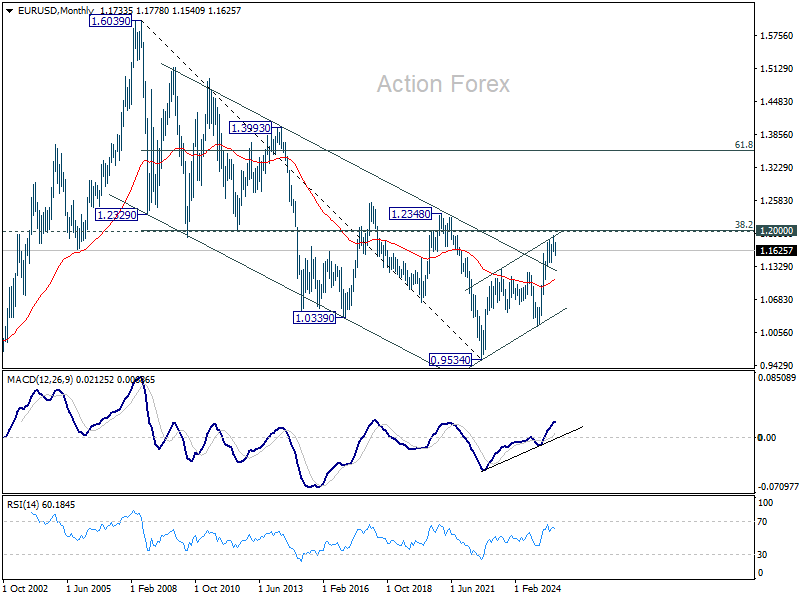
In the long term picture, 38.2% retracement of 1.6039 to 0.9534 at 1.2019, which is close to 1.2000 psychological level is the key for the outlook. Rejection by this level will keep the multi decade down trend from 1.6039 (2008 high) intact, and keep outlook neutral at best. However, decisive break of 1.2000/19, will suggest long term bullish trend reversal, and target 61.8% retracement at 1.3554.
USD/JPY Weekly Outlook
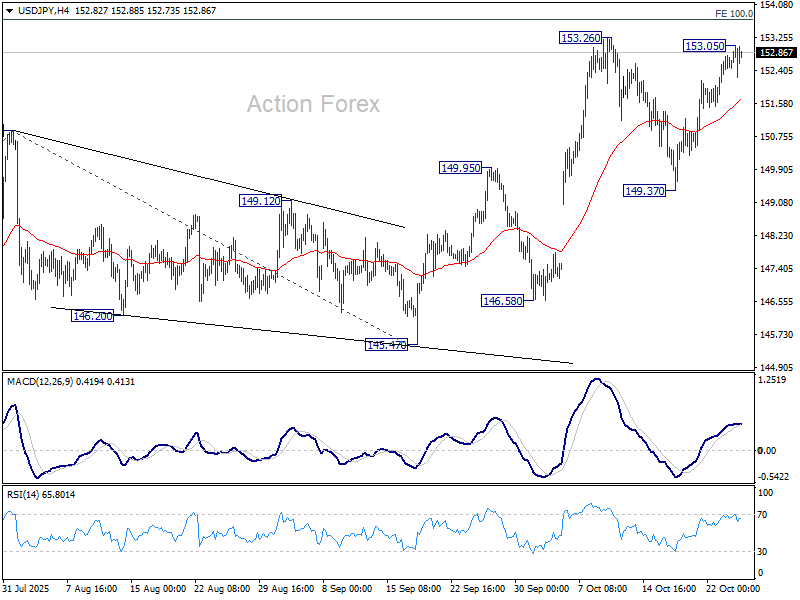
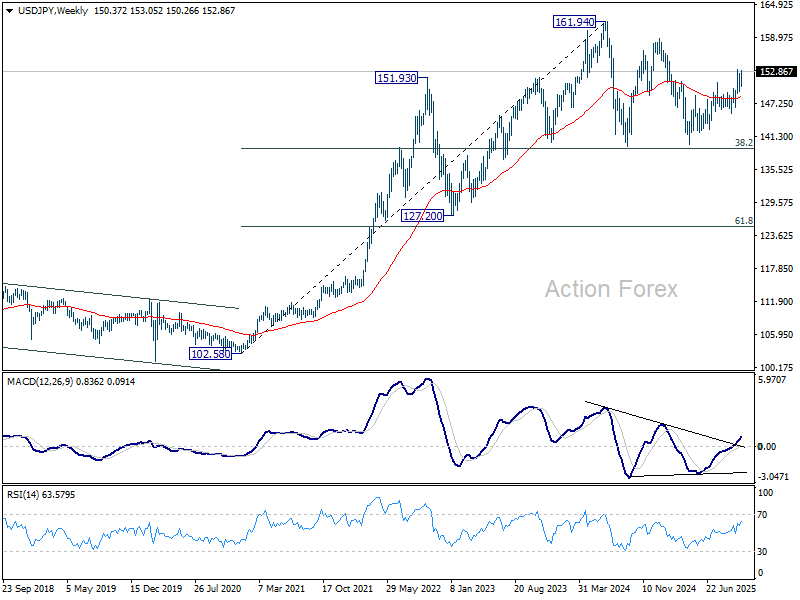
USD/JPY staged a strong rebound last week but lost momentum ahead of 153.26 resistance. Initial bias remains neutral this week and some consolidations could be seen. Further rise is expected as long as 55 4H EMA (now at 151.64) holds. Firm break of 153.26 will resume larger rise from 139.87 and target 100% projection of 142.66 to 150.90 from 145.47 at 153.71. Firm break there would prompt upside acceleration to 161.8% projection at 158.80.
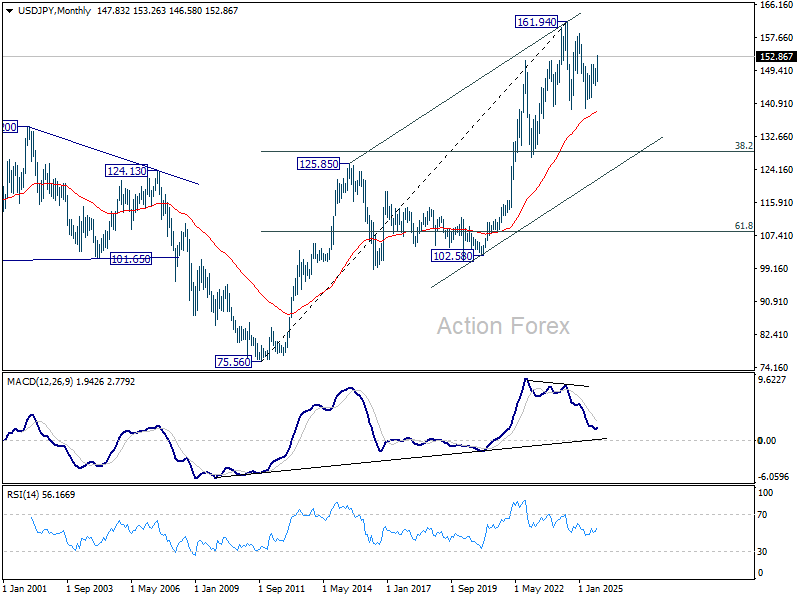
In the bigger picture, current development suggests that corrective pattern from 161.94 (2024 high) has completed with three waves at 139.87. Larger up trend from 102.58 (2021 low) could be ready to resume through 161.94 high. On the downside, break of 145.47 support will dampen this bullish view and extend the corrective pattern with another falling leg.
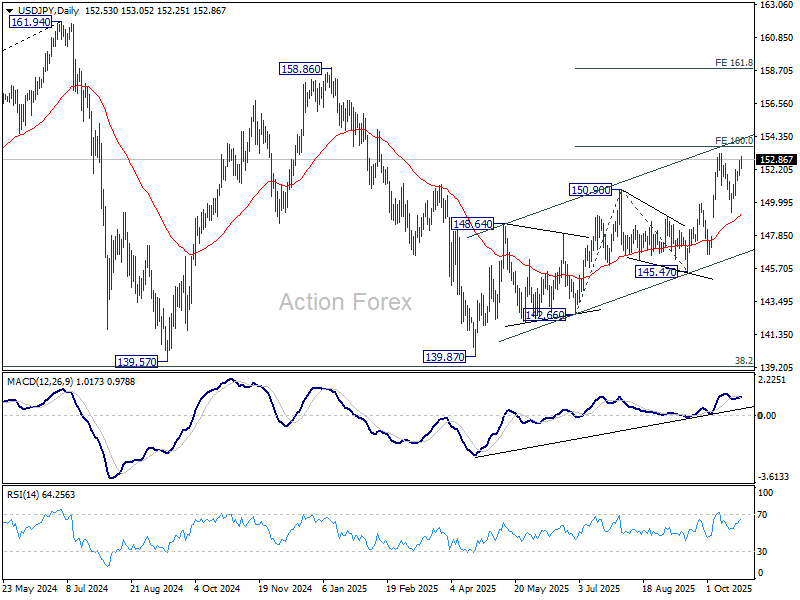
In the long term picture, there is no sign that up trend from 75.56 (2011 low) has completed. But then, firm break of 161.94 is needed to confirm resumption. Otherwise, more medium term range trading could still be seen.
GBP/USD Weekly Outlook
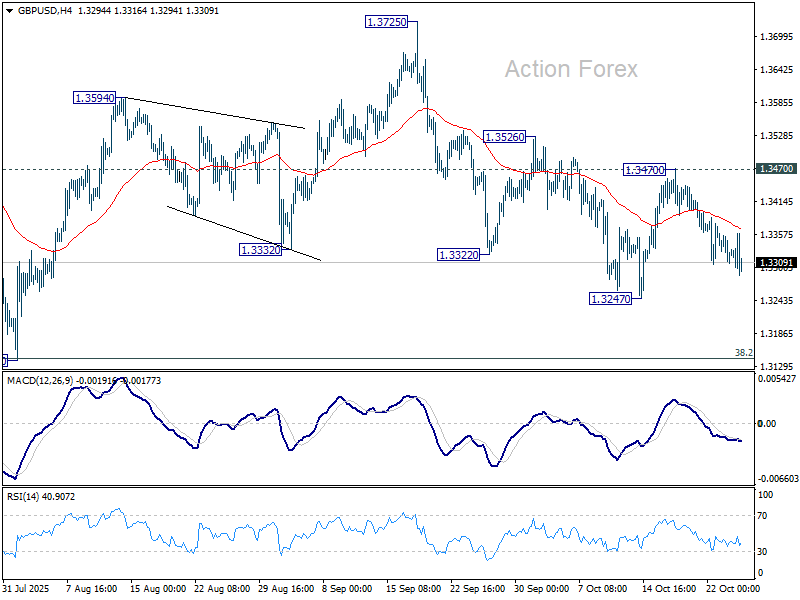
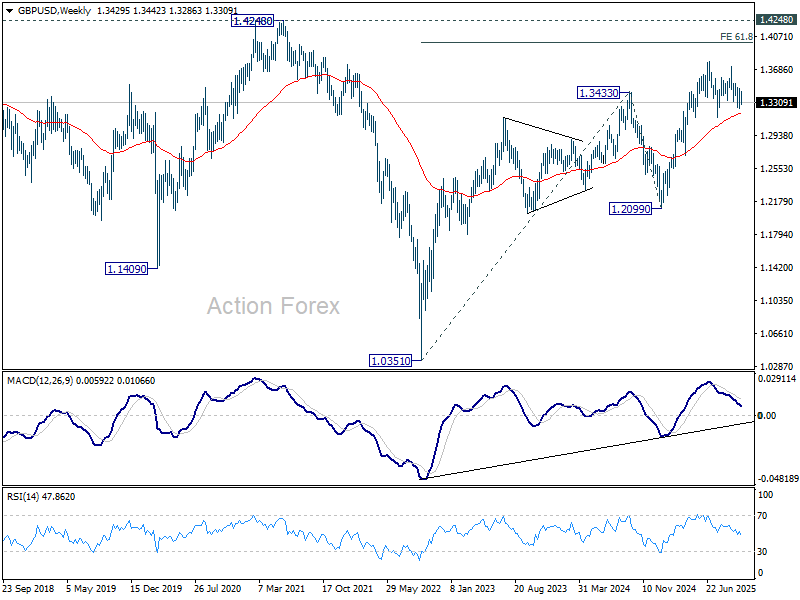
GBP/USD stayed in consolidations above 1.3247 last week and outlook is unchanged. Initial bias remains neutral this week first, and further fall is in favor. Break of 1.3247 will target 1.3140 cluster (38.2% retracement of 1.2099 to 1.3787 at 1.3142). Strong support is expected there to contain downside to complete the corrective pattern from 1.3787. On the upside, break of 1.3526 will target 1.3725/87 resistance zone.
In the bigger picture, rise from 1.0351 (2022 low) is still seen as a corrective move. Further rally could be seen to 61.8% projection of 1.0351 to 1.3433 (2024 high) from 1.2099 (2025 low) at 1.4004. But strong resistance could emerge from 1.4248 (2021 high) to limit upside. Sustained break of 55 W EMA (now at 1.3191) will argue that a medium term top has already formed and bring deeper fall back to 1.2099.
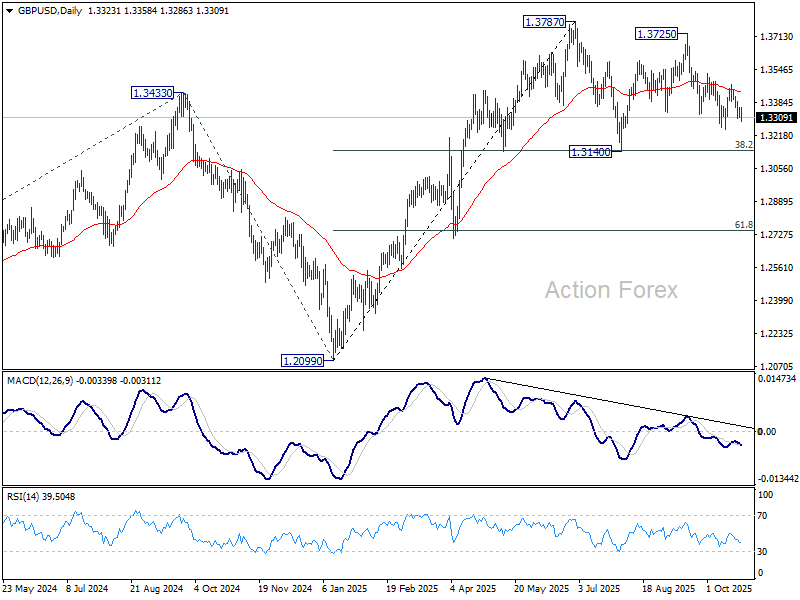
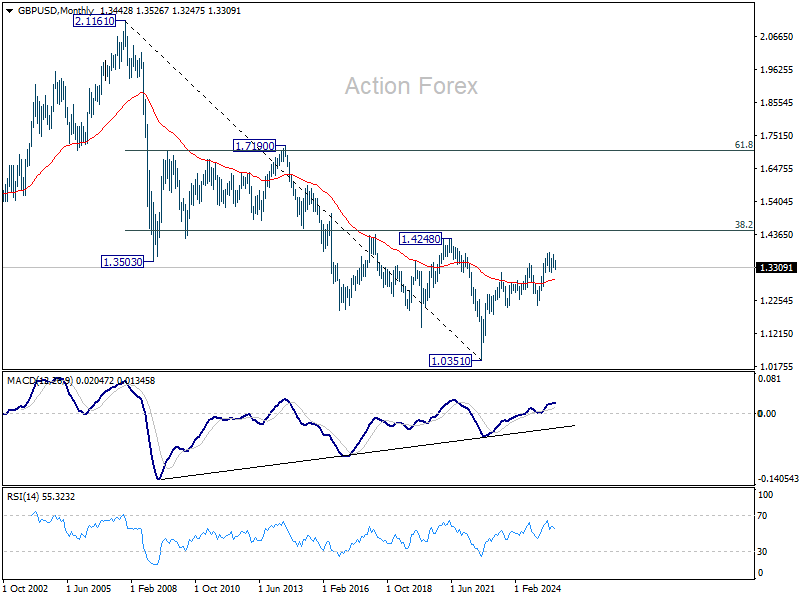
In the long term picture, as long as 1.4248/4480 resistance holds (38.2% retracement of 2.1161 to 1.0351 at 1.4480), the long term outlook will remain bearish. That is, price actions from 1.3051 are seen as a corrective pattern to down trend from 2.1161 (2007 high) only. Nevertheless, decisive break of 1.4248/4480 will be a strong sign of long term bullish reversal.
USD/CHF Weekly Outlook
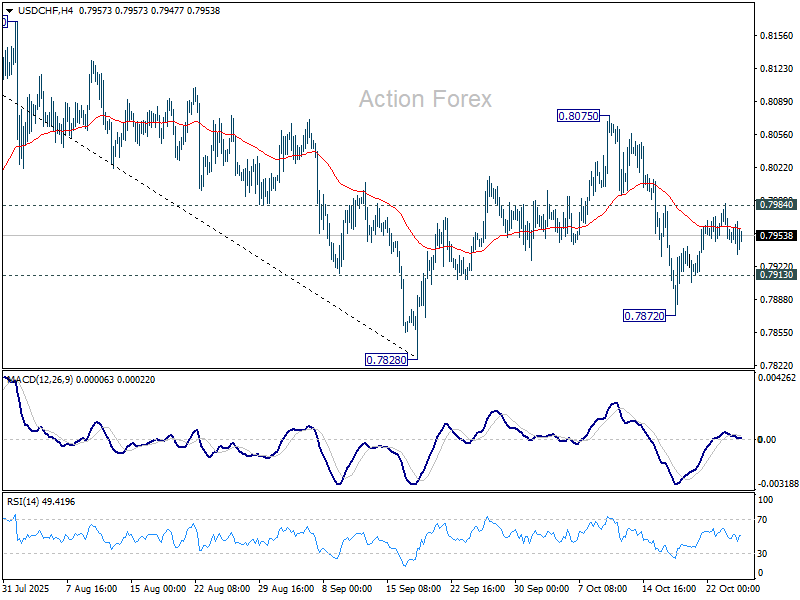
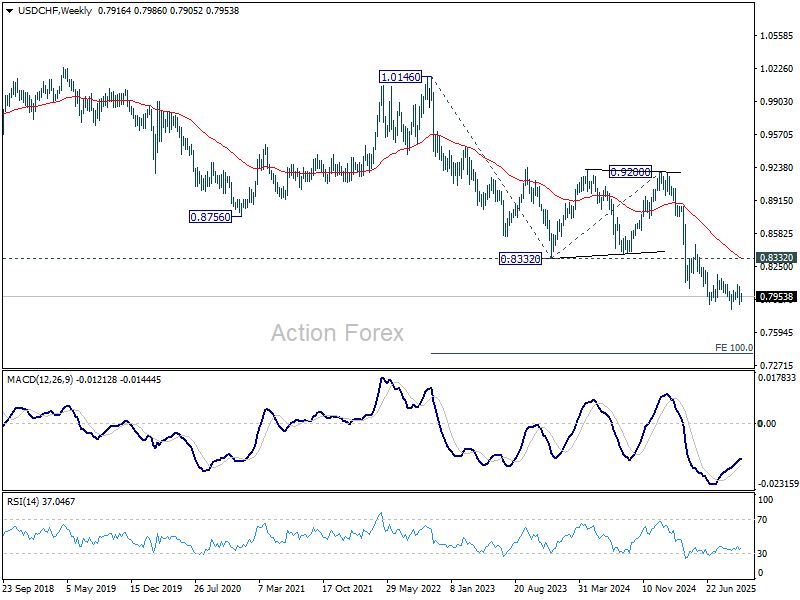
USD/CHF's recovery from 0.7872 extended last week but retreated after hitting 0.7984 minor resistance. Initial bias remains neutral this week first and deeper decline is still in favor. On the downside, below 0.7913 will turn bias to the downside for 0.7872 support, and then 0.7828 low. However, firm break of 0.7984 will suggest that corrective pattern from 0.7828 is extending with another rising leg, and target 0.8075 again.
In the bigger picture, long term down trend from 1.0342 (2017 high) is still in progress. Next target is 100% projection of 1.0146 (2022 high) to 0.8332 from 0.9200 at 0.7382. In any case, outlook will stay bearish as long as 0.8332 support turned resistance holds (2023 low).
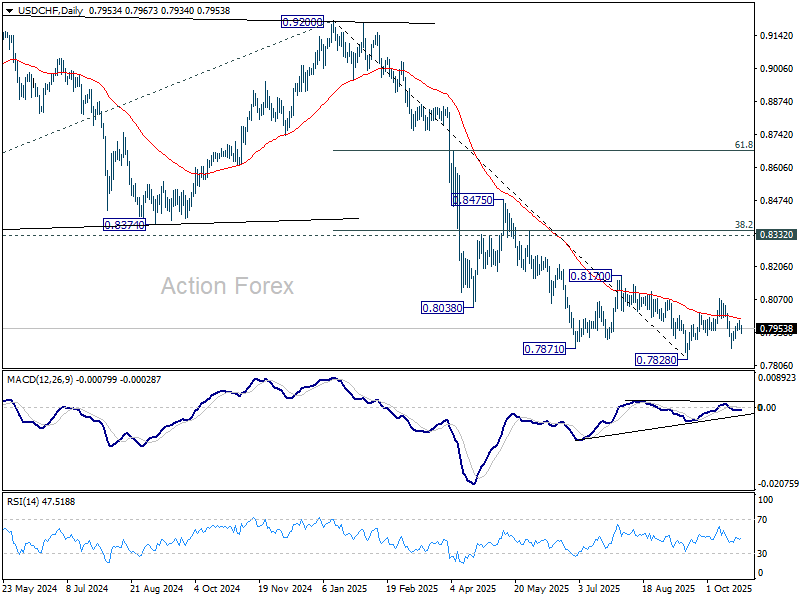
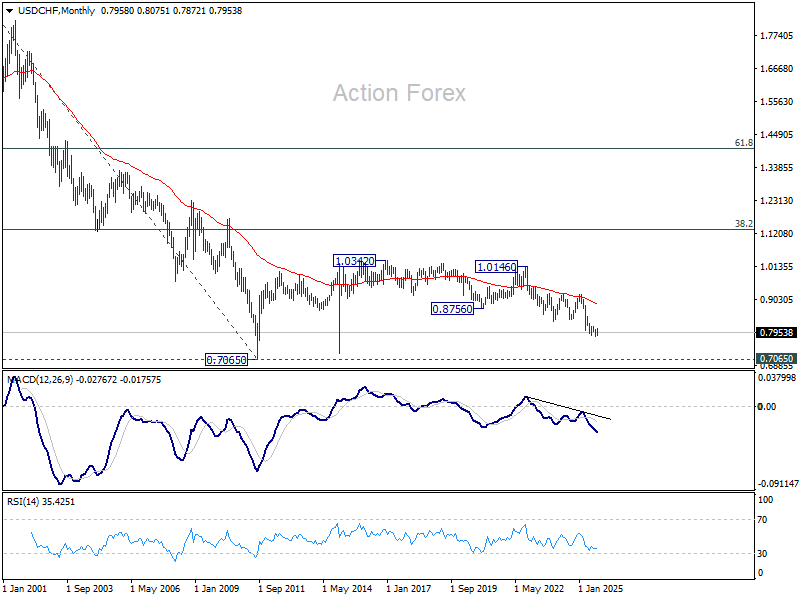
In the long term picture, price action from 0.7065 (2011 low) are seen as a corrective pattern to the multi-decade down trend from 1.8305 (2000 high). It's uncertain if the fall from 1.0342 is the second leg of the pattern, or resumption of the downtrend. But in either case, outlook will stay bearish as long as 0.8756 support turned resistance holds (2021 low). Retest of 0.7065 should be seen next.
AUD/USD Weekly Report
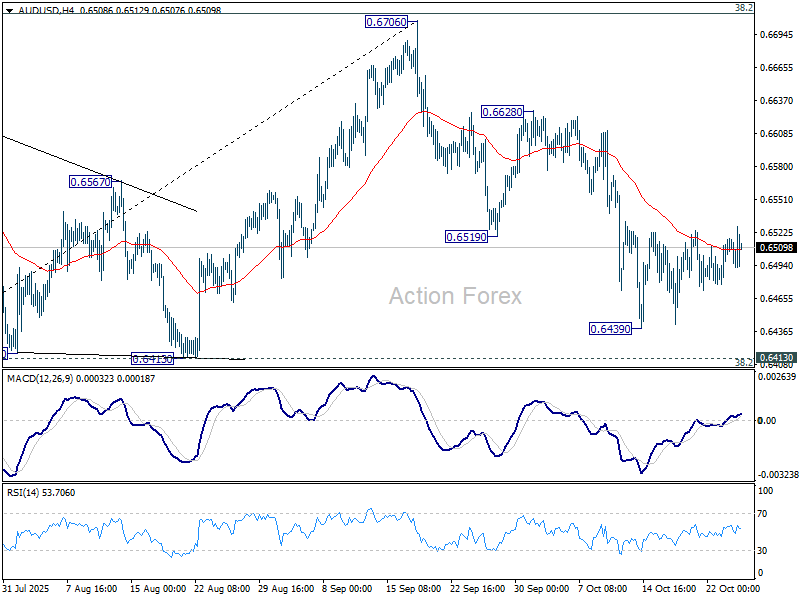
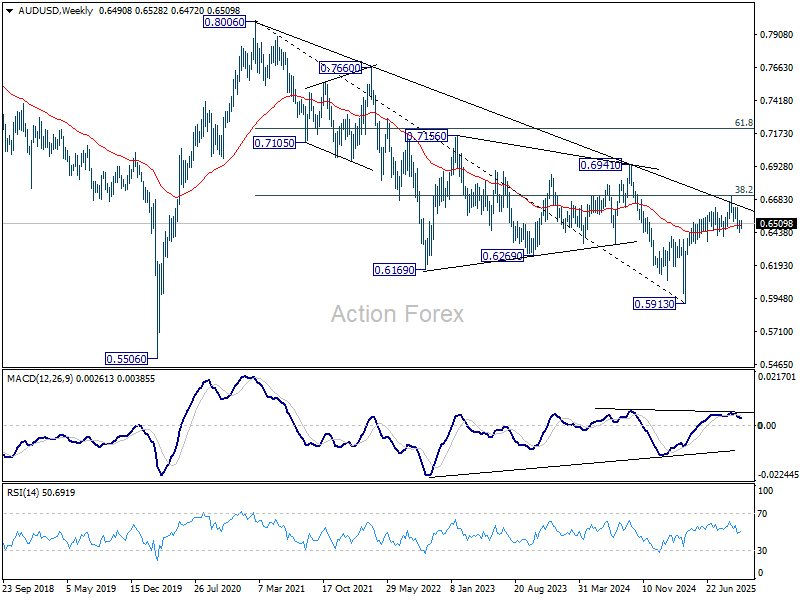
AUD/USD extended consolidations above 0.6439 last week and outlook is unchanged. Initial bias remains neutral this week first. Further decline is in favor as long as 55 D EMA (now at 0.6538) holds. Below 0.6439 will target 0.6413 cluster support (38.2% retracement of 0.5913 to 0.6706 at 0.6403. Decisive break there will indicate bearish reversal after rejection by 0.6713 fibonacci level. Nevertheless, sustained trading above 55 D EMA will keep the rise from 0.5913 intact, and bring retest of 0.6706 high.
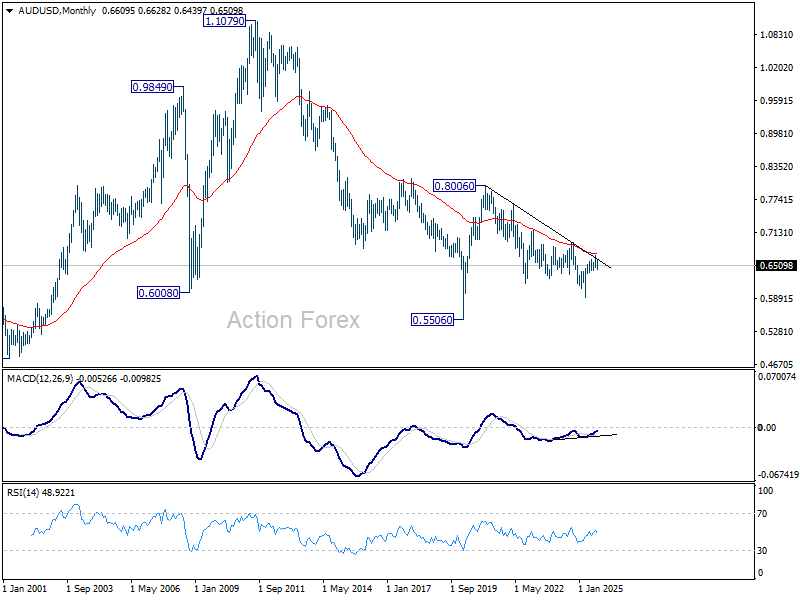
In the bigger picture, there is no clear sign that down trend from 0.8006 (2021 high) has completed. Rebound from 0.5913 is seen as a corrective move. Outlook will remain bearish as long as 38.2% retracement of 0.8006 to 0.5913 at 0.6713 holds. Nevertheless, considering bullish convergence condition in W MACD, sustained break of 0.6713 will be a strong sign of bullish trend reversal, and pave the way to 0.6941 structural resistance for confirmation.
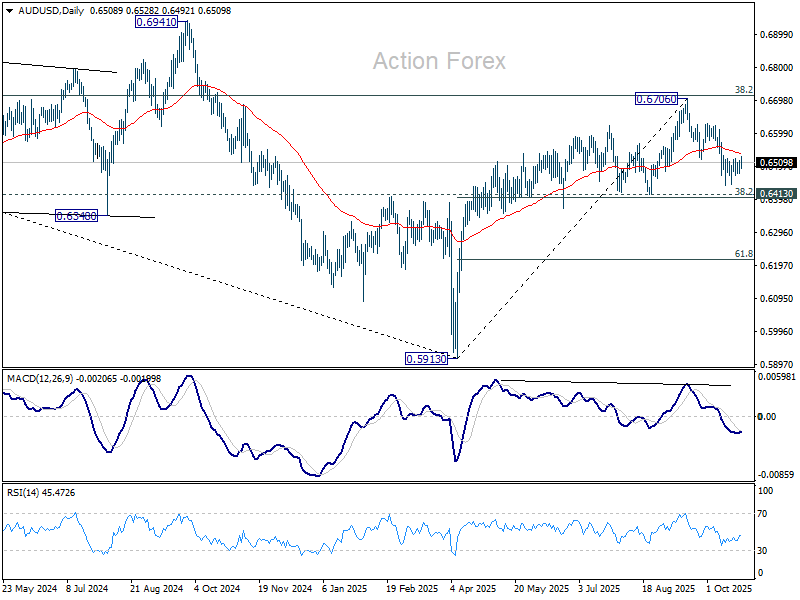
In the long term picture, fall from 0.8006 is seen as the second leg of the corrective pattern from 0.5506 long term bottom (2020 low). Hence, in case of deeper decline, strong support should emerge above 0.5506 to contain downside to bring reversal. On the upside, firm break of 0.6941 will argue that the third leg has already started back to 0.8006.
USD/CAD Weekly Outlook
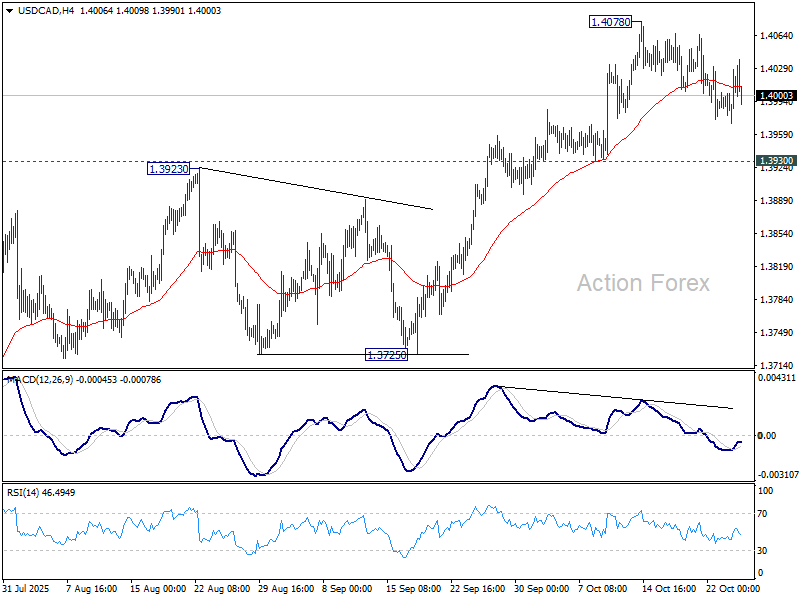
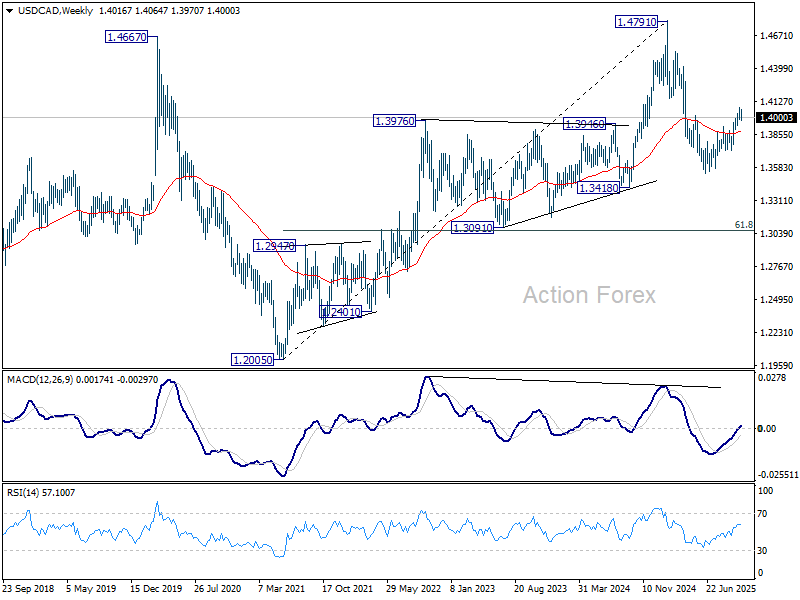
USD/CAD stayed in consolidations last week and outlook is unchanged. Initial bias remains neutral this week, and further rally is expected as long as 1.3930 support holds. Break of 1.4078 will resume the rise from 1.3538 to 61.8% retracement of 1.4791 to 1.3538 at 1.4312.
In the bigger picture, price actions from 1.4791 medium term top is likely just unfolding as a correction to up trend from 1.2005 (2021 low). Based on current momentum, rise from 1.3538 is the second leg, and a third leg should follow before up trend resumption. That is, range trading is set to extend for the medium term. For now, this will remain the favored case as long as 1.3725 support holds.
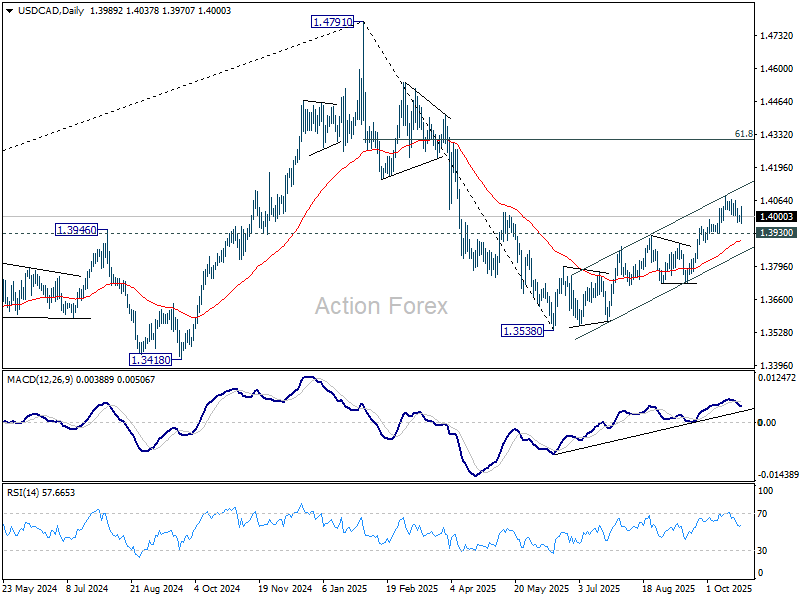
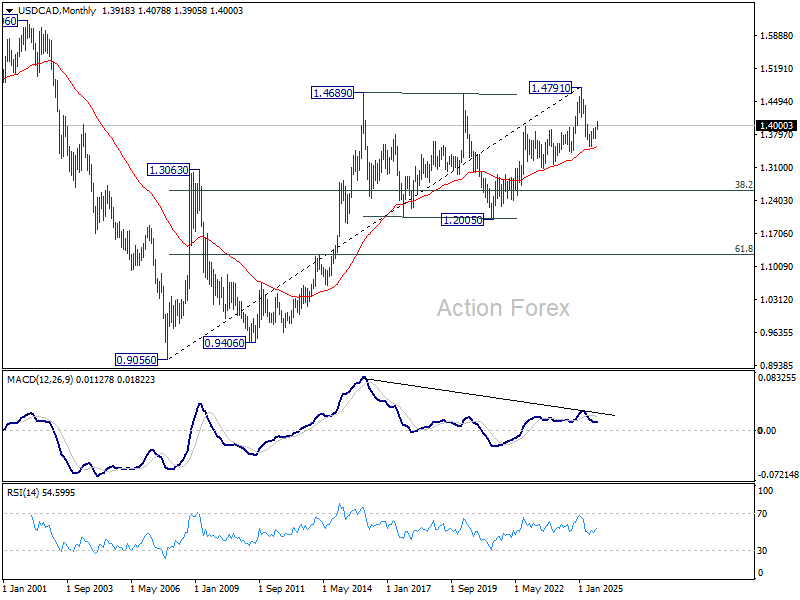
In the long term picture, 55 M EMA (now at 1.3525) remains intact. Thus, up trend from 0.90567 (2007 low) should still be in progress. However, considering bearish divergence condition M MACD, sustained trading below 55 M EMA will argue that the up trend has completed with five waves up to 1.4791, and turn medium term outlook bearish for correction.
GBP/JPY Weekly Outlook
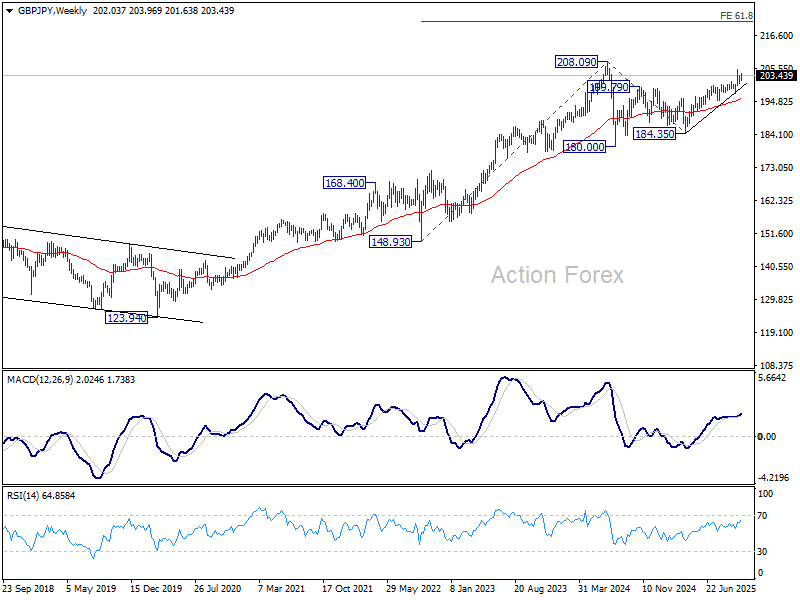
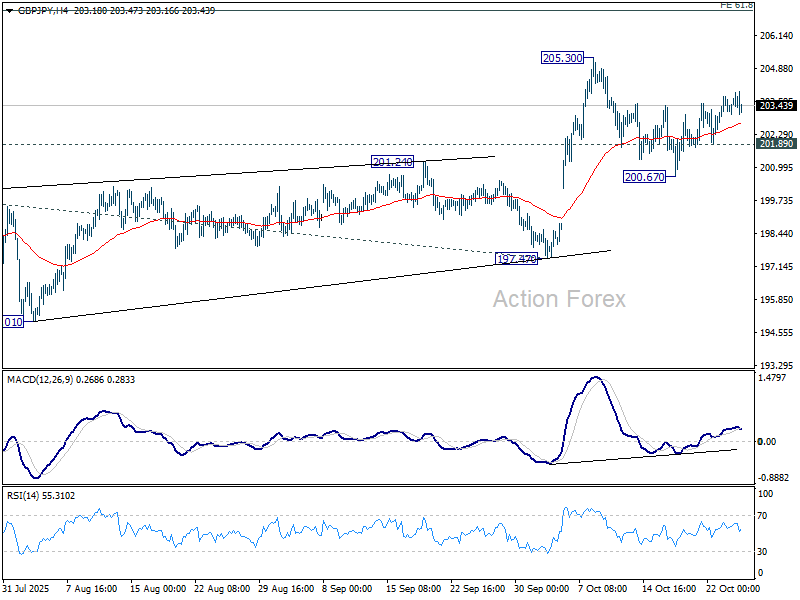
GBP/JPY's rebound last week suggests that pullback from 205.30 has completed at 200.67 already. Initial bias stays mildly on the upside for retesting 205.30 first. Firm break there will resume larger rise to 61.8% projection of 184.35 to 199.96 from 197.47 at 207.11. However, break of 201.89 will turn bias to the downside to extend the pattern from 205.30 with another falling leg.
In the bigger picture, price actions from 208.09 (2024 high) are seen as a corrective pattern which might have completed at 184.35. Firm break of 208.09 high will resume the up trend from 123.94 (2020 low). Next target is 61.8% projection of 148.93 to 208.09 from 184.35 at 220.90. However, decisive break of 197.47 support will dampen this view and extend the corrective pattern with another fall.
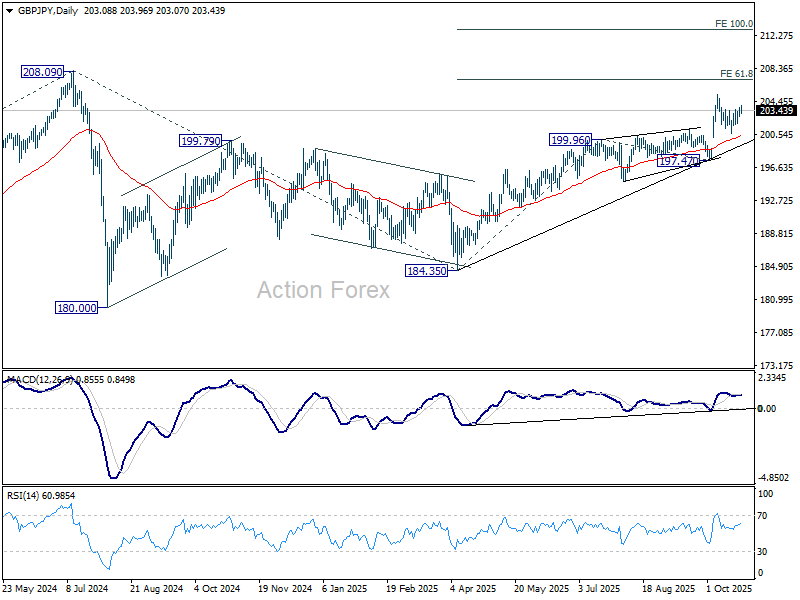
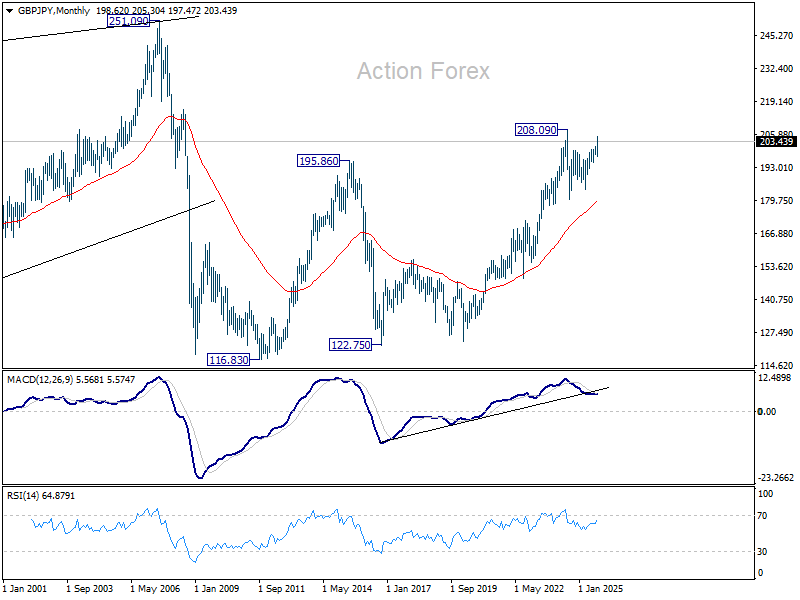
In the long term picture, there is no sign that the long term up trend from 122.75 (2016 low) has concluded. But firm break of 208.09 is needed to confirm resumption. Otherwise, more medium term range trading could still be seen.