Sample Category Title
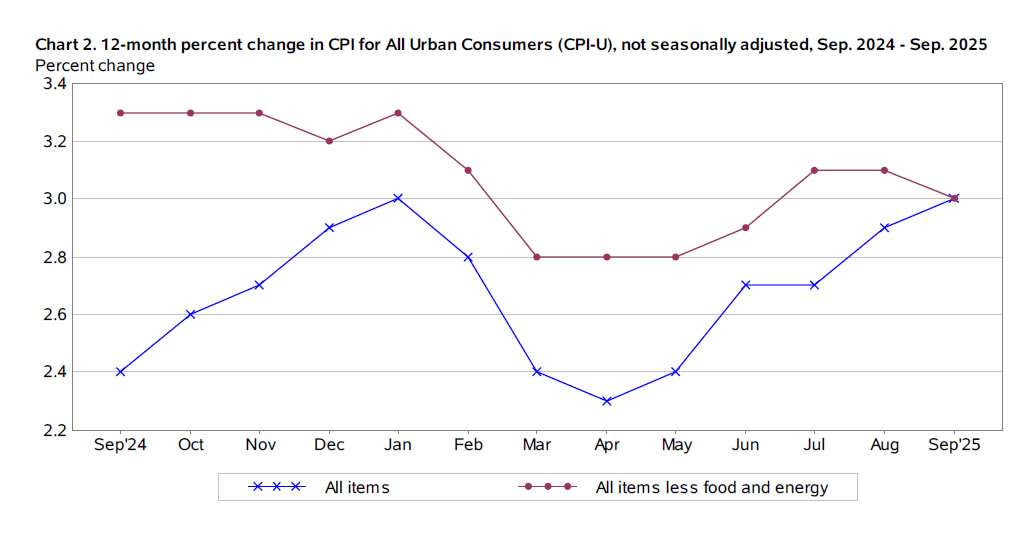
US CPI rises to 3.0%, but core eases, both miss expectations
US inflation ticked higher in September, but the details of the report suggested price pressures are cooling beneath the surface. Headline CPI accelerated to 3.0% yoy, up from 2.9% but slightly below expectations of 3.1%. That marks the highest level since January.
Though, core CPI — excluding food and energy — slowed from 3.1% to 3.0%, undershooting forecasts and easing from 3.1% in the previous two months. After holding at 3.1% for two consecutive months, the core rate could be entering into a gradual downtrend.
On a monthly basis, headline prices rose 0.3% mom, while core prices increased just 0.2%, both softer than expected. Energy costs were again the key driver of the headline gain, with the gasoline index surging 4.1% and the broader energy index up 1.5%. Food prices also continued to edge higher, rising 0.2% as grocery costs climbed more sharply than dining-out prices.
Nikkei 225: Bullish Trend Remains Intact for Another Potential All-Time High of 50,860/51,030
Key takeaways
- Japan 225 CFD Index rally: The Japan 225 CFD Index (Nikkei 225 proxy) reached an all-time high of 49,970 on optimism over PM Takaichi’s more than ¥13.9 trillion expansionary stimulus plan.
- Market pullback: The index declined 3.4% from its peak, suggesting investors had already priced in expectations of aggressive fiscal measures.
- Earnings momentum: Forward 12-month EPS growth for Nikkei 225 stocks rose to 9.3% in October from 7% in September, signaling an improving corporate outlook.
- Foreign inflows strengthen: Net foreign purchases of Japanese equities surged sharply, reinforcing continued medium-term bullish momentum for Japan’s equity market.
The Japan 225 CFD Index (a proxy of the Nikkei 225 futures) has rallied as expected and almost hit the first medium-term resistance of 50,090/50,220 highlighted in our previous publication. It printed a fresh all-time intraday high of 49,970 on 21 October 2025, on the backdrop of the newly appointed Japanese Prime Minister Takaichi’s plan for implementing an expansionary stimulus package that is likely to be more than 13.9 trillion yen that centered on measures to counter inflation, investment in growth industries, and national security.
However, the Japanese stock market appears to have already priced in expectations of an aggressive expansionary fiscal policy, as hinted in Prime Minister Takaichi’s previous speeches. The Japan 225 CFD Index has since declined by 3.4% from its all-time high on 21 October 2025, hitting an intraday low of 48,415 on Thursday, 23 October 2025.
This raises an important question, is the medium-term uptrend that has been in place since April 2025 at risk of reversing, given the potential for rising longer-term Japanese Government Bond (JGB) yields amid concerns over a widening fiscal deficit from Takaichi’s policy stance?
Fundamental, flow, and momentum factors are still supportive for a further potential progression of the ongoing medium-term uptrend phase for the Japan 225 CFD Index. Let’s examine each of them.
Nikkei 225 forward earnings growth has picked up
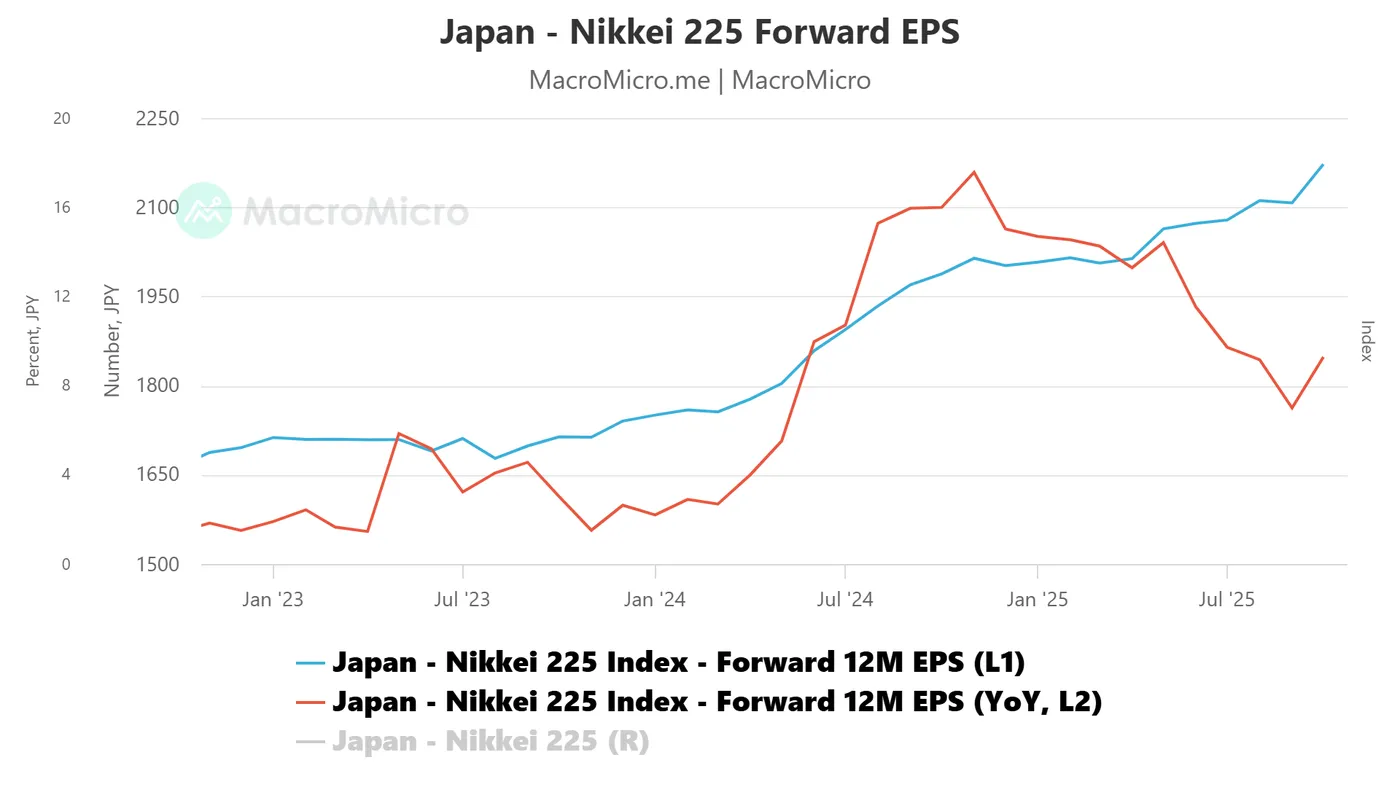
Fig. 1: Nikkei 225 forward 12-month forward EPS growth as of 23 Oct 2025 (Source: MacroMicro)
The forward 12-month earnings per share (EPS) growth for the component stocks of the Nikkei 225 in aggregate has started to improve after a slowdown in the past 11 months. The forward EPS growth of the Nikkei 225 has recently increased to 9.3% year-on-year in October 2025 from 7% in September 2025 (see Fig.1).
This earnings growth uptick suggests that more sell-side analysts have raised earnings projections for the Nikkei 225 for Q3 earnings results that may propel the Nikkei 225 higher.
Net foreign inflows into the Japanese stock market have increased significantly
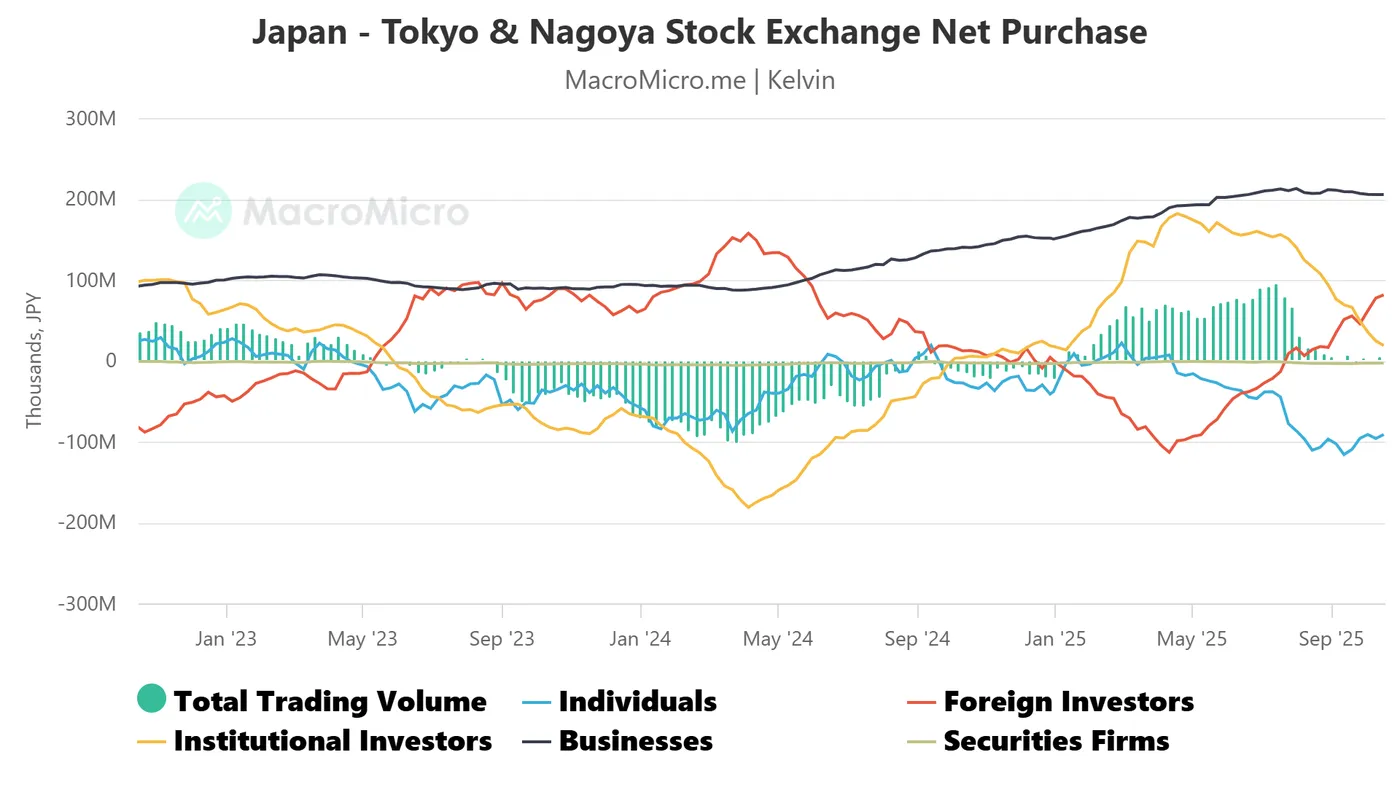
Fig. 2: Net purchases of Tokyo & Nagoya stock exchanges as of 17 Oct 2025 (Source: MacroMicro)
The 52-week average of net purchases of Japanese equities listed on the Tokyo and Nagoya stock exchanges has jumped by a significant amount from 6.2 billion in the week of 8 August 2025 to 81.5 billion as of 17 October 2025 (see Fig. 2).
We shall focus on the short-term (1 to 3 days) trajectory, key elements, and key levels to watch on the Japan 225 CFD Index from a technical analysis/momentum perspective.
Preferred trend bias (1-3 days) – Oscillating within minor & medium-term ascending channels
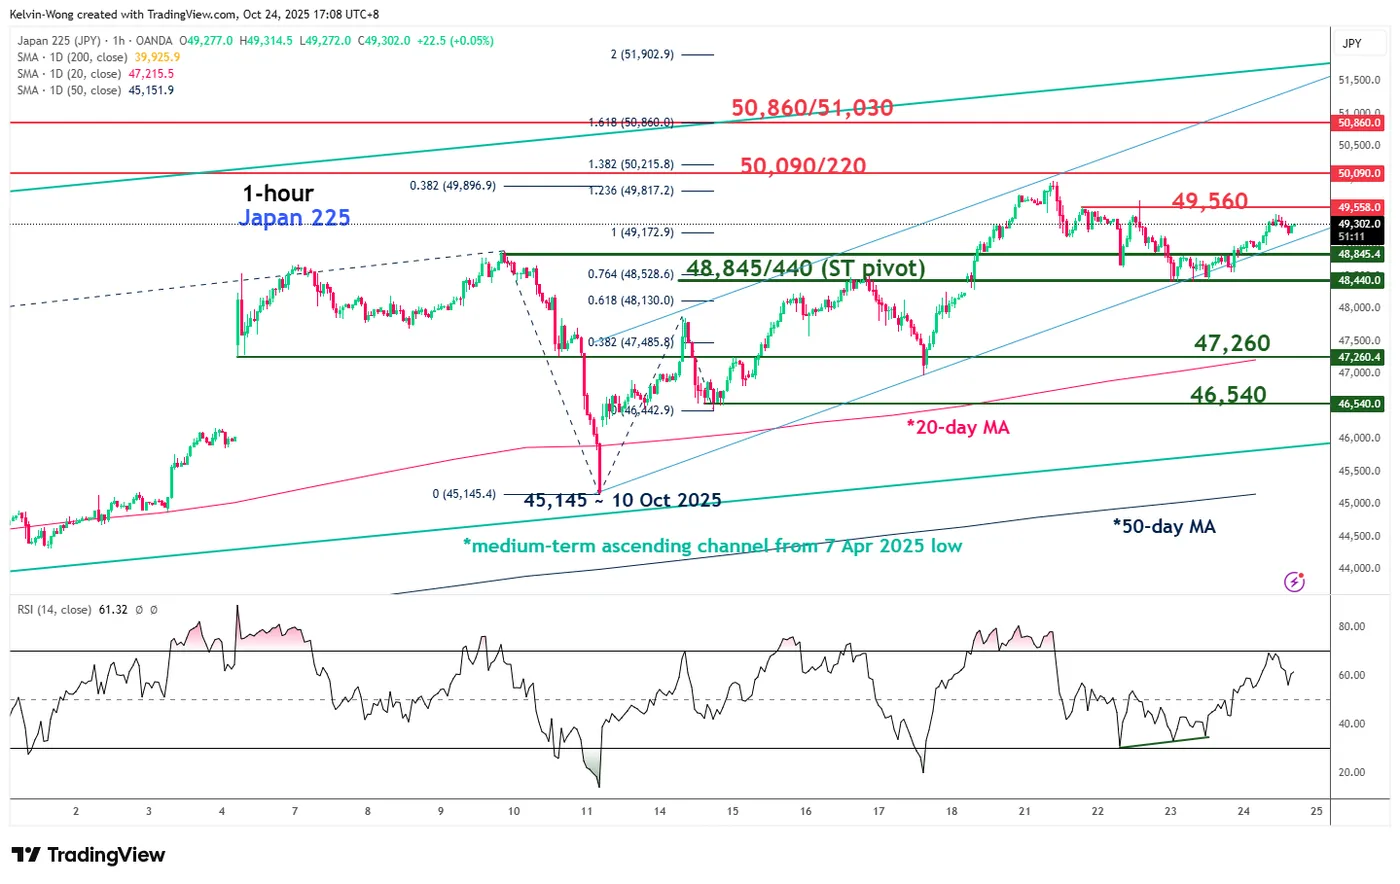
Fig. 3: Japan 225 CFD Index minor trend as of 24 Oct 2025 (Source: MacroMicro)
Maintain bullish bias with 48,845/48,440 as key short-term pivotal support for the Japan 225 CFD Index. A clearance above 49,560 key near-term resistance (upside trigger) opens up scope for the next resistances to come in at 50,090/50,220 and 50,860/51,030 (Fibonacci extension cluster) (see Fig. 3).
Key elements
- Since the key minor swing low of 45,145 on 10 October 2025, induced by US President Trump’s “China trade tariffs bashing”, the price actions of the Japan 225 have been oscillating within a minor ascending channel.
- The hourly RSI momentum indicator of the Japan 225 CFD Index has continued to show a bullish momentum condition since its bullish divergence signal on Wednesday, 22 October 2025.
Alternative trend bias (1 to 3 days)
A break below the 48,845/48,440 key short-term support negates the bullish tone for another extension of the minor corrective decline towards the next intermediate support at 47,260 (also the 20-day moving average).
BTC/USD Chart Analysis: Will October Be Bullish?
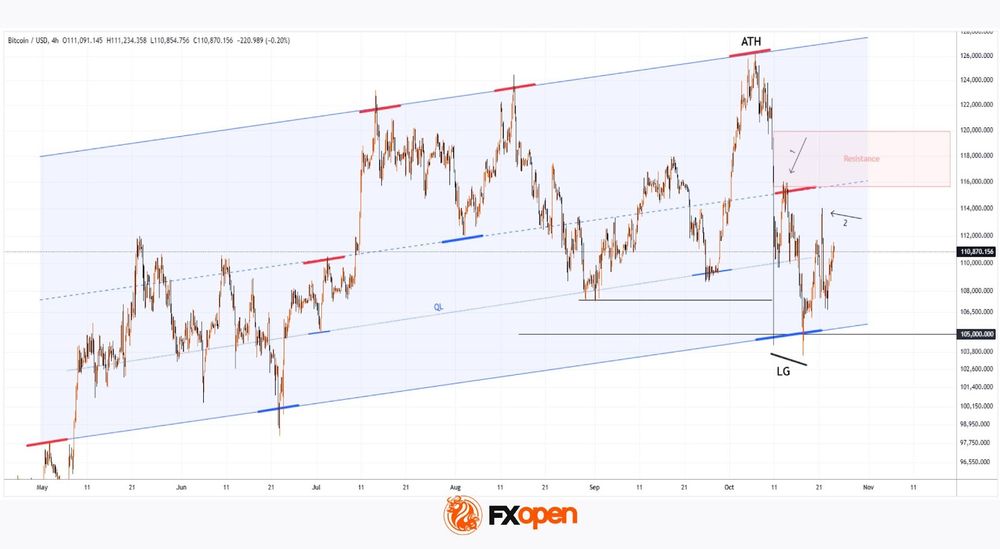
At the start of the month, the BTC/USD rate was hovering around $115k. Historically, October and November have been months when the price of the leading cryptocurrency has shown its strongest gains. A rise towards a new all-time high (ATH) could have continued this “tradition”; however, following Trump’s statement about the potential introduction of 100% tariffs on trade with China, the coin’s price plummeted to $105k. And although the meeting between US and Chinese leaders scheduled for 30 October was expected to ease some concerns, as we can see, Bitcoin’s price has not yet fully recovered from the shocking crash on 10 October. The question of whether the month will turn out to be bullish therefore remains open.
BTC/USD chart analysis shows that price fluctuations since early May have formed an ascending channel, with key reversals marked in red and blue.
Bullish Perspective
Recent news has created a positive fundamental backdrop:
→ Trump has pardoned Binance founder Changpeng Zhao (known as CZ), who in turn suggested that Bitcoin’s market capitalisation could surpass that of gold.
→ Analysts at VanEck believe that the market remains bullish, and that the October decline is merely a correction.
Notably, in October Bitcoin’s price dipped below several key support levels:
→ On 10 October it fell below the September low and the psychological $105k level.
→ On 17 October – below the 10 October low.
The subsequent rebounds confirm that:
→ the lower boundary of the channel remains relevant;
→ buyers were aggressive and successful, as Bitcoin’s price quickly rebounded towards $110k.
From this, it is reasonable to assume that in October, Smart Money used selling flows to build long positions (the 17 October drop resembles a Liquidity Grab pattern).
Bearish Perspective
The wide range between $116k and $120k appears to be a strong resistance zone, as sellers held clear dominance there just two weeks ago.
Arrows on the chart indicate that selling pressure was both aggressive and effective:
1 → pushing the price down from the blue median;
2 → around the $114k level this week.
Conclusion
At present, Bitcoin’s price is near the QL line, which divides the mentioned channel into its two lower quarters – an area where the price may find short-term balance. Today’s US inflation data release will largely determine the next move:
→ upward towards the median (which would improve the chances of a bullish October);
→ downward towards the channel’s lower boundary (which would once again test the bulls’ ability to defend the $105k level).
FXOpen offers the world's most popular cryptocurrency CFDs*, including Bitcoin and Ethereum. Floating spreads, 1:2 leverage — at your service. Open your trading account now or learn more about crypto CFD trading with FXOpen.
*Important: At FXOpen UK, Cryptocurrency trading via CFDs is only available to our Professional clients. They are not available for trading by Retail clients. To find out more information about how this may affect you, please get in touch with our team.
This article represents the opinion of the Companies operating under the FXOpen brand only. It is not to be construed as an offer, solicitation, or recommendation with respect to products and services provided by the Companies operating under the FXOpen brand, nor is it to be considered financial advice.
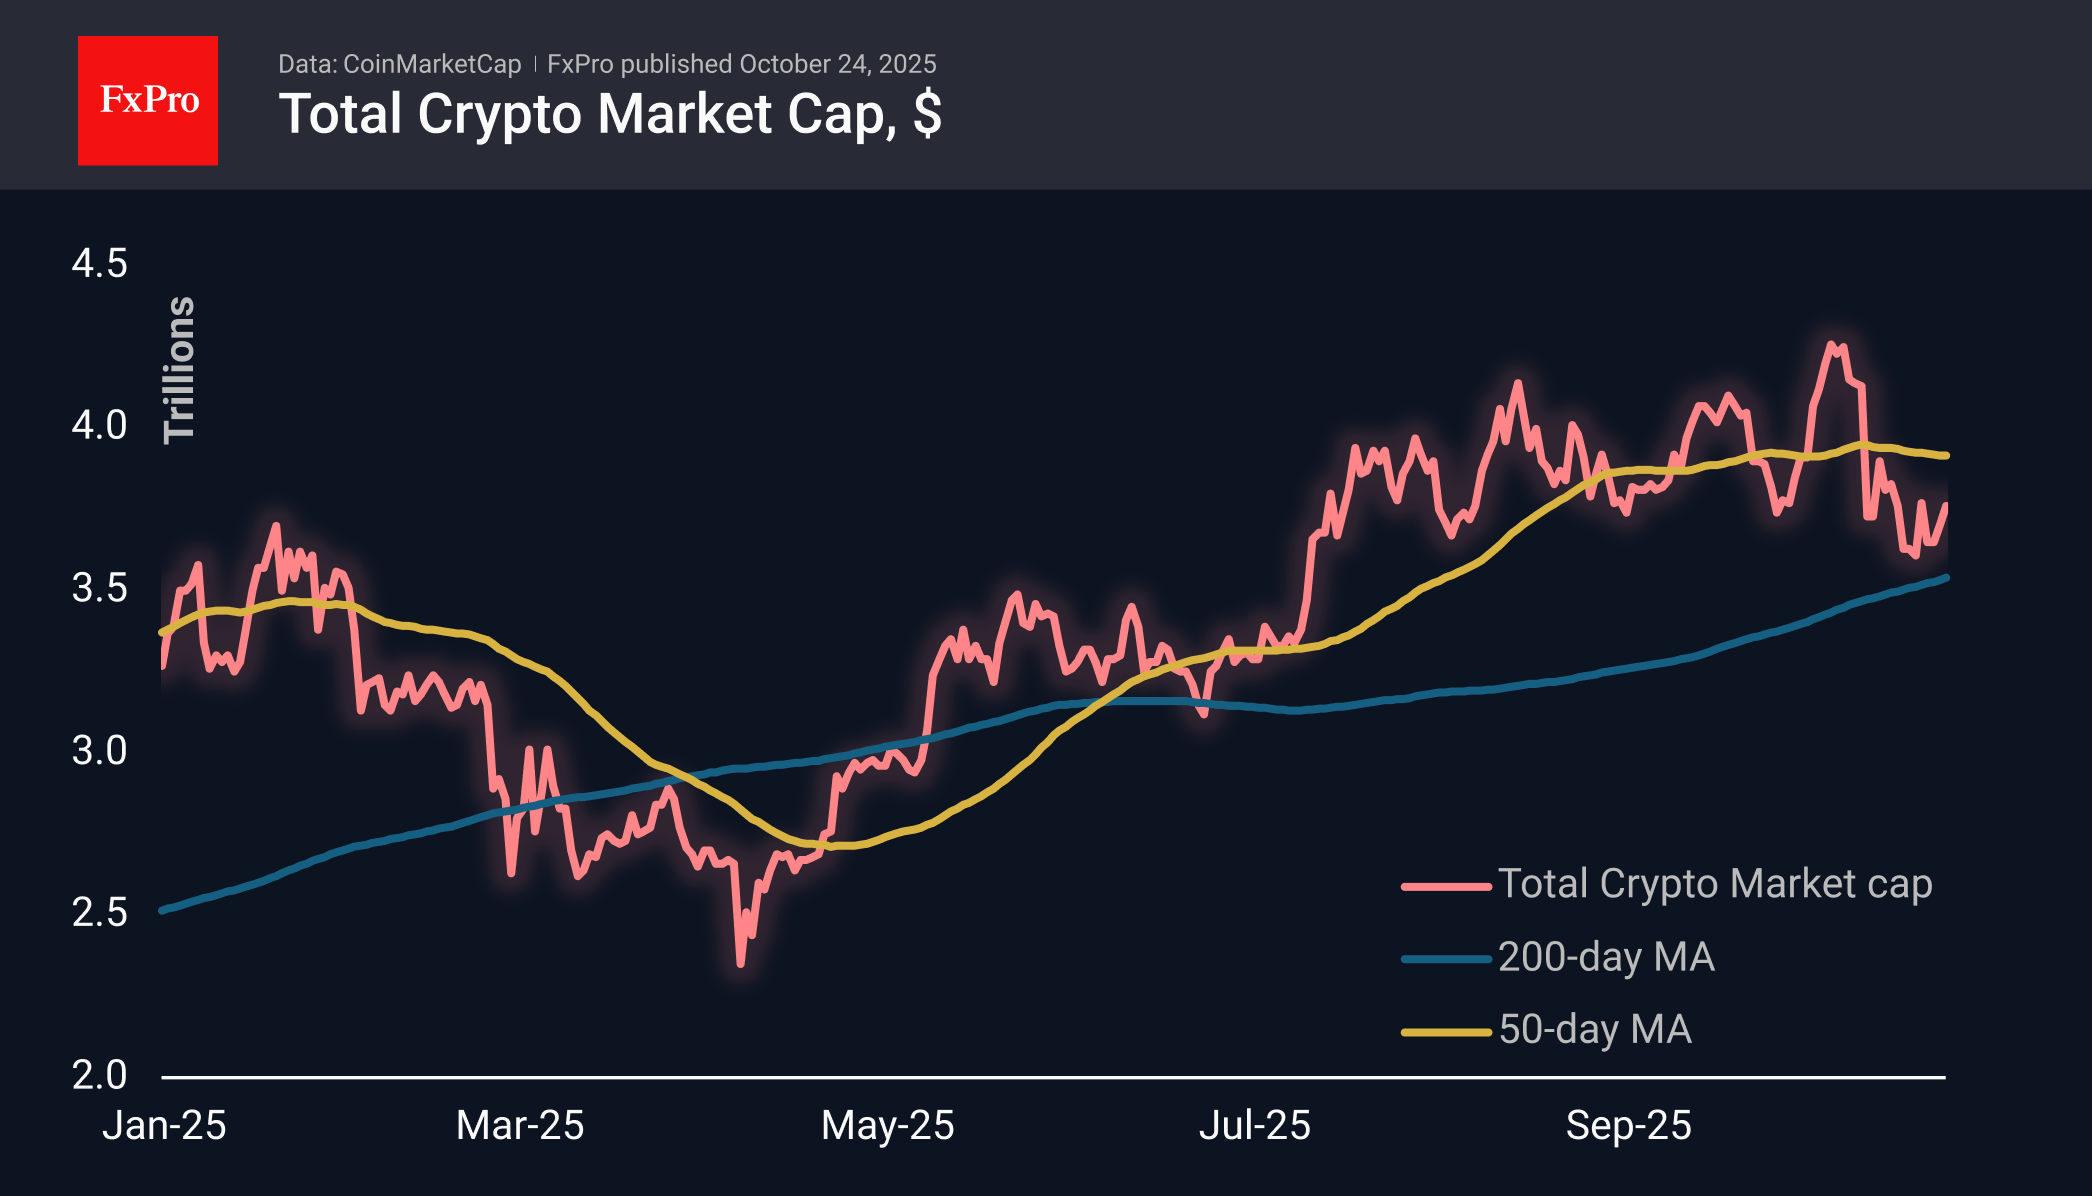
Crypto Market Recovering, But Fears Friday
Market Overview
The crypto market capitalisation grew by 1.5% in 24 hours to $3.76 trillion. This is a return to the highs seen at the start of the week. A reversal below this level will be further confirmation of the formation of a sequence of declining local peaks. The last two Fridays have been bearish, so there is a risk that a reflex will form with increased selling before the weekend.
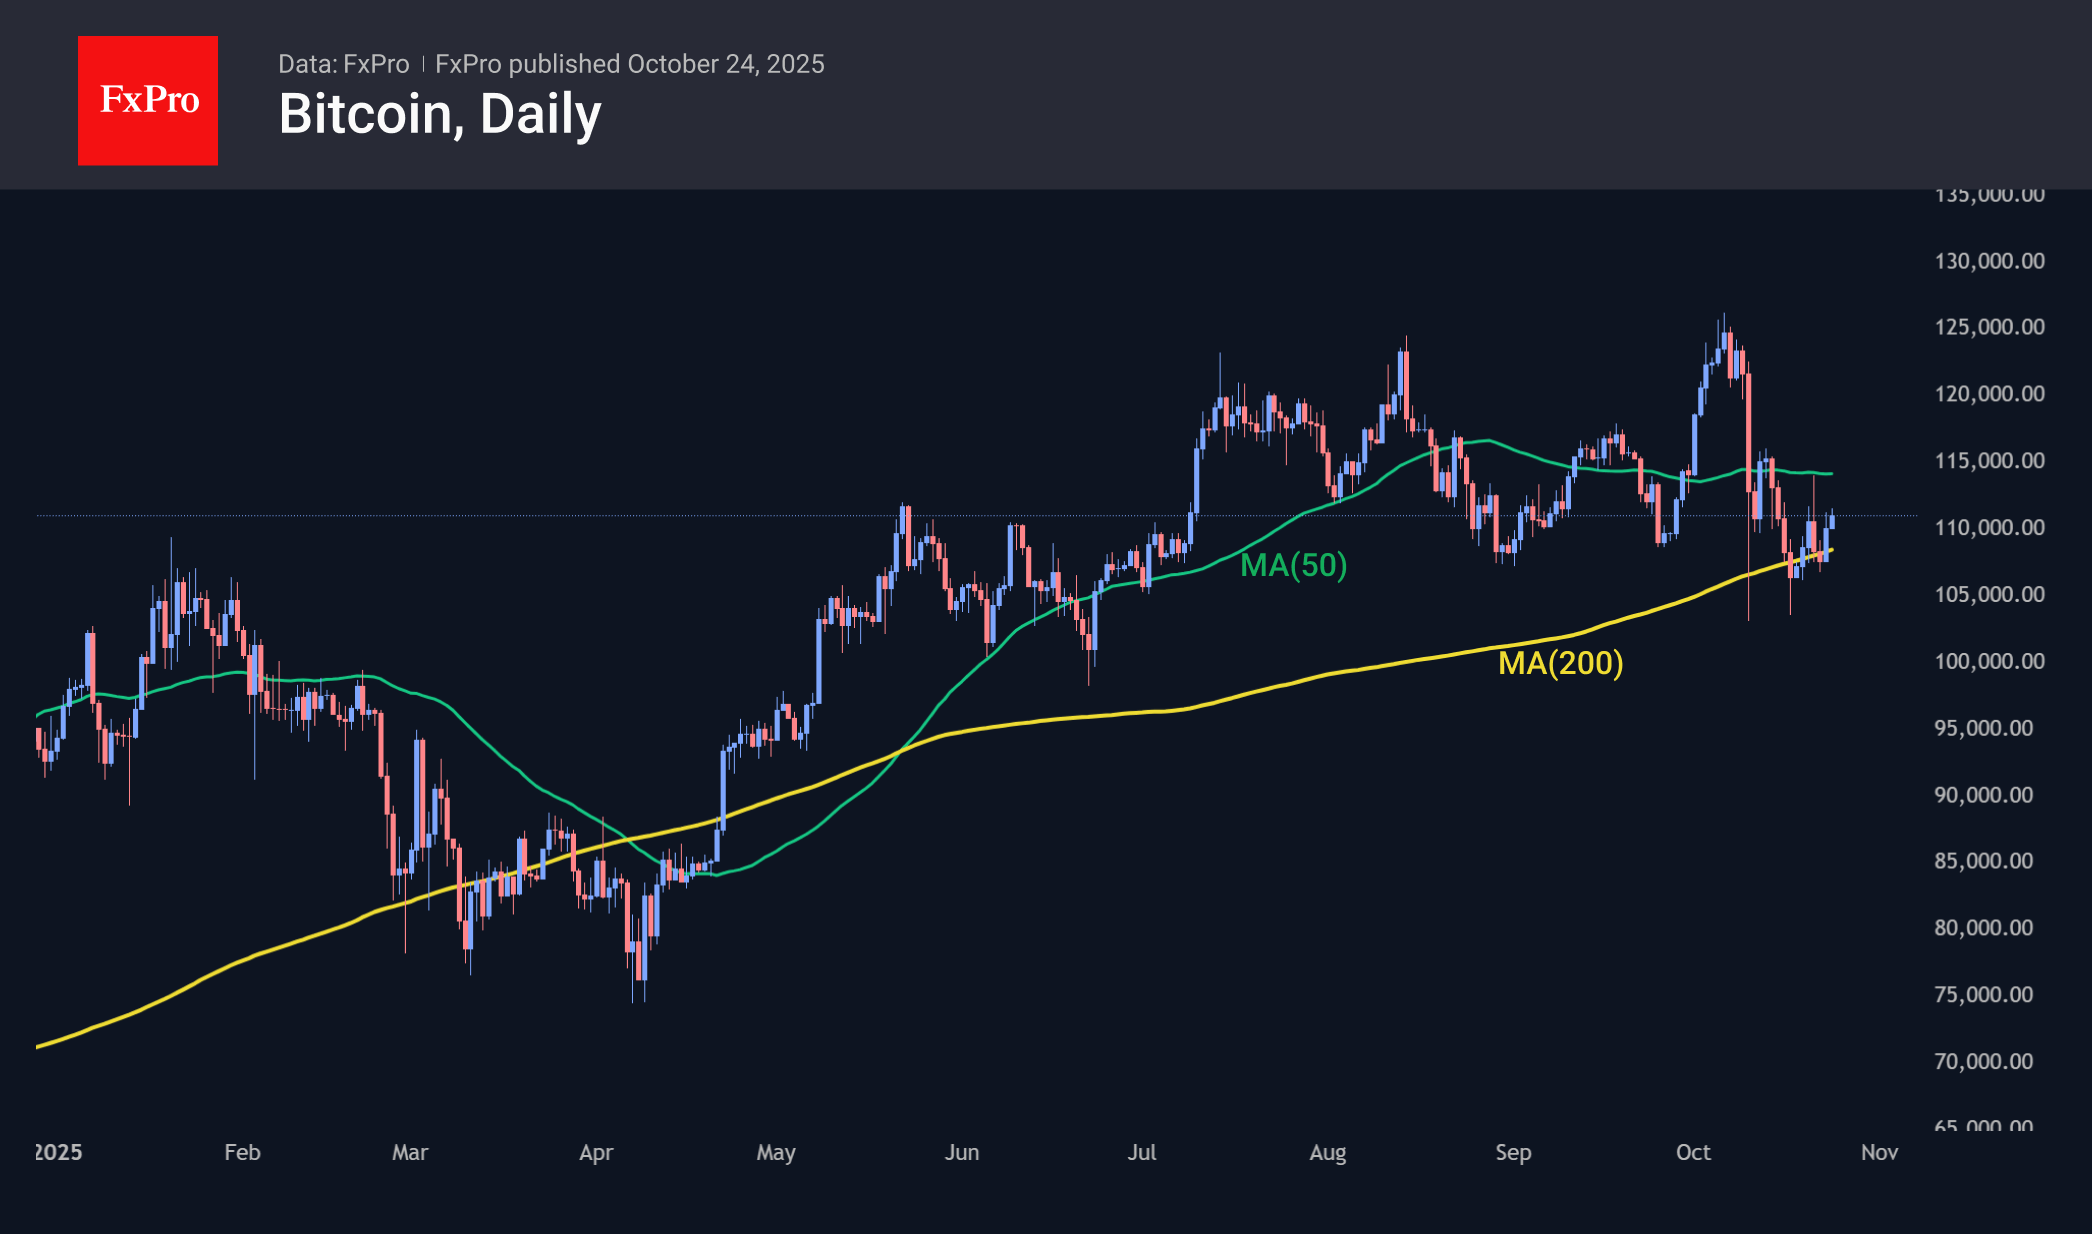
Bitcoin is trading near $111K, close to Thursday’s intraday highs and Monday’s downward reversal area. From a technical analysis perspective, BTCUSD remains trapped between the 200-day moving average below (around $108.5K) and the 50-day moving average above (just above $114K). A sustained breakout from this range could signal further movement in the direction of the breakout.
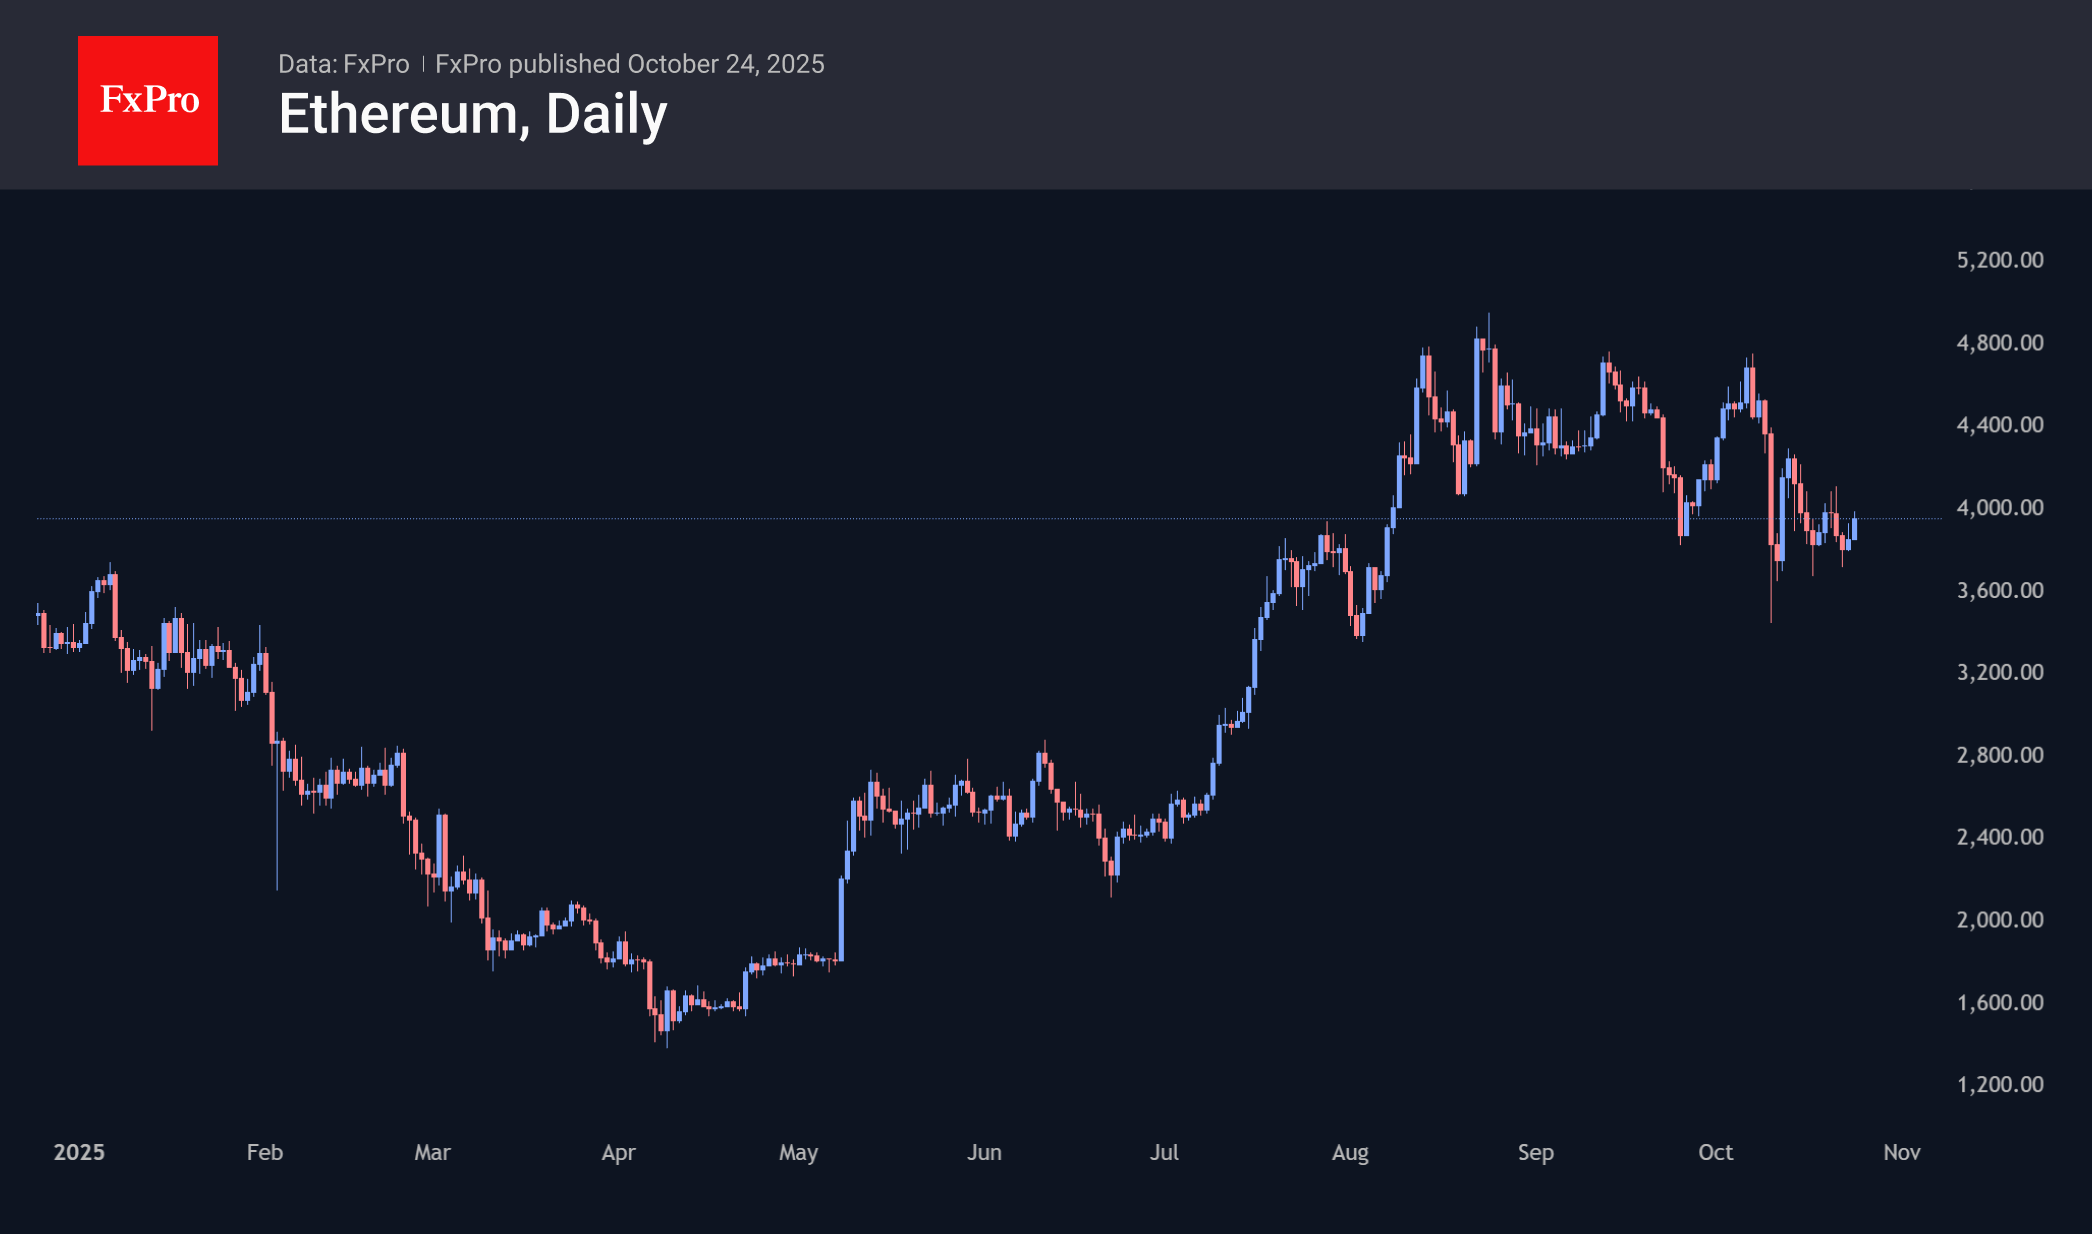
Ethereum is up 2.7% since the start of the day on Friday, again approaching $4,000. Over the past two weeks, the area around $3,700 has proven to be an important support level. Whether it will continue to withstand further pressure from sellers depends on global market sentiment and the outcome of BTC’s breakout from the range.
News Background
Speculative activity in the market is declining, and recent cryptocurrency buyers are experiencing ‘financial stress,’ which is a sign of a cooling market, Glassnode notes. However, historically, such periods have often led to price stabilisation.
Open interest in Bitcoin options has reached record highs, driven by increased demand for puts. BRN warns of increased volatility and the risks of a continued correction in the first cryptocurrency.
The days of self-storage of cryptocurrencies are coming to an end, as large players increasingly prefer ETFs due to tax benefits and improvements in institutional infrastructure, according to Uphold.
Since January, the volume of transactions with stablecoins has reached $46 trillion, 106% more than in the same period last year. A16z Crypto considers this factor to be the main indicator of the maturity of the crypto industry.
US President Donald Trump has pardoned former Binance CEO Changpeng Zhao. According to White House press secretary Caroline Levitt, ‘Zhao was prosecuted by the Biden administration as part of their war on cryptocurrencies.’
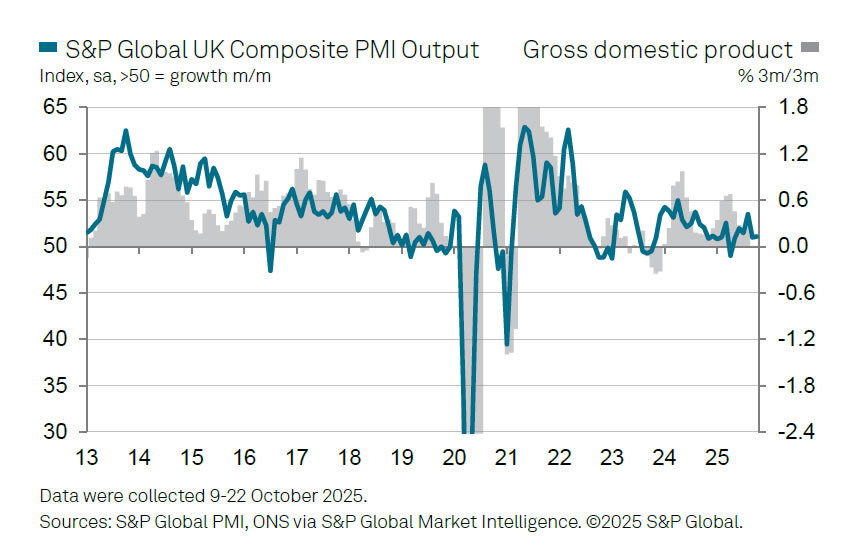
UK PMI composite improves to 51.1, but indicates just sluggish 0.1% GDP growth
The latest UK flash PMI data offered a glimmer of optimism for the economy, with Manufacturing jumping from 46.2 to 49.6 in October — its highest level in 12 months. Services rose from 50.8 to 51.1, lifting the Composite index from 50.1 to 51.1. The survey suggests business conditions are slowly improving after a soft September, marking the first sign of renewed momentum since midyear.
Chris Williamson, Chief Business Economist at S&P Global Market Intelligence, said the data “brings hope that September was a low point,” noting the first manufacturing growth in over a year and stronger consumer demand for services. He added that inflationary pressures are easing back toward levels “consistent with the Bank of England’s 2% target,” while job losses are moderating and business confidence is ticking up slightly.
Still, the overall pace of expansion remains modest, consistent with GDP growth of only about 0.1%. Export weakness persists due to global trade disruptions tied to U.S. tariff policy. Firms are also cautious ahead of the November 26 Budget, with many delaying hiring and investment decisions. While the PMI data point to stabilization, the recovery remains fragile and heavily dependent on fiscal clarity and external demand.
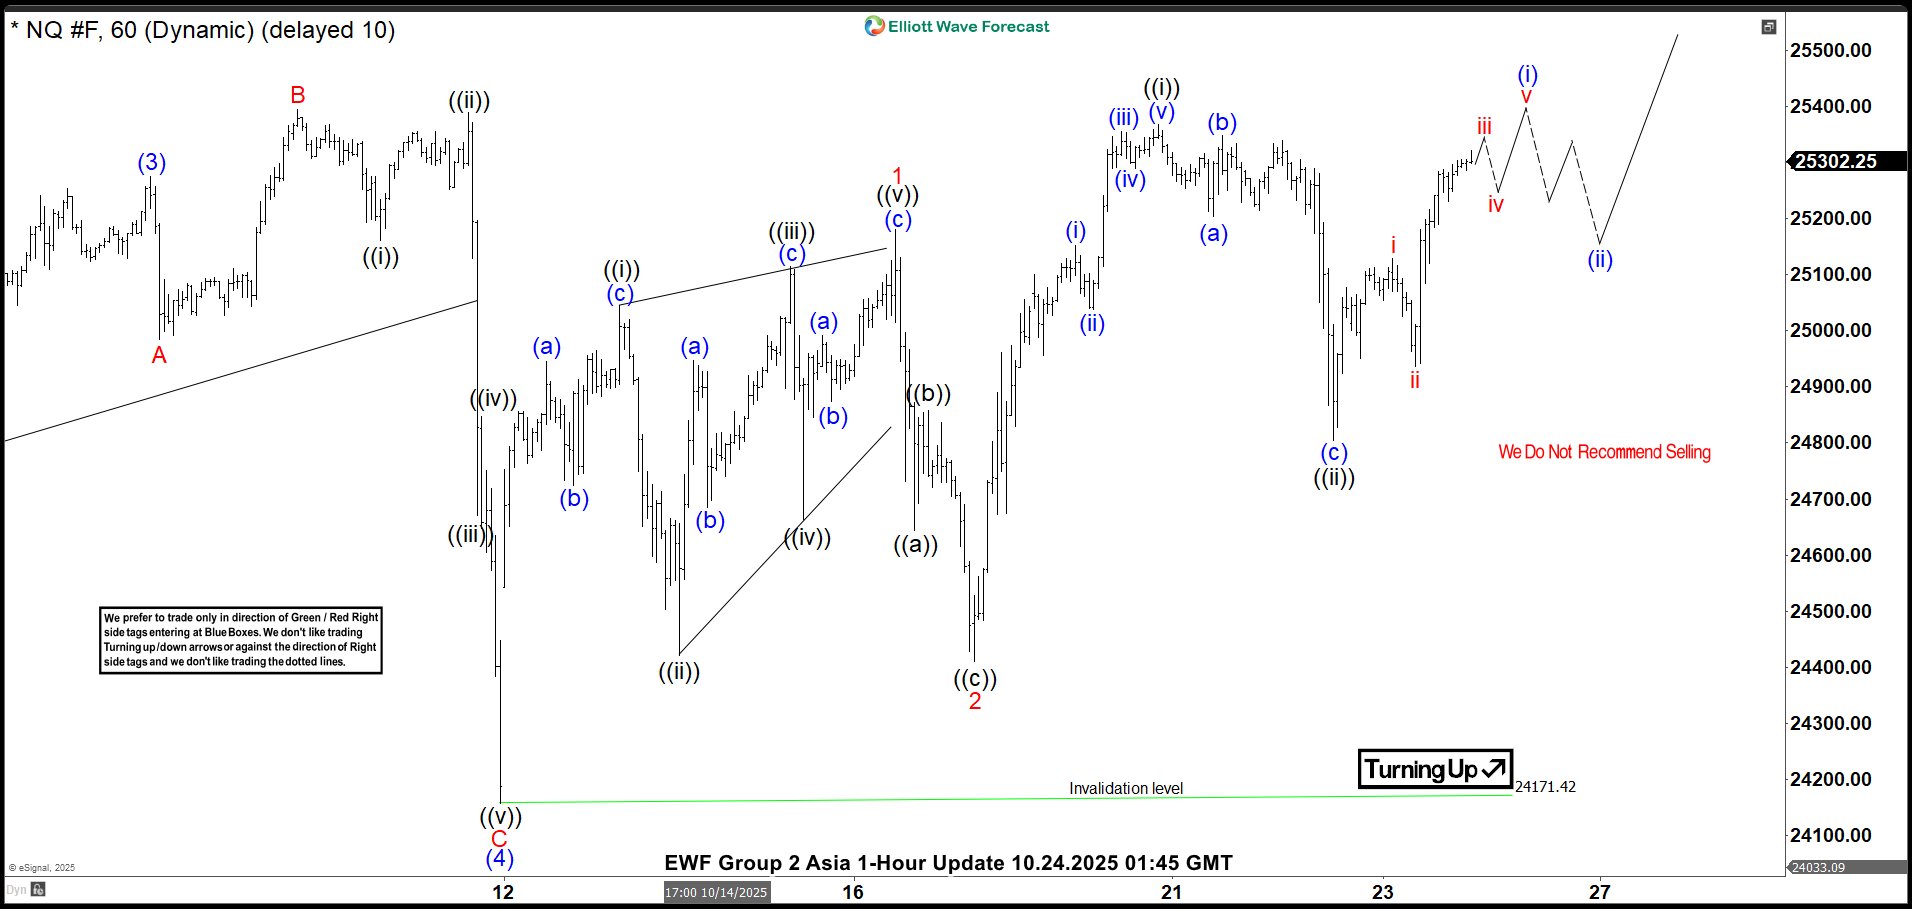
Nasdaq Futures (NQ) Targeting Wave (5) Upside Within Cycle Wave from April 2025 Low
Nasdaq Futures (NQ) advances steadily toward completing the cycle that originated at the April 7, 2025 low. The index targets a fresh all-time high. This rally develops as a textbook impulsive structure. Wave (3) culminated at 25,275. Wave (4) then corrected lower and finished at 24,166.26. The 1-hour chart captures this progression clearly.
The internal structure of wave (4) took the form of an expanded flat. Wave A ended at 24,984.75. The Index then rallied in Wave B to 25,394. Wave C completed the pattern with a decline to 24,166.26. Wave (5) now drives the index higher. From the wave (4) low, wave 1 rose to 25,179.5 and formed a leading diagonal. Wave 2 pulled back to 24,410. The advance then nested with wave ((i)) peaking at 25,368 and wave ((ii)) finding support at 24,804.75. This nesting confirms the underlying bullish trend.
Provided prices hold above 24,166.26, any near-term dip should attract buyers at the 3, 7, or 11 swing levels, aligning with structural support zones. Upside momentum remains intact. The minimum target extends from the October 21, 2025 high. An inverse Fibonacci retracement of 123.6% to 161.8% yields a range of 25,490 to 25,701, consistent with classic wave extensions.
Nasdaq Futures (NQ) Latest 1-Hour Elliott Wave Chart From 10.24.2025
NQ Elliott Wave Video:
https://www.youtube.com/watch?v=2waDhCJULTw
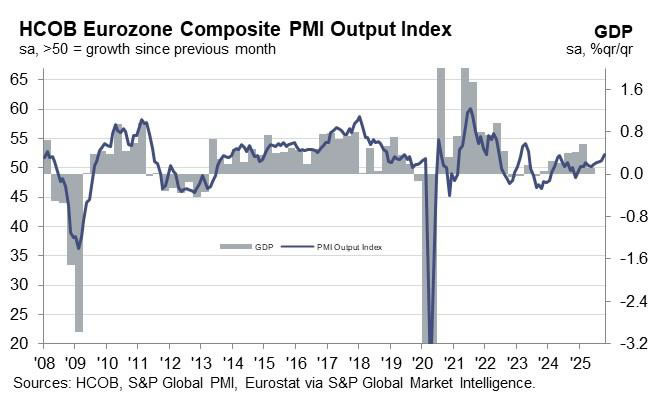
Eurozone PMI composite hits 17-mont high, services lead while France drags
Eurozone business activity accelerated in October, with PMI Composite rising to a 17-month high of 52.2 from 51.2, signaling the strongest expansion since mid-2024. The pickup was driven by services, where PMI Services index jumped from 51.3 to 52.6, a 14-month high, while Manufacturing finally edged up to the neutral 50.0 mark after months of contraction.
However, the upturn remains uneven across major economies. Cyrus de la Rubia, Chief Economist at Hamburg Commercial Bank, noted that France has increasingly become a drag, with its rate of contraction accelerating for two straight months amid political turmoil and budget disputes under Prime Minister Sébastien Lecornu. In contrast, Germany’s outlook "brightened significantly", helping to lift the bloc’s overall figures. Still, manufacturing has been “stagnating for practically six months,” de la Rubia said, and weak new orders leave “little hope of a turnaround.”
Inflation trends offer some comfort for policymakers. Price pressures in the services sector — a key focus for the ECB — “remain moderate,” with sales price inflation slightly higher but still near long-term averages. The PMI data are therefore unlikely to alter the ECB’s cautious stance, reinforcing expectations that officials will hold off on further rate cuts until clearer signs of sustained disinflation emerge.
EUR/USD Consolidates Ahead of Potential Further Losses
Market sentiment remains dominated by escalating geopolitical tensions in Europe, which are dampening the euro's outlook and fuelling demand for traditional safe-haven assets, notably the US dollar.
The dollar's strength is further underpinned by the persistently hawkish rhetoric from the Federal Reserve. Officials continue to signal that interest rates will need to remain at their current levels for longer than previously anticipated. This stance is reinforced by resilient US inflation data, solidifying market expectations that the Fed will maintain its current policy course.
In stark contrast, the eurozone is grappling with a marked slowdown in business activity. The latest PMI data confirms a contraction across both manufacturing and services sectors. Against this deteriorating economic backdrop, the European Central Bank (ECB) has adopted a notably cautious tone, hinting at significant downside risks to growth. This growing monetary policy divergence with the US creates a fundamental imbalance, exacerbating the downward pressure on the single currency.
Consequently, the overall fundamental picture continues to favour the US dollar, suggesting further downside potential for the EUR/USD pair.
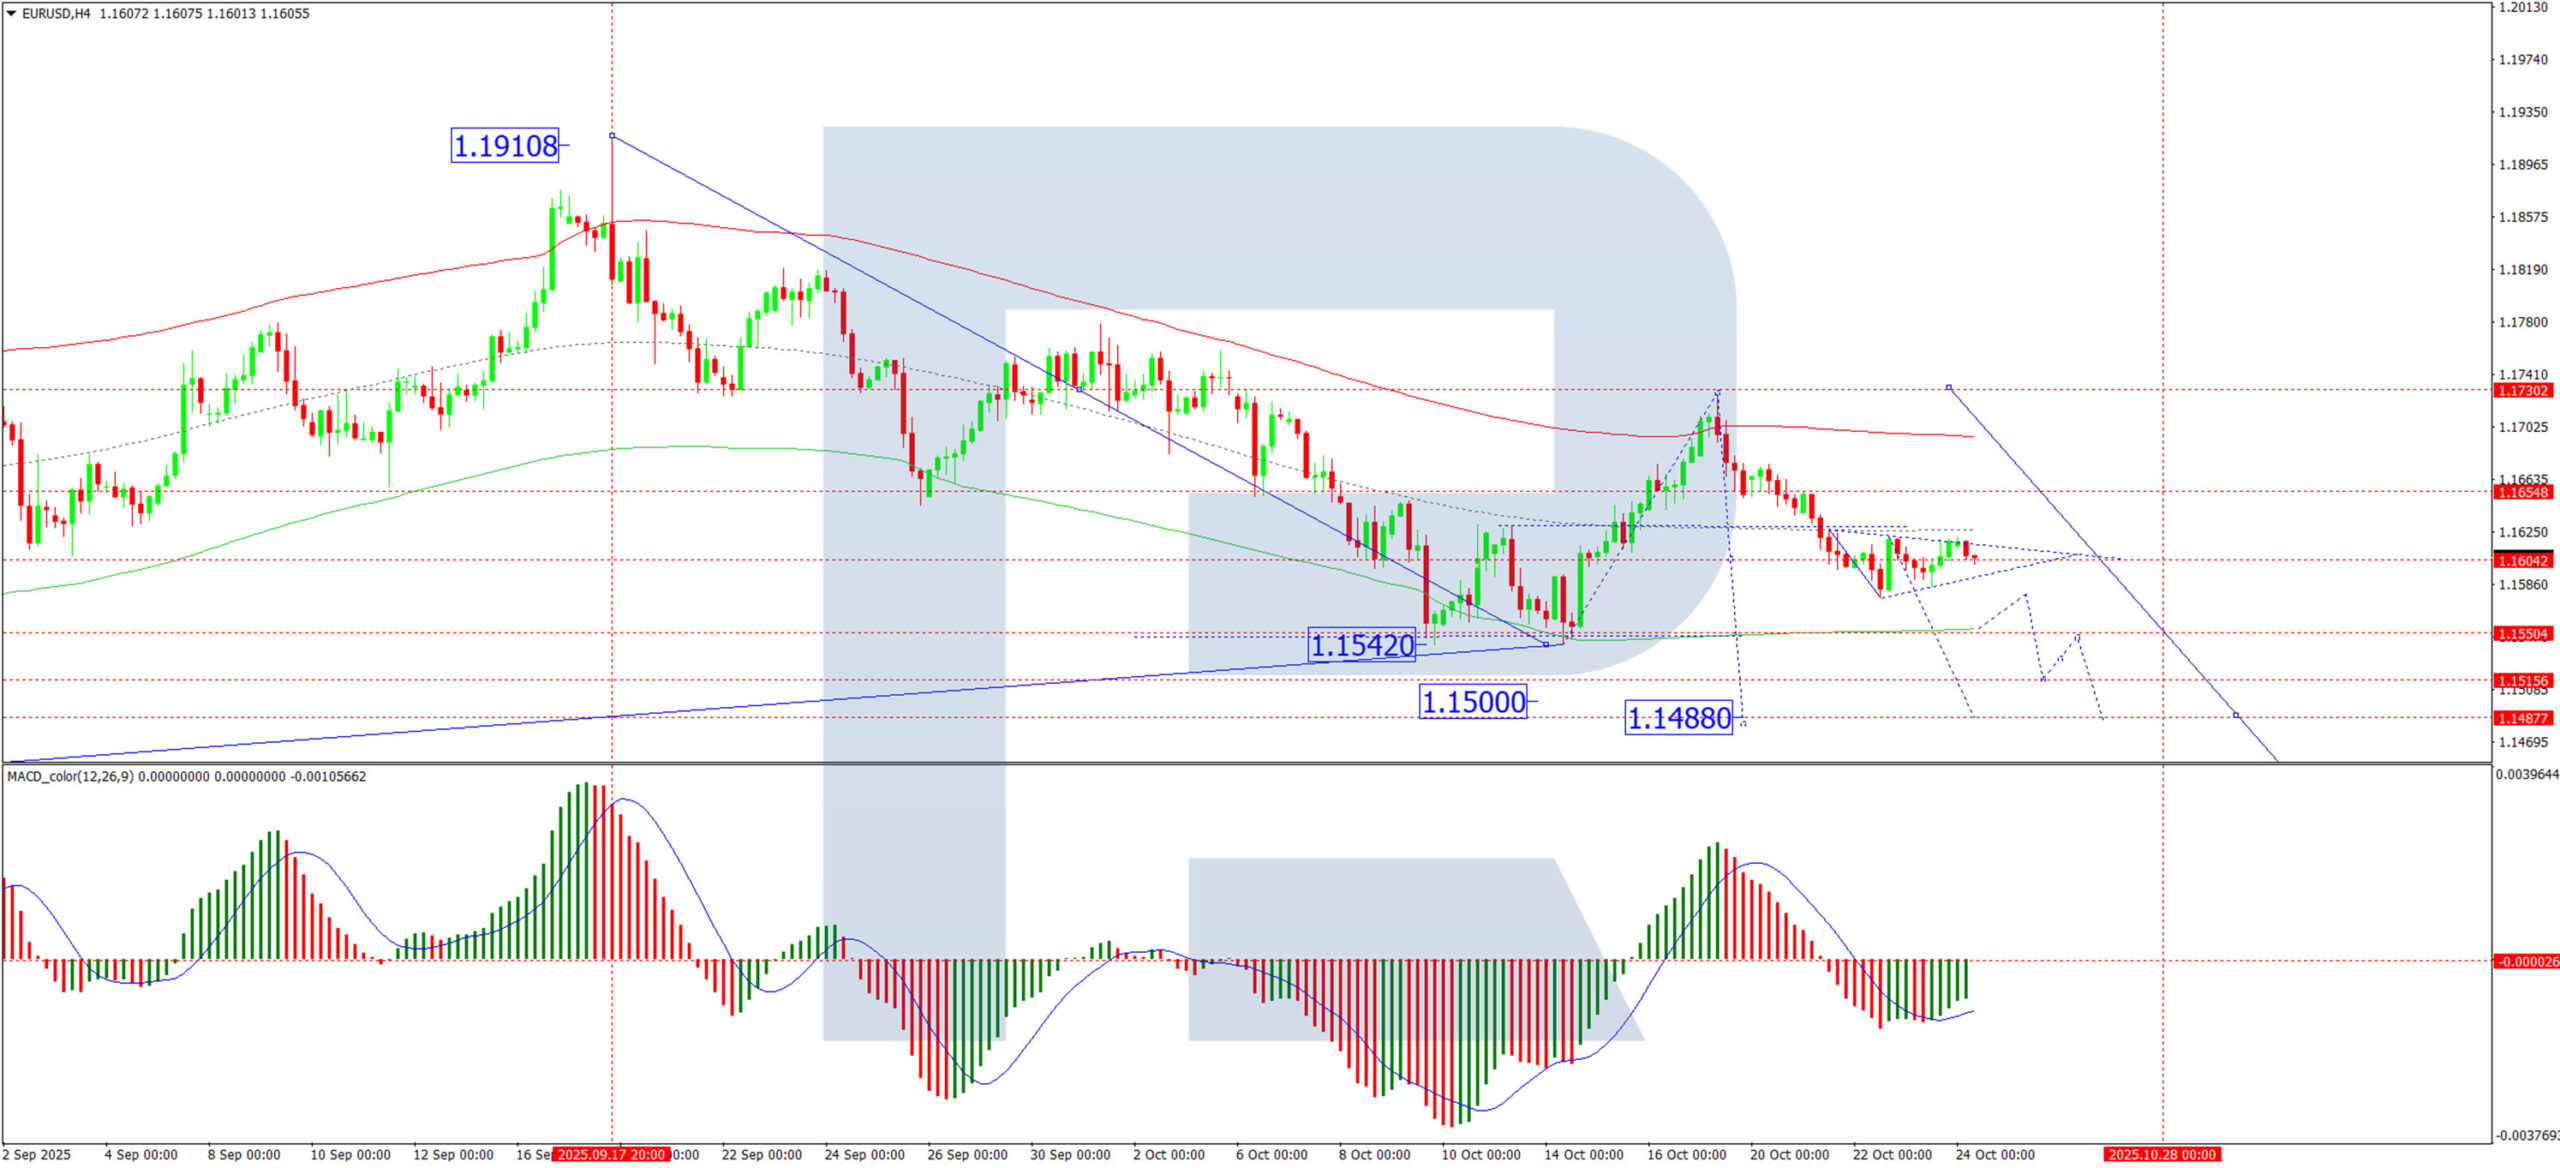
Technical Analysis: EUR/USD
H4 Chart:
On the H4 chart, EUR/USD is forming a tight consolidation range around the 1.1600 level, following a clear impulsive decline. This price action suggests the development of a third wave down. A decisive break below this consolidation range would signal the resumption of the bearish impulse, with an initial target at 1.1488. This bearish technical outlook is confirmed by the MACD indicator, whose signal line remains below zero and is pointing downward, indicating sustained selling momentum.
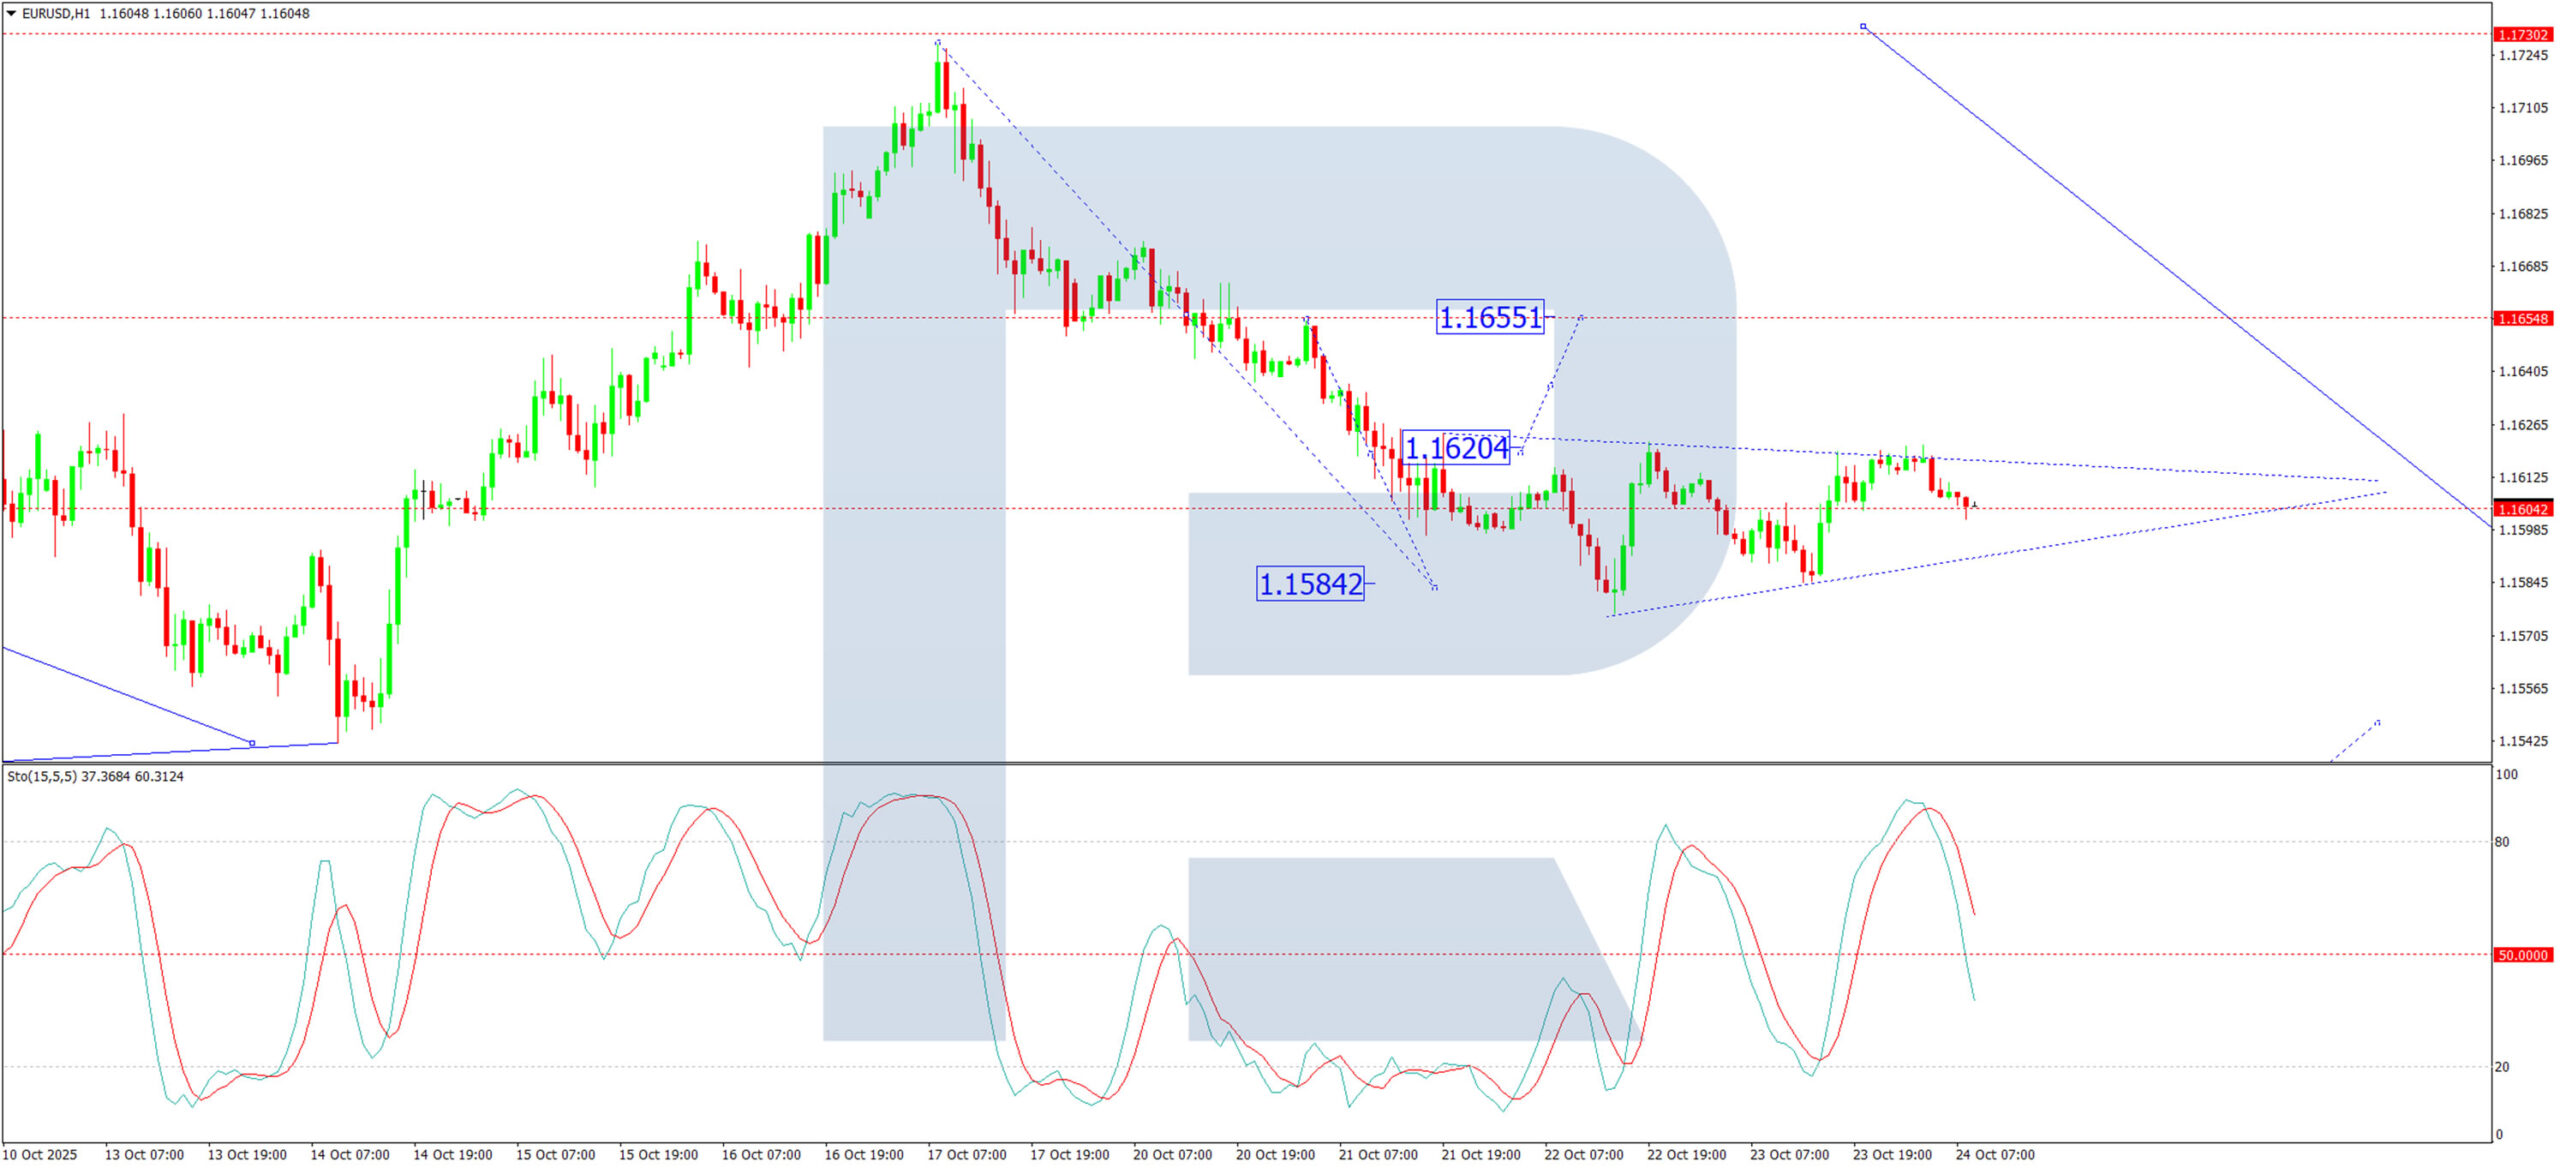
H1 Chart:
The H1 chart shows the completion of a downward wave to 1.1576, followed by a corrective move to 1.1620, effectively outlining the current consolidation zone. A break above this range could trigger a short-lived correction towards 1.1655 before the broader downtrend resumes, targeting 1.1500. Conversely, a break below the range would directly activate the bearish wave towards 1.1488, which is projected to complete the first leg of the larger third wave down. The Stochastic oscillator aligns with this view, with its signal line turning down from the 80 level and heading towards 20, reflecting building bearish momentum in the short term.
Conclusion
The combination of a supportive fundamental backdrop for the dollar and a deteriorating outlook for the eurozone maintains a bearish bias for EUR/USD. Technically, the pair appears to be pausing within a broader downtrend, with a breakdown below 1.1600 likely to trigger the next leg lower towards 1.1488.
WTI Oil: Crude Rallies Above $60 on Fresh US Sanctions and US Million-Barrel Purchase
Finding support at 6-month lows of around $56.40 per barrel, WTI has rallied just shy of 8.6% in the last three sessions alone.
Currently trading at $62.04, up 4.10% in yesterday’s session, recent performance marks the best three-day stint since late July.
As ever, let’s take a look at some of the macro themes at play, followed by some technical analysis as we attempt to answer the immortal question: what’s next for WTI?
WTI (West Texas Intermediate): Key takeaways 24/10/2025
- Gapping up 1.1% at Thursday’s open, WTI crude has found renewed buying support on new sanction announcements from the United States on leading Russian oil companies, including Rosneft and Lukoil
- Constrained previously by logistical problems of safe storage, and of course, funding issues, the US Department of Energy confirmed on Tuesday its intentions to purchase 1 million barrels of crude oil to replenish reserves, bolstering crude gains
- Otherwise, and in the bigger picture, a cloud of oversupply fears lingers over crude oil markets, especially considering record output from non-OPEC+ members
WTI (West Texas Intermediate): Where were we?
It’s high time I returned to my commentary roots and wrote some more coverage on crude oil markets.
Although it would be fair to say that oil has played second fiddle to precious metals in recent months, both in terms of market interest and, indeed, performance.
With that said, this appears to be changing, with recent geopolitical developments offering some welcome upside and, crucially, boosting WTI pricing above $60 for the first time since earlier this month.
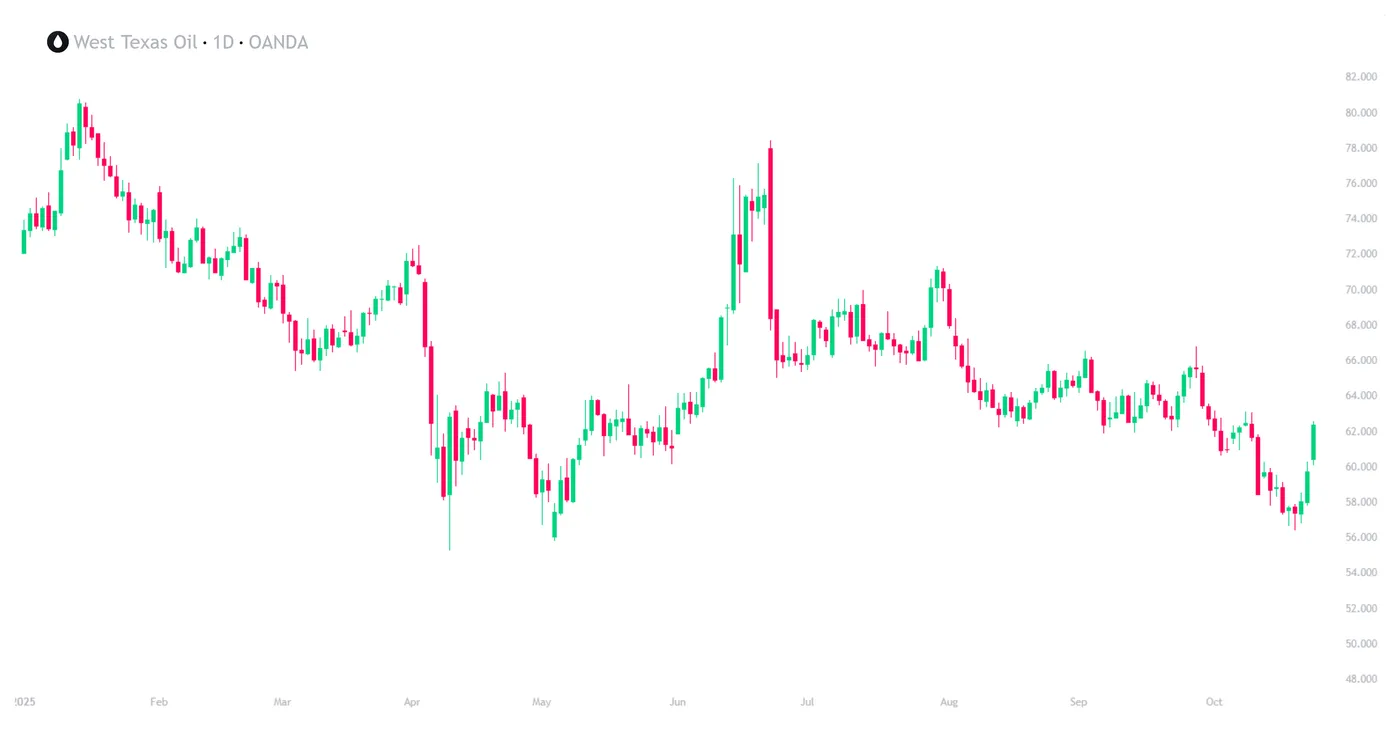
WTI Crude Oil (WTICOUSD), D1 year-to-date, OANDA, TradingView, 23/10/2025
Without further ado, let’s break down some major macroeconomic themes and conclude with some market technicals, including some price targets.
WTI (WTICOUSD): Fundamental Analysis 24/10/2025
New US sanctions on Russian oil: Reported Wednesday, the United States announced new sanctions on Russian oil exports, following an apparent breakdown in ceasefire negotiations between Russia and Ukraine.
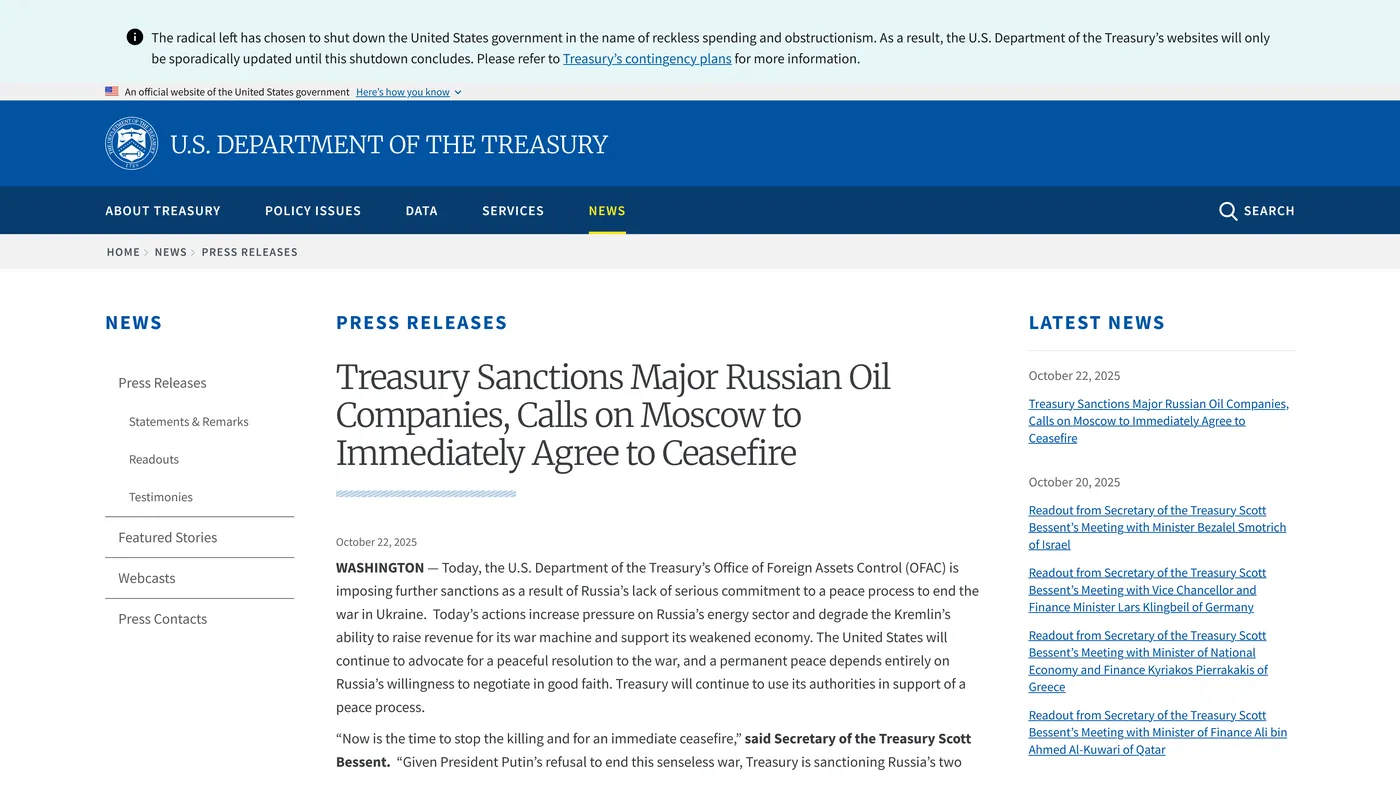
U.S. Department of the Treasury, Press Releases, 22/10/2025
Read the full press release here
Coming only one day after Trump shelved a planned meeting in Budapest with Putin, it would seem that frustrations are running high after the demands of an immediate ceasefire have fallen on deaf ears.
"I don’t want to have a wasted meeting. I don’t want to have a waste of time, so I’ll see what happens. We did all of these great deals, great peace deals, they’re all peace deals. Agreements, solid agreements every one of them"
President Donald Trump, speaking to reporters at the White House, 21/10/2025
Clearly, the sanctions are intended as a bargaining tool to help encourage a peace deal, but at least so far, words from the Kremlin suggest that the Russian domestic oil industry will remain largely unaffected, boasting of its level of immunity from Western sanctions.
While Trump hopes the economic impact of new sanctions will encourage Putin to return to the negotiating table, only time will tell how effective these measures will be.
As for oil pricing, the associated fallout raises questions about supply, which is a positive development for pricing. This holds even more true when considering that the market narrative has been almost exclusively one of oversupply - the most recent geopolitical developments question this assumption somewhat, especially if tensions escalate.
US to buy 1 million crude barrels to replenish reserves: I think most would agree that, especially when compared to previous presidents, Trump shares a very particular relationship with the crude oil markets. After all, who could forget this legendary catchphrase?
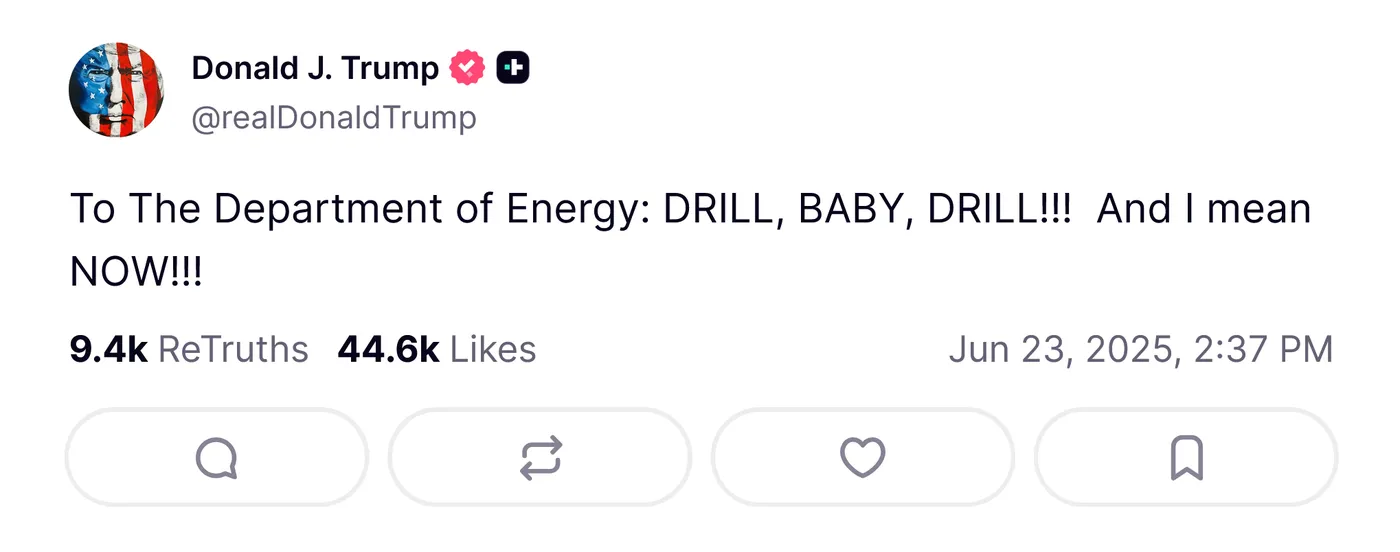
@realDonaldTrump, TruthSocial, 23/06/2025
If put simply, however, Trump policy surrounding crude oil centers almost exclusively revolves around two core tenets:
- To maintain America’s lead as #1 producer of crude oil worldwide, therefore establishing control over supply
- To keep oil prices low to promote economic growth
On this basis, the latest development is the intent to purchase 1 million barrels of crude oil to replenish the Strategic Petroleum Reserve (SPR), which recently saw record levels of depletion under the administration of former President Joe Biden.
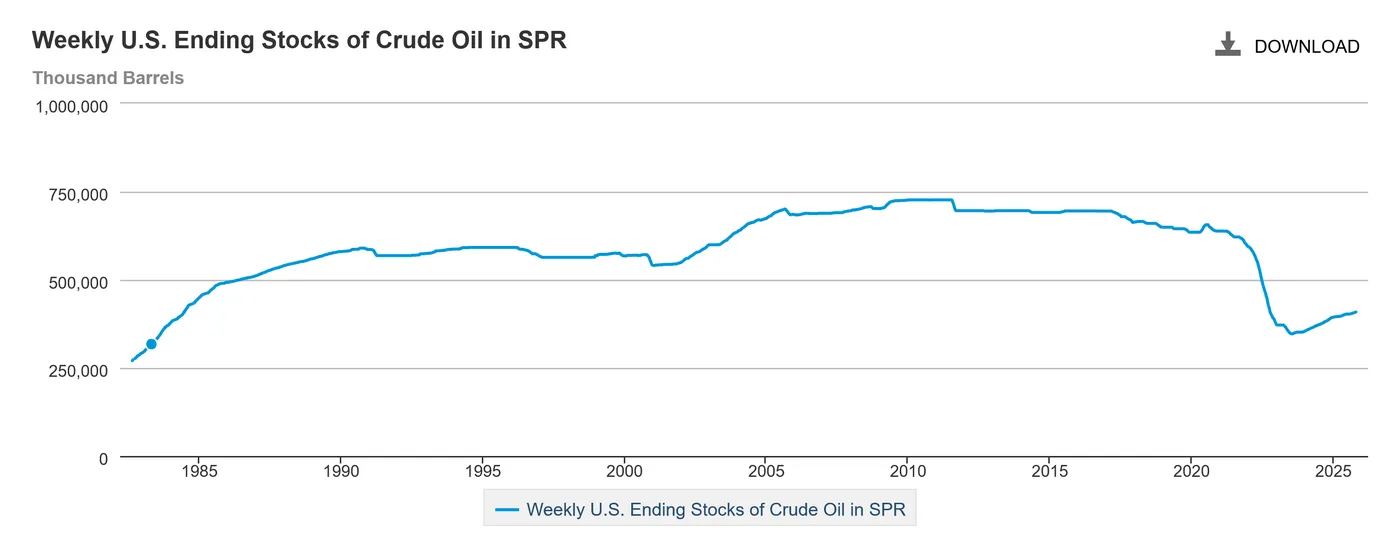
US Energy Information Administration (EIA), Weekly U.S. Ending Stocks of Crude Oil in SPR, 23/10/2025
Being previously constrained by logistical matters and, of course, funding, the EIA will undoubtedly want to capitalise on historically low crude oil prices to increase its stockpile.
Naturally, markets have interpreted this information as positive for crude oil, helping to boost pricing.
Non-OPEC+ members report record crude output: While not as contemporaneous as the other two themes, a significant macro headwind continues to dictate the direction of crude markets: the fear of oversupply.
Most recently, this is reflected in record output from non-OPEC countries, which have contributed to the current bearish bias. Otherwise, the aforementioned EIA has also confirmed sustained high levels of production.
While there have been some attempts to stagger output increases by OPEC, which have proved limited in effectiveness, with crude oil inventories rising globally.
In a nutshell, although the previous two themes are bullish for crude oil, the longer-term bias likely remains bearish from a supply standpoint.
WTI (WTICOUSD): Technical Analysis 24/10/2025
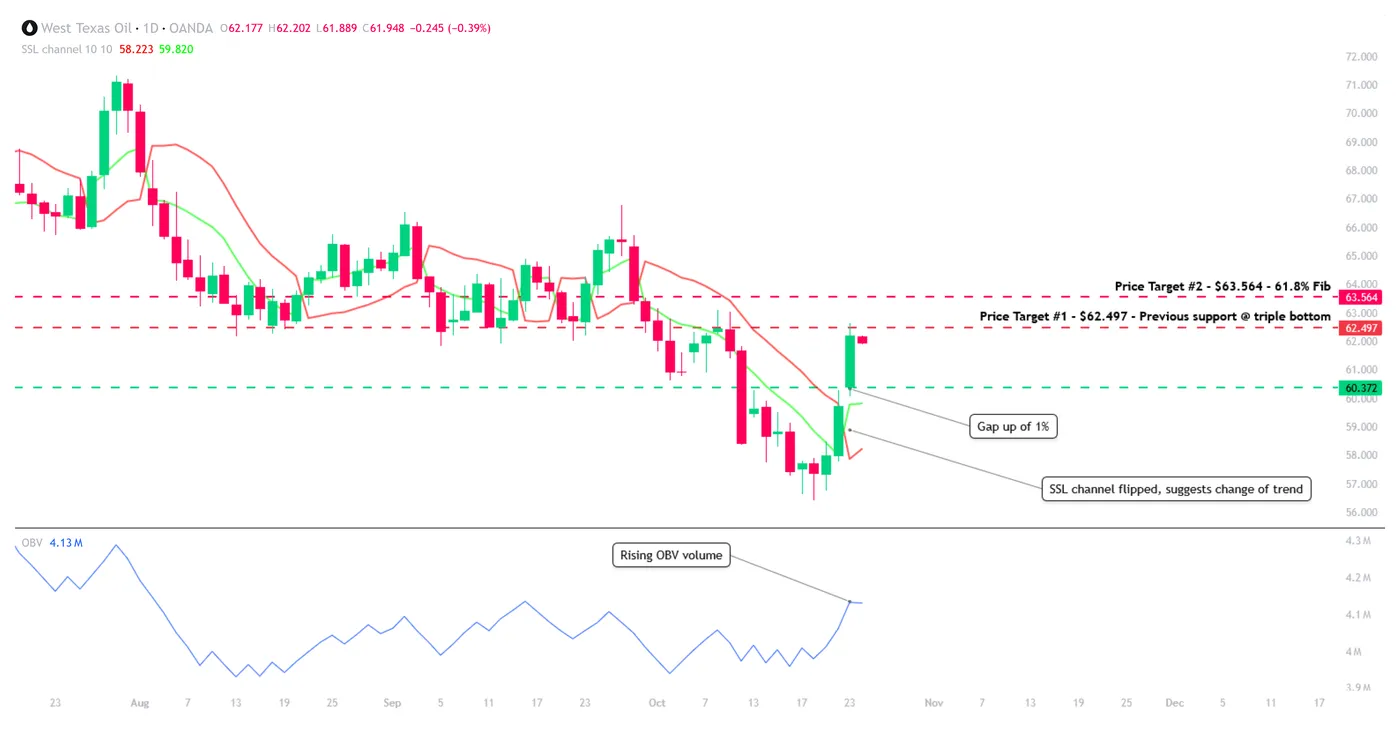
WTI Crude Oil (WTICOUSD), D1, OANDA, TradingView, 24/10/2025
While recent upside has been impressive, rallying by almost 8.6%, there is still plenty of work to be done if oil is to break the current downtrend.
While on a macro level, the narrative surrounding supply would have to change significantly to support this, technically, here’s some level to watch to the upside:
Price targets and support/resistance levels:
- Price target #1 - Previous support turned resistance - $62.564
- Price target #2 - $63.564 - 61.8% Fib
What is encouraging, however, is that one of my personal favourite indicators, the SSL channel, has flipped to report a bullish bias. While this can occur during periods of market consolidation, when combined with a rising OBV volume, it may perhaps signify that a larger change is afoot.
With that said, price action remains overwhelmingly bearish, assuming crude cannot break above ~$63.564, which might shake things up somewhat.
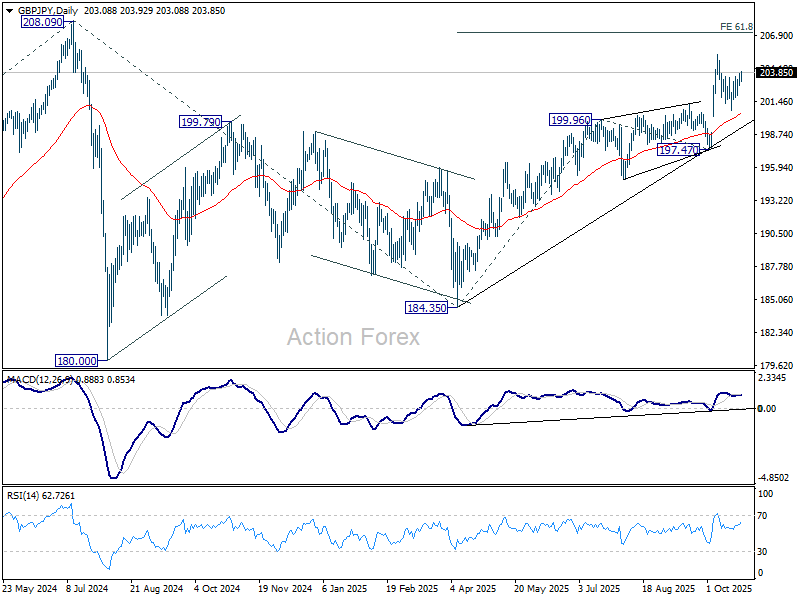
GBP/JPY Daily Outlook
Daily Pivots: (S1) 202.85; (P) 203.33; (R1) 203.83; More...
Intraday bias in GBP/JPY remains on the upside for retesting 205.30. Firm break there will resume larger rally to 61.8% projection of 184.35 to 199.96 from 197.47 at 207.11. For now, risk will stay on the upside as long as 200.67 support holds, in case of retreat.
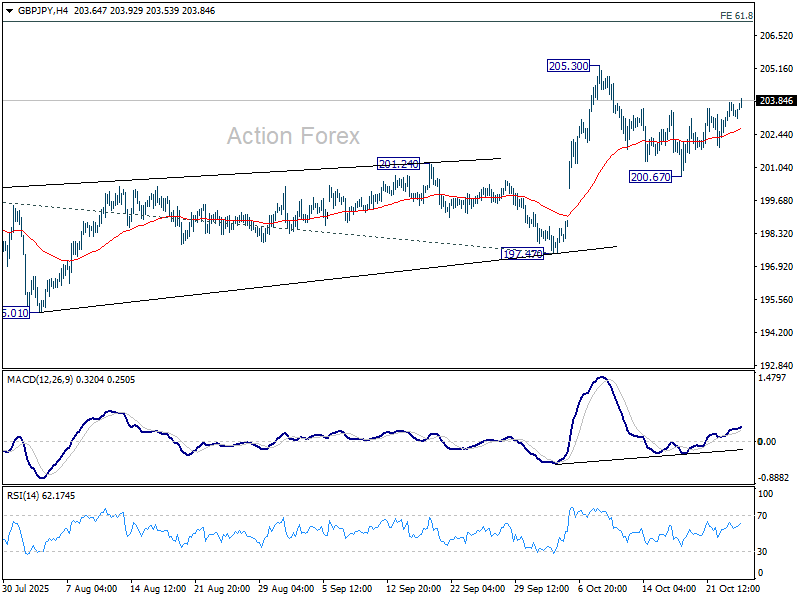
In the bigger picture, price actions from 208.09 (2024 high) are seen as a corrective pattern which might have completed at 184.35. Firm break of 208.09 high will resume the up trend from 123.94 (2020 low). Next target is 61.8% projection of 148.93 to 208.09 from 184.35 at 220.90. However, decisive break of 197.47 will dampen this view and could extend the corrective pattern with another fall.