Sample Category Title
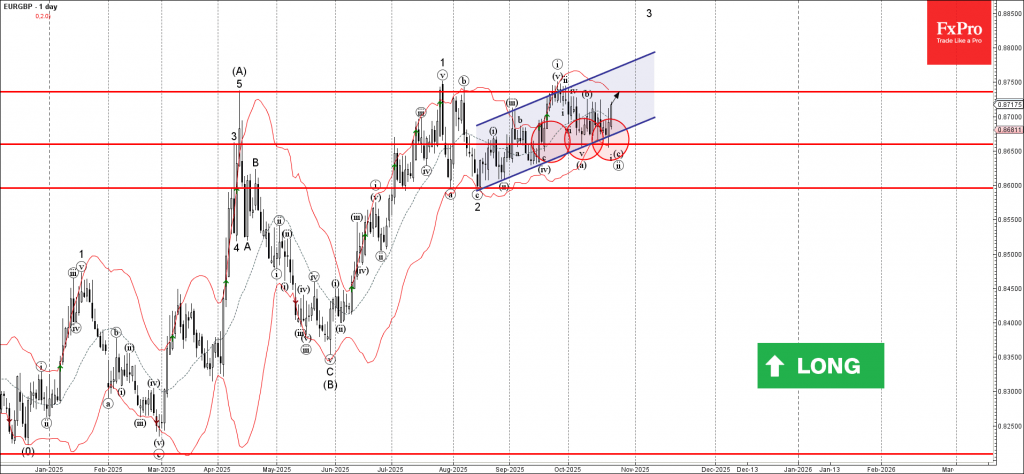
EURGBP Wave Analysis
EURGBP: ⬆️ Buy
- EURGBP reversed from support area
- Likely to rise to resistance level 0.8735
EURGBP currency pair recently reversed from the support area located between the pivotal support level 0.8660 (which has been reversing the pair from the middle of September) and the lower daily Bollinger Band.
The upward reversal from this support area created the daily Japanese candlesticks reversal pattern Bullish Engulfing – which stopped the previous ABC correction ii.
Given the clear daily uptrend, EURGBP currency pair can be expected to rise to the next strong resistance level 0.8735 (which has stopped all upward impulse from April).
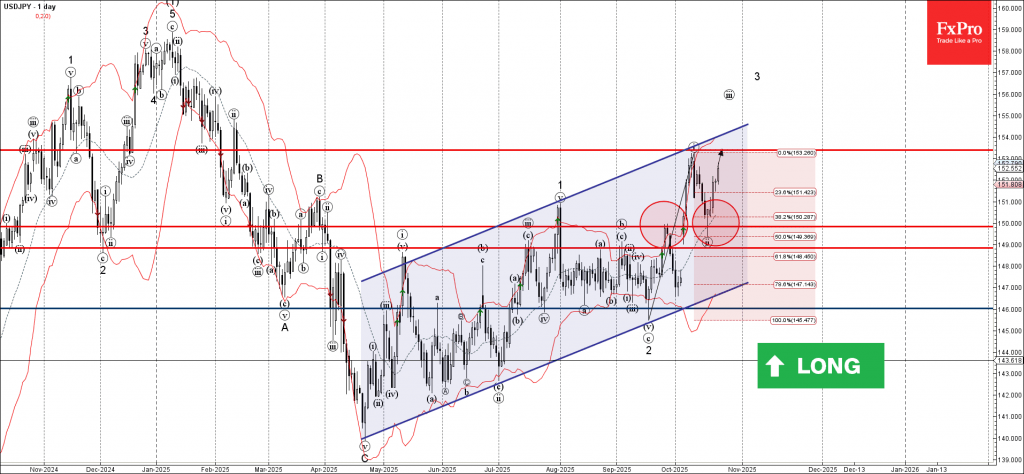
USDJPY Wave Analysis
USDJPY: ⬆️ Buy
- USDJPY reversed from support area
- Likely to rise to resistance level 153.40
USDJPY currency pair recently reversed from the support area located between the key support level 150.00 (former monthly high from September) and the 50% Fibonacci correction of the upward impulse from September.
The upward reversal from this support area created the daily Japanese candlesticks reversal pattern Hammer – which started the active impulse wave iii.
Given the clear daily uptrend and strong yen sales, USDJPY currency pair can be expected to rise to the next resistance level 153.40 (top of the impulse wave i from the start of October).
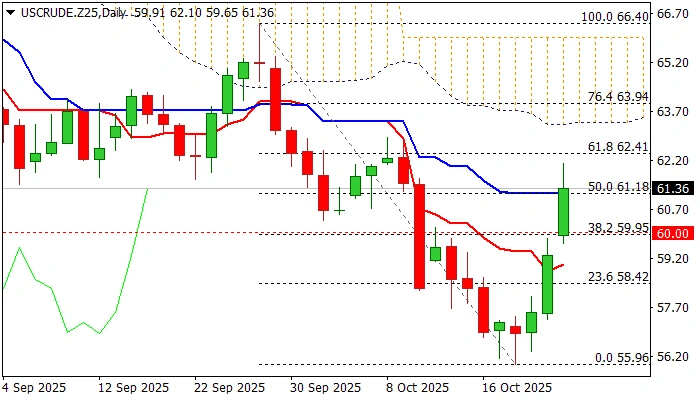
WTI: Crude Oil Jumps 3% as US Imposes Sanctions on Leading Russian Oil Suppliers
WTI oil opened with gap higher and rose around 3% during Asian / mid-European session on Thursday, lifted by the latest decision of President Trump to impose sanctions on two major Russian oil suppliers.
The US decision comes at the same time with new package of EU sanctions on Russia and decision to stop buying Russian natural gas.
This also comes as a part of larger offensive action by Trump’s administration, which aims to pressure world’s biggest buyers to stop purchasing Russian crude oil. According to some media reports, the campaign has so far showed limited results as India has changed its rhetoric and said that they will review their plans for buying oil from Russia.
The latest coordinated action by EU and the US accelerated recovery and lifted oil price by more than $2 today, improving technical picture on daily chart, as today’s acceleration marked over 50% retracement of $66.40/$55.96 bear-leg and momentum indicator broke into positive territory, setting stage for possible further recovery.
Bulls pressure immediate resistances at $62.26/41 (55DMA / Fibo 61.8%) guarding more significant base of daily Ichimoku cloud (spanned between $63.32 and $65.97), where bulls may face stronger headwinds and increased risk of recovery stall.
The notion is supported by the fact that oil price holds within larger downtrend and current recovery, unless registers a clear break above daily cloud, would mark a healthy correction before bears regain control.
Res: 62.26; 62.42; 62.90; 63.32.
Sup: 61.19; 60.38; 60.00; 59.03.
Canada: Retail Sales Rebound in August, But September Flash Estimate Points to Decline
Retail sales rose 1.0% month-on-month (m/m) in August, matching Statistics Canada's advanced estimate.
After adjusting for inflation, the volume of retail sales increased 1.0% m/m.
The gain was led by auto sales, with sales up 1.8% m/m, driven by a 2.3% surge at new car dealers.
Receipts at gas stations and fuel vendors fell 2.0%, reflecting both lower gasoline prices and softer demand, with volumes down 2.6% m/m.
Core sales – excluding auto sales and receipts at gas stations – were solid, rising 1.1% m/m in August after a 1.2% m/m decline in July. General merchandise retailers contributed the most to the gain (+2.4% m/m), while clothing and clothing accessories stores also posted strong growth (+3.2% m/m).
The weakest categories were furniture and home furnishings stores (-1.6% m/m) and miscellaneous store retailers (-1.4% m/m).
E-commerce sales slowed, edging up just 0.1% m/m in August.
Statistics Canada's advanced estimate points to a decline of 0.7% in September.
Key Implications
Retail sales data continues to exhibit volatility, with monthly figures alternating between declines and gains. As a result, nominal sales are currently tracking at an annualized rate of 1.2% for the quarter. The composition suggests that consumers favoured discretionary retail spending. At the same time, our internal data on credit and debit card spending shows relatively healthy gains in discretionary services categories such as travel, which rebounded sharply in Q3 after contracting in the previous quarter. Although part of this strength likely reflects higher prices.
Taken together, the notable slow-down in durable goods spending, particularly autos, suggests real personal spending growth should drift to a below trend rate in the second half of 2025. This should give the Bank of Canada further reason to emphasize economic slack, despite September's unexpected uptick in inflation.
Sunset Market Commentary
Markets
Commodity markets take center stage today. First, there’s oil. Brent crude prices jumped from the low $60/b area at the start of the week to currently $66/b. The US and the EU joined last week’s move by the UK in stepping up sanctions against Russia. The US increased pressure on Russia’s energy sector by targeting the country’s two largest oil companies, Rosneft and Lukoil, to degrade the Kremlin’s ability to raise revenue for its war machine and support its weakened economy. The sanctions freeze all US-based assets of both oil companies and their subsidiaries and prohibit US persons from engaging in financial transactions with them. Last week, the UK unleased strongest sanctions yet on Russia by also directly targeting both oil majors. The EU announced its 19th package against Moscow, including a ban on imports of Russian LNG, and targeting, energy, finance, trade, technology and diplomatic activities. Core bonds, and especially US Treasuries, lose ground today with the long end of the curve underperforming. Contrary to EMU inflation (headline near target), US CPI remains more elevated with recent dynamics pointing to a (re-)acceleration. The Bureau of Labour Statistics was asked to deliver the September US CPI report by tomorrow despite the ongoing government shutdown. Consensus expects headline CPI to rise from 2.9% Y/Y to 3.1% Y/Y which would be the highest level since May 2024. Core CPI is forecast stable at 3.1% Y/Y. Higher energy prices add to lingering upside inflation risks. Daily changes on the US yield curve currently range between +1.8 bps (2-yr) and +3.8 bps (30-yr). Tenors across the complete curve try to form a bottoming out pattern near YTD/Liberation Day lows. Only the US 30-yr yield remains above those reference levels. German yields are only around 1 bp higher stretching from the front to the very long end of the curve. The US dollar (EUR/USD 1.16) and stock markets (+0.2%) are going nowhere today. Secondly, there are gold and silver prices. Both precious metals went on a parabolic flight to all-time highs since early September, driven by inflation/FX debasement hedges, Fed rate cut bets and safe haven flows. Profit taking kicked in at the start of the week, taking both commodities around 10% off peak levels. The move hit a floor during yesterday’s US trading session with investors getting back in the trade. Finally, there’s a special mention to Arabica coffee futures which jumped to an all-time high. Apart from dry weather in top producer Brazil, markets were taken by surprise earlier this week by rapidly shrinking Brazilian stocks in exchange-monitored warehouses (lowest since October 2020). Trump’s high tariff policy, in effect against Brazil and threatened against Colombia, add to rising prices of that other black gold.
News & Views
The Central Bank of Turkey (CBRT) today cut the its policy rate by 1%, from 40.5% to 39.5%, further slowing the pace of easing after a 300 bps cut in July and a 250 bps step in September. The CBRT admits, that “while recent data suggest that demand conditions are at disinflationary levels, they also point to a slowdown in the disinflation process”. The underlying trend in inflation also increased in September and the “risks posed by recent price developments, particularly in food, to the disinflation process through inflation expectations and pricing behavior have become more pronounced”. Turkish inflation in September unexpectedly accelerated to 3.23% M/M and 33.29% Y/Y. The central bank will maintain a tight monetary policy stance until price stability is achieved. Apart from inflation, financial stability risks, including a weak currency related to domestic political uncertainty, also might cause to the CBRT to take a cautious approach on the pace of further easing. The Turkish lira today trades little changed holding near EUR/TRY 48.8, only a whisker away from the all-time record touched last week.
First ever Minutes of the (previous) Swiss National Bank (SNB) meeting stressed that the conditional inflation forecast is within the range of price stability over the entire forecast period. Medium and long-term inflation expectations are still well anchored. Higher US tariffs impact part of the economy and cause a lower 2026 GDP forecast. At present, there are hardly any signs of the negative effects spreading from the export-oriented industries to other parts of the economy. Monetary policy currently has an expansionary effect, but further easing is not appropriate. The summary didn’t elaborate on what might be needed to return to negative interest rates. FX comments were only descriptive in nature with the SNB active in the FX market as necessary. The Swiss franc (EUR/CHF 0.9245) trades slightly softer compared to near cycle peak levels touched earlier this week.
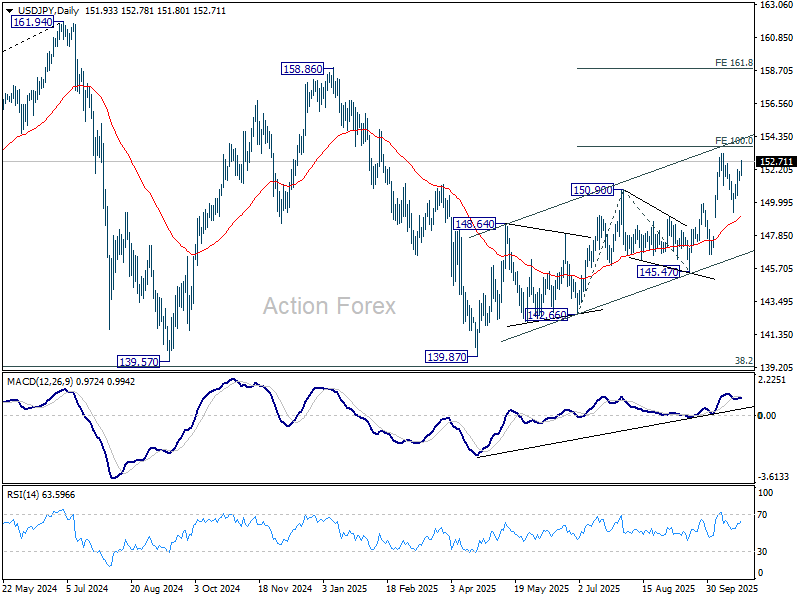
USD/JPY Mid-Day Outlook
Daily Pivots: (S1) 151.62; (P) 151.84; (R1) 152.18; More...
USD/JPY's rally is in progress and intraday bias stays on the upside for 153.26 resistance. Break there will resume larger rally from 139.87 to 100% projection of 142.66 to 150.90 from 145.47 at 153.71. Firm break there would prompt upside acceleration to 161.8% projection at 158.80. On the downside, below 151.49 minor support will turn intraday bias neutral again first.
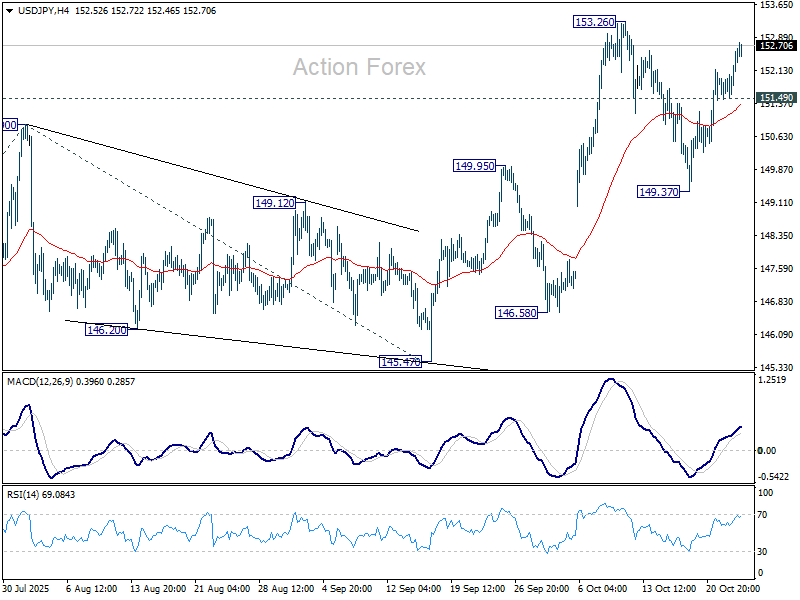
In the bigger picture, current development suggests that corrective pattern from 161.94 (2024 high) has completed with three waves at 139.87. Larger up trend from 102.58 (2021 low) could be ready to resume through 161.94 high. On the downside, break of 145.47 support will dampen this bullish view and extend the corrective pattern with another falling leg.
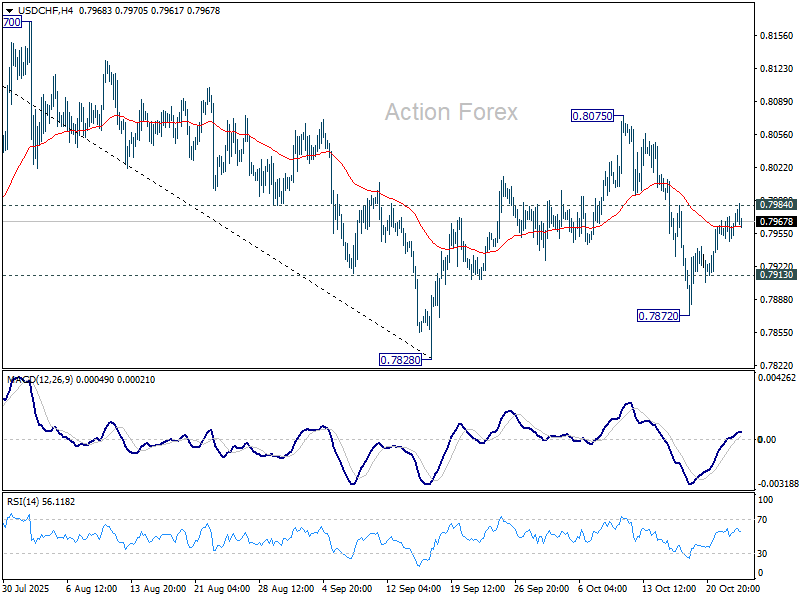
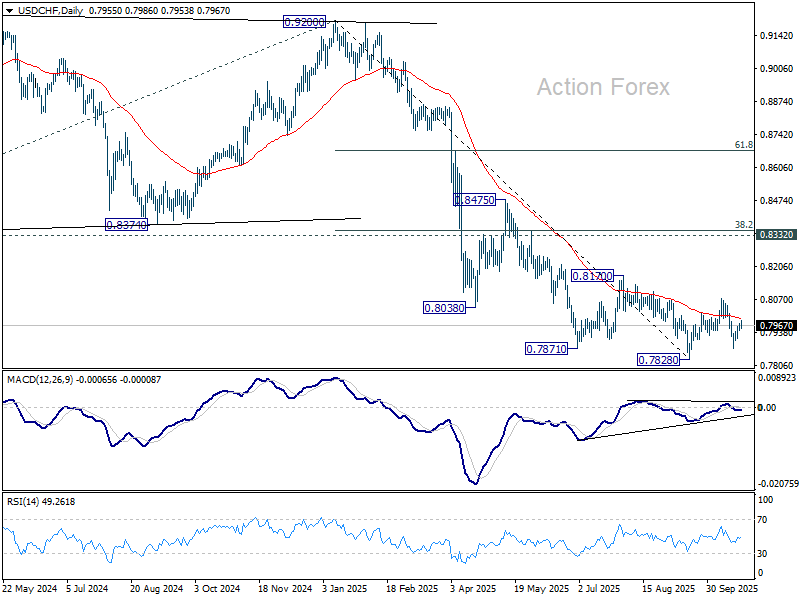
USD/CHF Mid-Day Outlook
Daily Pivots: (S1) 0.7948; (P) 0.7961; (R1) 0.7973; More…
Intraday bias in USD/CHF remains neutral and outlook is unchanged. With 0.7984 resistance intact, further decline is in favor. On the downside, below 0.7913 minor support will turn bias to the downside for 0.7872 and then 0.7828 low. Firm break there will resume larger down trend. However, break of 0.7984 will suggest that corrective pattern from 0.7828 is extending with another rising leg, and target 0.8075 again.
In the bigger picture, long term down trend from 1.0342 (2017 high) is still in progress. Next target is 100% projection of 1.0146 (2022 high) to 0.8332 from 0.9200 at 0.7382. In any case, outlook will stay bearish as long as 0.8332 support turned resistance holds (2023 low).
GBP/USD Mid-Day Outlook
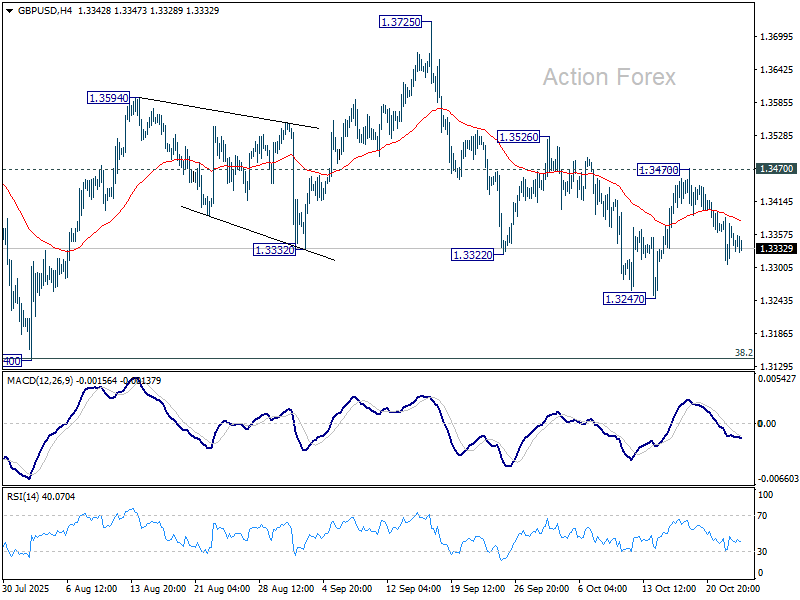
Daily Pivots: (S1) 1.3313; (P) 1.3350; (R1) 1.3394; More...
Outlook in GBP/USD is unchanged. Intraday bias remains neutral and fall from 1.3725 could extend lower. Break of 1.3247 will target 1.3140 cluster (38.2% retracement of 1.2099 to 1.3787 at 1.3142). Strong support is expected there to contain downside to complete the corrective pattern from 1.3787. On the upside, break of 1.3170 resistance will turn bias back to the upside for 1.3526 resistance. Firm break there will target 1.3725/87 resistance zone.
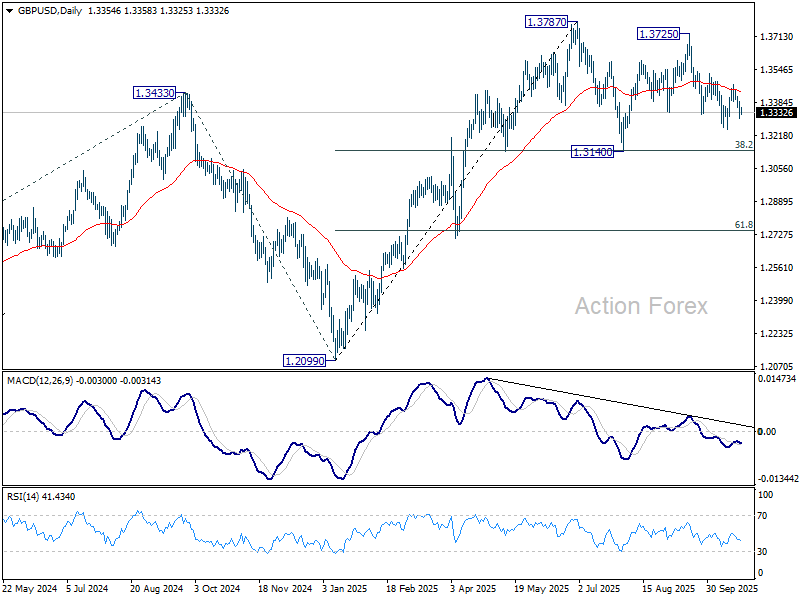
In the bigger picture, rise from 1.0351 (2022 low) is still seen as a corrective move. Further rally could be seen to 61.8% projection of 1.0351 to 1.3433 (2024 high) from 1.2099 (2025 low) at 1.4004. But strong resistance could emerge from 1.4248 (2021 high) to limit upside. Sustained break of 55 W EMA (now at 1.3191) will argue that a medium term top has already formed and bring deeper fall back to 1.2099.
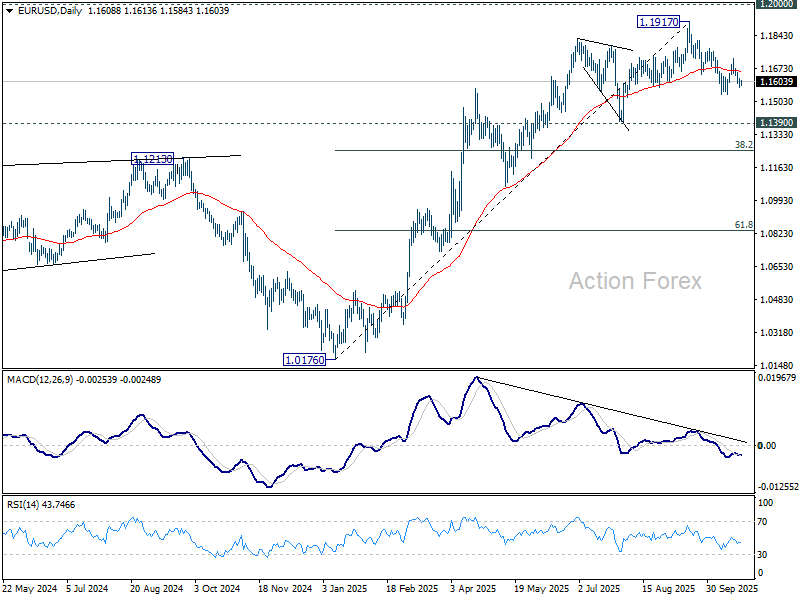
EUR/USD Mid-Day Outlook
Daily Pivots: (S1) 1.1584; (P) 1.1603; (R1) 1.1629; More…
Outlook in EUR/USD is unchanged. Intraday bias stays neutral, and further decline is expected with 1.1727 resistance intact. Break of 1.1540 will resume the fall from 1.1917 to 1.1390 support, or even further to 38.2% retracement of 1.0176 to 1.1917 at 1.1252. On the upside, though, break of 1.1727 resistance will turn bias back to the upside for 1.1778, and then retest of 1.1917 high instead.
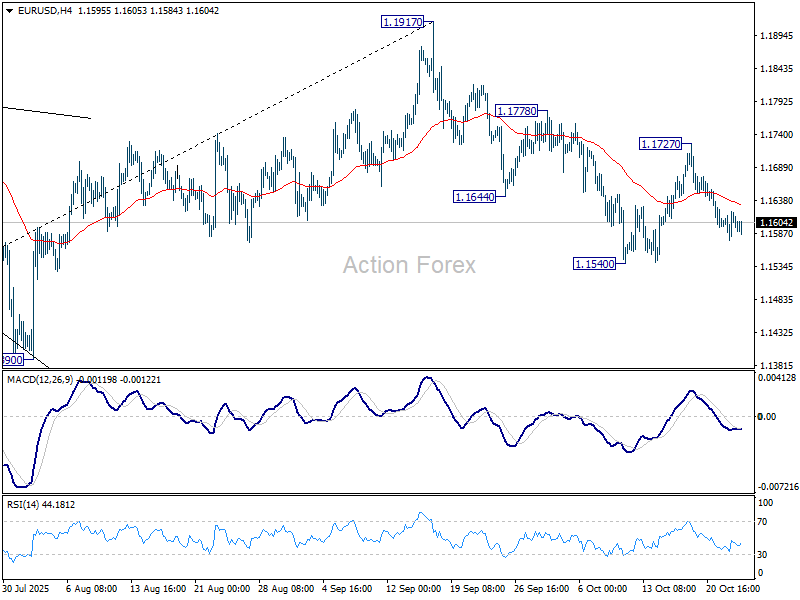
In the bigger picture, considering bearish divergence condition in D MACD, a medium term top is likely in place at 1.1917, just ahead of 1.2 key psychological level. As long as 55 W EMA (now at 1.1290) holds, the up trend from 0.9534 (2022 low) is still expected to continue. Decisive break of 1.2000 will carry larger bullish implications. However, sustained trading below 55 W EMA will argue that rise from 0.9534 has completed as a three wave corrective bounce, and keep outlook bearish.