Sample Category Title
Gold Retreats From All-Time High — Market Awaits Next Catalyst For Direction
Key Highlights
- Gold extended its rally and traded to a new record high above $4,380 before correcting lower.
- It traded below a key bullish trend line with support at $4,120 on the 4-hour chart.
- WTI Crude Oil prices could struggle to recover above $60.00.
- EUR/USD is again moving lower below 1.1650 and 1.1620.
Gold Price Technical Analysis
Gold prices formed a base above $4,000 and started a fresh increase against the US Dollar. It cleared many hurdles near $4,150 and $4,250.
The 4-hour chart of XAU/USD indicates that the price settled above the $4,000 level, the 100 Simple Moving Average (red, 4 hours), and the 200 Simple Moving Average (green, 4 hours). The upward move was such that the price spiked above $4,350.
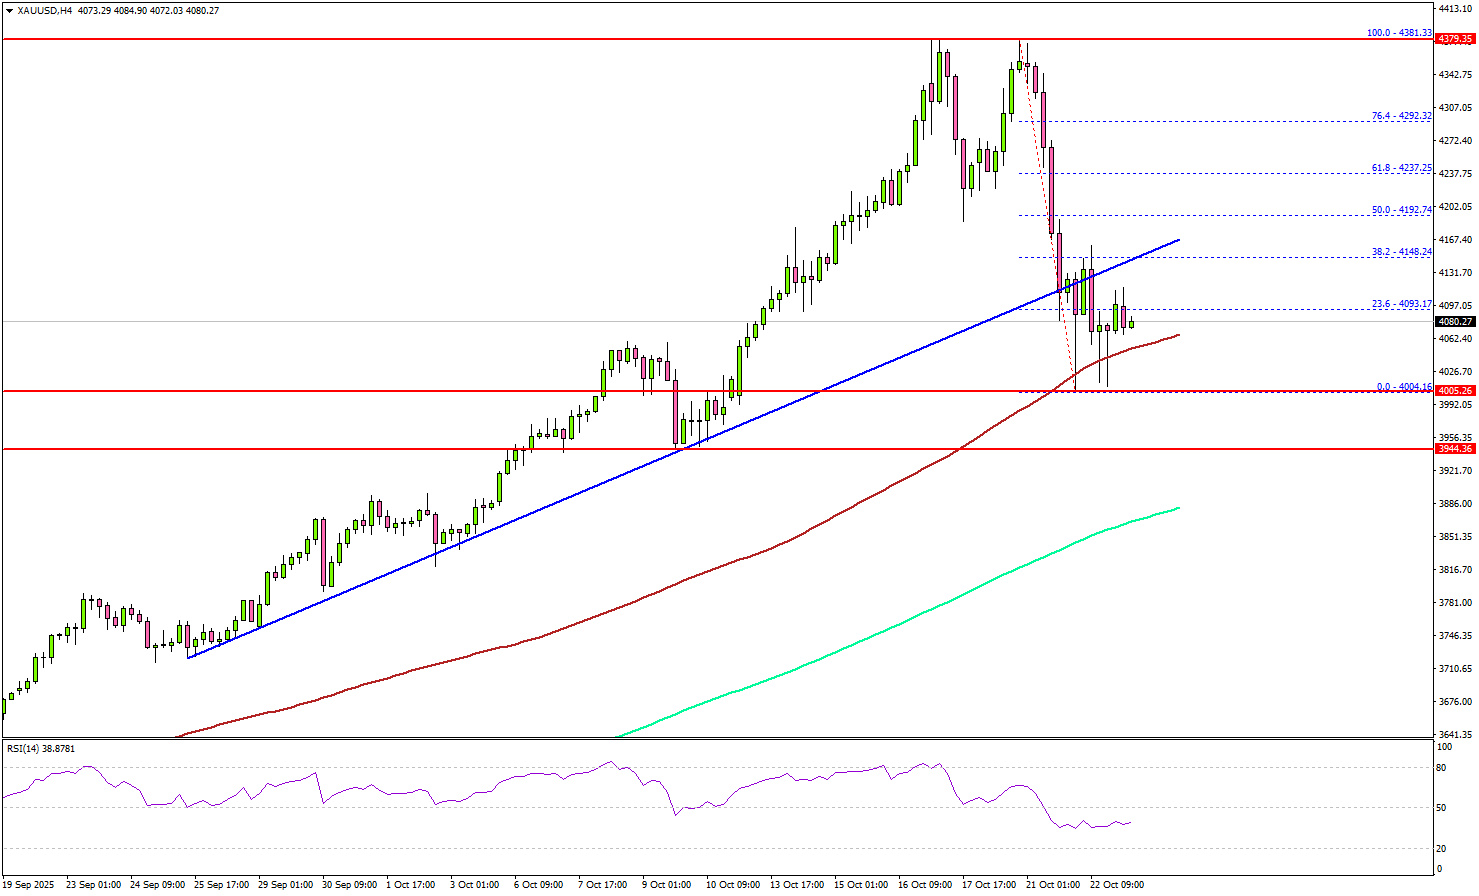
Gold traded to a new record high near $4,381 before the bears took a stand. There was a sharp downside correction below $4,200. The price traded below a key bullish trend line with support at $4,120.
It tested $4,000 and is currently consolidating losses. On the upside, immediate resistance is near the $4,150 level. The next major resistance sits near the $4,180 level.
A clear move above $4,180 could open the doors for more upside. In the stated case, the bulls could aim for a move toward $4,250, above which the price could rally toward the milestone level of $4,350.
On the downside, initial support is near the $4,000 level. The first key support is $3,945. The next major support is near the $3,850 level. A downside break below $3,850 might call for more downsides. The next key zone to watch could be $3,750.
Looking at WTI Crude Oil, the price attempted a decent recovery wave, but the bears remained active below the $60.00 level.
Economic Releases to Watch Today
- US Initial Jobless Claims - Forecast 227K, versus 218K previous.
- US New Home Sales for Sep 2025 (MoM) – Forecast +2.9% versus +20.5% previous.
GBPCAD Wave Analysis
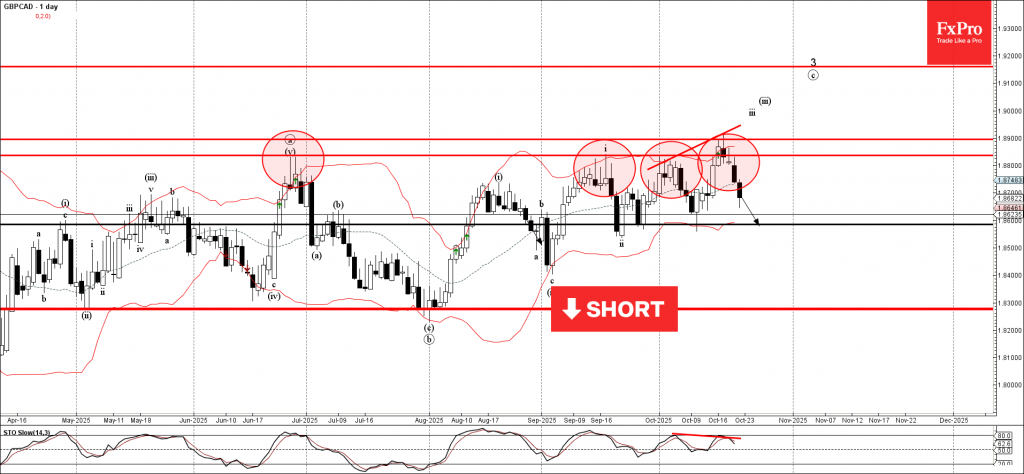
GBPCAD: ⬇️ Sell
- GBPCAD reversed from resistance area
- Likely to fall to support level 1.8600
GBPCAD currency pair recently reversed down from the resistance area located between the resistance levels 1.8835 and 1.8900 (which has been reversing the price from June).
The downward reversal from this resistance area formed the daily Japanese candlesticks reversal pattern Dark Cloud Cover – which started the active downward correction.
Given the strength of the nearby resistance area and the bearish divergence on the daily Stochastic indicator, GBPCAD cryptocurrency can be expected to fall to the next support level 1.8600.
Silver: Sharp Pullback May Extend as Near-Term Sentiment Negative
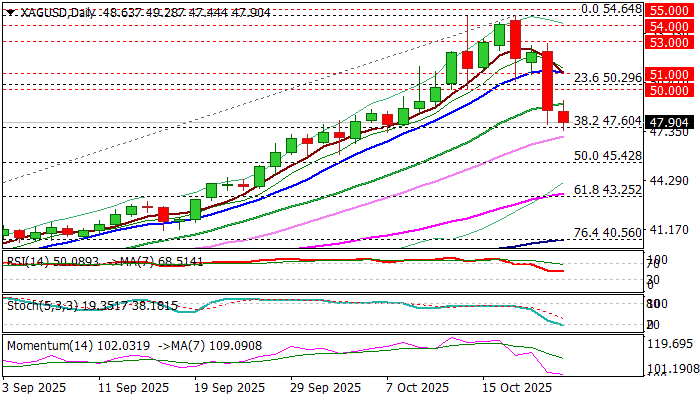
Silver stabilized after finding temporary footsteps at important Fibo support at $47.60 (38.2% retracement of $36.20/$54.64 rally).
Fresh bears take a breather after massive loss on Tuesday, when the metal’s price fell 7%, in the biggest daily drop since 11 Aug 2020.
Pullback from new record high ($54.64) started on Friday and accelerated on Tuesday, as traders opted for more aggressive profit-taking, dragged by strong pullback of gold price and stronger dollar.
Change in key fundamental factors, such as lower demand from India and restored supply, that would help renewing stocks, recently used due to supply shortage, eased upside pressure and shifted near term sentiment into opposite direction for now.
Strong acceleration on Tuesday broke the most significant support at $50 zone (psychological / former record highs of 1980 and 2011) signaled deeper correction.
Although the latest pullback was significant and weakened near term structure, larger picture still shows strong uptrend in play, with current action to be described as a healthy correction which would provide better levels to re-enter broader bullish market.
The Fibo support at $47.60 is reinforced by daily Kijun-sen and should ideally contain dips, but consolidation attempts were so far fragile and signal that the downside remains vulnerable.
Violation of $47.60 to unmask $45.42 (50% retracement of $36.20/$54.64) and rising 55DMA ($43.44) above which extended dips should find firm ground.
Broken 20DMA marks initial resistance ($49.14), with near-term action expected to remain biased lower while broken $50 pivot (now acting as solid resistance) caps upticks.
Res: 49.14; 50.00; 50.30; 51.00
Sup: 47.01; 45.90; 45.42; 43.65
DAX Extends Gains in Five Wave Diagonal Formation
The short-term Elliott Wave analysis for the DAX Index indicates it is nearing the completion of a cycle from its April 2025 low, unfolding as wave (5). From the June 19 low, wave (5) has developed as an ending diagonal Elliott Wave structure. The rally from this low saw wave 1 peak at 24639.1, followed by a wave 2 pullback concluding at 23284.67. The Index then advanced in wave 3, structured as a five-wave impulse. From the wave 2 low, wave ((i)) reached 23785.24, with a corrective dip in wave ((ii)) at 23383.84. The subsequent wave ((iii)) climbed to 24524.11, followed by a wave ((iv)) retracement to 24269.94. The final wave ((v)) culminated at 24771.34, completing wave 3.
Wave 4 unfolded as a double zigzag structure. From the wave 3 high, wave ((w)) declined to 23986.93, wave ((x)) rebounded to 24339.27, and wave ((y)) fell to 23682.73, finalizing wave 4. The Index has since turned upward in wave 5. From the wave 4 low, wave ((i)) reached 24384.24. A wave ((ii)) pullback is expected to correct the cycle from the October 17 low before the Index resumes its ascent. As long as the pivot at 23682.73 holds, pullbacks should attract buyers in a 3, 7, or 11 swing, supporting further upside in the near term.
DAX Latest 1-Hour Elliott Wave Chart From 10.23.2025
DAX Elliott Wave Video:
https://www.youtube.com/watch?v=lL7FHkTe5tI
Sunset Market Commentary
Markets
UK gilts rally, outperforming their US and European peers dramatically in the process. British yields drop between 8.1 and 8.9 bps after sub-consensus inflation numbers. September headline CPI flatlined on a monthly basis and caused the annual print to match August’s 3.8%. The Bank of England for the last couple of months had been warning for inflation to peak last month at 4% before disinflation would kick in again. The current 3.8% in other words means a better starting point. Core inflation unexpectedly eased to 3.5% from 3.6% and services CPI defied expectations for an acceleration to 4.8% by coming in at 4.7%, the same as in August. Producer price inflation gauges also came in below analyst estimates. The price report is a sigh of relief, including for the Bank of England. The central bank is torn between supporting the economy through rate cuts and stubborn above-target inflation. Since it last cut rates back in August the BoE started floating the possibility of going even slower than the quarterly pace it followed until then. Markets dramatically reduced bets for a November 6 reduction to near zero in response. That’s now going in reverse: the market implied probability shot higher to 35% currently. Governor Bailey will be the swing vote in a split MPC. The sharp yield drop is a boon for UK’s dire public finances too. Depending on the cut-off used by the Office of Budget Responsibility in drafting the pre-Autumn Budget forecast, estimates (Bloomberg) of borrowing cost savings vary between £2 and £4.5bn. When looking for money to fill a £35bn fiscal hole, every bit counts. Cratering yields weigh on GBP but it could have been a lot worse. EUR/GBP bounced to 0.871 before halving those gains. The euro himself isn’t exactly showcasing strength. EUR/USD drifts further south with the 1.16 big figure again at risk of being lost. The US dollar remains the better bid currency against most major peers. DXY is back above 99. Precious metals remain in the defensive. Gold and silver’s pullback continues, extending yesterday’s slide. Stock markets are taking a breather near the record highs. Decent-to-strong corporate earnings have supported the recent upleg. Markets are now eyeballing the next batch from bellwethers such as Tesla & Alcoa (after-market).
News & Views
The monthly consumer confidence report published by the National Bank of Belgium today, showed the overall confidence level continuing its upward trajectory. At 0 (up from -1) the index reached the best level for 2025. The move was mainly due to a sharp decline in consumers’ fears about unemployment. The subindex improved from 2 to -6, the best level since January 2018. The improved in expectations on unemployment offset greater pessimism concentrating the economic situation in the country (-27 from -23). On a personal level, households have slightly downgraded their expectations regarding their own financial situation (-2 from 0) and they intend to save a little more 23 from 22).
Consumer price inflation in South Africa in September rose slightly by 0.2% M/M and 3.4% Y/Y (from -0.1% and 3.3% in August). Core inflation (excluding food & non-alcoholic beverages, fuel and energy) also rose 0.3% M/M and 3.2% Y/Y (from 0.1% M/M and 3.1% Y/Y). Goods inflation eased from 3.1% Y/Y to 2.9%, but services inflation accelerated from 3.6% to 3.9%. In its September monetary policy statement, the South Africa Reserve Bank (SARB) indicated that it expected the inflation rate to rise to 4% over the next few months. Overall, it expected headline inflation to average 3.4% this year, and 3.6% next year, before reverting to 3% during 2027. In its assessment it saw higher electricity prices as well has upwardly revised food and services prices. This was partially offset by a stronger exchange rate assumption. In September, the SARB paused its easing cycle, leaving the policy rate at 7% as it wanted to see the impact of the previous 125 bps of rate cuts over the previous year. As the SARB aims to bring inflation to the bottom of the 3-6% official target range, current inflation development only leaves room for very gradual policy easing going forward. The rand today eases modestly to USD/ZAR 17.425. The USD/ZAR cross rate earlier this month touched 17.07, coming close to the 2024 low (high for the rand).
EUR/USD Mid-Day Outlook
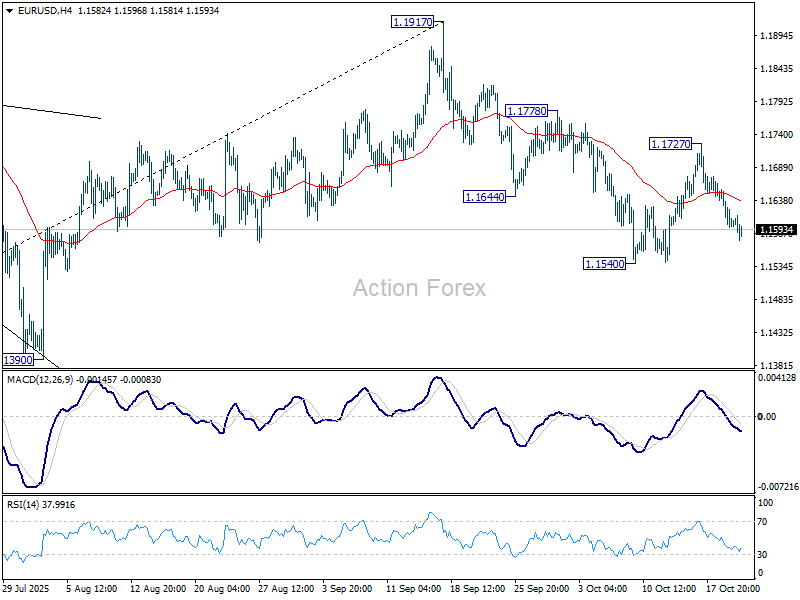
Daily Pivots: (S1) 1.1580; (P) 1.1618; (R1) 1.1637; More…
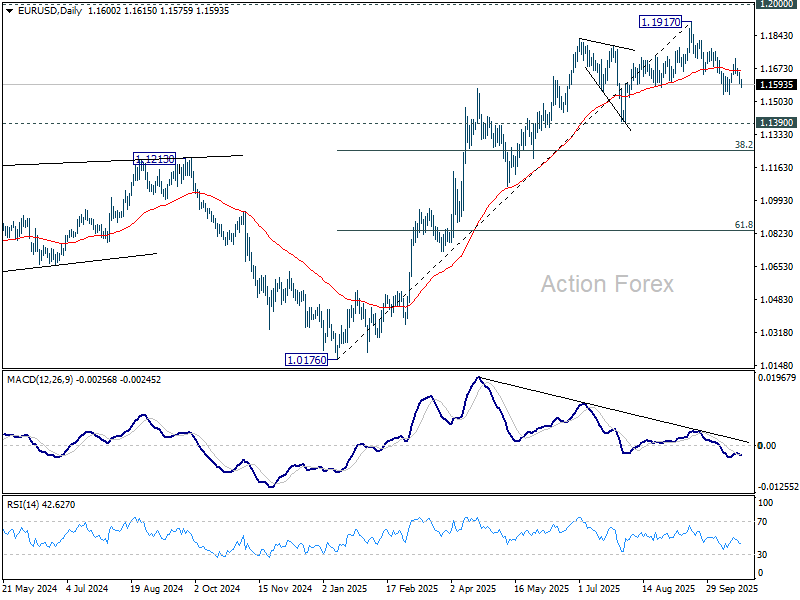
Intraday bias in EUR/USD remains neutral and further decline is expected. Break of 1.1540 will resume the fall from 1.197 to 1.1390 support, or even further to 38.2% retracement of 1.0176 to 1.1917 at 1.1252. On the upside, though, break of 1.1727 resistance will turn bias back to the upside for 1.1778, and then retest retest of 1.1917 high instead.
In the bigger picture, considering bearish divergence condition in D MACD, a medium term top is likely in place at 1.1917, just ahead of 1.2 key psychological level. As long as 55 W EMA (now at 1.1290) holds, the up trend from 0.9534 (2022 low) is still expected to continue. Decisive break of 1.2000 will carry larger bullish implications. However, sustained trading below 55 W EMA will argue that rise from 0.9534 has completed as a three wave corrective bounce, and keep outlook bearish.
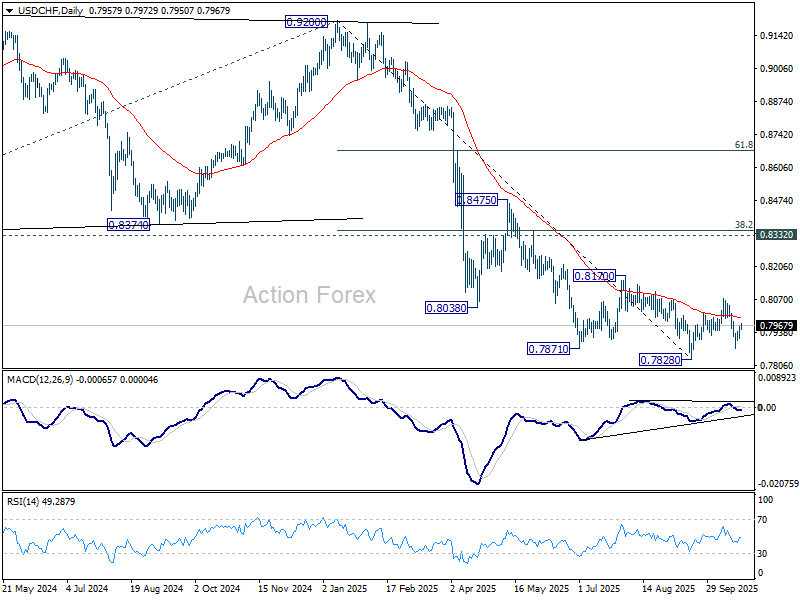
USD/CHF Mid-Day Outlook
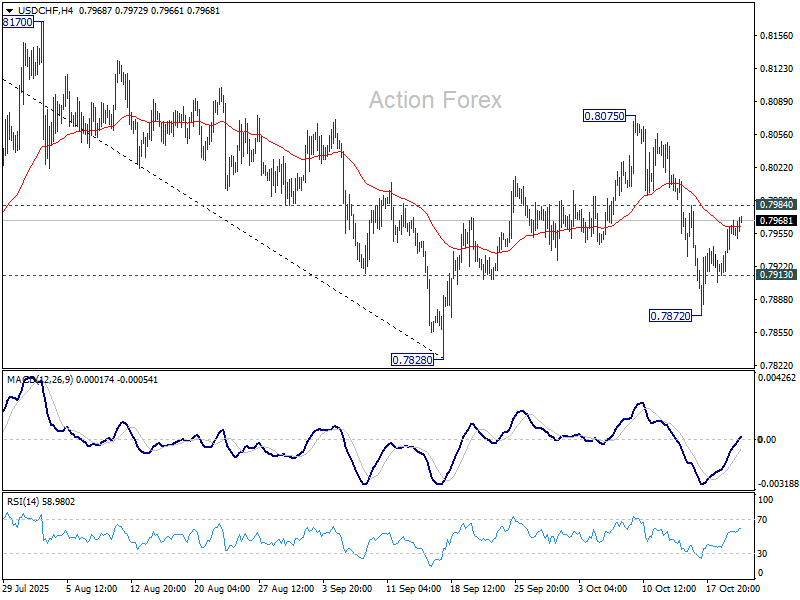
Daily Pivots: (S1) 0.7930; (P) 0.7949; (R1) 0.7982; More…
Intraday bias in USD/CHF stays neutral and further fall is in favor with 0.7984 minor resistance intact. On the downside, 0.7913 minor support will turn bias to the downside for 0.7872 and then 0.7828 low. Firm break there will resume larger down trend. However, break of 0.7984 will suggest that corrective pattern from 0.7828 is extending with another rising leg, and target 0.8075 again.
In the bigger picture, long term down trend from 1.0342 (2017 high) is still in progress. Next target is 100% projection of 1.0146 (2022 high) to 0.8332 from 0.9200 at 0.7382. In any case, outlook will stay bearish as long as 0.8332 support turned resistance holds (2023 low).
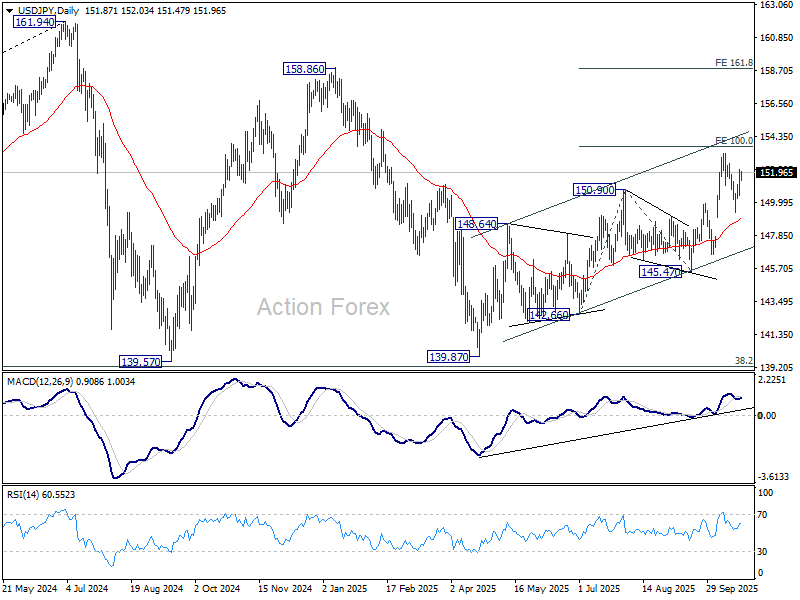
USD/JPY Mid-Day Outlook
Daily Pivots: (S1) 150.87; (P) 151.53; (R1) 152.58; More...
No change in USD/JPY's outlook and intraday bias stays on the upside for retesting 153.26. Break there will resume larger rally from 139.87 to 100% projection of 142.66 to 150.90 from 145.47 at 153.71. Firm break there would prompt upside acceleration to 161.8% projection at 158.80. on the downside, below 150.45 minor support will dampen this bullish view and turn bias neutral again first.
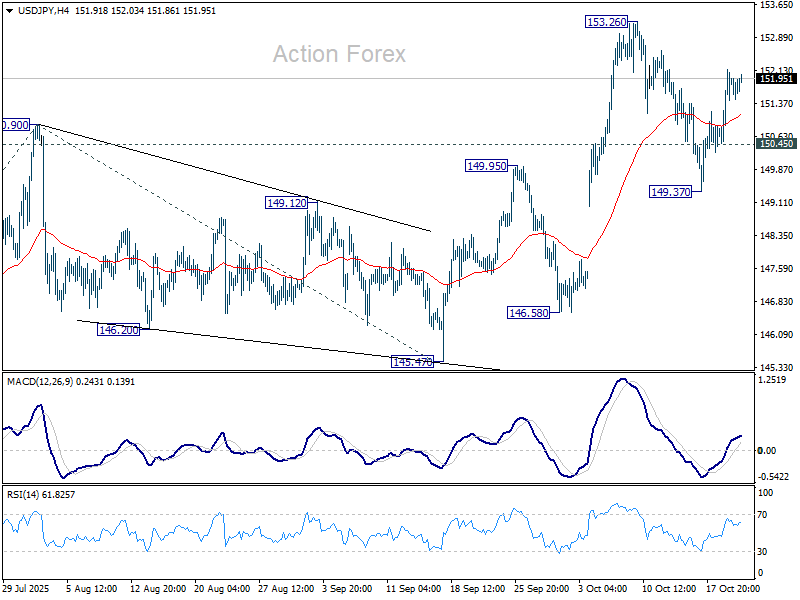
In the bigger picture, current development suggests that corrective pattern from 161.94 (2024 high) has completed with three waves at 139.87. Larger up trend from 102.58 (2021 low) could be ready to resume through 161.94 high. On the downside, break of 145.47 support will dampen this bullish view and extend the corrective pattern with another falling leg.
GBP/USD Mid-Day Outlook
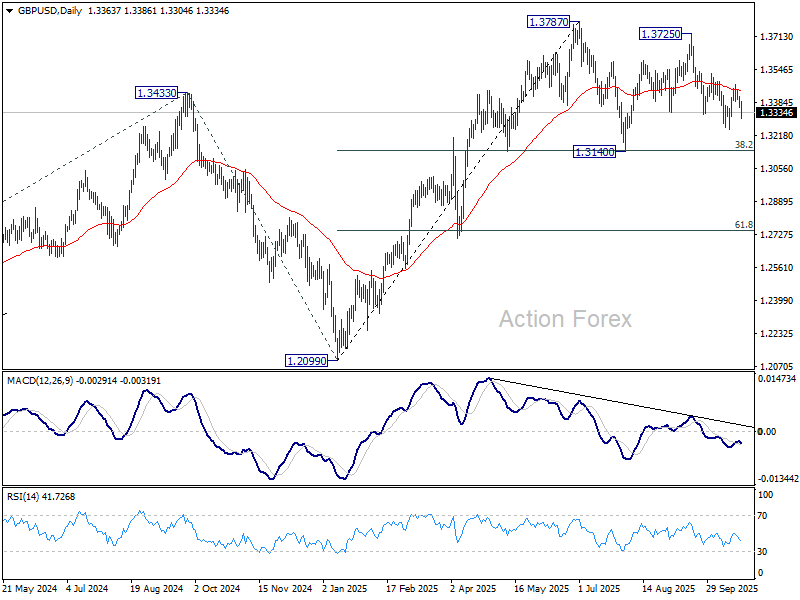
Daily Pivots: (S1) 1.3346; (P) 1.3383; (R1) 1.3404; More...
GBP/USD dips notably today but stays above 1.3247 support. Fall from 1.3725 could extend lower, and break of 1.3247 will target 1.3140 cluster (38.2% retracement of 1.2099 to 1.3787 at 1.3142). Strong support is expected there to contain downside to complete the corrective pattern from 1.3787. On the upside, break of 1.3170 resistance will turn bias back to the upside for 1.3526 resistance. Firm break there will target 1.3725/87 resistance zone.
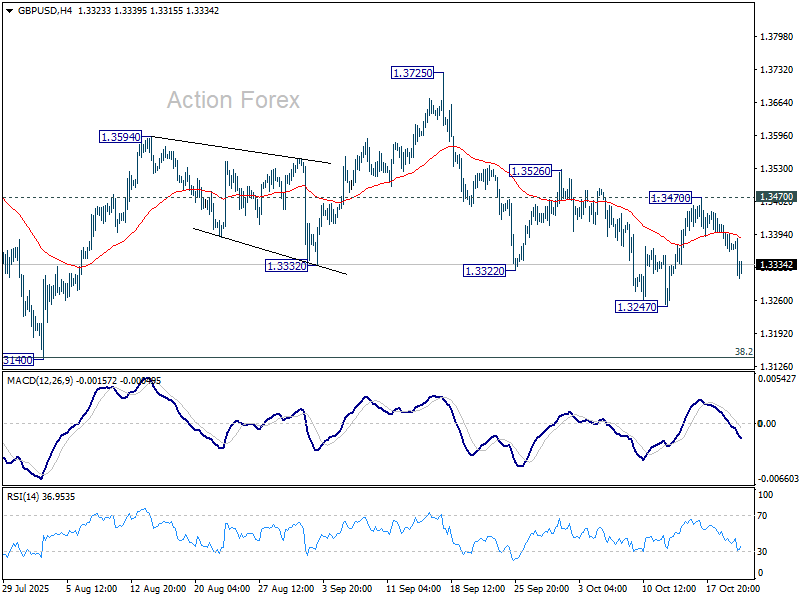
In the bigger picture, rise from 1.0351 (2022 low) is still seen as a corrective move. Further rally could be seen to 61.8% projection of 1.0351 to 1.3433 (2024 high) from 1.2099 (2025 low) at 1.4004. But strong resistance could emerge from 1.4248 (2021 high) to limit upside. Sustained break of 55 W EMA (now at 1.3191) will argue that a medium term top has already formed and bring deeper fall back to 1.2099.