
Sample Category Title
Sterling Eases After CPI Miss, Overall Markets Quiet
The foreign exchange market traded quietly today, with investors reluctant to take fresh major positions. With risk sentiment mixed and volatility muted, most major pairs remained confined to familiar ranges
The British Pound was under mild pressure as traders raised their bets on another BoE rate cut later this year, albeit not in November. Euro and Swiss Franc also traded on the defensive, mirroring the Pound’s mild weakness.
In contrast, commodity currencies held up better. Aussie, Kiwi, and Loonie all registered modest gains. Dollar and Japanese Yen hovered in the middle of the performance board.
Overall trading activity might stay low until key data releases at the end of the week including the U.S. CPI on Friday and a series of PMI surveys from major economies.
Beyond the data focus, trade diplomacy was also in the spotlight. U.S. Trade Representative Jamieson Greer and Treasury Secretary Scott Bessent were set to travel to Malaysia for talks with Chinese officials over what Washington described as “incredibly aggressive” restrictions on rare earth exports.
Bessent said there remains a potential slot for a meeting between President Trump and President Xi, though it would depend on mutual readiness. Greer added that while China’s actions breached earlier commitments to maintain rare earth supply, there was still a “good landing zone” for rebalancing trade ties.
In Europe, at the time of writing, FTSE is up 0.96%. DAX is down -0.18%. CAC is down -0.30%. UK 10-year yield is down -0.084 at 4.404. Germany 10-year yield is up 0.008 at 2.567. Earlier in Asia, Nikkei fell -0.02%. Hong Kong HSI fell -0.94%. China Shanghai SSE fell -0.07%. Singapore Strait Times rose 0.29%. Japan 10-year JGB yield fell -0.008 to 1.655.
UK CPI at 3.8% in September, undershoots expectations of 4.0%
UK inflation came in softer than expected in September. Headline CPI was unchanged at 3.8% yoy, below consensus of 4.0%. Core CPI (excluding energy, food, alcohol and tobacco) eased to 3.5% from 3.6%.
Breakdowns showed a mixed picture under the surface. CPI goods component rose marginally from 2.8% yoy to 2.9%, highest since October 2023. Services inflation held unchanged at 4.7%.
On a monthly basis, consumer prices were flat, another sign that the inflation pulse has moderated heading into the final quarter of the year.
GBP/CHF dips but range holds as UK CPI not dovish enough
Sterling slipped today after softer-than-expected UK inflation data reinforced expectations that the BoE remains on track to cut rates again this year—though not as soon as the next meeting. A November pause still appears more likely, with solid reasons to wait until after the November 26 Budget and another round of inflation data before committing to further easing.
However, expectations for a December rate cut have strengthened notably. Interest-rate futures now assign roughly a 75% probability that the BoE will lower the Bank Rate to 3.75% from 4.00% at the December meeting—up from about 46% before the CPI release. Traders have also brought forward expectations for the next move, fully pricing a second 25-basis-point cut by February 2026, a month earlier than previously anticipated.
In the currency market, the Pound’s selloff was broad but relatively shallow. The muted reaction reflected that traders see the BoE cutting soon—but not urgently—keeping Sterling supported above key levels for now.
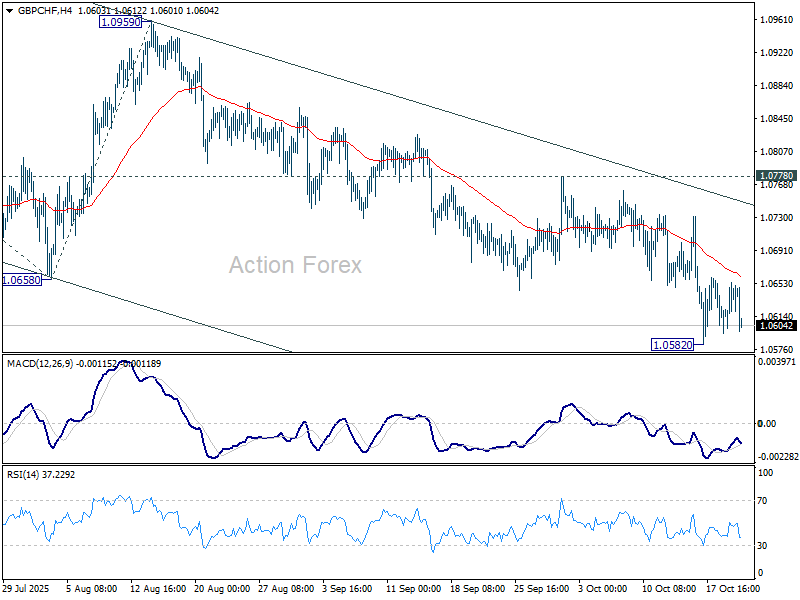
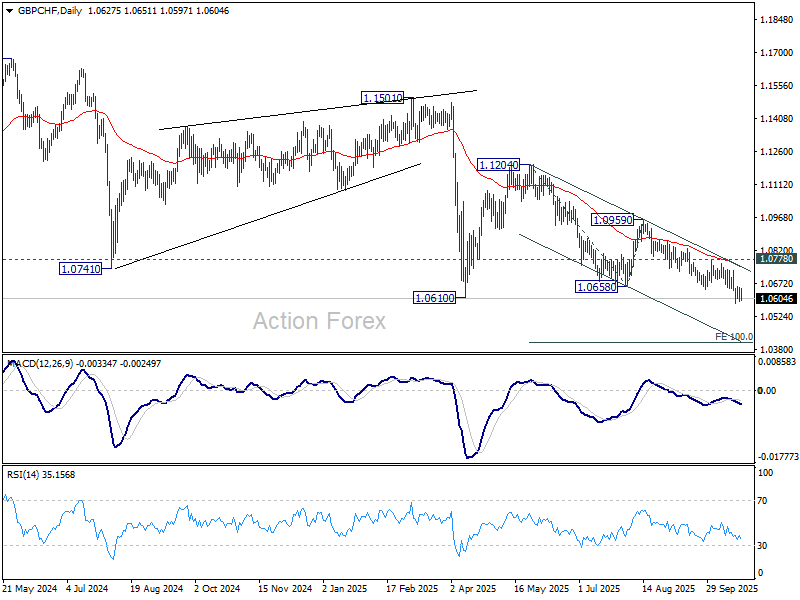
Technically, GBP/CHF is still holding above 1.0582 temporary lower despite today's dip. Some more consolidations could still be seen. Nevertheless, near term outlook is staying firmly bearish with 1.0778 resistance intact. Break of 1.0582 will pave the way to 100% projection of 1.1204 to 1.0658 from 1.0959 at 1.0413.
Japan’s exports rise for first time in five months, but U.S. demand still weak
Japan’s exports rose in September for the first time in five months, signaling tentative recovery in external demand even as shipments to the U.S. continued to contract sharply.
Exports climbed 4.2% yoy to JPY 9.41T, slightly below expectations of 4.6%. The rebound was driven largely by strength in Asia, where exports jumped 9.2%, including a 5.8% rise to China. In contrast, shipments to the U.S. fell -13.3%, with auto exports down -24.2%, extending months of weakness despite being a smaller drop than August’s 28.4% decline.
Imports also grew faster than expected, rising 3.3% yoy to JPY 9.65T, compared with forecasts of 0.6%. As a result, Japan posted a trade deficit of JPY 234.6B.
The data come just weeks after Washington finalized a new trade agreement with Tokyo, implementing a 15% baseline tariff on nearly all Japanese imports, down from the initial 27.5% rate.
GBP/USD Mid-Day Outlook
Daily Pivots: (S1) 1.3346; (P) 1.3383; (R1) 1.3404; More...
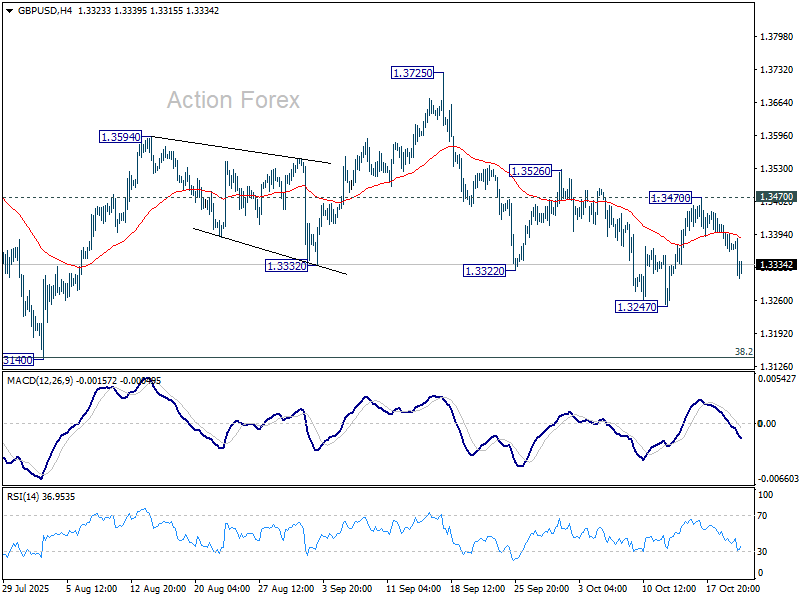
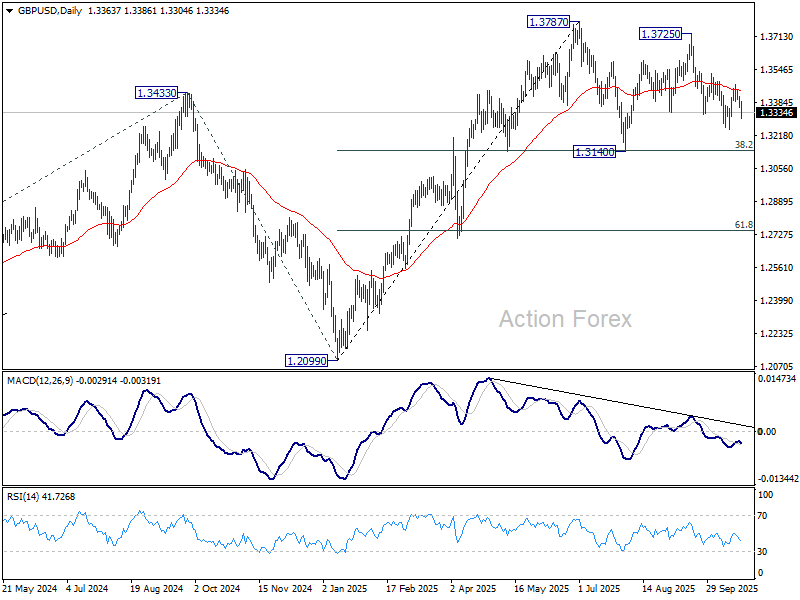
GBP/USD dips notably today but stays above 1.3247 support. Fall from 1.3725 could extend lower, and break of 1.3247 will target 1.3140 cluster (38.2% retracement of 1.2099 to 1.3787 at 1.3142). Strong support is expected there to contain downside to complete the corrective pattern from 1.3787. On the upside, break of 1.3170 resistance will turn bias back to the upside for 1.3526 resistance. Firm break there will target 1.3725/87 resistance zone.
In the bigger picture, rise from 1.0351 (2022 low) is still seen as a corrective move. Further rally could be seen to 61.8% projection of 1.0351 to 1.3433 (2024 high) from 1.2099 (2025 low) at 1.4004. But strong resistance could emerge from 1.4248 (2021 high) to limit upside. Sustained break of 55 W EMA (now at 1.3191) will argue that a medium term top has already formed and bring deeper fall back to 1.2099.
U.S. Budget Stalemate Deepens as Partial Government Shutdown Drags On
- The U.S. government shutdown, now over three weeks old, shows no sign of resolution as Republicans and Democrats remain deadlocked.
- Economic impact remains limited, reducing GDP by about 0.3 percentage points so far, though risks rise with each passing week.
- Key federal programs like WIC and SNAP could run out of funds by late October or early November.
- Historically, short shutdowns have had minimal impact on stock markets; major indices remain stable amid strong fundamentals.
Political Deadlock Intensifies
More than three weeks after the partial shutdown of federal institutions began on October 1, Washington remains mired in political gridlock. Republicans and Democrats have yet to find common ground, with the Senate on Monday rejecting for the eleventh time a stopgap funding bill that would have temporarily reopened the government. As a result, the federal administration will stay partially paralyzed for at least several more days.
Market observers are increasingly betting that the impasse could extend into November, potentially making it one of the longest shutdowns in over half a century. Most government statistical agencies have halted data releases, with the notable exception of Friday’s September CPI report — essential for calculating adjustments to Social Security benefits.
Mounting Political and Social Pressure
As the shutdown drags into its third week, pressure on Congress is steadily building — from both the public and within federal institutions themselves. Each day without a funding deal adds to the political toll for both parties while deepening uncertainty for millions of Americans whose livelihoods or benefits depend on federal programs. With key deadlines approaching at the end of October, the sense of urgency in Washington is intensifying.
The next scheduled payday for federal employees falls on October 24. If lawmakers fail to reach an agreement by then, thousands of government workers will again go without pay. A week later, on October 31, the military faces its own payroll deadline — a payment last met only through a controversial reallocation of Department of Defense funds. Even greater pressure will mount on November 1, when open enrollment begins for ObamaCare health insurance programs that cover roughly 24 million Americans. Without renewed federal subsidies, premiums could jump by 75 to 100 percent, imposing a heavy burden on households already strained by elevated living costs.
For now, however, both parties remain firmly entrenched. Polls indicate that Americans largely blame both sides equally, reducing the political incentive for compromise. President Trump has so far refrained from direct involvement in negotiations — a factor that only complicates efforts to end the stalemate.
Economic Impact Remains Contained — For Now
Analysts estimate that each week of the shutdown trims GDP growth by about 0.1 to 0.2 percentage points, implying a cumulative drag of roughly 0.3 percentage points so far. Yet the broader U.S. economy remains resilient: the Atlanta Fed’s GDPNow model still forecasts a 3.9% expansion in the third quarter. Since most federal workers eventually receive back pay, the overall macroeconomic damage has so far been limited.
Rising Risks as the Shutdown Persists
If the impasse continues, however, the effects on consumer confidence and business sentiment will become increasingly pronounced. By November, the strain could intensify sharply. The WIC program — which provides nutritional support for about 7 million women, infants, and children — is projected to run out of funds, while the SNAP food assistance program could exhaust its financing by the end of October, jeopardizing aid for over 40 million Americans.
For now, the shutdown’s economic disruptions remain moderate. But with each passing week, the risks mount — and if no deal is reached by early November, escalating social and political pressure will likely leave lawmakers with little choice but to compromise
Impact on Financial Markets - Dow Jones, SP500, Nasdaq Composite
If the U.S. government shutdown — that is, the suspension of federal funding — lasts longer, the major Wall Street indices such as the Dow Jones Industrial Average, S&P 500, and Nasdaq Composite could react in different ways.
What History Shows
From a historical perspective, short government shutdowns have had only a limited impact on the broader U.S. stock market. According to various analyses, during shutdown periods the S&P 500 has gained an average of about 4.4%, and in most cases, stock prices have remained positive even three to six months after the shutdown ended.
Investors tend to “care more about fundamentals than politics” — markets focus primarily on corporate earnings, Federal Reserve decisions, and economic growth prospects, rather than on the budget standoff itself.
This means that a short shutdown is unlikely to trigger a dramatic sell-off in the major indices. However, there is still a certain degree of risk (in my view, it remains rather limited) that a prolonged shutdown could lead to a broader correction on Wall Street. At this point, though, investors are behaving in a very predictable, textbook way — they are using every dip as an opportunity to take long positions and participate in the ongoing strong bull market on the stock exchange.
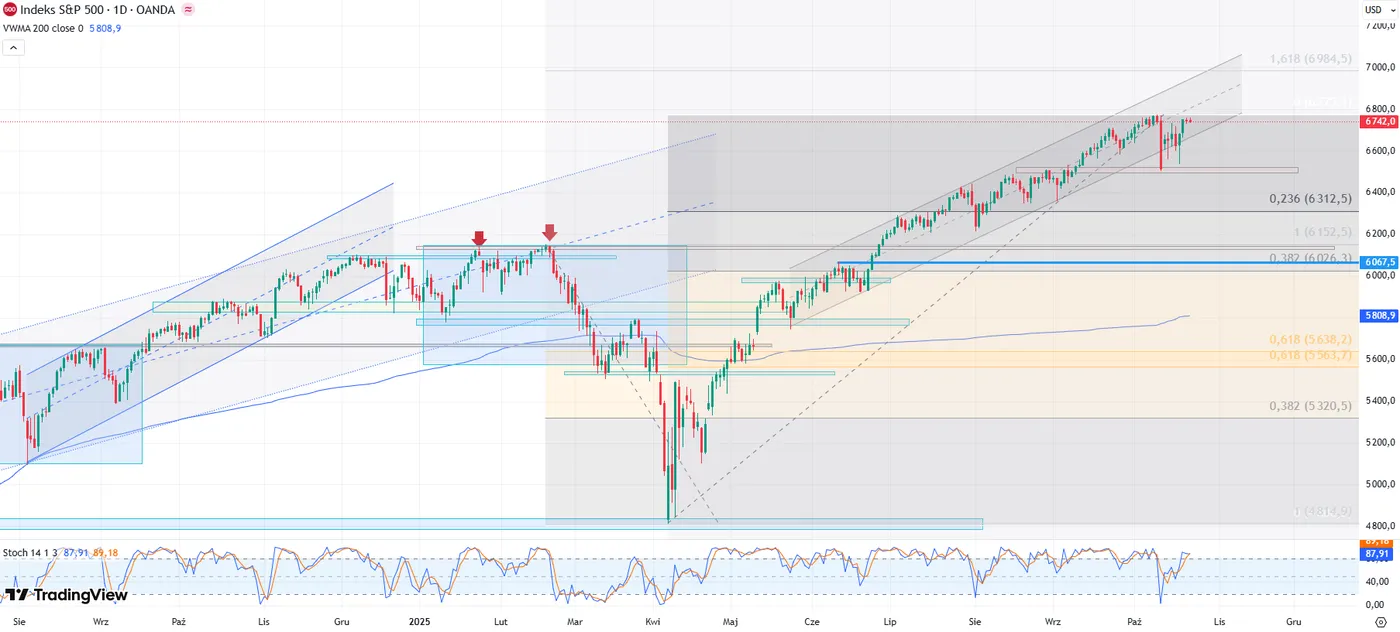
Chart of the CFD contract based on the S&P 500 index, daily data, source: TradingView
S&P 500 Approaches Record Highs Again After Rapid Sentiment Rebound
The S&P 500 index is currently experiencing another upward move, and we may soon witness an attempt to break through its historical highs. The recent, somewhat sharper decline only temporarily pushed the index below the lower boundary of its rising channel, marking local lows at horizontal support around 6,500 points.
A swift improvement in market sentiment turned the recent sell-off into a good opportunity to take long positions. From a technical perspective, it is now important to observe how the price behaves near the all-time high (ATH) level. If we see another round of profit-taking, a double top formation could emerge on the chart, which might serve as an early indication of a deeper and more prolonged downward correction.
GBP/USD Slide Continues After UK Inflation Data. Is the Door Open for December BoE Rate Cut?
GBP/USD has fallen around 60 pips since the UK inflation data release this morning. This could be down to the fact that traders added to BoE easing bets, seeing 17bps of cuts by December.
The inflation print has brought a December rate cut into play once more as the print comes after wage growth also showed signs of a slowdown last week. However, the BoE decision in December may now rest with the outcome of the UK Autumn budget due in November.
UK Inflation Data Opens Door to December Rate Cut
The most significant takeaway from the latest UK inflation data is the big drop in food inflation.
Officials and the Bank of England (BoE) had grown increasingly concerned throughout the year about rising food prices partly driven by April's tax and minimum wage hikes, fearing that this could fuel consumer expectations and turn the current spike into a more persistent inflation problem. Fortunately, food prices actually dropped in September, pulling the annual rate below 5% and running significantly below the BoE's August forecasts.
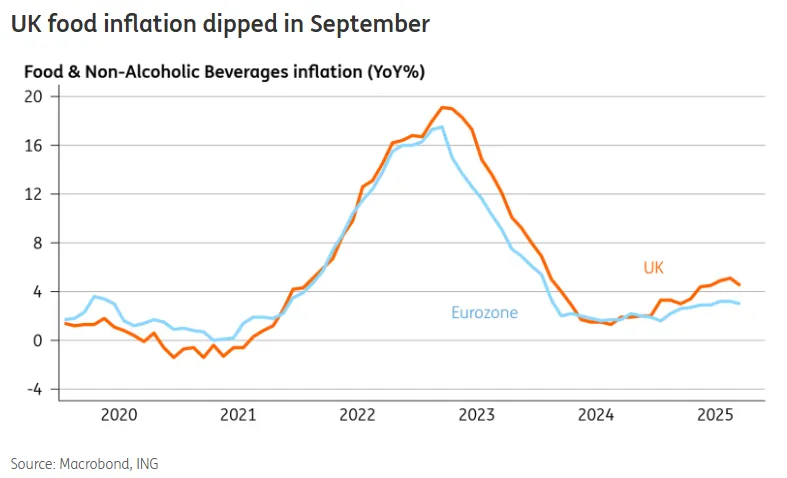
Source: ING
A similar easing was seen in services inflation, which also dipped below projections, with various measures of "core services," including the closely-watched restaurants and cafés sector, showing a decline.
This is particularly reassuring because the BoE had worried that pressure from food inflation could eventually emerge as a slower-moving, more lasting problem in the catering sector, but its annual price rate also thankfully eased in September.
I initially predicted an interest rate cut in November, but because the Bank of England (BoE) has been cautious lately, I was forced to reevaluate my position. The market is now much more optimistic about a December cut, pricing a 72% chance of it happening.
A December cut is certainly possible, but it will depend on the specifics of the late-November Autumn Budget. Specifically, the Bank will need to see proof that the government plans to significantly tighten spending in 2026, mainly through tax increases, and that these new taxes won't accidentally cause inflation to rise again next year, as some tax hikes did recently.
US Dollar Resurgence and US CPI Ahead
The US dollar has been on a decent run this week with the Dollar index on course for a retest of the October 9 highs around the 99.57 handle.
This has also contributed to the recent fall in GBP/USD.
The question now as markets await the highly anticipated US Inflation print due on Friday is whether this is just repositioning ahead of the CPI release.
This could be the Dollar rising ahead of the CPI release before falling once the data is out. A very intriguing time for the US Dollar and one which could have wider implications for many currency pairs and asset classes.
Friday also brings a host of data from the UK. We have retail sales numbers and S&P PMI data scheduled for release which could impact GBP/USD.
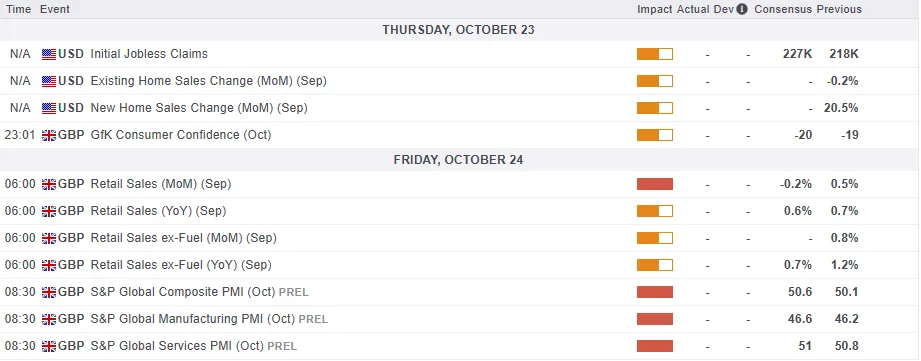
For all market-moving economic releases and events, see the MarketPulse Economic Calendar. (click to enlarge)
Technical Analysis - GBP/USD
From a technical point of view, GBP/USD on the four-hour chart has returned to a key area of support around the 1.3300 handle.
The current four-hour candle is showing signs of a potential move higher but does face some resistance ahead at the 1.3333 and 1.3378 handles respectively.
If cable rejects at any of these resistance levels, support at the 1.3250 comes into play before eyes turn to the psychological pivot level around the 1.3000 mark
GBP/USD Daily Chart, October 22, 2025
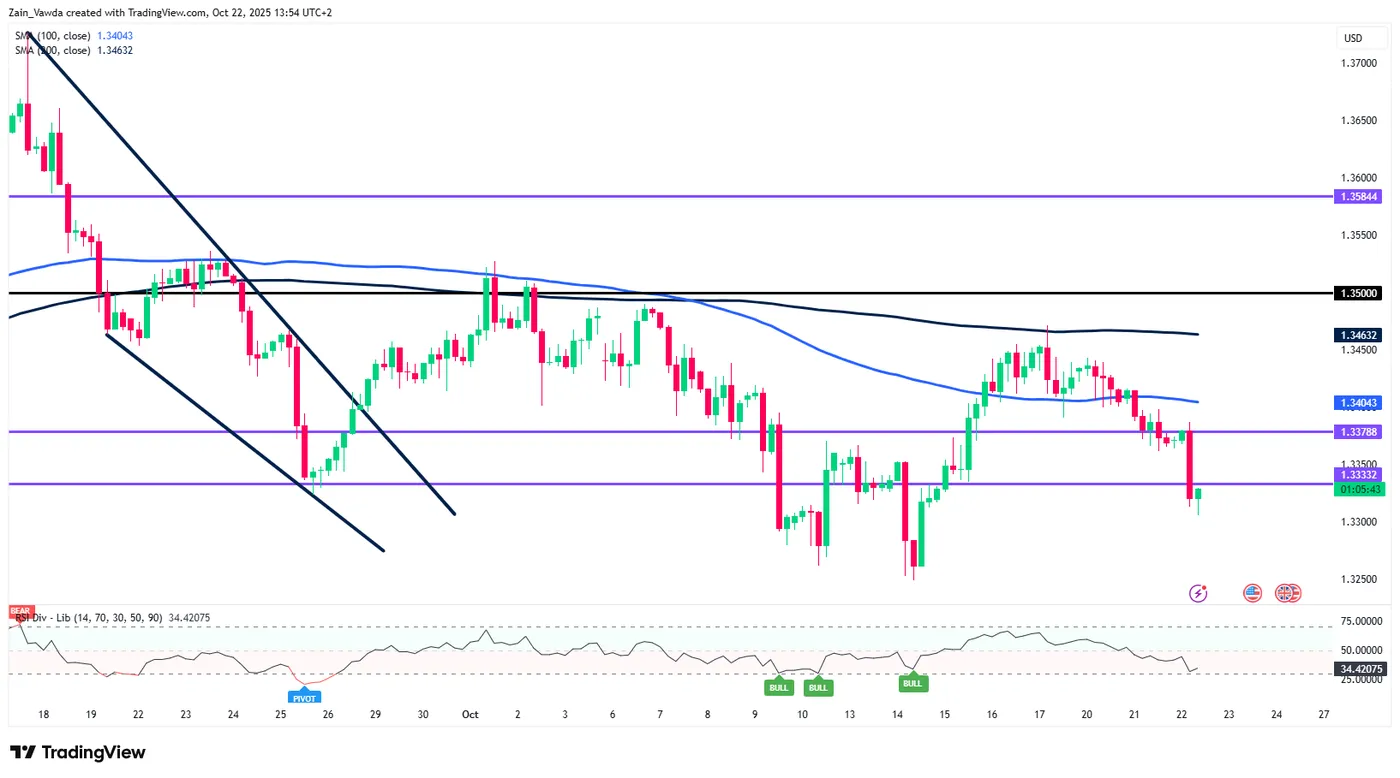
Source:TradingView.com
GBP/CHF dips but range holds as UK CPI not dovish enough
Sterling slipped today after softer-than-expected UK inflation data reinforced expectations that the BoE remains on track to cut rates again this year—though not as soon as the next meeting. A November pause still appears more likely, with solid reasons to wait until after the November 26 Budget and another round of inflation data before committing to further easing.
However, expectations for a December rate cut have strengthened notably. Interest-rate futures now assign roughly a 75% probability that the BoE will lower the Bank Rate to 3.75% from 4.00% at the December meeting—up from about 46% before the CPI release. Traders have also brought forward expectations for the next move, fully pricing a second 25-basis-point cut by February 2026, a month earlier than previously anticipated.
In the currency market, the Pound’s selloff was broad but relatively shallow. The muted reaction reflected that traders see the BoE cutting soon—but not urgently—keeping Sterling supported above key levels for now.
Technically, GBP/CHF is still holding above 1.0582 temporary lower despite today's dip. Some more consolidations could still be seen. Nevertheless, near term outlook is staying firmly bearish with 1.0778 resistance intact. Break of 1.0582 will pave the way to 100% projection of 1.1204 to 1.0658 from 1.0959 at 1.0413.
Silver Price Falls Below $50
According to the XAG/USD chart, silver has fallen below the $50 mark after setting a historic high on 17 October, when the price briefly climbed above $54.40 for the first time.
Since then, the market has turned lower:
→ Silver formed a bearish ABCD pattern and broke below the key $50 psychological level.
→ A similar move occurred in gold, which dropped this week from around $4,375 to nearly $4,000 per ounce.
As many media outlets have noted:
→ The decline in precious metals appears to be a correction within a broader uptrend;
→ The fundamental outlook remains strong.
However, the aggressive nature of the sell-off raises concern.
→ On one hand, the drop may have been driven by an overheated rally and heavily leveraged long positions.
→ On the other, the speed of the decline suggests the autumn metals rally could be nearing exhaustion.
Technical Analysis of the XAG/USD Chart
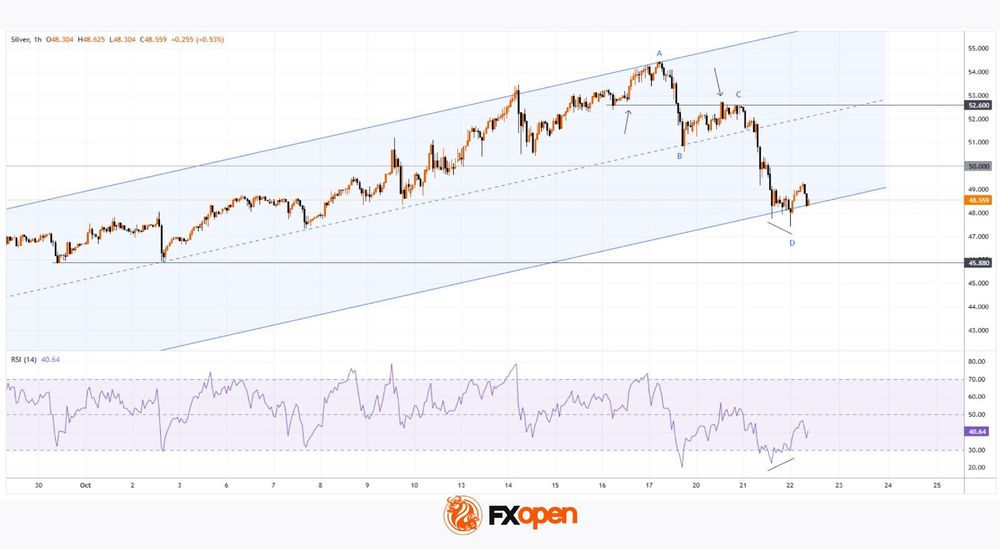
An analysis of XAG/USD reveals several key turning points, allowing the construction of a widened ascending channel. This week’s drop has stretched the channel downward, effectively turning the former lower boundary into the new median line.
Bullish perspective:
→ The new lower boundary of the expanded channel acts as strong support.
→ A bullish RSI divergence has formed.
→ Price action near point D this morning resembles a potential Triple Bottom pattern.
Bearish perspective:
→ Selling pressure this week has been highly effective, with bears managing to break through:
$52.60, which has now flipped from support to resistance;
The $50 psychological level.
Given the above, it is reasonable to assume that bulls may attempt to use the lower boundary of the expanded channel to restart the autumn uptrend. However, after such a sharp sell-off, confidence may remain fragile. Should $50 now act as resistance, bears could target the next support near $45.88.
Start trading commodity CFDs with tight spreads. Open your trading account now or learn more about trading commodity CFDs with FXOpen.
This article represents the opinion of the Companies operating under the FXOpen brand only. It is not to be construed as an offer, solicitation, or recommendation with respect to products and services provided by the Companies operating under the FXOpen brand, nor is it to be considered financial advice.
Gold: Downside Remains Vulnerable After Bears Cracked Critical $4,000 Support
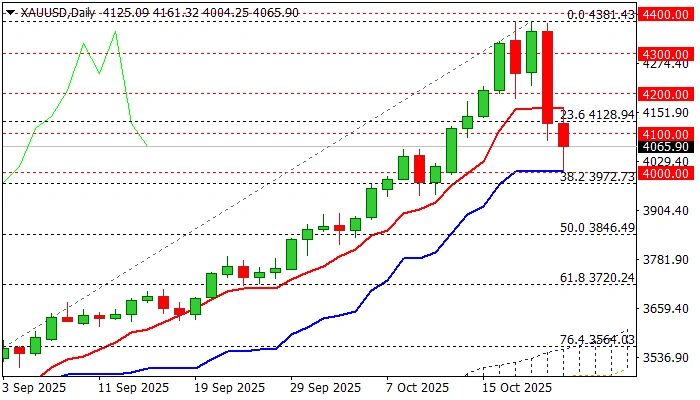
Gold remains in roller coaster mode, as a lot of action has been seen since late last night’s update, with all options still being on the table.
Slight optimism was sparked after Tuesday’s closing above $4100, though subsequent gains failed to fulfill the minimum requirement, as recovery attempts were capped by initial barrier – daily Tenkan-sen ($4164) that kept the upper breakpoint at $4200 out of reach and left the downside vulnerable.
Overnight’s action showed dominating negative sentiment as the price fell further and tested critical support at $4000 (psychological, reinforced by daily Kijun-sen and nearby Fibo 38.2% retracement of $3311/$4381 rally), but quick bounce showed the significance of this support.
Near-term action continues to move within a wider swings around $4100 level, pointing to indecision, but also signaling that key support at $4000 remains at increased risk.
Bearish hourly studies (negative momentum / 30/200HMA bear cross) support negative scenario, but larger bullish structure remains intact (the latest pullback was the biggest correction since 2022), adding to scenario of re-entering fresh longs if $4000 holds and once we see bullish signal.
Caution on break of $4000 as this may lead to deeper correction and expose supports at $3900 / $3850 and put larger bulls on hold.
Fundamental picture remains mainly unchanged, with focus on Trump Xi meeting which is expected to ease trade tensions between two largest world economies and probably produce some negative impact on safe-haven demand.
Markets also await release of delayed US inflation report (due on Friday) which would provide more details to Fed ahead of their next week’s policy meeting as investors widely expect the central bank to deliver two rate cuts by the end of the year.
Res: 4128; 4167; 4200; 4225.
Sup: 4000; 3972; 3900; 3850.
Gold (XAU/USD): Short-Term Bullish Reversal Triggered After 8% Sell-Off
Key takeaways
- Gold’s sharp correction: XAU/USD plunged over 8% from its all-time high of US$4,381, marking its steepest drop since August 2020.
- Short-term bullish reversal signs: Technical indicators, including bullish “Hammer” candlestick formations and RSI divergence, signal potential rebound momentum.
- Medium-term uptrend intact: Gold remains supported by a sustained downtrend in the 10-year US Treasury real yield below 1.87%.
- Key levels to watch: Support sits at US$4,056/4,000; resistance zones at US$4,267, US$4,380, and US$4,424/4,455.
Gold (XAU/USD) has experienced a volatile movement in the past three sessions. The precious yellow metal has managed to reverse the 1.7% loss it incurred last Friday, 17 October 2025, and rallied by 2.4% on Monday, 22 October 2025, to print a fresh record high of US$4,381.
Thereafter, gold (XAU/USD) recorded a swift decline on Tuesday, 21 October 2025, where it tumbled by 6.3% on an intraday basis, but it pared back some losses to close at US$4,125 with a daily loss of -5.3%, still a significant occurrence as yesterday’s loss was the worst since August 2020.
Yesterday’s swift decline is likely due to stop-losses triggered on short-term leveraged long positions on gold (XAU/USD), where it has gained “attraction” after the bullish breakout triggered on 29 August 2025 from the prior 4-month of “Ascending Triangle” range configuration that led to a steep bullish impulsive up move sequences in the recent two months.
Interestingly, longer-term technical elements and one key macro factor are still suggesting that the medium-term and major uptrend phases of gold (XAU/USD) remain intact.
A lower long-term US real interest rate acts as a tailwind for gold
10-year US Treasury real yield remains in a medium-term downtrend
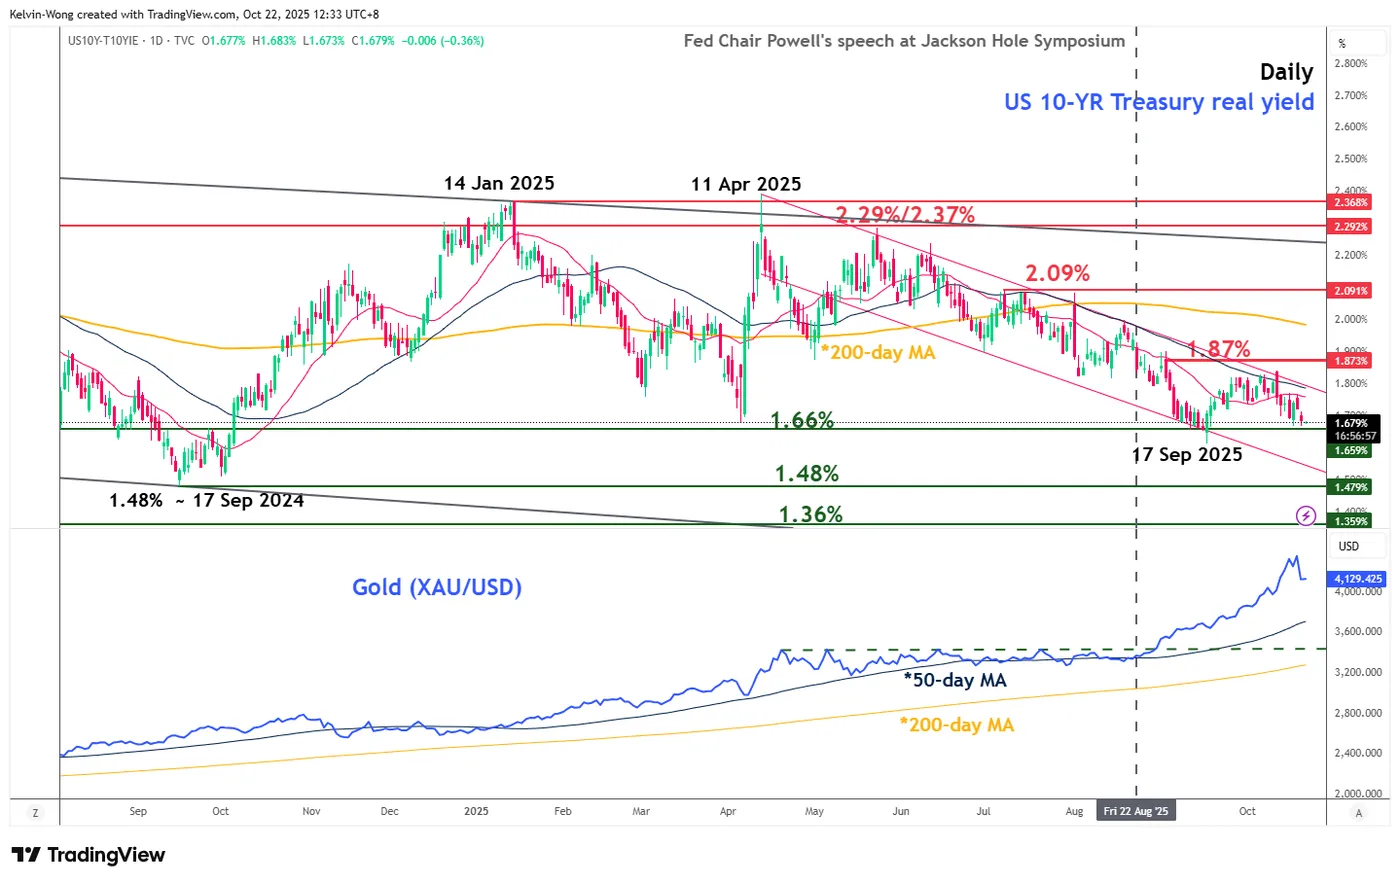
Fig. 1: 10-year US Treasury real yield with Gold (XAU/USD) medium-term & major trends as of 22 Oct 2025 (Source: TradingView)
The 10-year US Treasury real yield (excluding 10-year breakeven inflation rate) medium-term downtrend remains intact as it remained below its 50-day moving average and 1.87% key medium-term resistance (see Fig. 1).
Based on intermarket analysis, a cap on any further rebound in the 10-year US Treasury real yield below 1.87% and a break below 1.66% key intermediate support reduces the opportunity costs of holding gold (XAU/USD) as it is a non-income-bearing asset, in turn, creating a further positive feedback loop back into the price actions of gold (XAU/USD).
Interestingly, the prior decline in the 10-year US Treasury real yield from 2.05% on 1 August 2025 to 1.79% on 28 August 2025 coincided with gold (XAU/USD)’s bullish breakout from its former 4-month “Ascending Triangle” range configuration in place since April 2025.
Let’s now examine the latest short-term trajectory (1 to 3 days), relevant key elements, and key levels to watch for Gold (XAU/USD) from a technical analysis perspective
Preferred trend bias (1-3 days) – Bullish reversal at US$4,056/4,000 key support
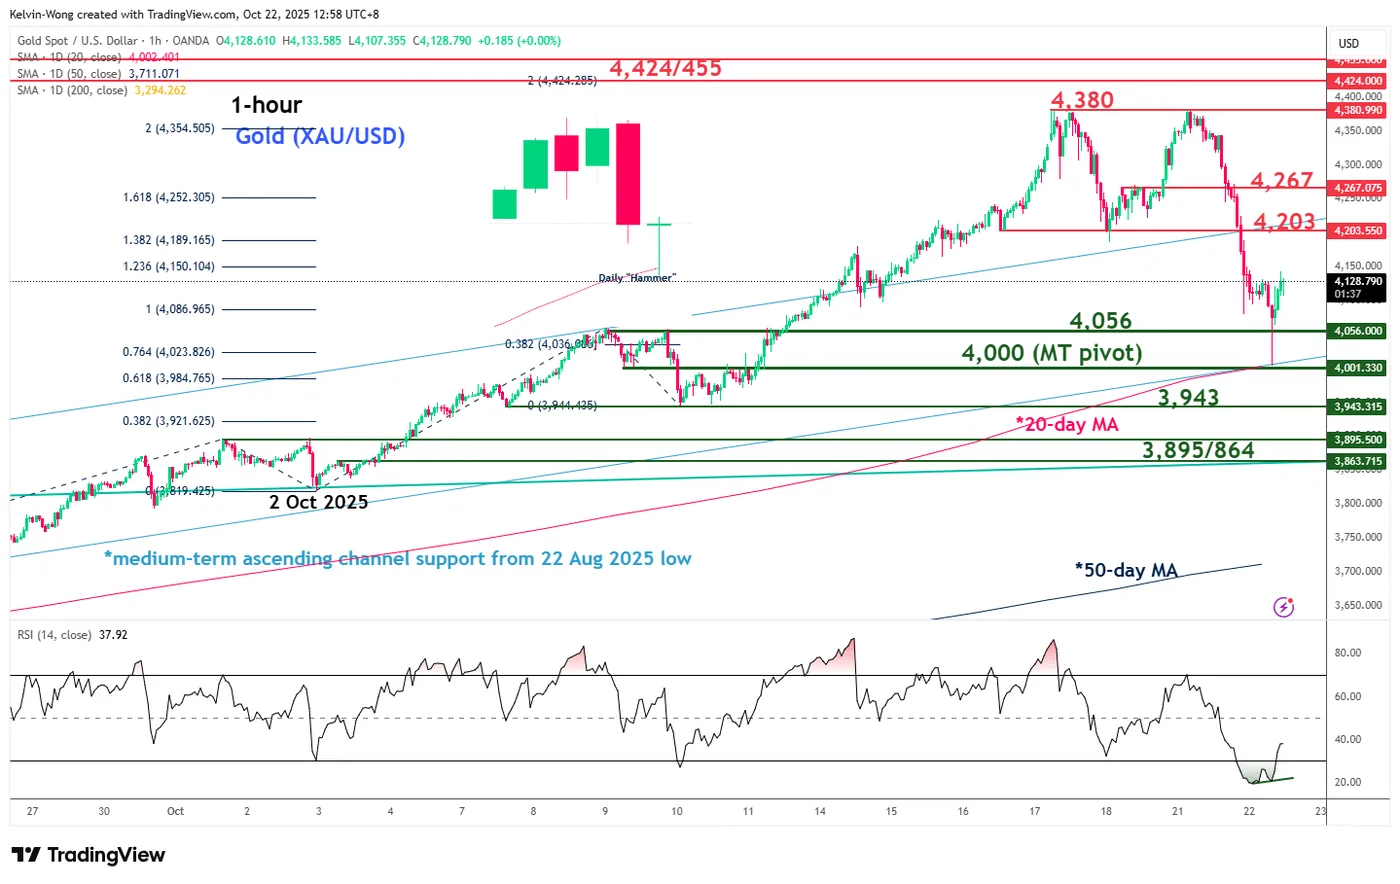
Fig. 2: Gold (XAU/USD) minor trend as of 22 Oct 2025 (Source: TradingView)
Watch the US$4,056/4,000 key medium-term pivotal support, and a clearance above US$4,203 is likely for the bullish reversal scenario to gain traction for the next intermediate resistances to come in at US$4,267, US$4,380 (current all-time high area), and US$4,424/4,455 (see Fig. 2).
Key elements
- Gold (XAU/USD) has staged a swift decline of 8.6% from its current all-time high of US$4,381 printed on Monday, 20 October 2025, to a current intraday low of US$4,004 on Wednesday, 22 October 2025, at the time of writing.
- The 8% plus rapid decline in the price actions of gold (XAU/USD) has led the hourly RSI momentum indicator of gold to hit an extreme oversold level of 19.61on Wednesday, 22 October 2025, and subsequently, flashed out a bullish divergence condition.
- The price action of Gold (XAU/USD) has formed an hourly bullish “Hammer” candlestick in today’s Asia session, right after a retest of its rising 20-day moving average. Also, it has formed an impending daily “Hammer” candlestick. These observations suggest a potential capitulation of bearish momentum.
Alternative trend bias (1 to 3 days)
Failure to hold at the US$4,056/4,000 key medium-term support invalidates the bullish reversal scenario for gold (XAU/USD), where a medium-term (multi-week) corrective decline may unfold to expose the next intermediate supports at US$3,943 and US$3,895/3,864
Gold Dips From Highs As WTI Crude Oil Attempts Rebound
Gold price started a downside correction from $4,380. WTI Crude oil is now attempting to recover after sliding toward $56.00.
Important Takeaways for Gold and WTI Crude Oil Prices Analysis Today
- Gold price climbed higher toward the $4,380 zone before there was a sharp decline against the US Dollar.
- It traded below a bullish trend line with support at $4,300 on the hourly chart of gold at FXOpen.
- WTI Crude oil prices extended losses below the $60.00 support zone.
- It cleared a key bearish trend line with resistance at $57.50 on the hourly chart of XTI/USD at FXOpen.
Gold Price Technical Analysis
On the hourly chart of Gold at FXOpen, the price climbed above $4,200. The price even spiked above $4,300 before the bears appeared.
A high was formed near $4,380 before there was a fresh decline below a bullish trend line with support at $4,300. There was a move below the $4,200 pivot level. The bears even pushed the price below $4,120 and the 50-hour simple moving average.
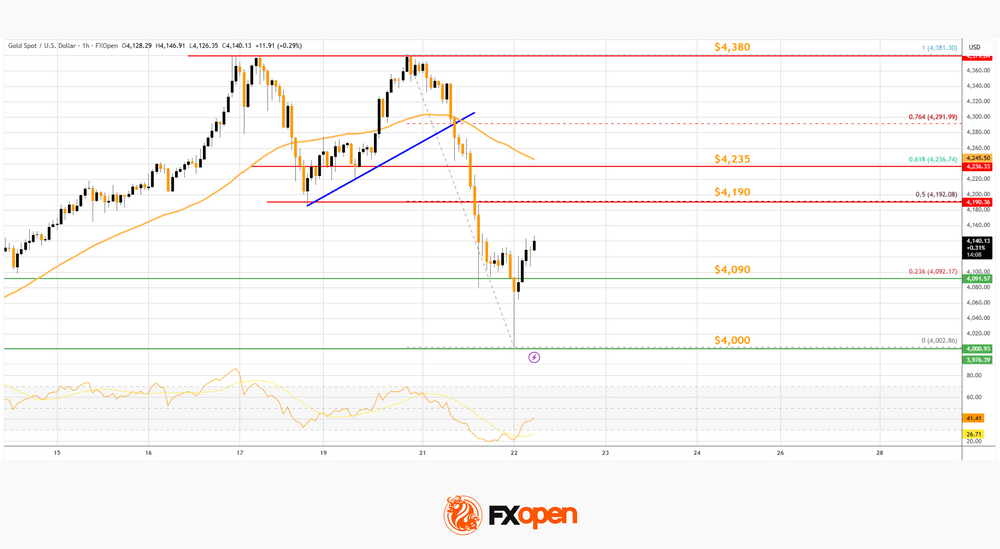
It tested the $4,000 zone. A low is formed near $4,002 and the price is now correcting losses. There was a minor move above the 23.6% Fib retracement level of the downward move from the $4,381 swing high to the $4,002 low.
Immediate resistance on the upside is near $4,190 and the 50% Fib retracement. The first major hurdle for the bulls could be $4,235 and the 50-hour simple moving average.
The main barrier for the bulls could be near the $4,380 level, above which the price could test the $4,500 zone. Any more gains might call for a move toward $4,650.
An upside break above $4,650 could send Gold price toward $5,000. Initial support on the downside is near $4,090 level. The next key level is $4,000. If there is a downside break below $4,000, the price might decline further. In the stated case, the price might drop toward $3,800.
WTI Crude Oil Price Technical Analysis
On the hourly chart of WTI Crude Oil at FXOpen, the price struggled to continue higher above $62.00 against the US Dollar. The price formed a short-term top and started a fresh decline below $61.20.
There was a steady decline below the $60.00 pivot level. The bears even pushed the price below $58.50 and the 50-hour simple moving average. Finally, the price tested $56.00. The recent swing low was formed near $55.94, and the price is now correcting losses.
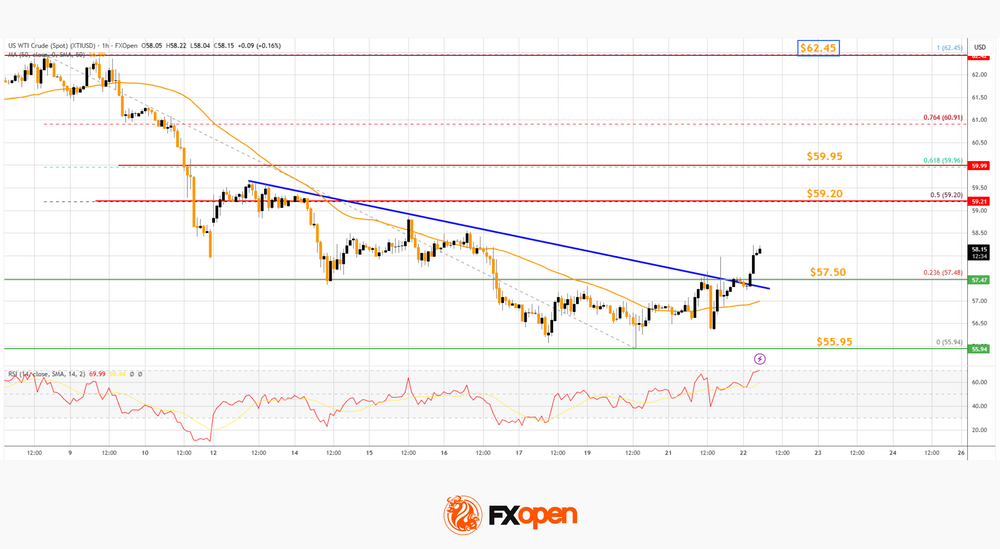
There was a move above the 23.6% Fib retracement level of the downward move from the $62.45 swing high to the $55.94 low. The price cleared a key bearish trend line with resistance at $57.50.
On the upside, immediate resistance is near the 50% Fib retracement at $59.20. The main hurdle is $59.95. A clear move above $59.95 could send the price toward $62.45. The next stop for the bulls might be $64.00.
If the price climbs further, it could face sellers near $65.00. Immediate support is $57.50. The next major level on the WTI crude oil chart is $55.95. If there is a downside break, the price might decline toward $55.00. Any more losses may perhaps open the doors for a move toward the $52.00 zone.
Start trading commodity CFDs with tight spreads. Open your trading account now or learn more about trading commodity CFDs with FXOpen.
This article represents the opinion of the Companies operating under the FXOpen brand only. It is not to be construed as an offer, solicitation, or recommendation with respect to products and services provided by the Companies operating under the FXOpen brand, nor is it to be considered financial advice.
Crypto’s Sell-the-Growth Mode
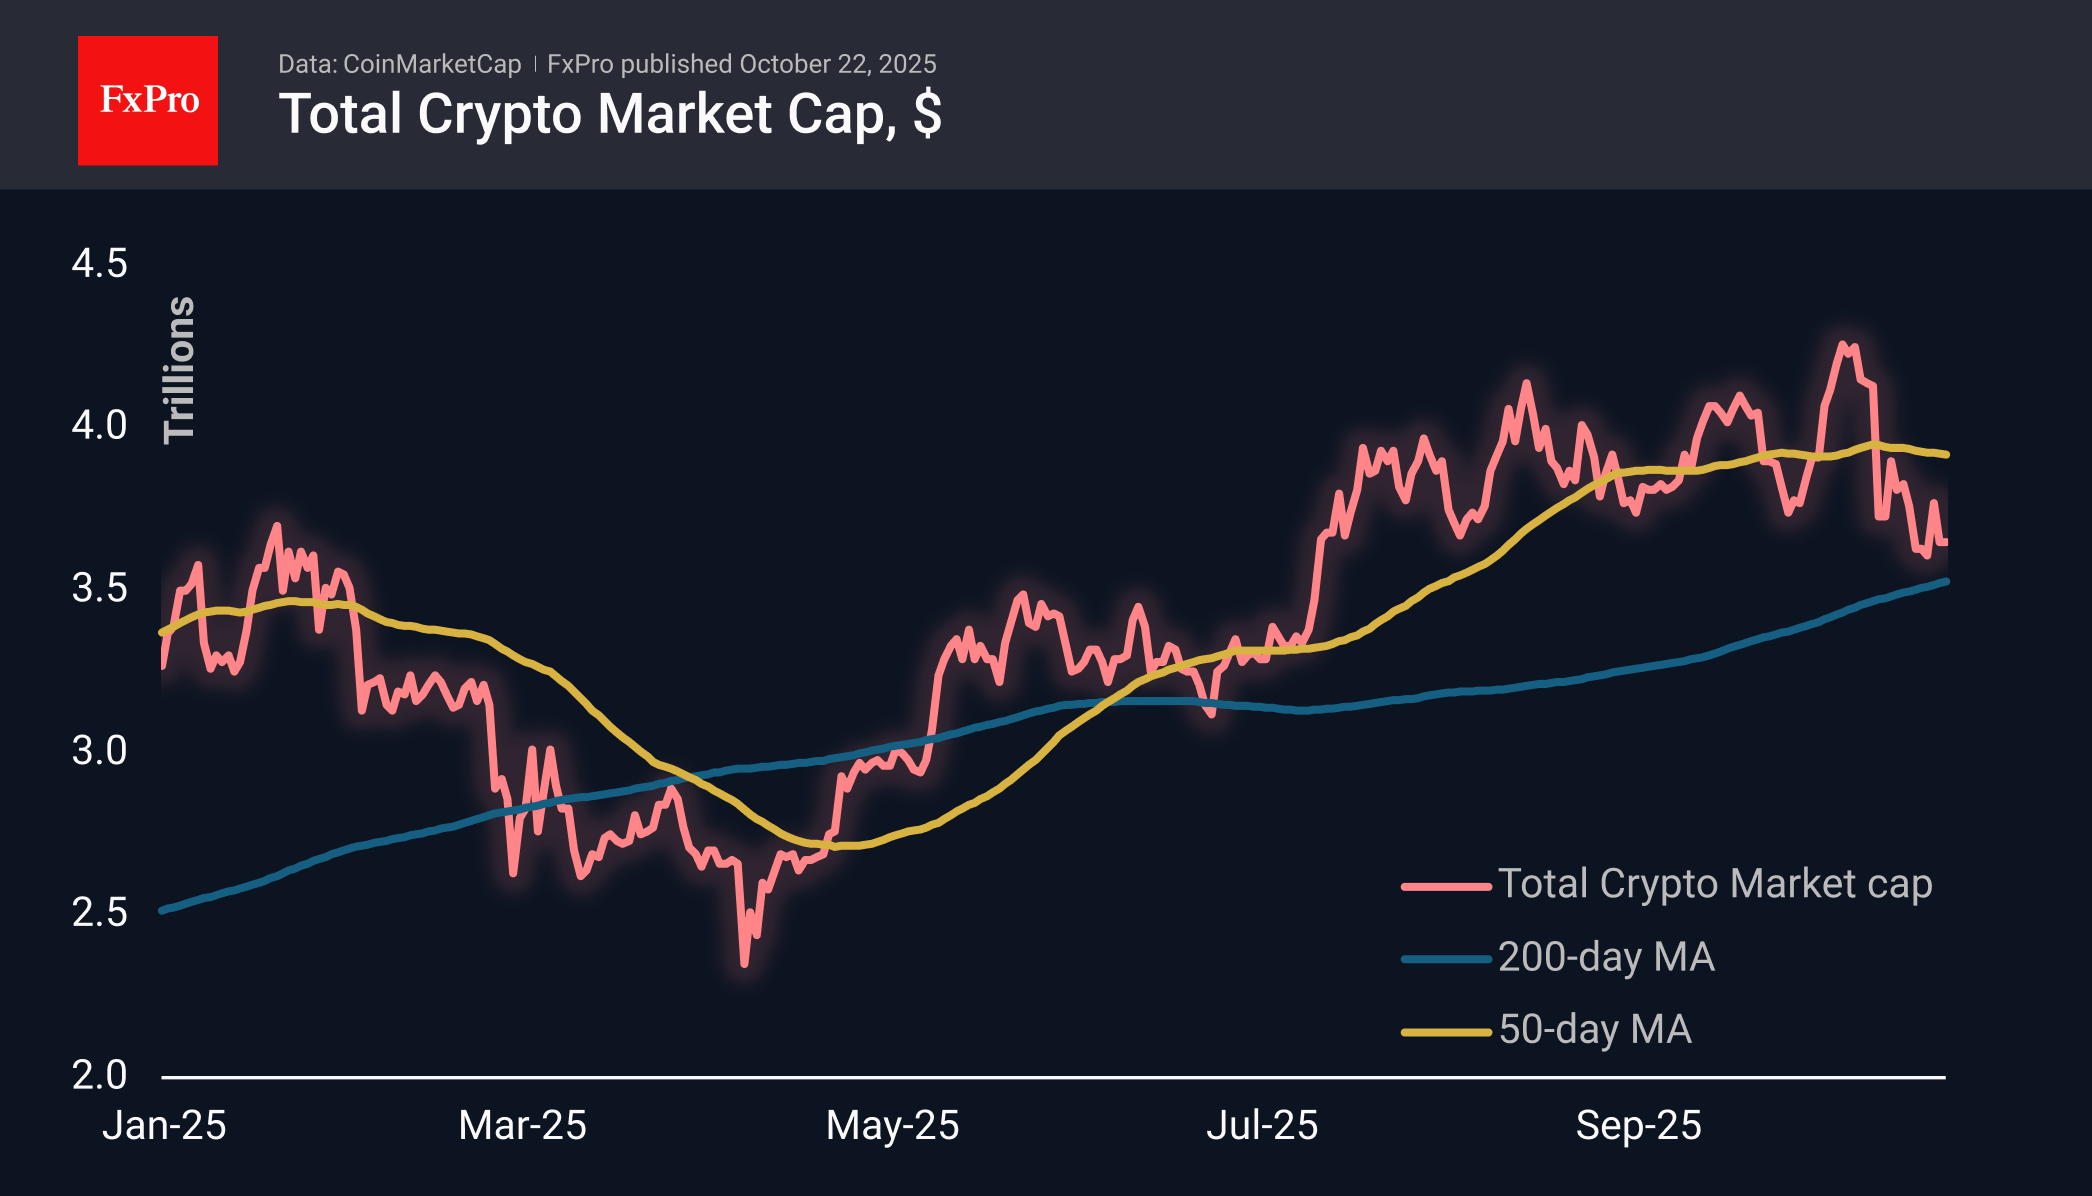
Market Overview
The crypto market cap changed slightly over the past day, remaining at $3.65 trillion, completing a full circle with a 5% increase and a return. Relatively small coins such as Zcash (+6.6%), Dash (+3%) and Tezos (+2.7%) performed slightly better than the market, remaining unaffected by the fluctuations in risk appetite among large institutions selling top coins on the rise.
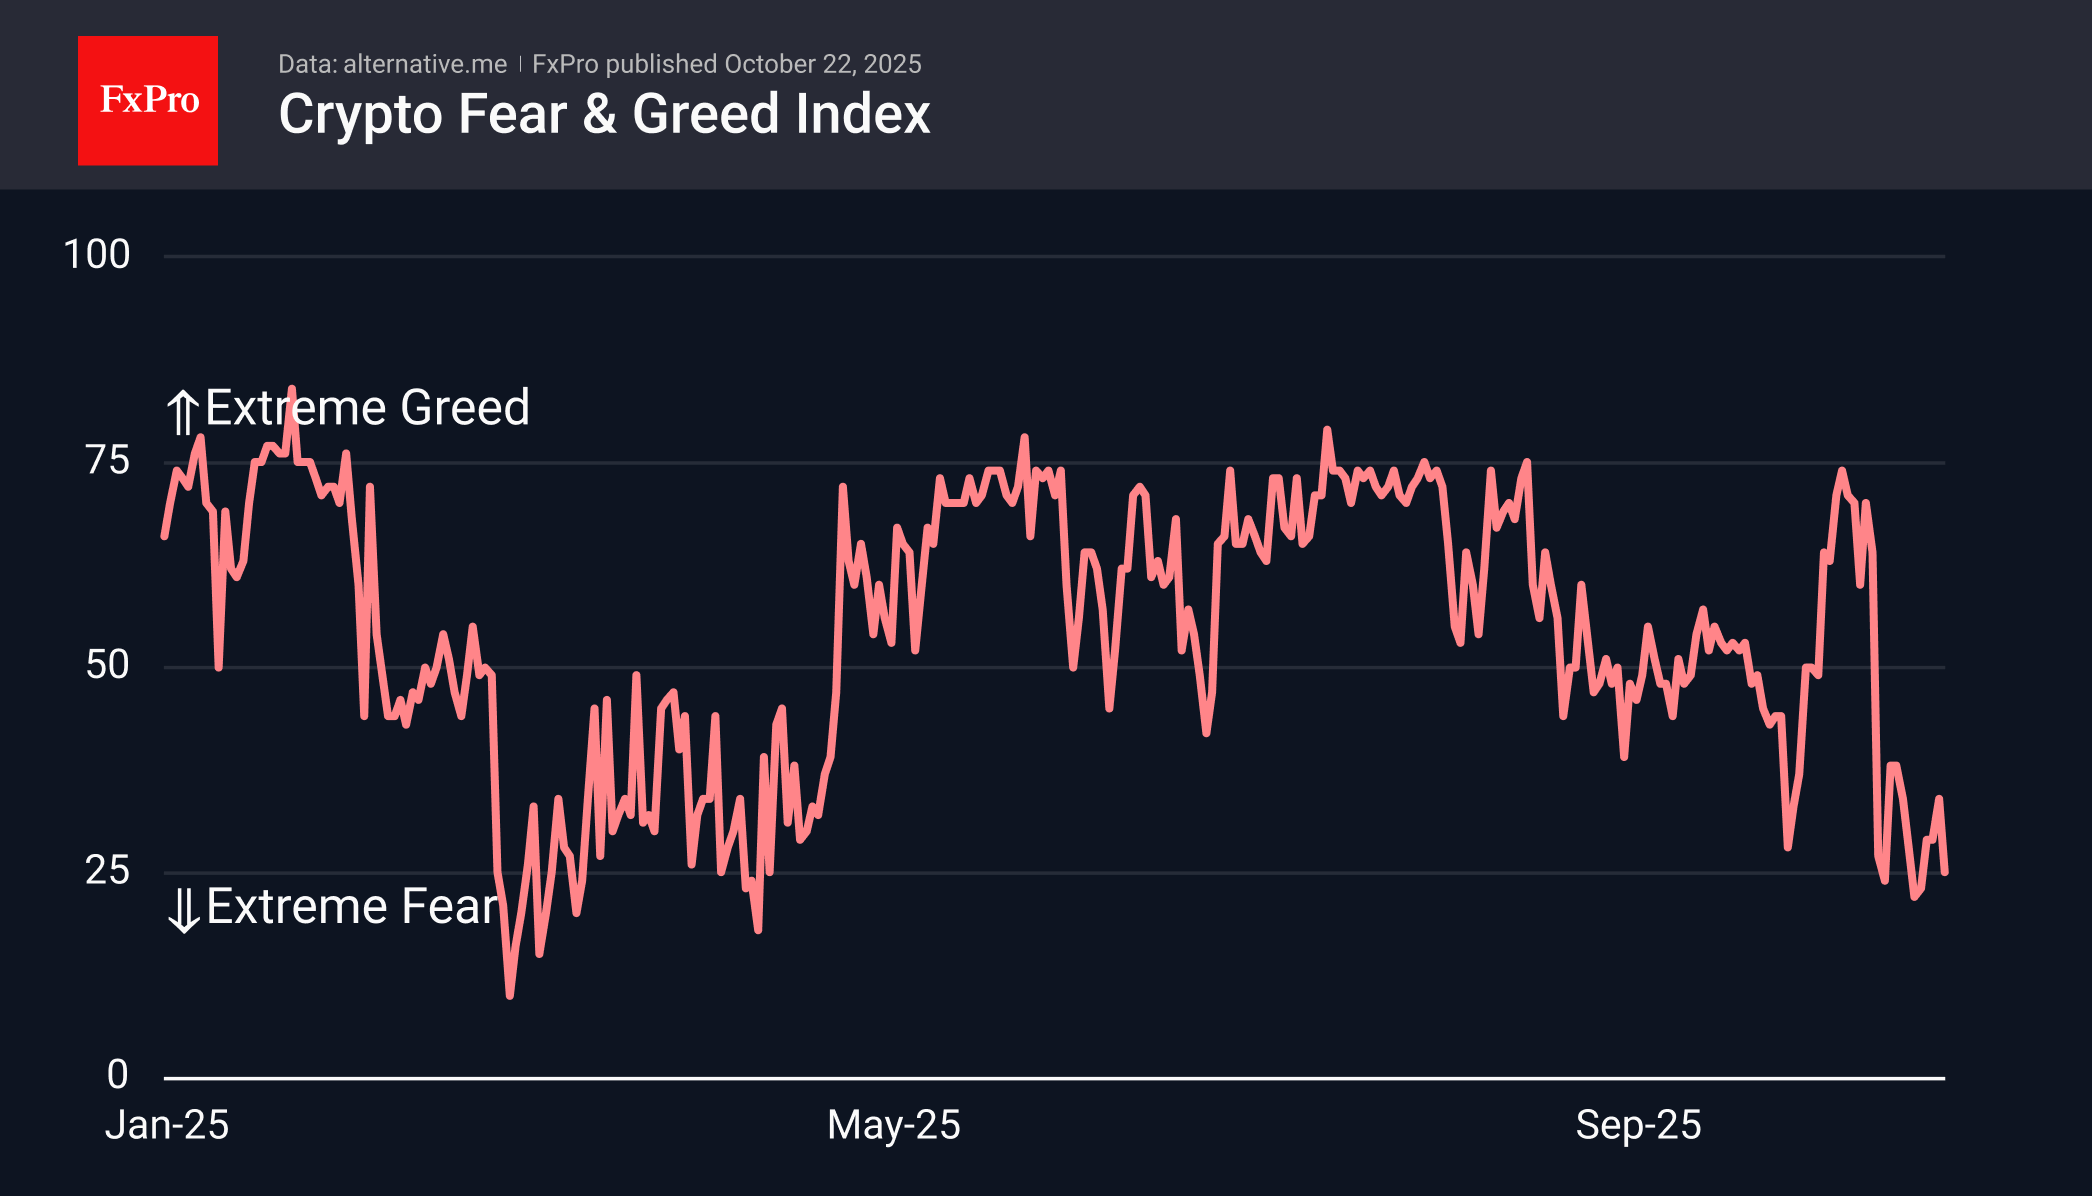
Such fluctuations do not contribute to improving the mood of crypto investors. On the contrary, the corresponding index fell to 25, on the verge of extreme fear territory. At current levels, the rule of ‘buy when everyone is afraid’ may work, or there may be a switch to a more intense sell-off after three months of stagnation.
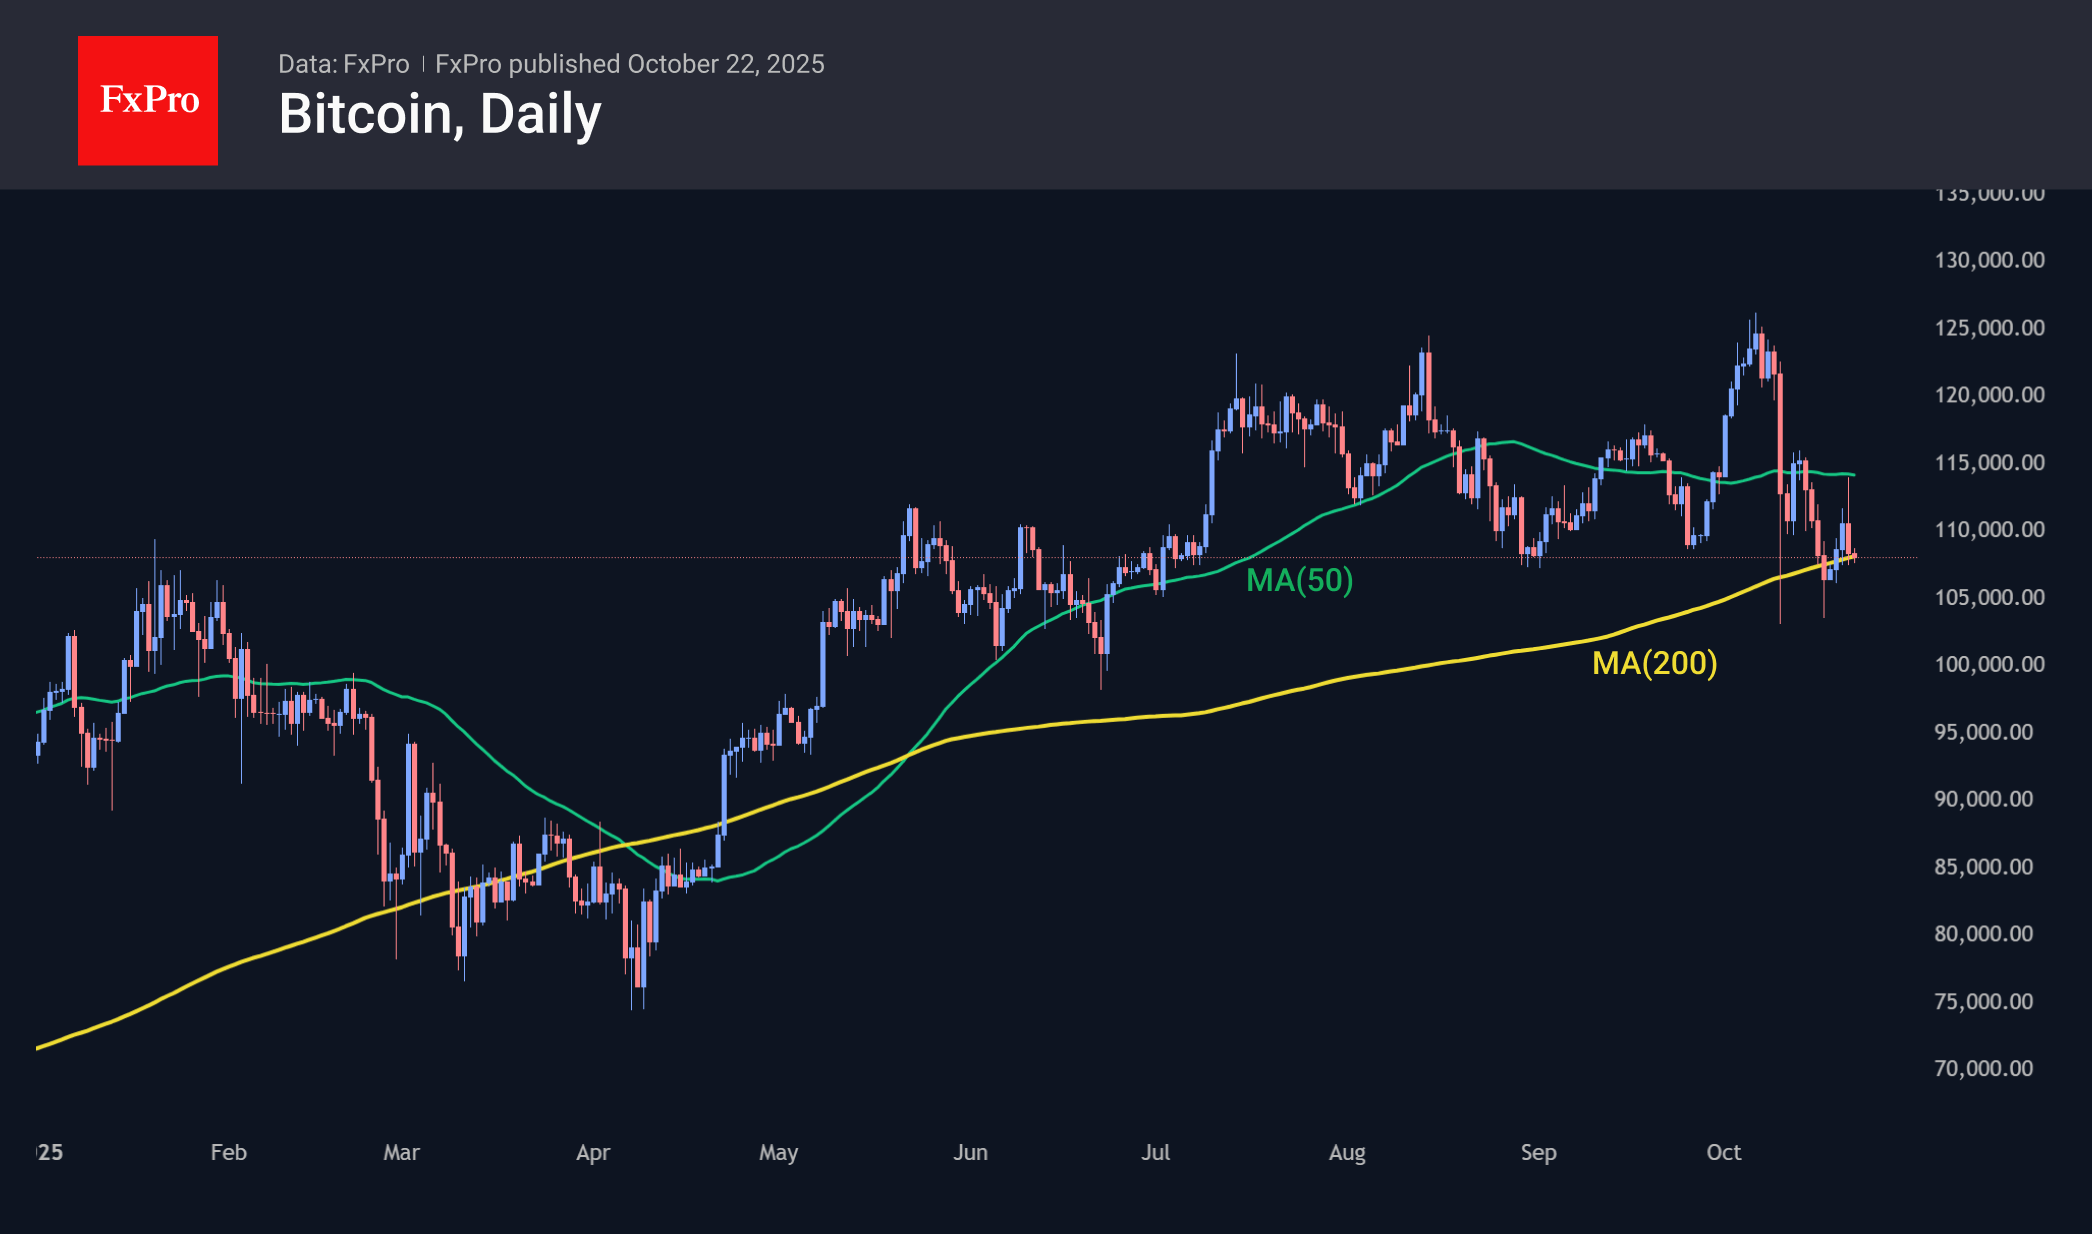
Bitcoin rose to $114K on Tuesday, touching the 50-day moving average, but this only fuelled sellers. Bitcoin has been balancing the 50- and 200-day MA for the last eleven days. The latter curve is pointing upwards, reducing the space for free fluctuations and bringing the moment when the market will have to choose a direction closer.
News Background
Bitcoin’s bullish phase is not over yet, according to the creator of the S2F model and analyst Plan B. The fundamentals point to continued growth, and there are no key technical signals indicating a final bull market phase.
According to BTSE COO Jeff May, market volatility will continue. TD Cowen remains positive about BTC and forecasts the asset to grow to $141,000 by December.
Analyst Willy Woo believes that the next bear market in the crypto cycle will differ from previous ones. It could be triggered by economic crises, such as those in 2001 and 2008, which the crypto market has not yet experienced.
Polygon co-founder Sandip Nailwal criticised the Ethereum network’s leadership and emphasised that its community has ‘turned into a circus.’ The success of projects on the ETH network depends on a few venture capital funds and proximity to a small circle of people around Vitalik Buterin, said Geth client developer Peter Szilagyi.
According to Lookonchain, Elon Musk’s company SpaceX has moved $257 million worth of Bitcoin for the first time since July. The company did not comment on the reasons for the transfers. According to Arkham, SpaceX owns 5,790 BTC.
Gold Undergoes Correction Amid Divergent Forces
Gold prices face continued pressure from a resilient US dollar and expectations that the Federal Reserve will maintain its restrictive monetary policy stance. These headwinds have triggered a technical correction in the precious metal.
However, ongoing geopolitical tensions and instability in the Middle East continue to underpin demand for safe-haven assets, providing a buffer against more substantial price declines.
In the coming sessions, investor attention will focus on key inflation data and scheduled speeches from Fed officials, which are likely to provide fresh direction for the precious metal.
Technical Analysis: XAU/USD
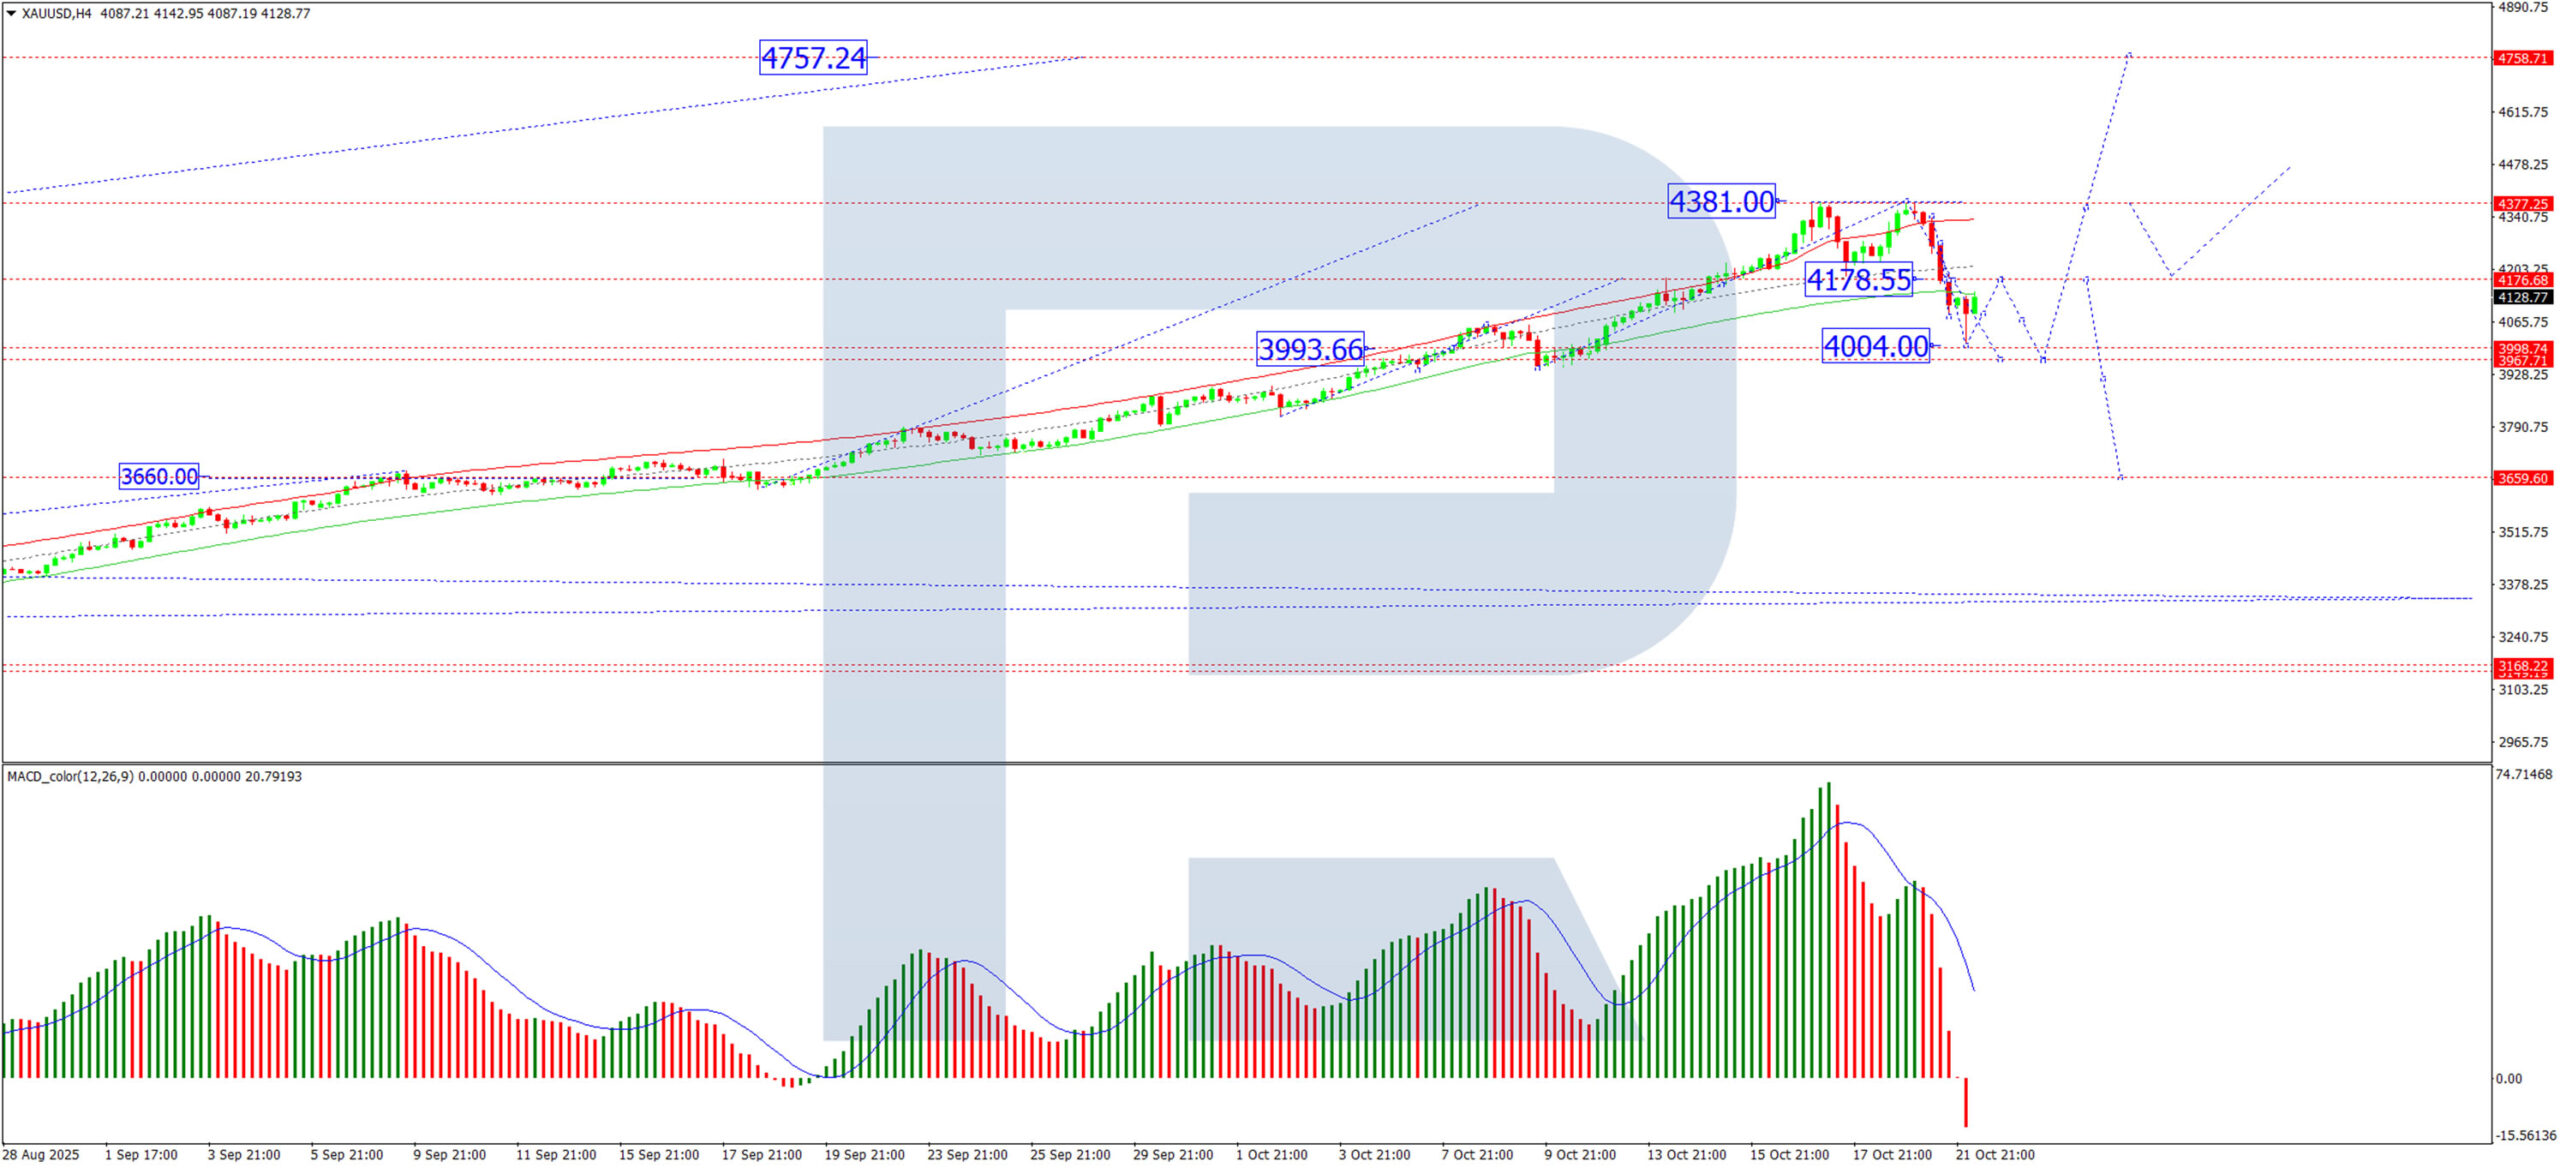
H4 Chart:
On the H4 chart, XAU/USD broke below the 4,175 USD support level, reaching the initial corrective target at 4,004 USD. The market is currently forming a retracement towards 4,175 USD, testing this former support level from below. Following the completion of this pullback, another leg down is anticipated within the broader correction, with a subsequent target at 3,970 USD. The MACD indicator confirms this bearish near-term outlook: its signal line is pointing downward while the histogram remains entrenched in negative territory, indicating continued selling pressure.
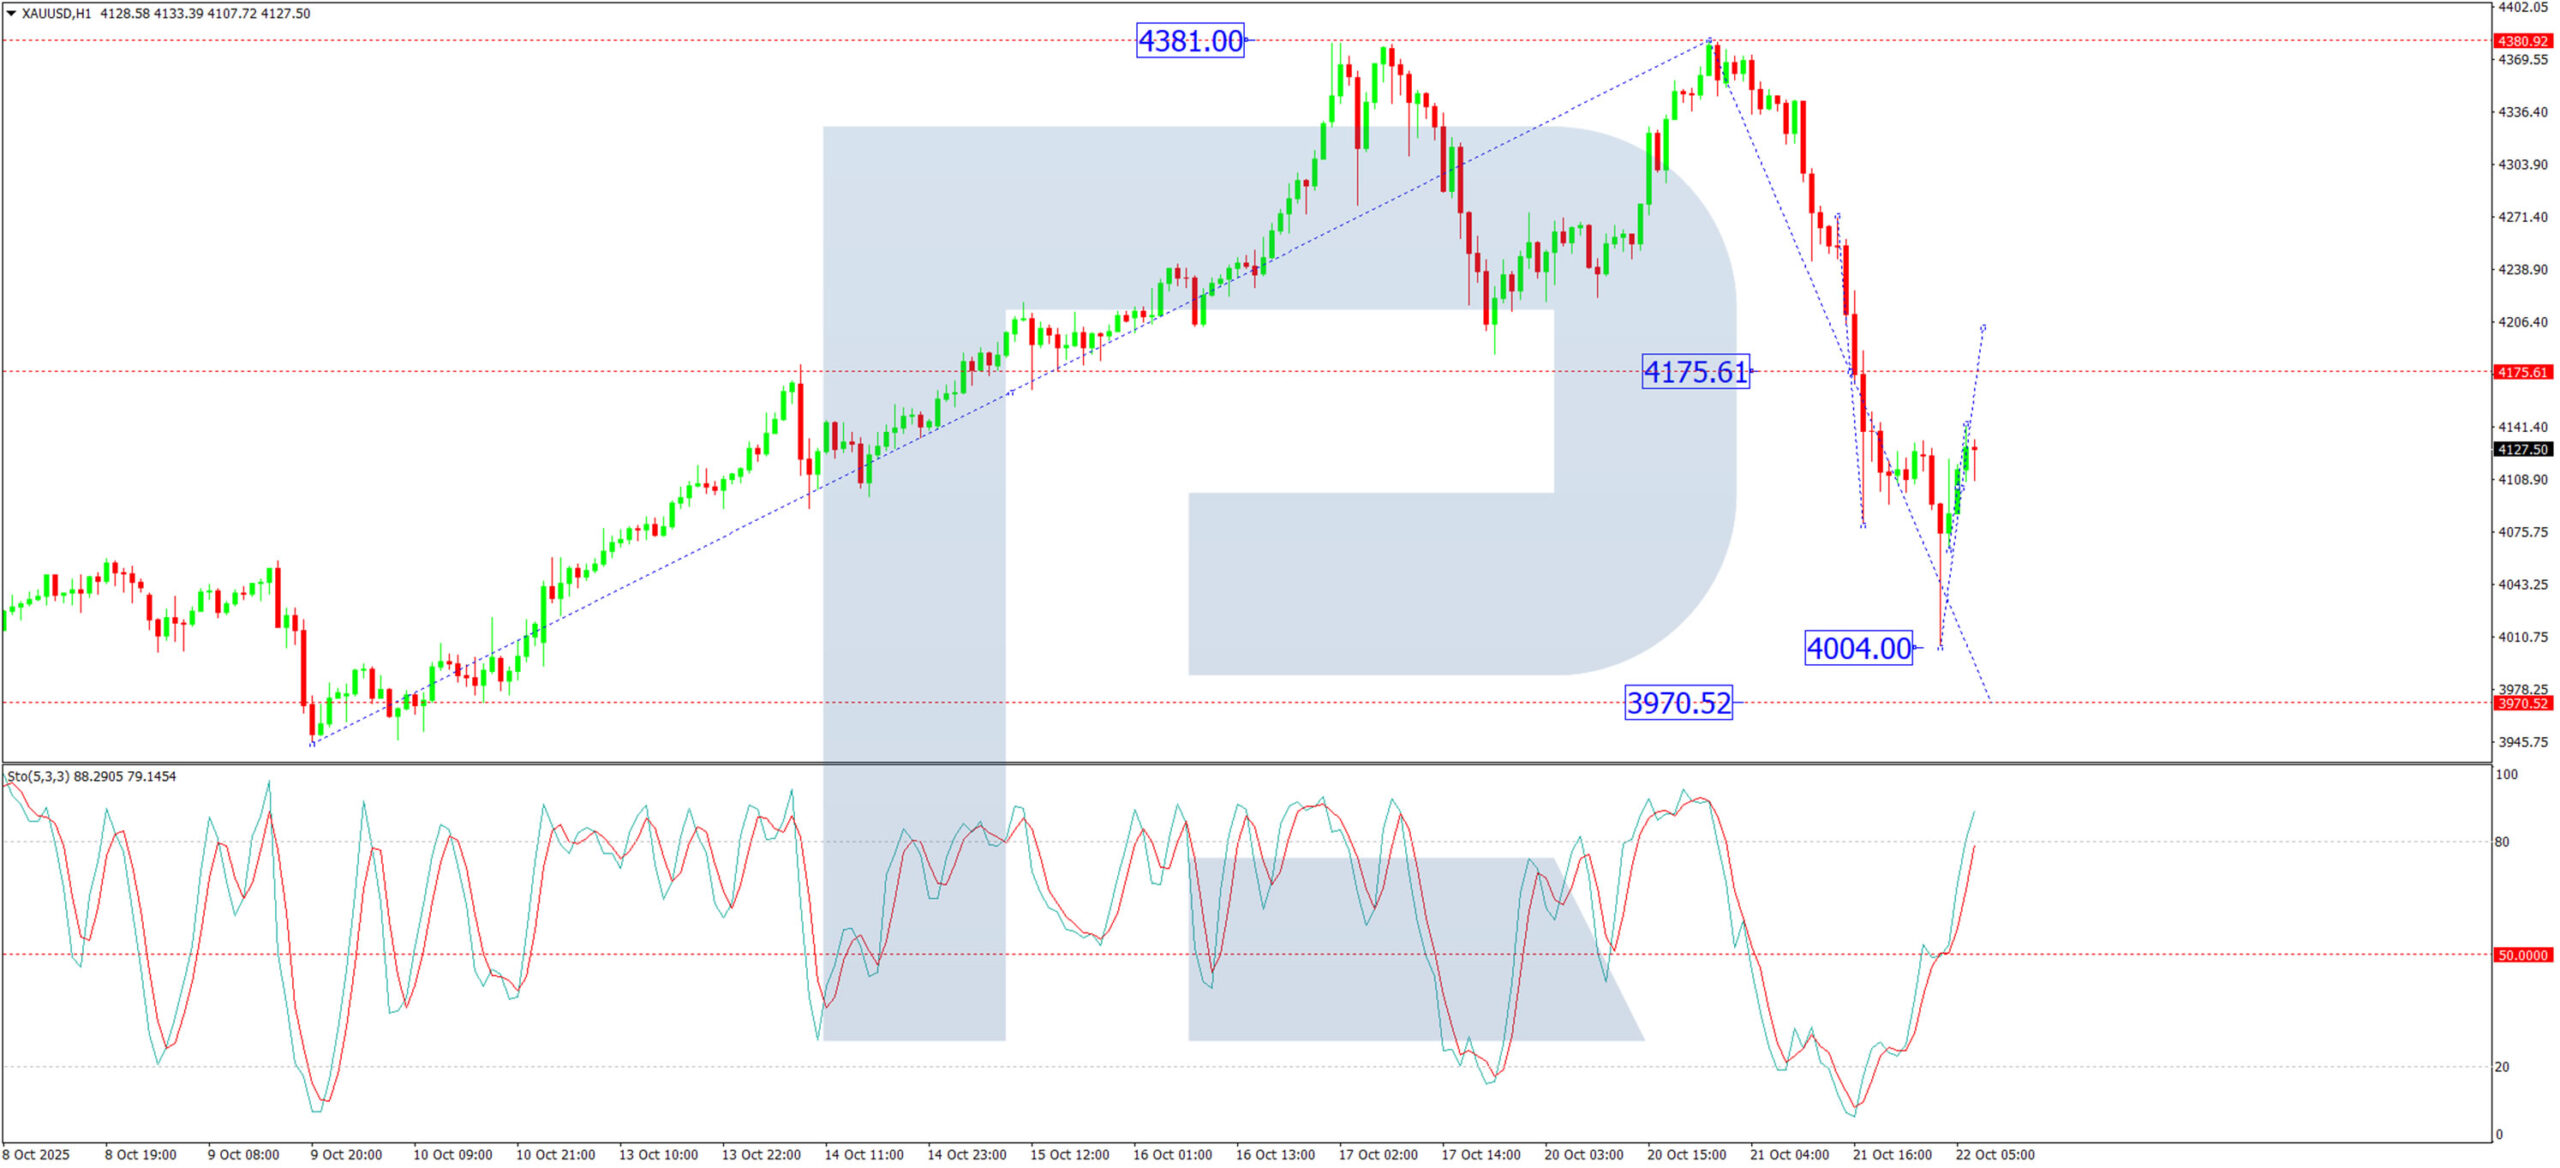
H1 Chart:
On the H1 chart, the instrument completed a downward wave to 4,004 USD before establishing a growth structure. The price is currently consolidating around 4,107 USD. An upward breakout from this range would likely propel prices toward 4,175 USD, retesting the previously breached support level. The Stochastic oscillator supports this short-term bullish scenario, with its signal line positioned above 50 and advancing toward 80, reflecting building upward momentum.
Conclusion
Gold remains caught between monetary headwinds and geopolitical support. While the broader correction appears intact, the current bounce from 4,004 USD suggests potential for further near-term recovery toward 4,175 USD. However, this upward move is likely to present selling opportunities for a resumption of the downtrend towards 3,970 USD. Traders should monitor incoming US data and Fed commentary for catalysts that could determine whether this correction deepens or concludes.