Sample Category Title
Back to the Future: RBNZ to Scale Back OCR Hikes as Energy Price Worries Recede
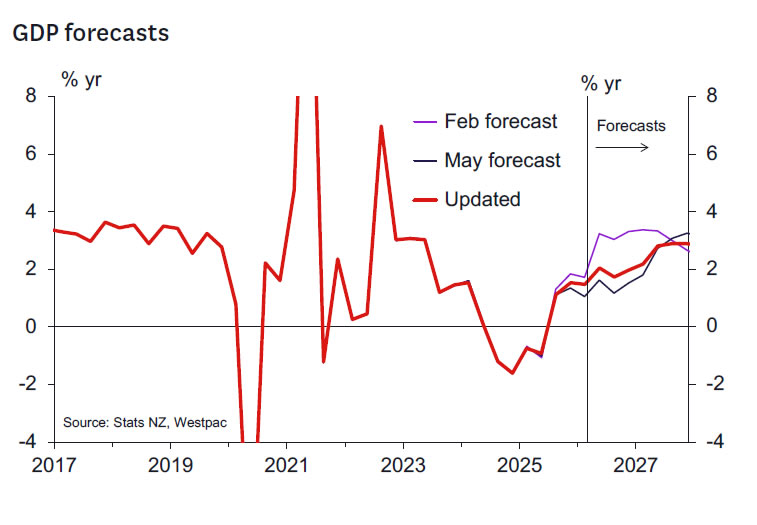
- Recent developments mean that the RBNZ's outlook for the OCR has likely moved back towards that forecast in the February MPS.
- We are similarly updating our forecasts to reflect the unexpectedly quick resolution of the Iran conflict and associated significant decline in the price of oil and refined fuels prices and related commodities.
- We now see headline inflation peaking at 4.0% in the June quarter this year and ending 2026 at 3.5% - possibly lower if the most recent fall in oil prices is sustained.
- We have marked up our 2026 GDP growth forecast to 2.0% from 1.5% previously, although this remains lower than our pre-war forecast.
- We affirm our view that the OCR will be held at 2.25% at the upcoming 8 July meeting. Indeed, we expect this decision to be far less contentious than in May, and don't rule out that this decision is made by consensus and so without a vote.
- We also affirm our view that the RBNZ will begin to tighten at the September MPS. However, beyond September, we now expect just one further tightening this year - rather than two - which will probably occur at the December MPS meeting.
- Relative to pre-conflict forecasts made by both Westpac and the RBNZ, this implies one extra OCR increase in 2026. This is justified by the more elevated path for inflation relative to that expected in early 2026.
- We have reduced the forecast peak in the OCR to 4% and thus retain the same pattern of OCR changes through 2027. A lower peak OCR is consistent with the smaller and shorter duration oil related supply shock now assumed.
- There are two-sided risks around this profile that depend on how quickly the economy recovers through the second half of 2026 and the pace at which underlying inflation pressures recede.
- Downside risks persist for the New Zealand dollar as interest rate differentials are likely to weigh on the exchange rate given much higher US and Australian policy rates. We will review our FX forecasts next month in the July Market Outlook produced jointly with our Australian colleagues.
A Revised Economic Outlook Is Warranted
A great deal has changed since early May when we last reviewed our forecasts for the global and domestic economies - more than the market appears to have appreciated considering the continued pricing of a RBNZ rate hike at next month's policy review. The key issue has been the unexpectedly quick progress on reducing Persian Gulf tensions and the potential for a faster return of shipping flows in the Strait of Hormuz, with resultant improvements in trade flows of oil, petrochemical products and natural gas, as well as a range of other key products (such as fertiliser).
While it is premature to conclude that tensions in the region will be durably settled, there are sufficient signs that diplomatic efforts are well underway such that a decent period of ceasefire and more normal shipping flows is in prospect. Hence, it's appropriate to incorporate this new information into our New Zealand macroeconomic view.
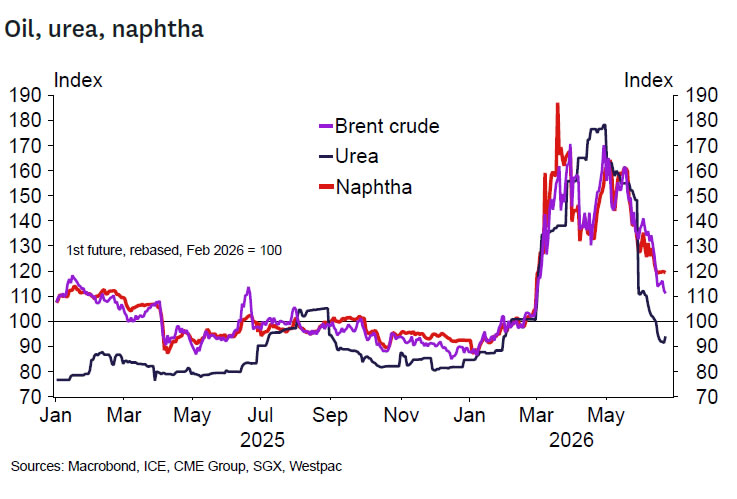
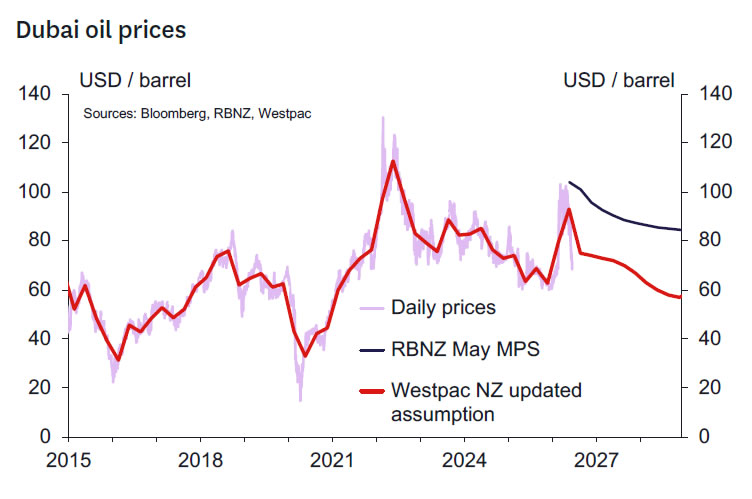
The key updates to our assumptions relate to the assumed level and future path for oil and refined fuels prices. These have converged much more rapidly than expected to levels we previously didn't expect to see until mid-2027. Brent crude oil is currently trading around US $73/bbl, close to the levels we saw prior to the war. We expect that prices will ease further over 2027 to $69/bbl. Refined fuels prices have been easing more gradually, but have still fallen substantially from a peak of US $195 bbl in March to US $110 bbl at the time of writing (vs around US $92/bbl prior to the war). Refined fuel prices are expected to continue easing back over the coming months, falling to US $102 bbl by the end of this year and US $90 bbl by the end of 2027.
Importantly, oil prices are now much lower than the RBNZ assumed in the May forecasts.
We have also accounted for recent economic data on GDP, selected price indices, and other higher frequency data on output when reviewing our economic view. We have not reviewed our global economic forecasts, or the exchange rate forecasts (aside from updating the starting point for the exchange rate) as these will next be reviewed, in conjunction with our Australian colleagues when we prepare our July Market Outlook publication forecasts.
We also have not included the implications of the new fiscal position revealed in Budget 26. Having said that we think the implications are likely modest and will be fully incorporated into our forecasts when we prepare our next Economic Overview in late August.
GDP Growth - Recovery to Resume Sooner
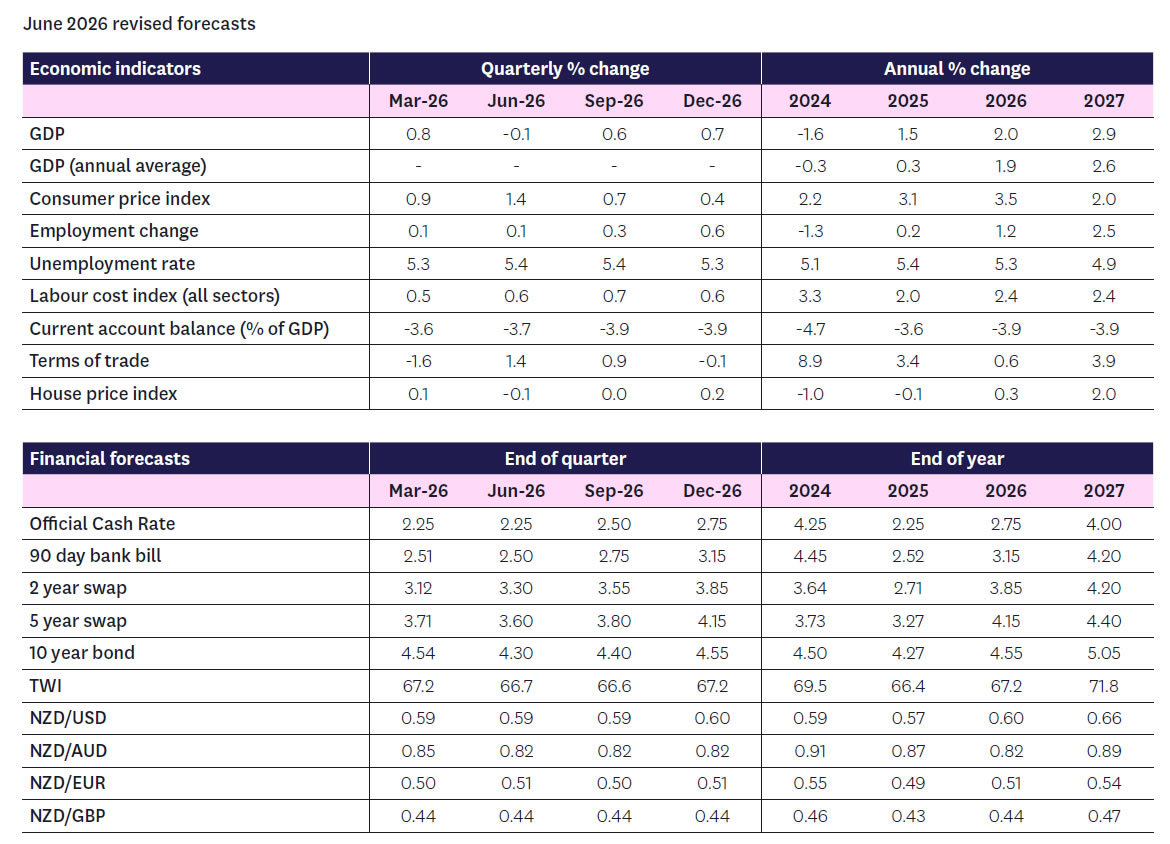
We have upgraded our GDP forecasts for both the June quarter - the peak of the oil shock impact - and over the second half of this year. Much of this reflects a bringing-forward of the timing of the economy's recovery as the oil shock fades, so we now expect a slightly slower rate of growth through 2027. GDP growth for 2026 is now forecast to be 2% and 2.9% in 2027.
A review of the most recent data suggests that the economy held its ground through the peak of the oil price shock in April and May, faring a bit better than we had assumed in our last forecast update. We now expect GDP to fall by just 0.1% for the June quarter, from our previous forecast of -0.3%.
We should note that both forecasts include an allowance for the seasonal distortions that remain an issue in the GDP data. Our new forecast implies an underlying growth pace of around +0.2%, with seasonal factors knocking 0.3% off the reported result.
With oil prices receding faster than we'd assumed, the economy is set to resume its pre-conflict recovery path sooner as well. We expect quarterly growth to pick up to 0.6% and 0.7% in the September and December quarters, from 0.4% and 0.6% previously. Altogether that would see the economy grow by 2.0% over the course of this year, compared to our previous forecast of 1.5%. That's still some way below the 3.3% growth that we were expecting this year prior to the Iran conflict, which will still prove to be a significant setback to the momentum that was otherwise building in the economy.
Labour Market - Hiring to Resume
With a stronger GDP outlook for this year, we now expect a lower peak and a quicker turnaround in the unemployment rate over the next year. We still expect some softness in the jobs market in the near term - the uncertainty generated by the Iran conflict has likely led some businesses to hold off on hiring decisions. The high-frequency jobs data so far suggests that we're on track for flat rather than falling employment over the June quarter. But that won't be enough to absorb the growth in the working-age population, so we expect to see the unemployment rate tick up again to 5.4% after having eased to 5.3% in the March quarter.
Beyond that though, we see less risk of a further rise in unemployment over the coming quarters. Our forecast now peaks at 5.4% through the middle part of this year, easing to 5.3% by year-end and 4.9% by the end of 2027 (the latter forecast is unchanged).
Housing - Still Moving Sideways
We have revised up modestly our forecasts for house price growth in 2026. Recent house price data confirms a flat profile for house prices in recent months and a similarly flat path for the days to sell a property. Looking forward, we anticipate a mildly more positive tone to return to the market as consumer and business sentiment improves with falling energy prices. Previously we had thought we might see a relatively weak outcome for September quarter house prices, but now it seems more like a flat outcome is closer to the mark. Weaker expectations for RBNZ OCR hikes have translated through to lower mortgage rates in recent weeks which should also assist sentiment.
We now expect very modest house price growth of 0.6% in 2026 (previously we expected a modest 1% fall). We still expect prices to rise by 2% over 2027. We continue to expect house prices in the regions to outperform those in the major North Island urban centres as it will take some time for the services sector to pick up and the labour market to strengthen to the point where we see a decent fall in the unemployment rate (now forecast to begin late in 2026 and picking up pace through 2027).
Inflation - Lower Peak, Quicker Reduction
In response to the faster than expected fall in oil prices, we have pulled down our inflation forecasts. We now expect that annual inflation will peak at 4.0% in the June quarter (down from the peak of 4.5% we assumed in our May forecasts), slowing to 3.5% in the December quarter - possibly lower if oil prices remain as low as they are today. That would be well below the 4.1% rate the RBNZ assumed for year-end inflation in its recent May MPS projections.
The earlier than expected fall in global oil prices has already flowed through to lower prices at the pump for New Zealand consumers. The average price of 91 unleaded around the country has fallen to $3.02/ltr (down nearly $0.50/ltr from its peak in May), while diesel has fallen to $2.56 (down more than $1/ltr). Further price falls are likely given current spot energy prices. Those lower oil prices have directly shaved about 0.5ppts off our year-end inflation forecasts.
We have also dialled back assumed second round inflation effects reflecting the smaller and shorter duration cost shock. That's taken about 0.2ppts off our inflation forecasts. We retain around 50% of the second-round effects included in previous CPI forecasts as although oil prices have fallen substantially, they are still well above the levels we saw prior to the conflict. We will review these estimates as we receive more definitive CPI data in coming quarters.
More generally, we think that subdued demand has constrained how far many businesses have been able to raise their prices despite increases in operating costs.
Looking to 2027, inflation is expected to drop back as the impact of the oil price shock dissipates. Indeed, given base effects associated with this year's oil shock, headline inflation will briefly dip below 2% in 2027, before rising as the economy recovers.
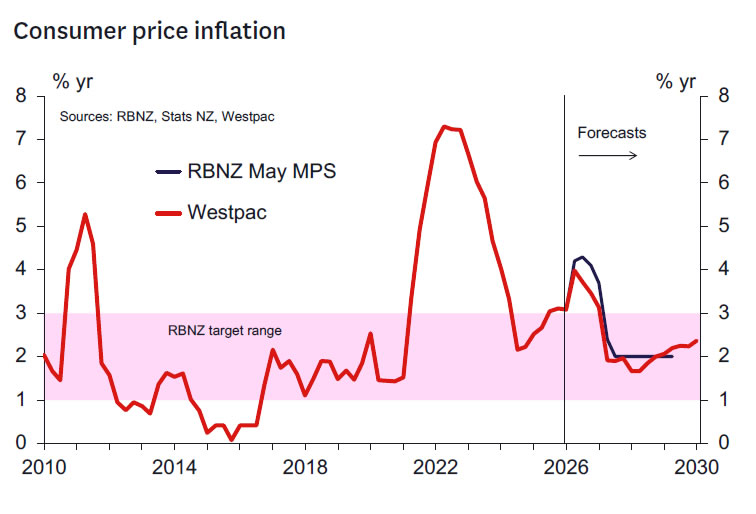
Smoothing through the volatility associated with fuel prices, core inflation has lingered at firm levels over the past few years despite the softness in economic activity. The average of the RBNZ's suite of core inflation measures sat at 2.3% in the March quarter. Inflation excluding food and fuel prices, is currently around 3% and it is expected to linger close to the top of the RBNZ target band for the remainder of this year, before easing over 2027.
Monetary Policy - Less Urgency Required
Our forecasts imply the RBNZ's outlook for the OCR will likely move back towards the economic outlook envisioned back at the February MPS (when the Bank expected at most one 25bp hike this year). This would imply much less urgency to raise the OCR compared to the view in the May MPS (which had assumed two to three 25bps hikes this year).
The key question is: just how far will the RBNZ have moved? We think it reasonable that the RBNZ will likely have taken at least one 25bp hike out of its internal projections and will likely now be projecting one to two 25bp OCR hikes this year. Hence, we don't think the RBNZ will have reverted all the way back to its pre-Iran war views - in part because the inflation outlook remains significantly elevated for a while yet relative to what the RBNZ expected back in February. But nevertheless, the significant shift in circumstances since May should imply a significant shift in the forward stance.
So, what does this imply for the upcoming 8 July meeting? We think that the sharp fall in energy prices and the resulting improvement in the inflation outlook will have undermined the case for pre-emptive action. The hawks on the MPC may well still see a strong case for OCR increases this year but will likely be significantly comforted by the big change in the immediate inflation outlook as it must imply lower risks of persistently high inflation. At the least, the argument for moving earlier will look a lot weaker than back in May when those views were ultimately outweighed by the dovish camp. There's a significant chance that the hawkish bloc opts for no change in the OCR in July while remaining open for OCR hikes later in 2026.
The more dovish MPC members that wanted to see more evidence of enduring second-round inflation impacts in May will likely have hardened their views. Indeed, with the key June CPI, labour market and QSBO reports all due between the RBNZ's July and September meetings, together with the next round of inflation expectations surveys, there seems little to be lost in waiting to see what these key reports reveal (and to see whether the current US-Iran negotiations progress to a durable final deal). We don't think we have learned much about the extent of second-round inflation impacts since May aside from the fact that the short-term inflation outlook now looks far less threatening than then. And of course, there is more tangible evidence the economy stalled in the June quarter (the RBNZ's June quarter Nowcast indicates flat Q2 growth). Looking ahead, as discussed previously, there are likely good reasons to expect a stronger H2 2026 growth performance than felt back in May, but this is likely to still need to be confirmed by data and still likely to be far weaker than hoped for in early 2026 when even then just one OCR hike for 2026 was said to be on the cards. We don't think that any of the doves are likely to want to shift camp to the hawk's side in the July meeting.
A key argument market participants seem to rely on is the sense that the RBNZ may have almost promised a July hike back in May. We don't think this is accurate as the MPC will always fiercely note that any forward guidance on the OCR will be data dependent. We understand that mathematically, the RBNZ May forecast for an average OCR for the September 2026 quarter at 2.51% seems consistent with a July hike. But this will not have been a non-data dependent promise. In most cases, the RBNZ's short term OCR forecasts provide broad guidance on the likely direction of the OCR rather than a definitive forecast and have historically proven to be a poor guide to the next policy decision. More importantly, the Governor's words when describing the outlook are likely to be more prescient. The Governor noted that an increase in the OCR seemed likely "in coming meetings" - this is not a promise of an OCR increase in July. This is rather an expression of the intention to lift the OCR later in the year - and even that intention will (and should!) be data dependent.
Therefore, we affirm our view that the RBNZ will hold the OCR at 2.25% at the 8 July meeting. In fact, we expect this to be far less contentious than the May decision, and do not rule out the possibility that this decision is reached by consensus and so without a vote.
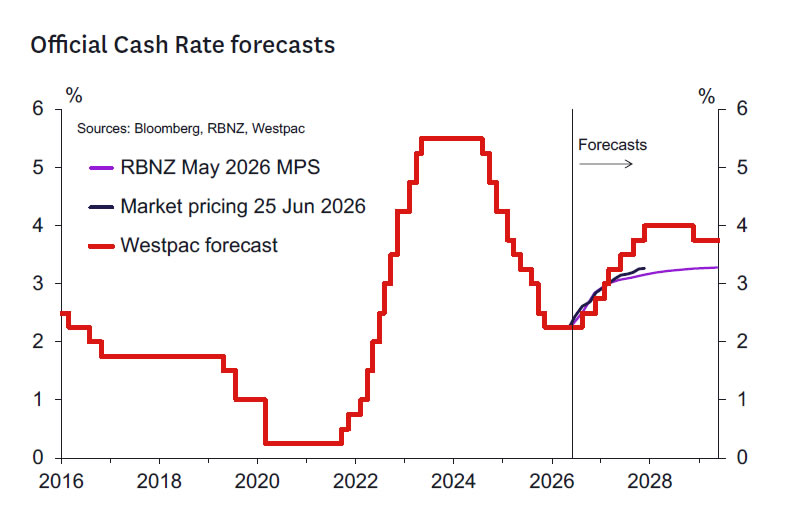
Looking beyond July, it remains reasonable to expect the RBNZ to tentatively begin lifting the OCR at the September MPS meeting and move again once more towards neutral settings before the end of the year - most probably at the December MPS meeting. But even these forecasts are not a slam dunk and have two-sided risks. Should the June quarter CPI provide benign in terms of core inflation measures then the RBNZ could leave the OCR unchanged until December. If the CPI runs hot, then we could still see the three 25bp rate hikes that we forecast before today.
Our central view implies one fewer hike this year than we had forecast most recently but one more than we had forecast prior to the conflict. This is justified by the more elevated path for inflation relative to that expected in early 2026. We have retained the same OCR changes that we had previously forecast to occur in 2027 and so the OCR is now forecast to peak 25bps lower at 4.0%. A lower peak OCR is consistent with the smaller and shorter duration oil-related supply shock now assumed. Our view on the neutral OCR remains at 3.75%.
In this update we have made no change to our FX forecasts. Downside risks persist for the New Zealand dollar as interest rate differentials are likely to weigh on the exchange rate given much higher US and Australian policy rates. We will review our FX forecasts next month in the July Market Outlook produced jointly with our Australian colleagues.
GBP/USD Back on the Defensive as US GDP Looms Large
Key Highlights
- GBP/USD extended losses and traded below 1.3200.
- The bears might remain active near 1.3200 and 1.3250 on the 4-hour chart.
- Gold prices declined sharply to a new multi-week low below $4,000.
- The US GDP could grow by 1.6% in Q1 2026.
GBP/USD Technical Analysis
The British Pound faced rejection near 1.3275 against the US Dollar. GBP/USD reacted to the downside and traded below 1.3200.
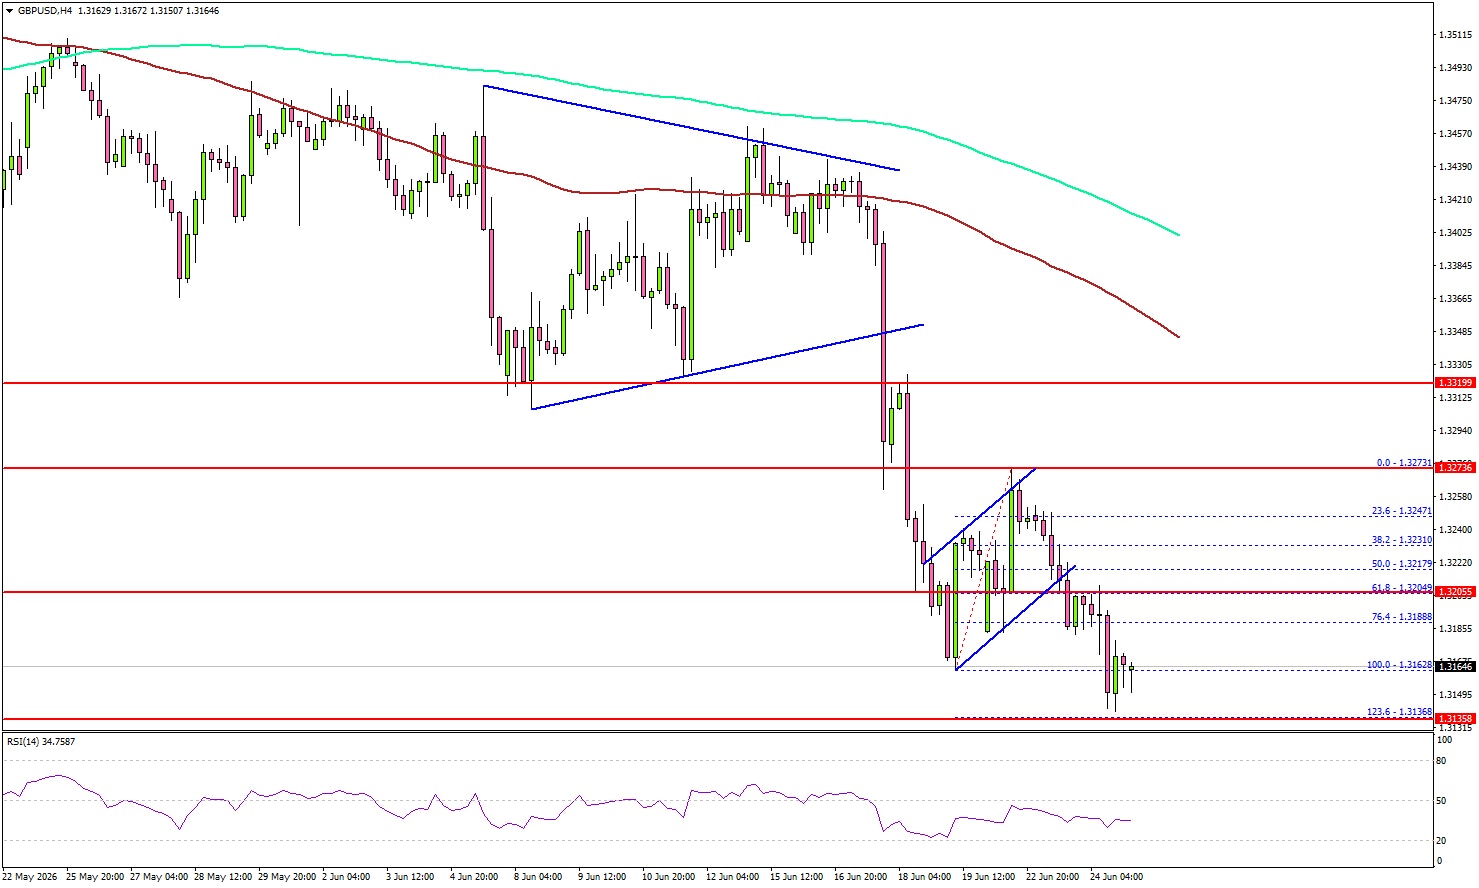
Looking at the 4-hour chart, the pair settled below 1.3200, the 100 simple moving average (red, 4-hour), and the 200 simple moving average (green, 4-hour). The bears even pushed the pair to a new multi-week low below 1.3150.
The greenback seems to be gaining strength ahead of the US GDP data. If the bears remain in action, the pair could dip further below 1.3120.
The first major support could be near 1.3050. The main support might be 1.3000. A downside break and close below 1.3000 might spark bearish moves. In the mentioned case, the bears could aim for a test of 1.2880.
If there is a recovery wave, GBP/USD could face resistance at 1.3200. The next major resistance might be 1.3250. A close above 1.3250 could open the doors for a larger increase. In the stated case, the bulls could aim for a move to 1.3350.
Looking at Gold, the bears remained in action, pushed the price below $4,000, and might continue to pressure the market in the near term.
Upcoming Key Economic Events:
- US Gross Domestic Product for Q1 2026 – Forecast 1.6% versus previous 1.6%.
- US Personal Income for May 2026 (MoM) - Forecast +0.4%, versus 0% previous.
- US Initial Jobless Claims - Forecast 225K, versus 226K previous.
- US Durable Goods Orders for May 2026 – Forecast -4.3% versus +8.0% previous.
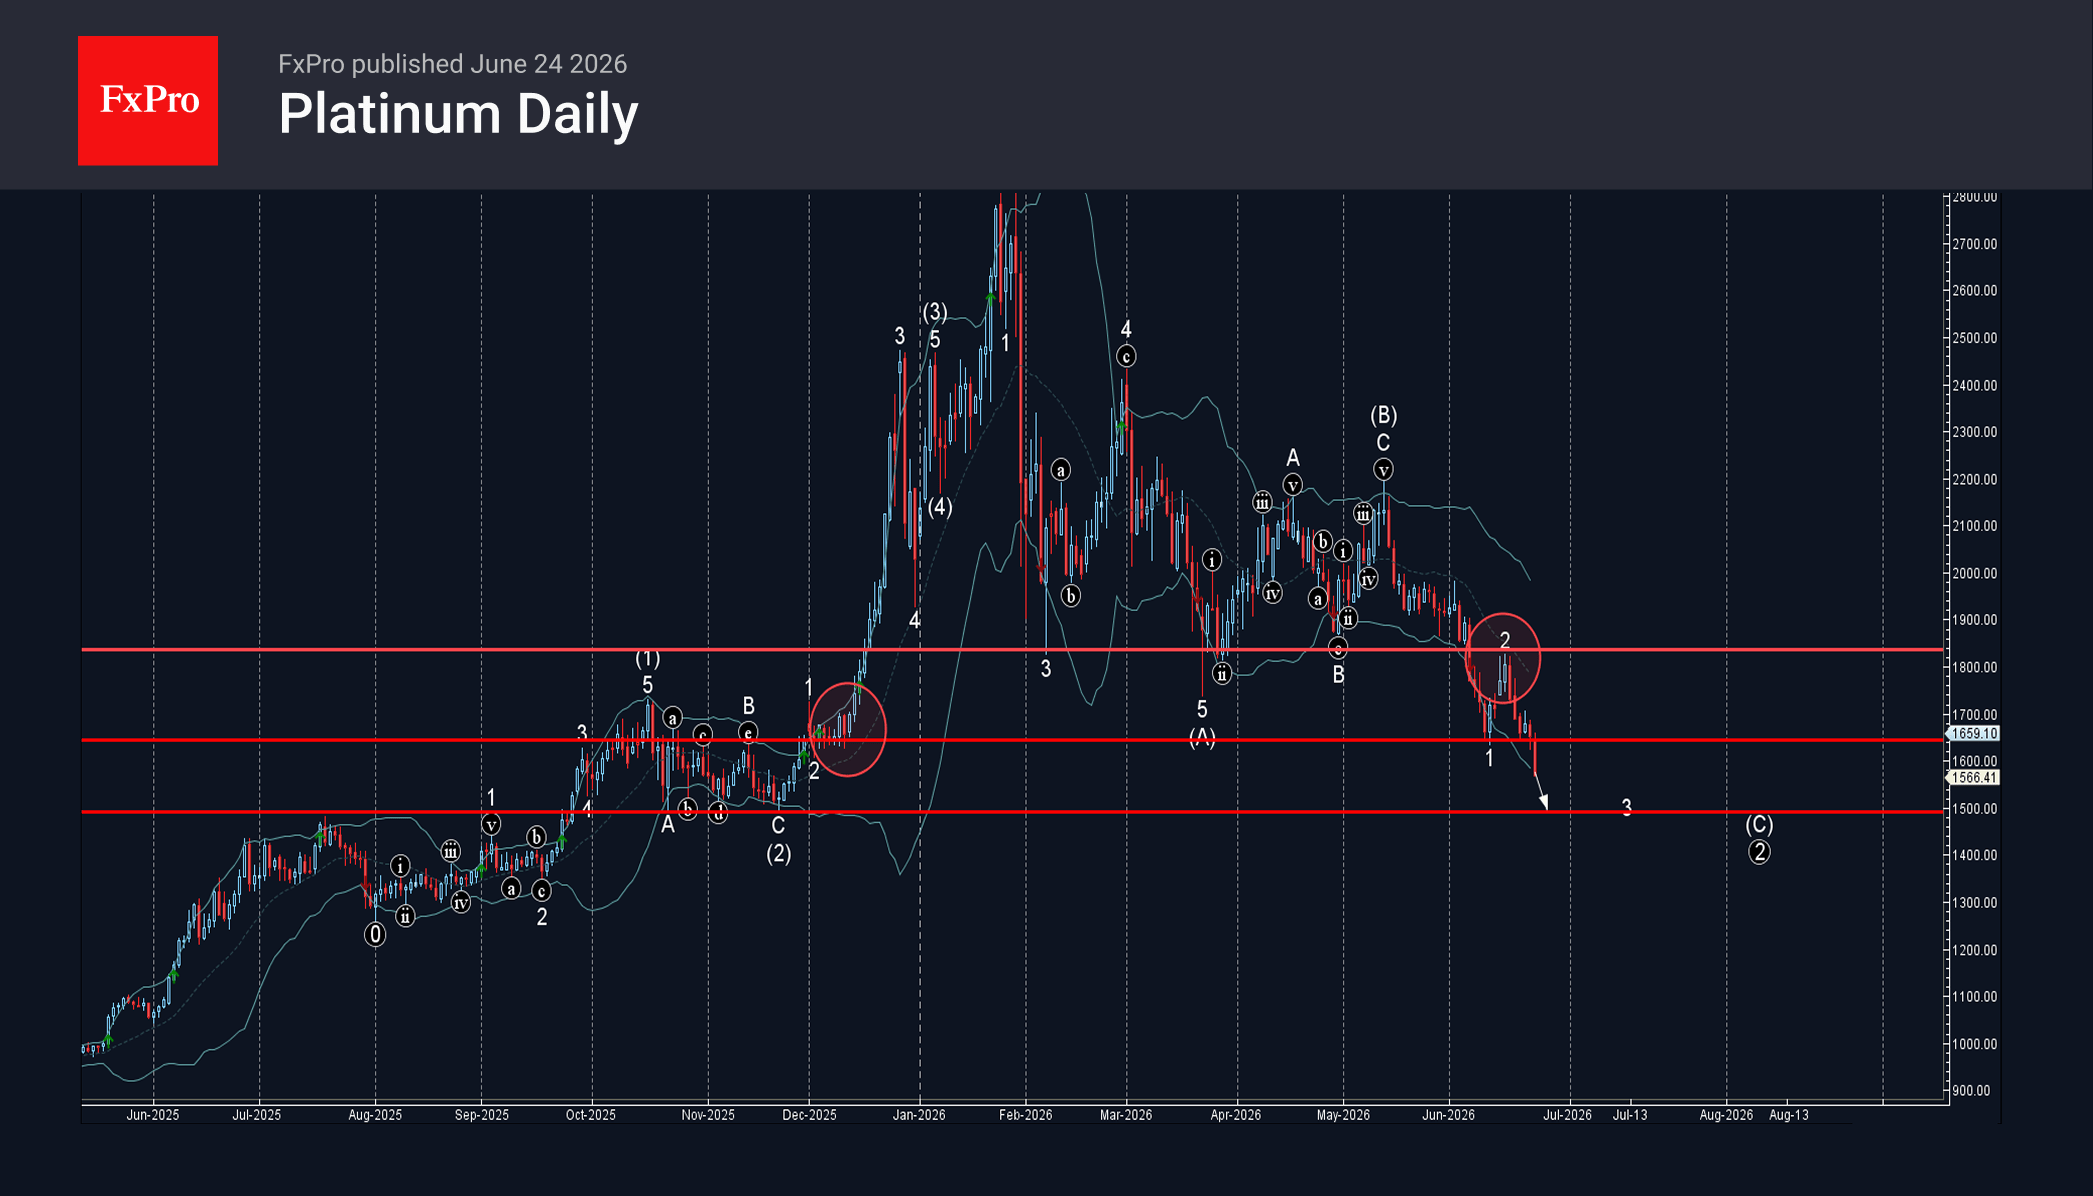
Platinum Wave Analysis
Platinum: ⬇️ Sell
– Platinum broke support level 1645.00
– Likely to fall to support level 1500.00
Platinum under the bearish pressure after the earlier breakout of the support level 1645.00, which has been reversing the price from December.
The breakout of the support level 1645.00 continues the active minor impulse wave 3 of the higher impulse wave (C) from May.
Given the strong daily downtrend, Platinum can be expected to fall to the next major support level 1500.00 (target for the completion of wave 3), which has been revering the price from October.
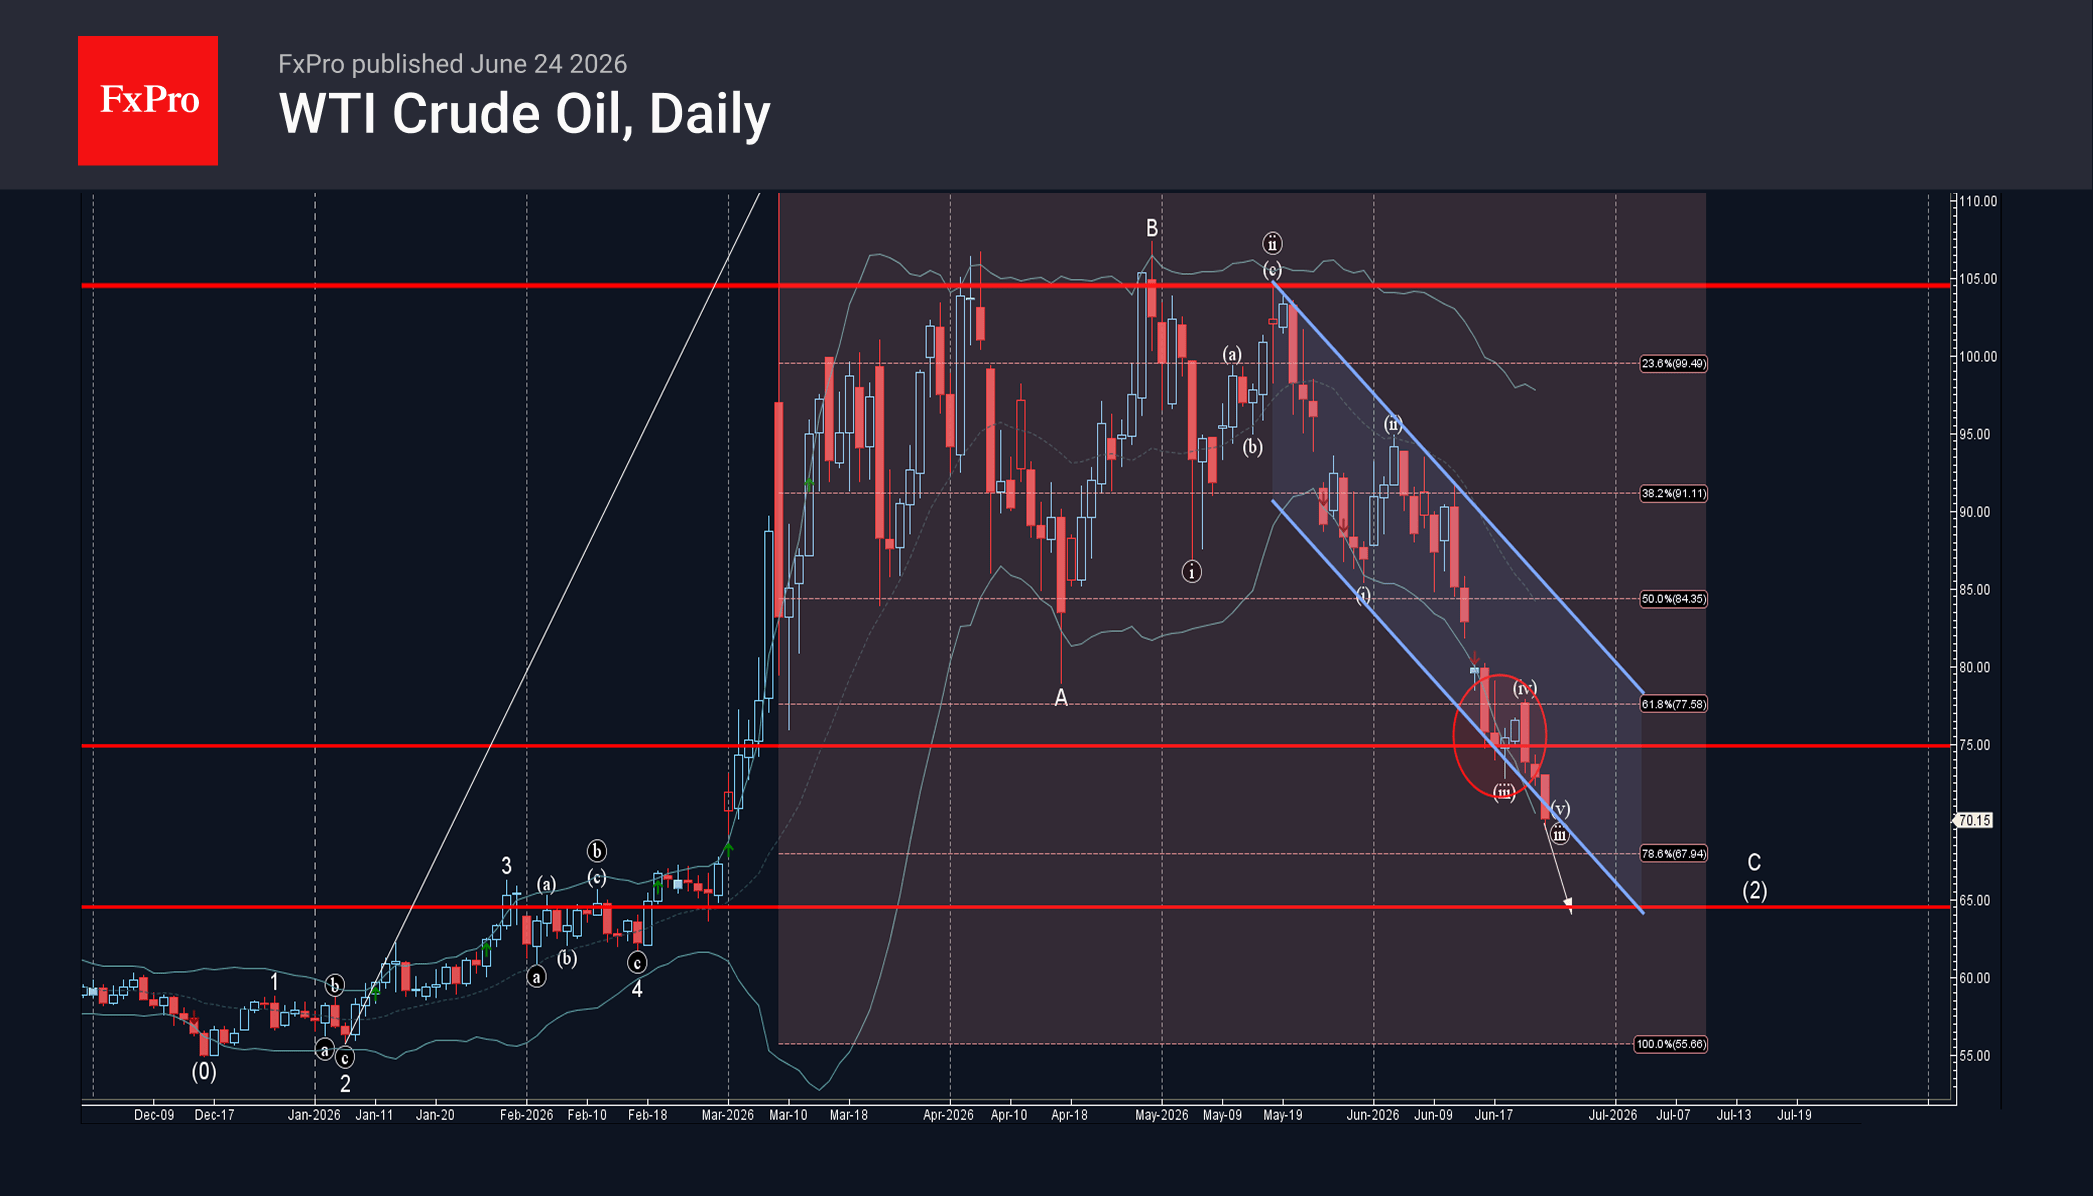
WTI Crude Oil Wave Analysis
WTI Crude Oil: ⬇️ Sell
– WTI Crude Oil broke support level 75.00
– Likely to fall to support level 65.00
WTI Crude Oil recently broke the support zone between the support level 75.00, support trendline of the daily down channel from May and the 61.8% Fibonacci correction of the upward impulse from January.
The breakup of this support zone accelerated the active impulse wave C of the intermediate ABC correction (2) from March.
WTI Crude Oil can be expected to fall further to the next support level 65.00 (target for the completion of the active impulse wave C).
Eco Data 6/25/26
| GMT | Ccy | Events | Act | Cons | Prev | Rev |
|---|---|---|---|---|---|---|
| 01:30 | AUD | Employment Change May | 40.3K | 30.5K | -18.6K | -40.7K |
| 01:30 | AUD | Unemployment Rate May | 4.40% | 4.40% | 4.50% | |
| 06:00 | EUR | Germany GfK Consumer Confidence Jul | -29.2 | -28 | -29.8 | -29.7 |
| 12:30 | USD | Initial Jobless Claims (Jun 19) | 215K | 225K | 226K | 227K |
| 12:30 | USD | Personal Income M/M May | 0.70% | 0.40% | 0.00% | |
| 12:30 | USD | Personal Spending May | 0.70% | 0.60% | 0.50% | 0.40% |
| 12:30 | USD | PCE Price Index M/M May | 0.40% | 0.50% | 0.40% | |
| 12:30 | USD | PCE Price Index Y/Y May | 4.10% | 4.10% | 3.80% | |
| 12:30 | USD | Core PCE Price Index M/M May | 0.30% | 0.30% | 0.20% | |
| 12:30 | USD | Core PCE Price Index Y/Y May | 3.40% | 3.40% | 3.30% | |
| 12:30 | USD | Durable Goods Orders May | -4.50% | -4.70% | 8.00% | 8.50% |
| 12:30 | USD | Durable Goods Orders ex Transport May | 1.30% | 0.50% | 1.10% | 1.40% |
| 12:30 | USD | GDP Annualized Q1 F | 2.10% | 1.60% | 1.60% | |
| 12:30 | USD | GDP Price Index Q1 F | 3.60% | 3.50% | 3.50% | |
| 14:30 | USD | Natural Gas Storage (Jun 19) | 76B | 67B | 73B |
| 01:30 | AUD |
| Employment Change May | |
| Actual | 40.3K |
| Consensus | 30.5K |
| Previous | -18.6K |
| Revised | -40.7K |
| 01:30 | AUD |
| Unemployment Rate May | |
| Actual | 4.40% |
| Consensus | 4.40% |
| Previous | 4.50% |
| 06:00 | EUR |
| Germany GfK Consumer Confidence Jul | |
| Actual | -29.2 |
| Consensus | -28 |
| Previous | -29.8 |
| Revised | -29.7 |
| 12:30 | USD |
| Initial Jobless Claims (Jun 19) | |
| Actual | 215K |
| Consensus | 225K |
| Previous | 226K |
| Revised | 227K |
| 12:30 | USD |
| Personal Income M/M May | |
| Actual | 0.70% |
| Consensus | 0.40% |
| Previous | 0.00% |
| 12:30 | USD |
| Personal Spending May | |
| Actual | 0.70% |
| Consensus | 0.60% |
| Previous | 0.50% |
| Revised | 0.40% |
| 12:30 | USD |
| PCE Price Index M/M May | |
| Actual | 0.40% |
| Consensus | 0.50% |
| Previous | 0.40% |
| 12:30 | USD |
| PCE Price Index Y/Y May | |
| Actual | 4.10% |
| Consensus | 4.10% |
| Previous | 3.80% |
| 12:30 | USD |
| Core PCE Price Index M/M May | |
| Actual | 0.30% |
| Consensus | 0.30% |
| Previous | 0.20% |
| 12:30 | USD |
| Core PCE Price Index Y/Y May | |
| Actual | 3.40% |
| Consensus | 3.40% |
| Previous | 3.30% |
| 12:30 | USD |
| Durable Goods Orders May | |
| Actual | -4.50% |
| Consensus | -4.70% |
| Previous | 8.00% |
| Revised | 8.50% |
| 12:30 | USD |
| Durable Goods Orders ex Transport May | |
| Actual | 1.30% |
| Consensus | 0.50% |
| Previous | 1.10% |
| Revised | 1.40% |
| 12:30 | USD |
| GDP Annualized Q1 F | |
| Actual | 2.10% |
| Consensus | 1.60% |
| Previous | 1.60% |
| 12:30 | USD |
| GDP Price Index Q1 F | |
| Actual | 3.60% |
| Consensus | 3.50% |
| Previous | 3.50% |
| 14:30 | USD |
| Natural Gas Storage (Jun 19) | |
| Actual | 76B |
| Consensus | 67B |
| Previous | 73B |
Bitcoin at the 200-Week Ma Hints at a Long Winter
Market Overview
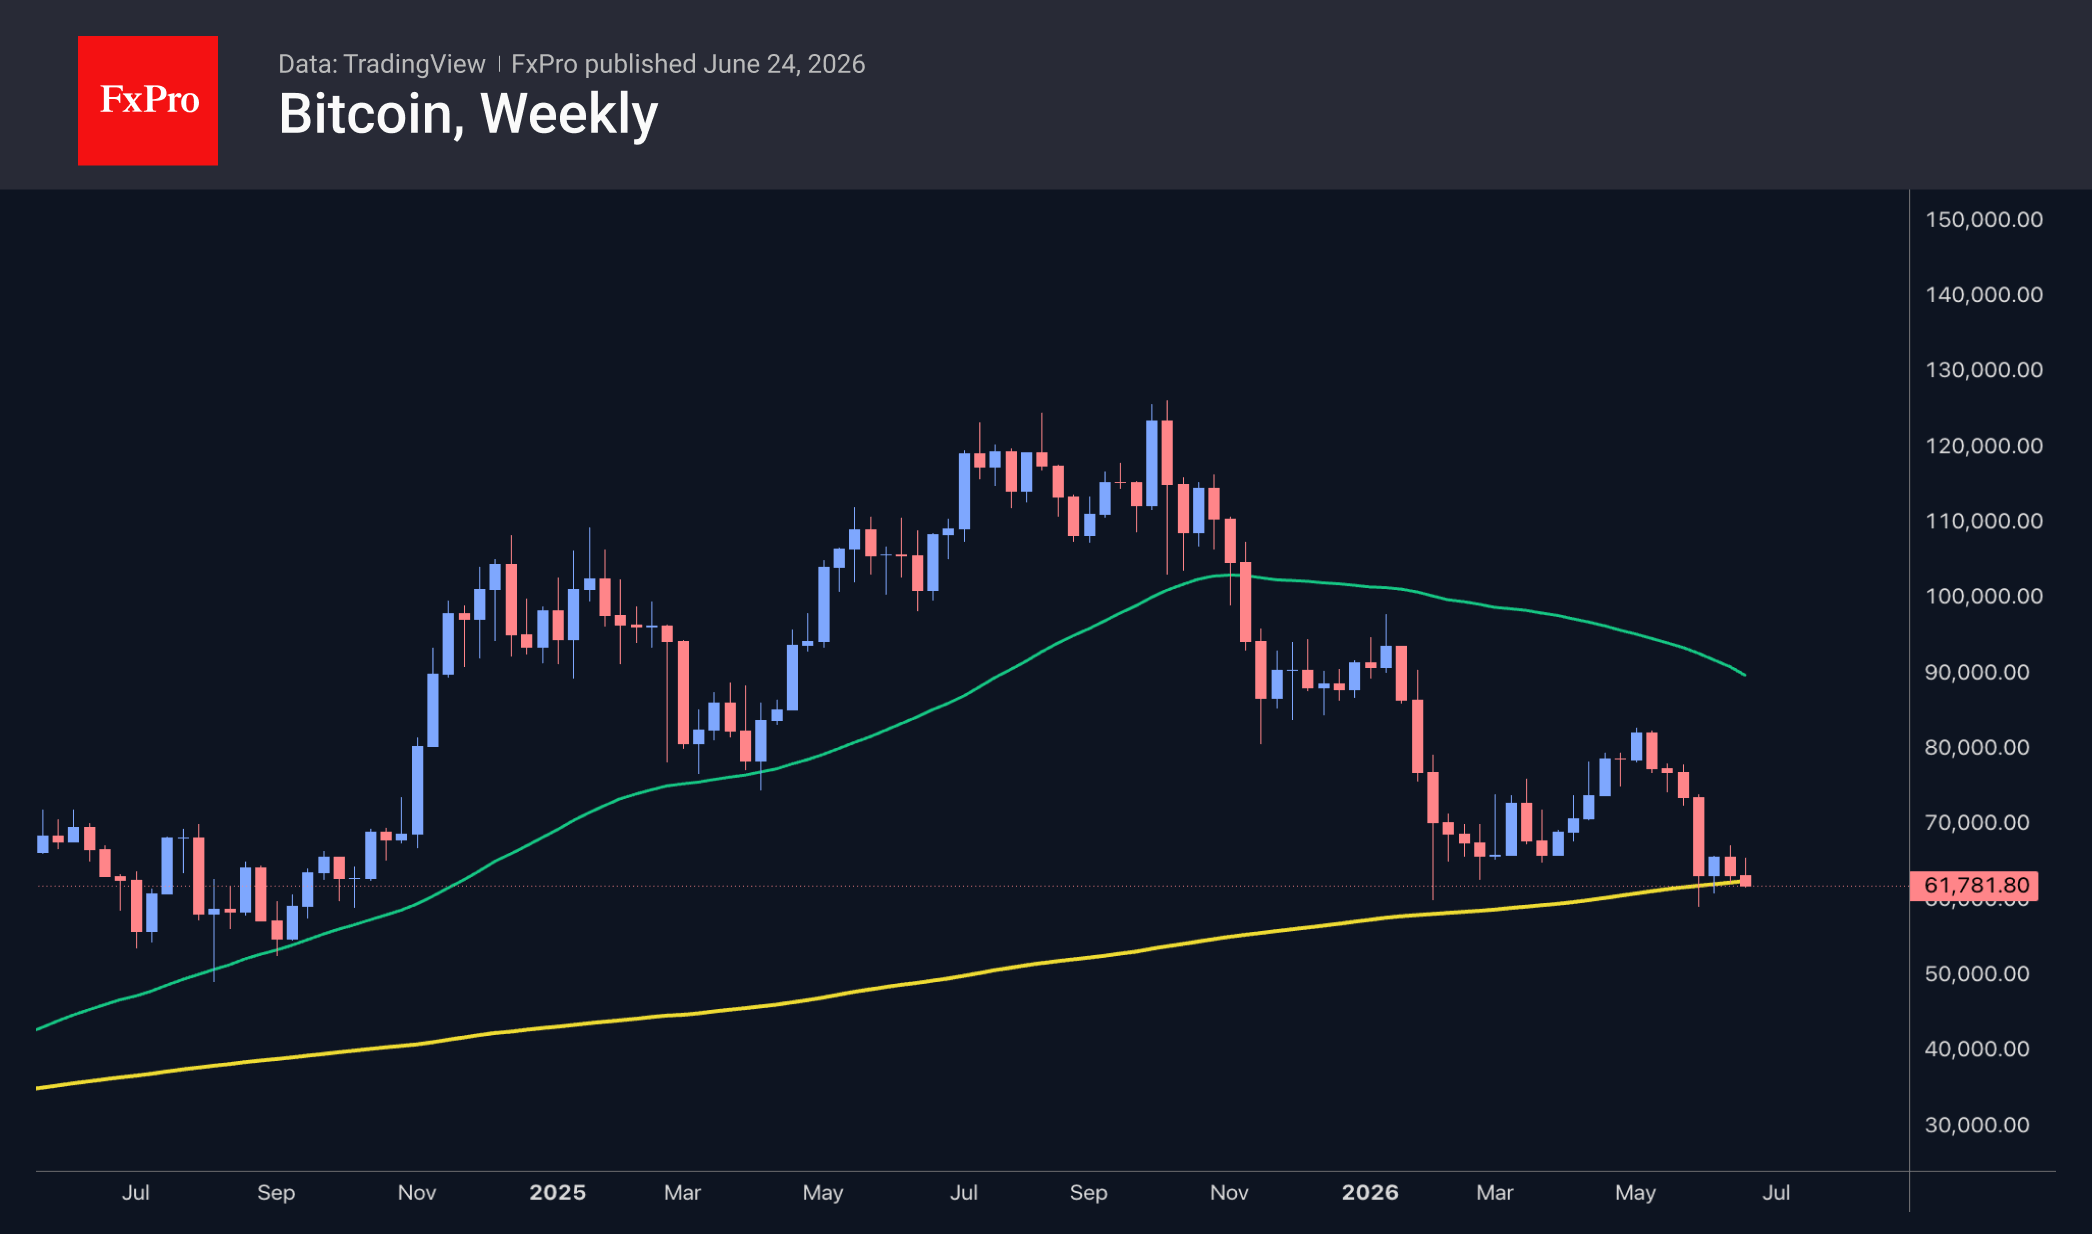
The crypto market capitalisation has stabilised at a low of $2.14T, having lost its recovery momentum in the second half of June after touching the 61.8% line. Consequently, there is a risk of a bearish expansion pattern forming, with the potential for a decline to a market capitalisation of $1.6T, a quarter below the current level. A break below the early-June lows would confirm this scenario, although increased buyer activity is evident near current levels. In any case, the stock market and the US dollar remain the key drivers, while cryptocurrencies are reacting to changes in the fundamental backdrop.
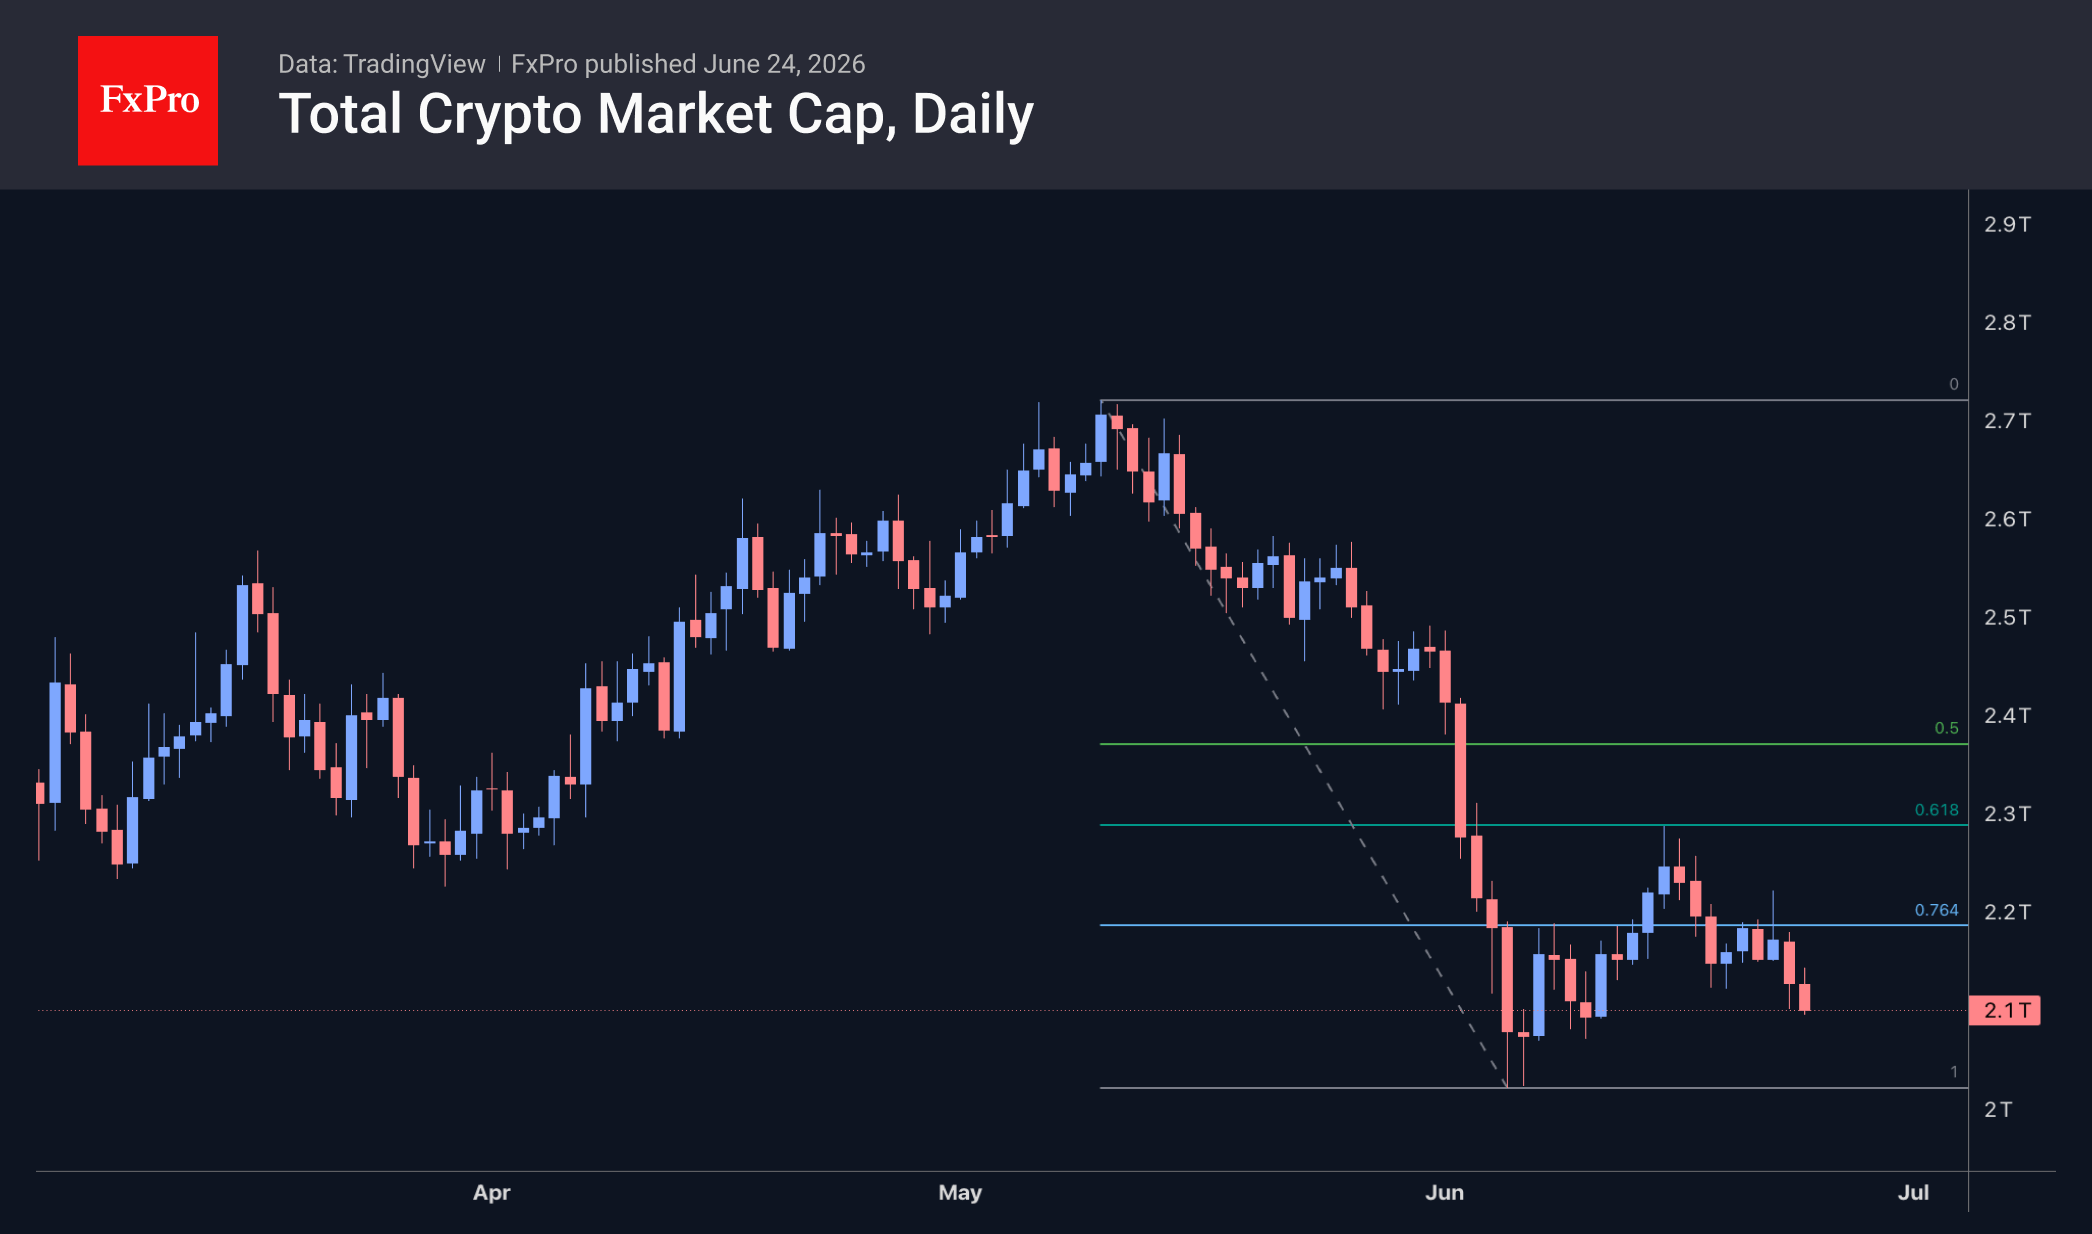
Bitcoin is trading below $63K, once again hovering near its seven-day lows. At these levels, the leading cryptocurrency remains close to its 200-week moving average. A dip towards this line in 2022 marked the start of nearly six quarters of poor performance, with prices hovering near this curve; in 2018, such a period lasted six months, and in 2015, nine. In other words, history suggests we should brace for a crypto winter rather than a rapid rebound.
News Background
Strategy purchased an additional 520 BTC last week for $34.9 million. The company now holds 847,363 BTC, acquired for $64.1 billion at an average price of $75.7K per Bitcoin.
Investment firm Strive acquired 759 Bitcoins last week for $50 million at an average price of $65.9K per coin. The total Bitcoin on Strive’s balance sheet now stands at 19,864 BTC. Since January, the company has increased its holdings by approximately 3,700 BTC.
BitMine has increased its Ethereum reserves to 5.67 million ETH, having purchased an additional 52,203 ETH over the past week. BitMine’s reserves now account for 4.7% of the total Ethereum supply.
BitMine Chairman Tom Lee remains optimistic about ETH despite incurring multi-billion-dollar losses on his positions. In his view, the crypto market is currently in the early stages of a ‘crypto spring’.
Mexican billionaire Ricardo Salinas Pliego has compared investing in Bitcoin to investing in property. He urged investors not to fixate on short-term price fluctuations but to view BTC as a means of preserving wealth for many decades.
The FxPro Analyst Team
Sunset Market Commentary
Markets
Brent oil slid to a new post-war low today. One barrel currently sells for $74.65, the first sub $75 print since the Middle East conflict erupted end-February. This compares to a $120 peak end-April and the $60-$70 range prior to the war. Prices have dropped dramatically in anticipation of flows restoring rapidly through the Strait of Hormuz. Official tankers vessel crossings have indeed picked up in recent days, following the interim peace deal between the US and Iran, but remain well below the levels seen before (15 vs roughly 60 on average). The US and Iran meanwhile are working their way towards a permanent deal (that amongst others deals with the nuclear issue). Negotiations are likely to be time-consuming and prone to setbacks but markets are willing to look through. Core bonds extended gains after the oil break lower with US Treasuries outperforming German bunds. US rates drop 3.2 to 6.2 bps in a flattening move. We note that for the 10-yr yield the inflation expectations component recently (June 22) turned below the real yield. Such a cross-over is rare (happened only a handful of times the last 15 years+) and gained further traction since the Fed policy meeting of last week. Warsh's pledge to deliver on price stability has compressed inflation expectations further. Real yields meanwhile have also climbed higher in what can be seen as a vote of confidence in the US economy. European (swap) yields drop 3.1-4.1 bps in similar flattening fashion. The 10-yr tenor is trading at the lowest level since mid-March. The US dollar confirms yesterday's technical push higher against the euro with EUR/USD sliding towards 1.133. This 13-month low offers negligible support (38.2% retracement on the 2025-2026 EUR/USD rally) before the 1.12 area and more important 1.11 zone pops up. DXY soars to 101.77 with targets from a technical point of view seen at 102.86 & 104.59. USD/JPY grinds higher, testing the patience of Japanese officials. Finance minister Katayama yesterday said he and his US counterpart Bessent agreed on taking "bold" steps if needed. Stock markets trade with caution. The EuroStoxx50 sheds 0.4% towards first support at 6200. Wall Street opens little changed. The Nasdaq rises 0.2% after yesterday's 2.5% beating. After-market results from chipmaker Micron will help shape sentiment tomorrow.
News & Views
The Czech composite economic sentiment indicator rose 1.6 pts in June as both of its components improved. Business confidence improved only slightly (+0.8 pts to 99.8). The gain in consumer confidence was more outspoken (+3.1 pts to 106.5), coming after two monthly declines. The share of consumers expecting a deterioration in the overall economic situation in the country decreased. More households expect an improvement in their financial situation. Concerns about rising prices & higher in unemployment stayed unchanged. Regarding business sentiment, confidence increased in industry, but decreased slightly in trade and in selected services and significantly in construction. Better confidence in June comes as the Czech National Bank (CNB) last week raised its policy rate by 25 bps to 3.75%. CNB assessed that especially core inflation remained too elevated on a range of domestic factors including accelerating credit growth, public expenditure, a tight labour market and rapidly rising wages and household spending. At 4.12% the Czech 2-y swap rate currently trades 3 bps higher compared to after the CNB decision. The krone is losing ground to EUR/CZK 24.24, partially driven by a stronger dollar.
The Swedish Riksbank today published the Minutes from its June 16 policy meeting when it kept the policy rate at 1.75%. The post-meeting statement indicated an increased probability of a hike later this year due to upside inflation risks for the supply shock of the war in the Middle East. The Minutes today showed divergence between the MPC members on the degree of the upside inflation risks. In its assessment on the upward risks to inflation, governor Thedéen in particular addressed the importance of the koruna exchange rate as a factor which in an unfavourable scenario could strengthen the inflationary impulse. Last year's strength of the koruna had continued to the Swedish context of low underlying inflation. However, the Swedish currency in the previous months declined from a cycle best near EUR/SEK 10.50 end January to currently trade near EUR/SEK 11.09. If this trend continues, the currency could gain weight as a factor in the Riksbank decision making process. For now governor Thedéen concludes that the Riksbank decision means that they are shifting the earlier course in a slightly tighter direction, but that the rudder angle remains small as it can increase or decrease depending on the risks.
AUDUSD Slides Further as Fed Rate Hike Hopes Continue to Boost Dollar
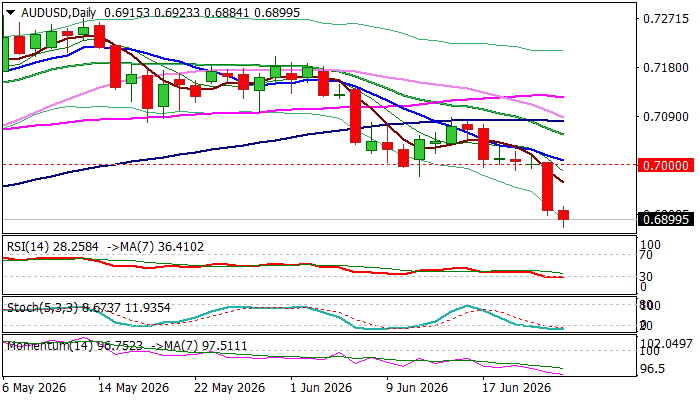
Steep bear-leg from 0.7000 zone extends into second consecutive day and hits the lowest levels since early April, as the Aussie dollar came under increased pressure from stronger dollar, driven by expectations that Fed may start tightening its monetary policy as early as September.
Fresh fall in metal prices also contributed to pair’s accelerating losses (AUDUSD was down 2.2% from Tuesday’s opening until early US session on Wednesday.
Bears eye targets at 0.6853 (200DMA) and 0.6833 (Mar 30 higher low), but may face headwinds, as daily studies are oversold.
Positioning for fresh push lower would be likely near-term scenario, with broken Fibo support at 0.6950 (38.2% of 0.6421/0.7277 rally) to cap upticks and keep larger bears intact.
Violation of 0.6833 pivot to generate initial signal of reversal and open way for deeper correction of larger 0.5914/0.7277 uptrend.
Res: 0.6950; 0.7000; 0.7056; 0.7075
Sup: 0.6853; 0.6833; 0.6800; 0.6756
Dollar Stays in Charge as Markets Await Micron and Test AI Bull Case
Dollar remained firmly in control of global markets today, extending its broad-based rally even as risk sentiment showed tentative signs of stabilization. US equity futures pointed to a modest rebound at the open following this week's sharp technology-led selloff, as investors appeared reluctant to make aggressive bets ahead of Micron's earnings report after the bell. The chipmaker has become one of the biggest beneficiaries of the AI investment boom, with its shares surging more than 260% this year as companies pour billions of dollars into AI infrastructure.
The cautious tone reflects a growing debate over whether the recent tech correction is merely a temporary bout of profit-taking or the start of a more significant reassessment of AI-related valuations. Some analysts argue that the long-term earnings story remains intact given the enormous scale of corporate spending on AI. Others point to emerging signs of fundamental pressure, including increasing price competition among AI model developers, falling rental prices for older-generation GPUs, and a broader industry shift toward lower-cost models. These developments do not necessarily undermine the long-term AI story, but they raise questions about whether the sector's most optimistic growth assumptions can continue to justify current valuations.
For now, markets appear unwilling to answer those questions ahead of fresh earnings guidance from one of the industry's key bellwethers. Even a strong Micron report may not guarantee a sustained recovery. It is not uncommon for markets to continue selling after positive earnings if investors are already focused on broader concerns about valuation, positioning, or the economic outlook. The violent selloffs seen across Asian technology stocks this week suggest sentiment remains fragile.
Another factor hanging over equities is the Federal Reserve. Markets appear to have largely absorbed the prospect of one additional rate hike this year following last week's FOMC meeting. The more difficult question is whether policymakers could ultimately deliver two. That risk has become increasingly important as inflation remains elevated and Fed officials continue emphasizing concerns about persistent services inflation. The uncertainty surrounding the policy outlook is making it harder for investors to justify paying premium valuations for growth stocks.
Meanwhile, Dollar continues to benefit from both safe-haven demand and expectations of tighter US monetary policy. The Dollar Index surged through the 38.2% retracement of the decline from 110.17 to 95.55 at 101.38 earlier this week, a development that strongly suggests the broader downtrend has already reversed. The breakout has shifted market focus from whether Dollar can rally further to how far the move can extend.
Two technical levels now stand out as particularly important confirmation signals. First, EUR/USD is approaching the 1.1300 area. A decisive break lower would reinforce the view that the pair is undergoing a medium-term bearish reversal after failing to sustain gains near the 1.2000 psychological level earlier this year. Second, Gold is threatening the key USD 4,000 psychological support zone. A decisive break there could trigger another wave of stop-loss selling and attract fresh momentum-driven shorts.
Taken together, these developments suggest that Dollar strength is becoming more deeply embedded across markets. Micron's earnings may determine whether technology stocks can stabilize in the near term. But the bigger story is whether Dollar's breakout can continue drawing confirmation from currencies, precious metals, and Fed expectations. So far, the answer appears to be yes. For the week, Dollar remains the strongest performer among major currencies, followed closely by Yen, while Kiwi and Aussie continue to sit at the bottom of the rankings.
RBNZ Hike Bets Collapse as NZD/USD Accelerates Toward Critical 0.5580 Support
Just weeks ago, markets were debating whether the RBNZ could raise rates as soon as July. Today, those bets have largely disappeared. Falling oil prices, weak domestic growth, and a stronger Dollar have combined to push NZD/USD toward a critical support zone that could determine the pair's direction for the rest of the year. Read More.
Dollar Index Breaks Key Fibonacci Barrier, Sets Stage for July's Bigger Battle
The Dollar's rally is not just a Fed story. A technology-led liquidation wave, quarter-end positioning, and growing expectations of further tightening are all pushing in the same direction. After breaking a key Fibonacci barrier, Dollar Index is heading toward what could be its most important test of 2026. Read More.
Germany's Ifo Business Climate Rises as Firms Hope for Geopolitical Relief
German companies are feeling better about the present, but they are not yet convinced about the future. June's Ifo survey showed improving business conditions and easing geopolitical concerns, yet weak orders and cautious expectations continue to hold back confidence. Read More.
Ueda Reinforces Hawkish BoJ Message, Says More Rate Hikes Likely
The key message from Kazuo Ueda was that policymakers still believe monetary conditions are accommodative even after last week's hike to 1%. That suggests the debate inside the BoJ is centered on the timing of future hikes rather than whether more tightening is needed. Read More.
BoJ Hawks Eye Path Toward 2% Neutral Rate, Summary Shows
The biggest surprise in the BoJ's June Summary of Opinions was not the support for last week's rate hike. It was the growing discussion about where rates should go next. Several policymakers argued that Japan's neutral rate may be closer to 2%, suggesting the debate has shifted from whether to tighten policy to how quickly to do it. Read More.
Australia CPI Misses Expectations at 4%, Yet Core Inflation Sends Hawkish Signal
Australia's inflation report delivered good news and bad news at the same time. Falling fuel prices pushed headline inflation lower than expected, but the RBA's preferred measure of underlying inflation accelerated. The result is a report that eases immediate inflation fears while keeping the August rate debate very much alive. Read More.
EUR/USD Daily Outlook
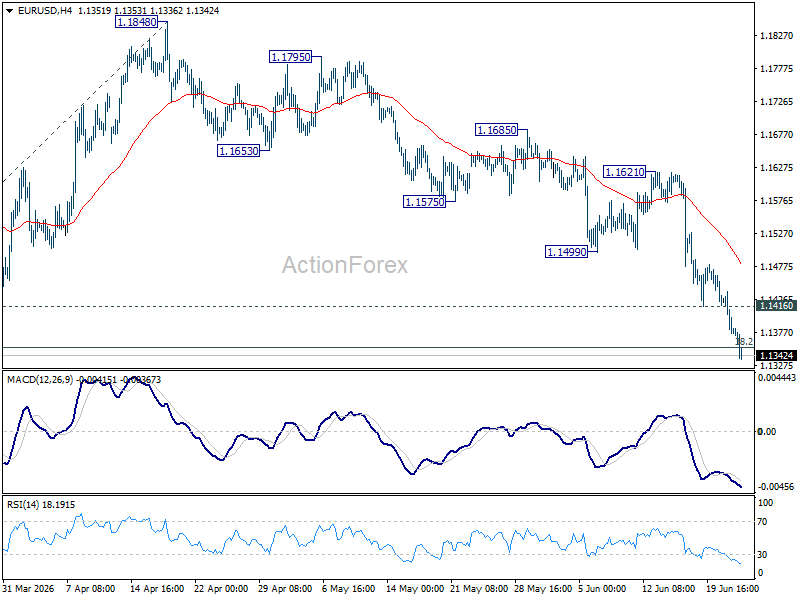
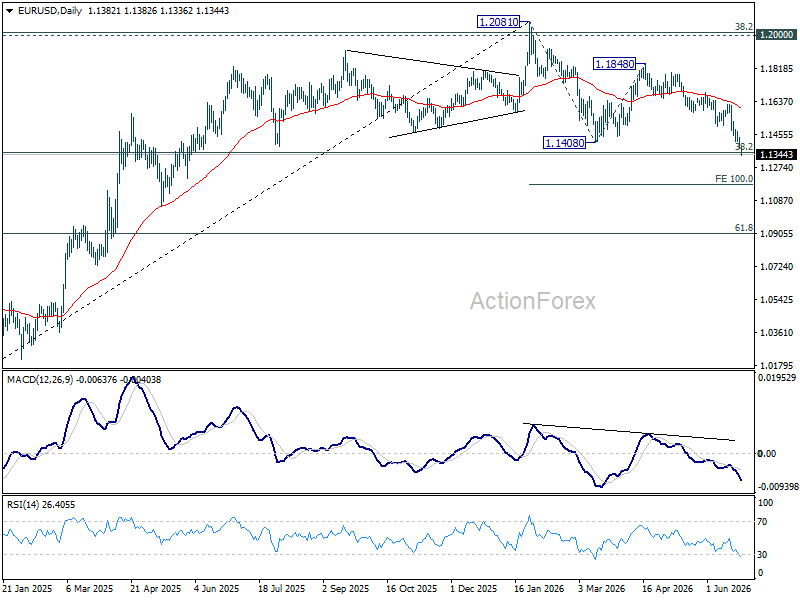
EUR/USD's decline continues today and intraday bias remains on the downside. Sustained break of 1.1353 fibonacci level will carry larger bearish implication. Next near term is 100% projection of 1.2081 to 1.1408 from 1.1848 at 1.1175. On the upside, above 1.1416 minor resistance will turn intraday bias neutral again first.
In the bigger picture, focus is back on 38.2% retracement of 1.0176 to 1.2081 at 1.1353. Decisive break there will revive the case of medium term bearish trend reversal after rejection by 1.2 key cluster resistance level. Further fall should be seen to 61.8% retracement at 1.0904. Nevertheless, strong rebound from 1.1353, followed by break of 1.1621 resistance, will retain medium term bullishness.
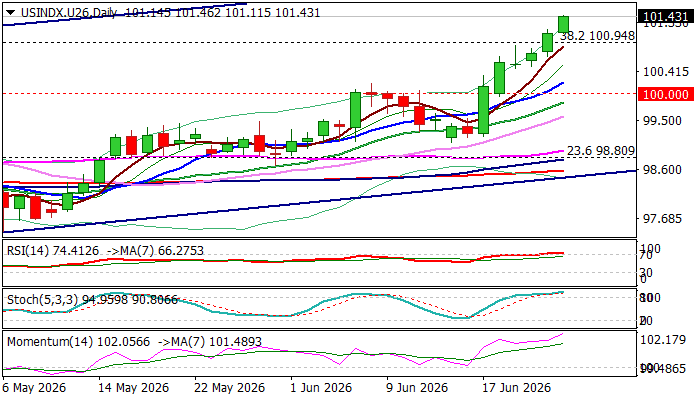
US Dollar Continues to Ride on the Wave of Optimism About Fed Rate Hike
The dollar continues to trend higher and hit highest levels in over one year on Wednesday, moving in a steep bull-leg that extends into sixth consecutive day.
Growing bets of Fed rate hike (currently at 72% for September rate hike vs 45% previous month), following recent hawkish remarks from US policymakers and economic data signaling that US economy remains strong, continue to underpin the dollar.
The price rises above psychological 100 level for the second straight week, with Tuesday’s break above 101 zone (Fibo 38.2% of 110.00/95.35 downtrend / round-figure), bringing in focus targets at 102.00 and 102.40/60 zone (bull-channel upper boundary / 50% retracement / 200WMA) and 102.91 (weekly cloud top).
Bulls continue to hold grip and so far do not react to overbought daily studies, though some corrective action should be anticipated in the near term.
Broken Fibo 38.2% (100.94) and former top (100.48) reverted to solid supports which should ideally contain potential dips.
Caution on extension below 100.00 pivot that would put bulls on hold and allow for deeper pullback.
Res: 101.80; 102.00; 102.40; 102.67
Sup: 100.94; 100.48; 100.21; 100.00