
Sample Category Title
Double Blow for USD/CAD
Today, the USD/CAD market faces a “double blow” from central banks:
→ At 16:45 GMT+3, the Bank of Canada will announce its decision. The rate is expected to be cut from 2.75% to 2.50%.
→ At 21:00 GMT+3, the Federal Reserve will follow with its own rate announcement.
Both events will be accompanied by statements from the central bank chairmen on future outlooks, and the USD/CAD market is likely to experience heightened volatility today.
Technical Analysis of the USD/CAD Chart
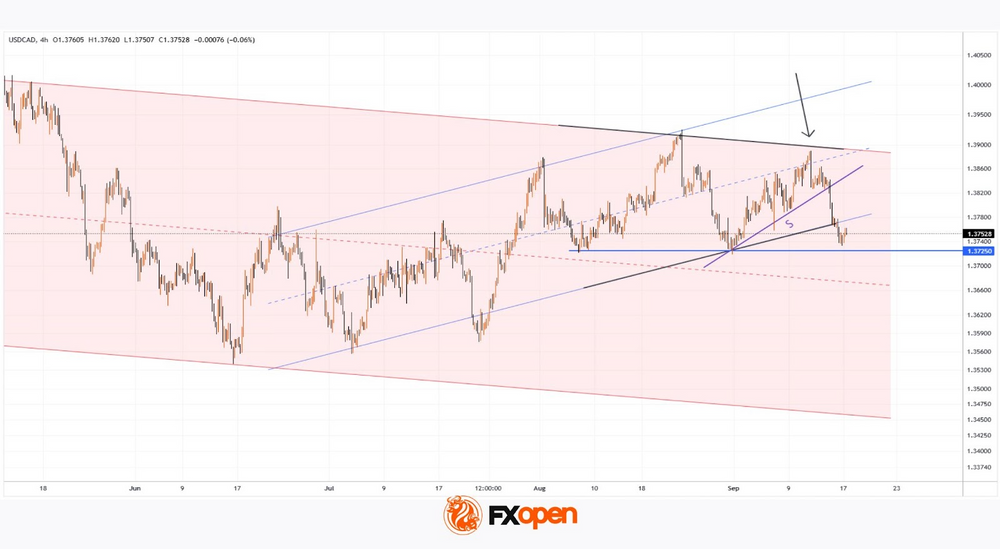
When analysing the USD/CAD chart earlier this month, we noted the formation of a symmetrical narrowing triangle (a sign of balance between supply and demand), bounded by:
→ a long-term descending channel (red), which has been in place since early February;
→ a short-term channel (blue), shaped by price fluctuations since mid-summer.
At that time, we suggested that supply and demand forces would keep USD/CAD in a temporary state of equilibrium until today.
Since then:
→ the price has reversed sharply from the upper boundary of the triangle (marked with an arrow);
→ on the eve of key announcements, the pair is attempting to consolidate below the lower boundary, signalling bearish pressure (in other words, a shift in balance in favour of supply).
Key observations:
→ the aggressive nature of the September support breakout (S);
→ the decline towards the critical 1.3725 level, which has acted as support since August.
Given the above, we could assume that the market is leaning bearish. Today’s announcements could trigger a downward impulse in USD/CAD – in this context, the chart may be interpreted through:
→ a potential breakout of the bearish flag pattern (formed by the blue channel);
→ prospects for the resumption of the broader downtrend within the red channel.
Trade over 50 forex markets 24 hours a day with FXOpen. Take advantage of low commissions, deep liquidity, and spreads from 0.0 pips. Open your FXOpen account now or learn more about trading forex with FXOpen.
This article represents the opinion of the Companies operating under the FXOpen brand only. It is not to be construed as an offer, solicitation, or recommendation with respect to products and services provided by the Companies operating under the FXOpen brand, nor is it to be considered financial advice.
EUR/USD Hits Four-Year High: All Eyes on the Fed
The EUR/USD pair surged to 1.1854 USD on Wednesday, reaching its highest level since September 2021. Investors are positioning ahead of the Federal Reserve’s highly anticipated interest rate decision, due later today.
Markets are almost fully pricing in a 25-basis-point cut, with 67 basis points of cumulative easing expected by year-end. These expectations are reinforced by recent labour market softening, despite inflation remaining above the Fed’s 2% target.
Significant attention will also be focused on the updated quarterly dot plot, which may offer critical insights into the future path of monetary policy.
The trading session is expected to be highly volatile.
On the data front, US retail sales rose in August for the third consecutive month, underscoring the resilience of consumer spending over the summer.
Broad-based USD weakness has driven the dollar lower against nearly all major currencies.
Technical Analysis: EUR/USD
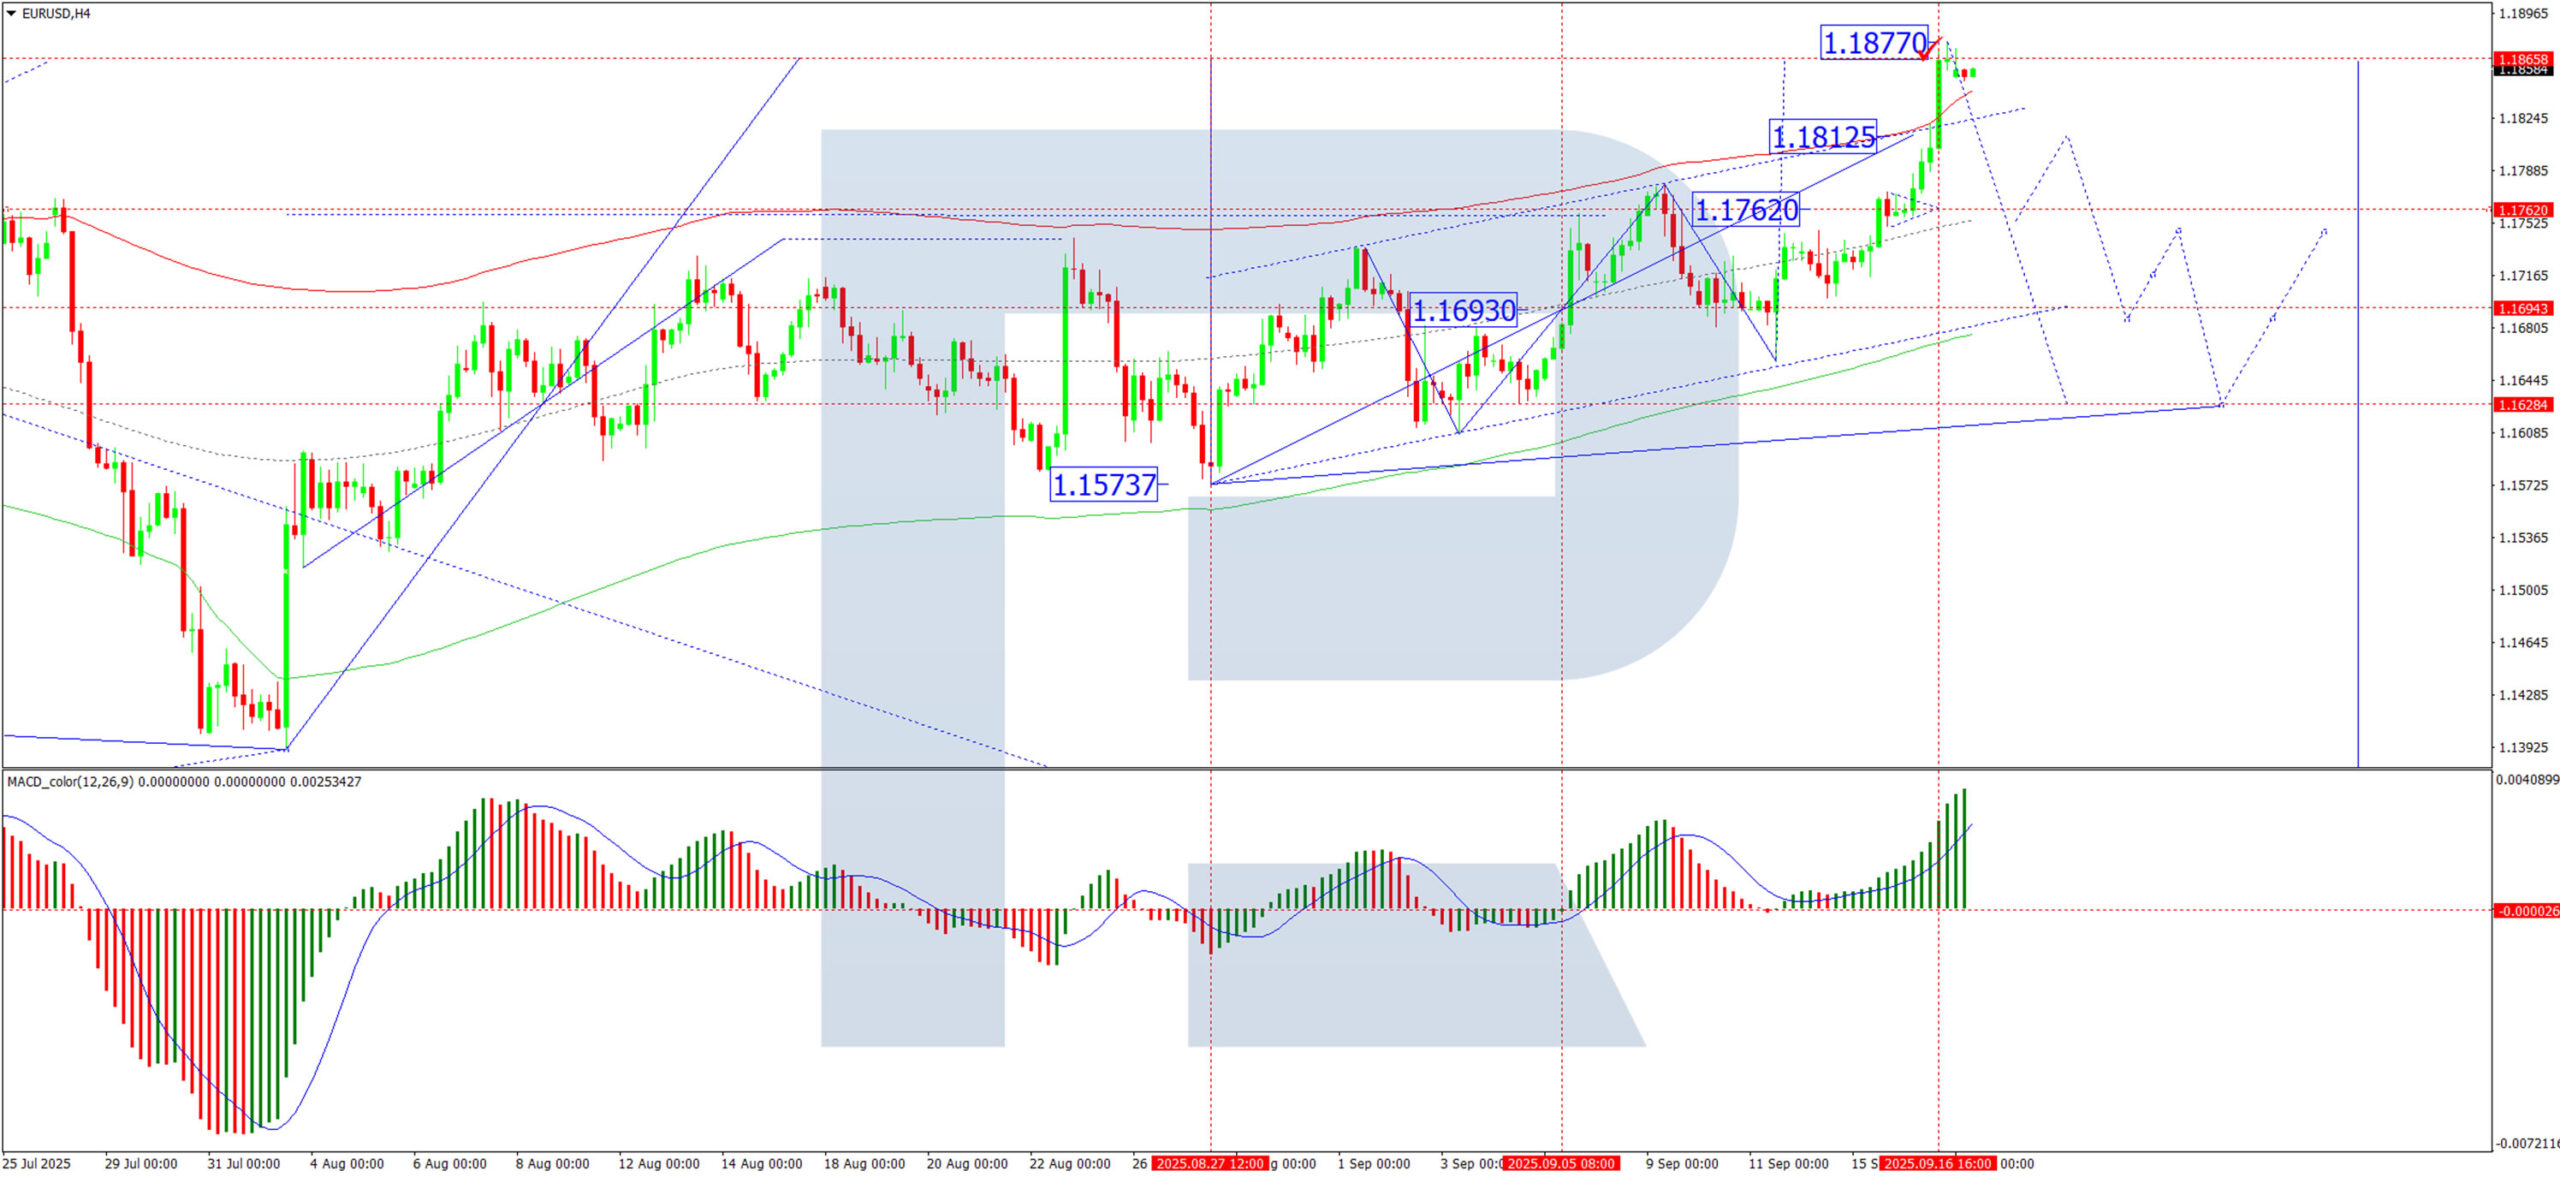
H4 Chart:
On the H4 chart, EUR/USD formed a consolidation range around 1.1762 USD before breaking upward to complete an impulsive move to 1.1877 USD. The pair now appears poised for a corrective decline towards 1.1762 USD. This outlook is supported by the MACD indicator: although the signal line remains above zero, it has reached overextended levels. This suggests that a near-term pullback is likely.
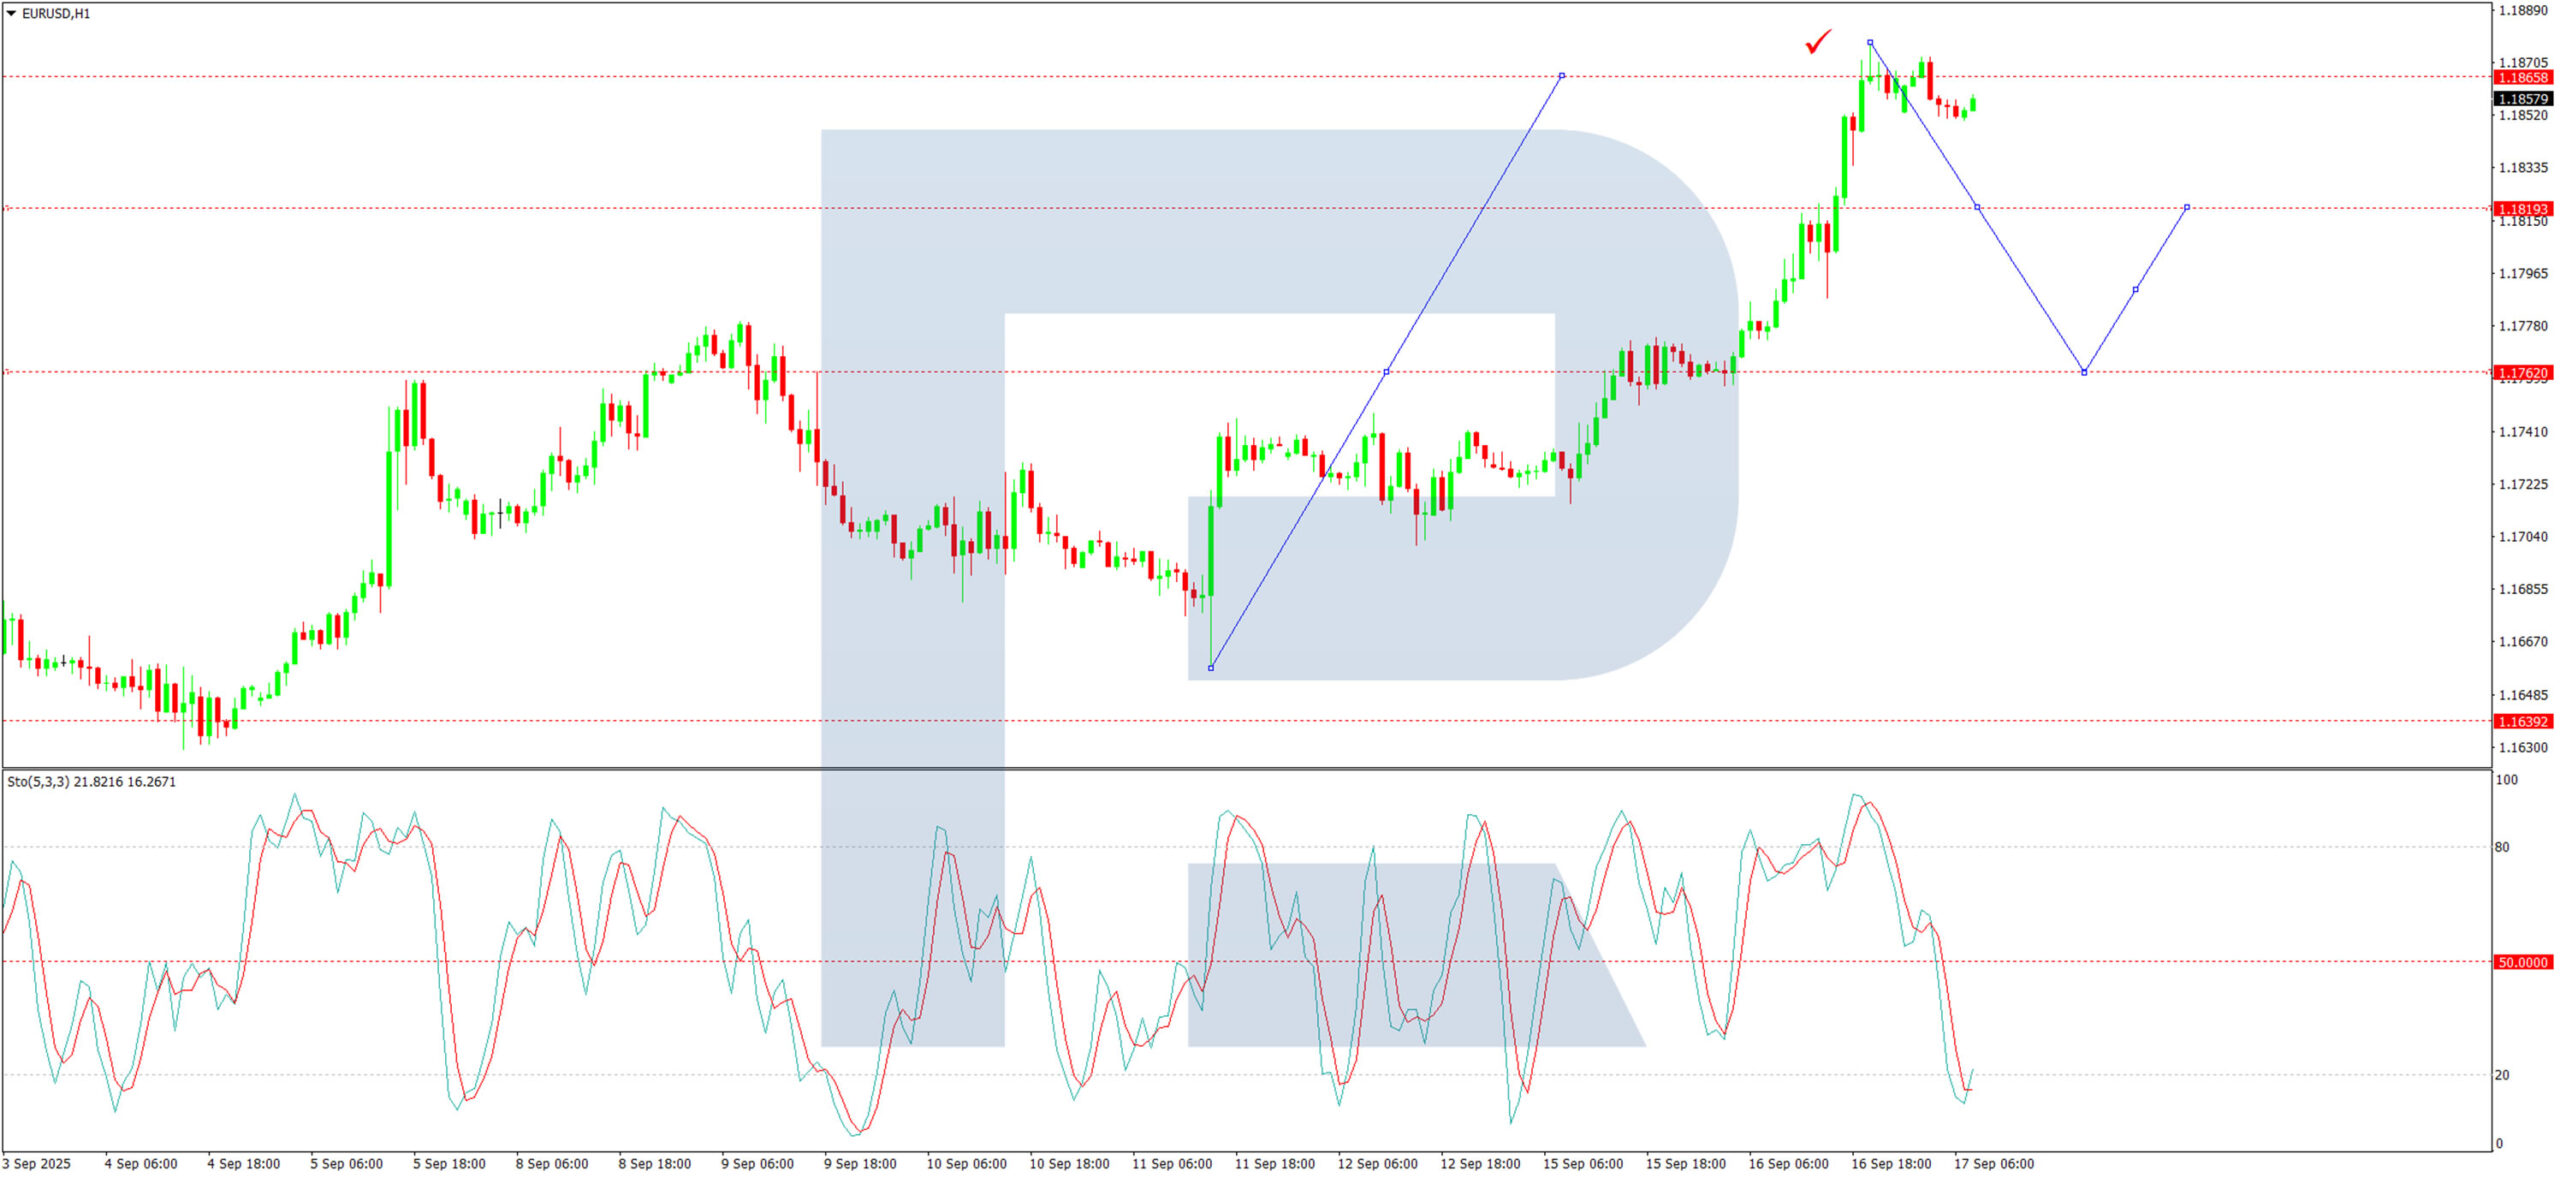
H1 Chart:
On the H1 chart, the pair completed its ascent to 1.1877 USD and is now forming a consolidation range below this level. A downward breakout is expected, with an initial decline towards 1.1762 USD likely. A brief rebound towards 1.1820 USD may follow. Selling pressure could then resume, with targets at 1.1630 USD and potentially 1.1550 USD. The Stochastic oscillator confirms this bearish near-term bias, with its signal line positioned below 50 and trending downward towards 20.
Conclusion
The euro’s rally to multi-year highs reflects broad USD weakness and elevated expectations for Fed easing. However, technical indicators suggest the pair is overextended and due for a correction. Today’s Fed decision – particularly the tone of the statement and updated dot plot – will be crucial in determining whether this pullback deepens or becomes a buying opportunity. Traders should prepare for significant volatility following the release.
EUR/USD Rallies While USD/JPY Shows Weakness
EUR/USD started a decent upward move above 1.1770. USD/JPY declined below 147.00 and is currently consolidating losses.
Important Takeaways for EUR/USD and USD/JPY Analysis Today
- The Euro found support and started a recovery wave above the 1.1770 resistance zone.
- There is a connecting bullish trend line forming with support at 1.1825 on the hourly chart of EUR/USD at FXOpen.
- USD/JPY is trading in a bearish zone below 147.00.
- There is a short-term bearish trend line forming with resistance at 146.65 on the hourly chart at FXOpen.
EUR/USD Technical Analysis
On the hourly chart of EUR/USD at FXOpen, the pair started a fresh increase from 1.1660. The pair even settled above 1.1800 and the 50-hour simple moving average. Finally, it tested the 1.1880 resistance. A high is formed near 1.1878 and the pair is now consolidating gains above the 23.6% Fib retracement level of the upward move from the 1.1660 swing low to the 1.1878 high.
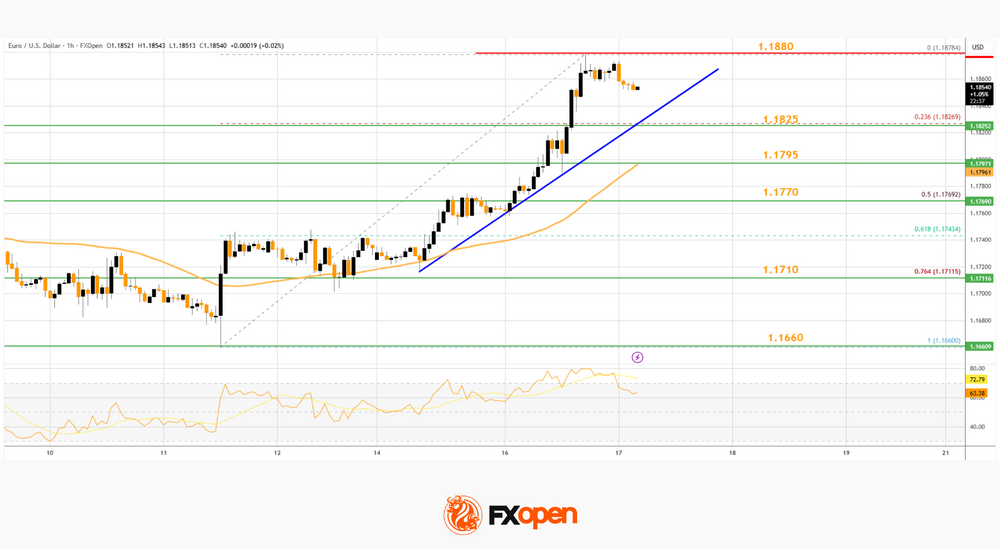
Immediate support is near a connecting bullish trend at 1.1825. The next area of interest could be 1.1795 and the 50-hour simple moving average.
The main breakdown zone on the EUR/USD chart sits near the 50% Fib retracement at 1.1770. If there is a downside break below 1.1770, the pair could drop toward 1.1710. Any more losses might send the pair toward the 1.1660 low.
On the upside, the pair is now facing resistance near 1.1880. The next hurdle is 1.1920. An upside break above 1.1920 could set the pace for another increase. In the stated case, the pair might rise toward 1.1965.
USD/JPY Technical Analysis
On the hourly chart of USD/JPY at FXOpen, the pair started a steady decline from 148.00. The US Dollar gained bearish momentum below 147.50 against the Japanese Yen.
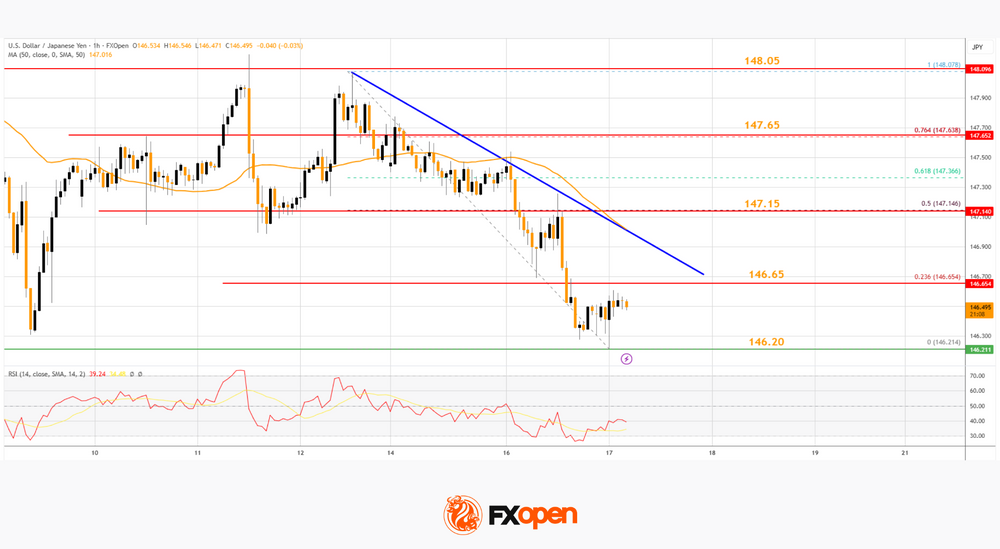
The pair even settled below 147.20 and the 50-hour simple moving average. There was a spike below 146.25 and the pair traded as low as 146.21. It is now consolidating losses with a bearish angle. Immediate resistance on the USD/JPY chart is near the 23.6% Fib retracement level of the recent decline from the 148.07 swing high to the 146.21 low at 146.65.
There is also a short-term bearish trend line forming at 146.65. The next resistance for the bulls could be near the 50% Fib retracement at 147.15.
If there is a close above the 147.15 level and the hourly RSI moves above 50, the pair could rise toward 147.65. The next key area of interest is near 148.05, above which the pair could test 148.50 in the coming days.
On the downside, the first major support is near 146.20. The next key zone is near 145.80. If there is a close below 145.80, the pair could decline steadily. In the stated case, the pair might drop toward 145.00.
Trade over 50 forex markets 24 hours a day with FXOpen. Take advantage of low commissions, deep liquidity, and spreads from 0.0 pips. Open your FXOpen account now or learn more about trading forex with FXOpen.
This article represents the opinion of the Companies operating under the FXOpen brand only. It is not to be construed as an offer, solicitation, or recommendation with respect to products and services provided by the Companies operating under the FXOpen brand, nor is it to be considered financial advice.
Dow Jones (DJIA) Technical: Resting at Key Support Ahead of FOMC, Watch US Treasury Yield Curve to Trigger Bullish...
The price actions of the US Wall Street 30 CFD Index (a proxy of the Dow Jones Industrial Average futures) have staged the expected bullish breakout above the minor “Ascending Triangle” range resistance at 45,780 and rallied by 1.3% to hit a fresh all-time intraday high of 46,140 on last Friday, 12 September 2025, during the early Asian session.
Thereafter, the US Wall Street 30 CFD Index’s minor/short-term bullish momentum fizzled out and staged a corrective pull-back of -1.1% to print an intraday low of 45,645 on Tuesday, 16 September 2025, ahead of today’s FOMC monetary policy decision outcome and the release of the latest Fed economic projections (dot plot).
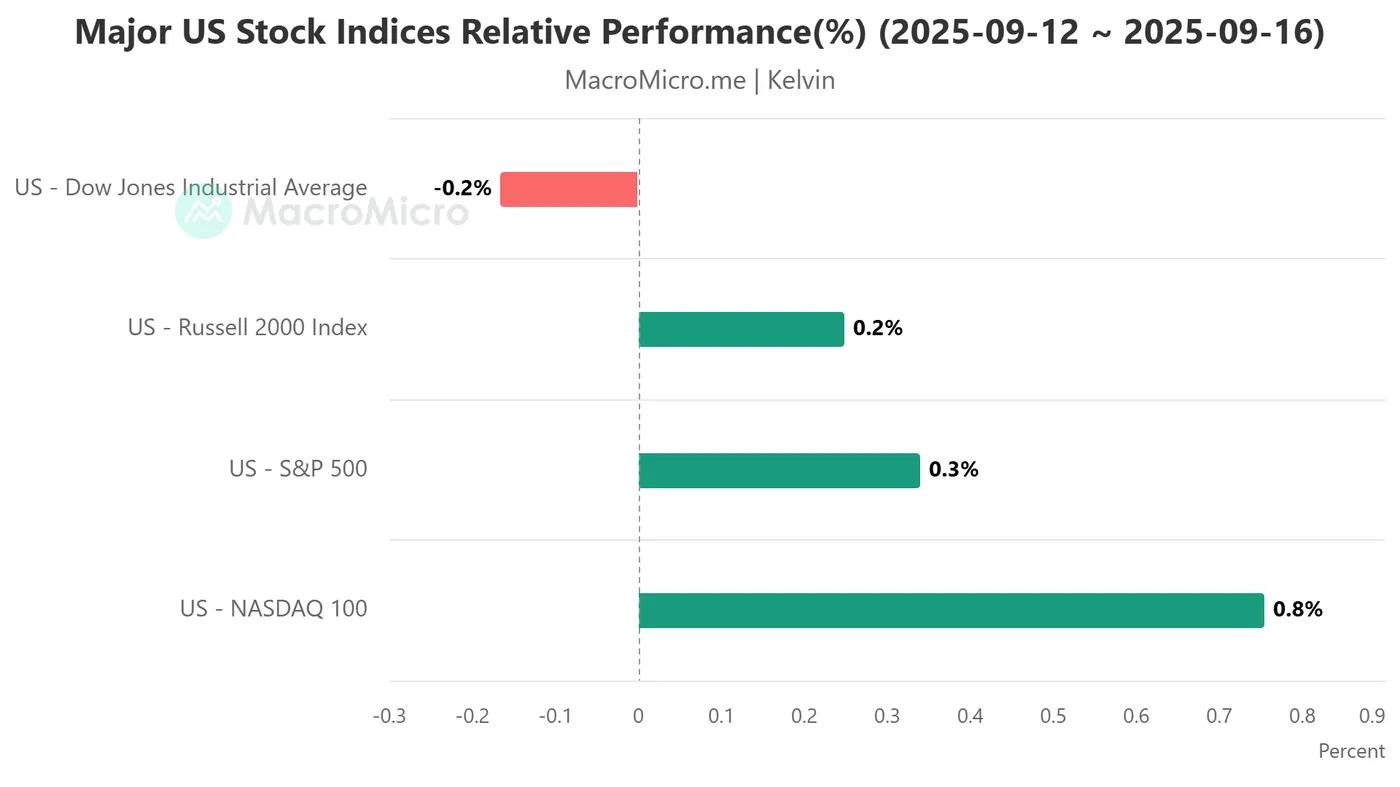
Fig. 1: Performances of S&P 500, Nasdaq 100, DJIA & Russell 2000 from 12 Sep 2025 to 16 Sep 2025 (Source: MacroMicro)
So far, the Dow Jones Industrial Average has both lagged and outperformed its peers from last Friday, 12 September, to this Wednesday, 16 September. The DJIA shed -0.2%, and in contrast, the mega-cap heavy S&P 500 and Nasdaq 100 recorded gains of 0.3% and 0.8% respectively towards fresh all-time highs. Even the small-cap Russell managed to squeeze out a modest positive return of 0.2% (see Fig. 1).
A key macro factor and its intermarket relationship hold the key to the short to medium-term performance of the Dow Jones Industrial Average. More details below.
A re-steepening of the US Treasury yield curve is needed to revive the bulls of Dow Jones
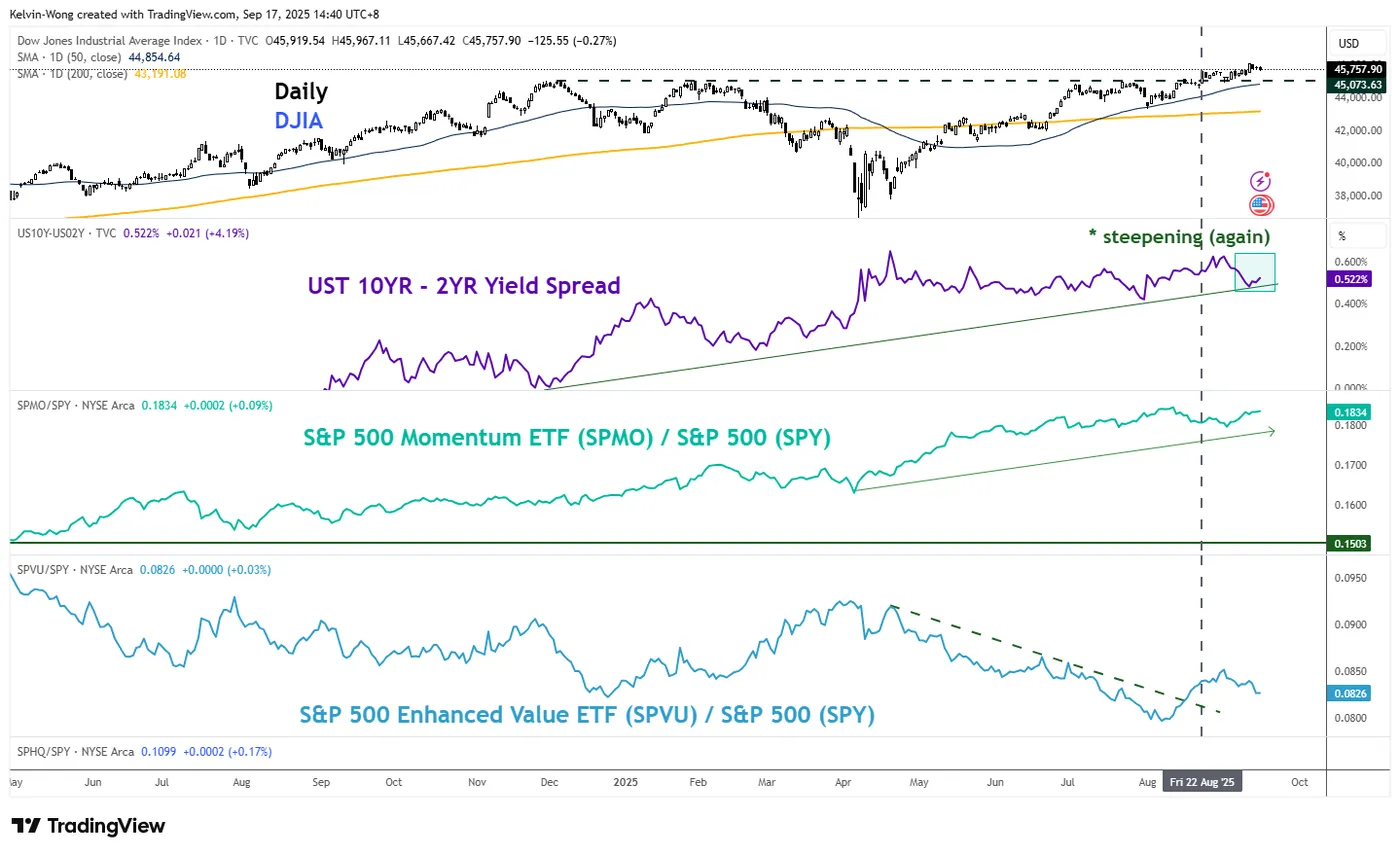
Fig. 2: DJIA, momentum, value factors, US Treasury yield curve major trends as of 16 Sep 2025 (Source: TradingView)
The Dow Jones Industrial Average tends to be viewed as a more “value-oriented” barometer benchmark US stock index due to its higher weightage of value-related sectors, such as Financials, over the Nasdaq 100; the Financials sector has a weightage of 27% in the DJIA.
One of the key drivers that allows the DJIA to stage a bullish breakout on 22 August 2025, above its former all-time high of 45,074 printed on 4 December 2024, is a macro factor (undiversifiable risk), the bullish steepening of the US Treasury yield curve (10-year minus 2-year), which, in turn, also reinforced the bullish breakout of the ratio chart of the S&P 500 Enhanced Value ETF (35% weightage in Financials)/S&P 500 ETF (see Fig. 2).
A bullish steepening of the US Treasury yield curve indicates short-term interest rates are falling at a faster pace than long-term interest rates due to an accommodating monetary policy environment undertaken by the Fed.
Hence, a US Treasury bull steepening environment tends to benefit the US Financials, especially in wholesale banking, as net interest margins expand, in turn, triggering a positive feedback loop back into the Dow Jones Industrial Average (heavily weighting in the Financials sector).
The recent pull-back in the DJIA since last Friday, 12 September, has moved in line with the flattening of the US Treasury yield curve (10-year minus 2-year). Interestingly, the flattening process of the US Treasury yield has stalled at a major ascending support, and a re-steepening motion seems to be in progress as it staged a bounce from 0.48% on 11 September 2025 to 0.52% on Tuesday, 16 September 2025.
The further re-steepening of the US Treasury yield curve will likely hinge on today’s release of the Fed’s latest economic projections and Chair Powell’s press conference, both of which will shape market expectations for monetary policy.
Should the Fed strike a dovish tone that prompts markets to price in more than the three rate cuts currently anticipated for 2026 (latest CME FedWatch tool data), the yield curve may resume its bull-steepening trend, in turn supporting the next bullish impulsive move in the DJIA.
Let’s now focus on the short-term (1 to 3 days) trajectory and key technical levels to watch on the US Wall Street 30 CFD Index
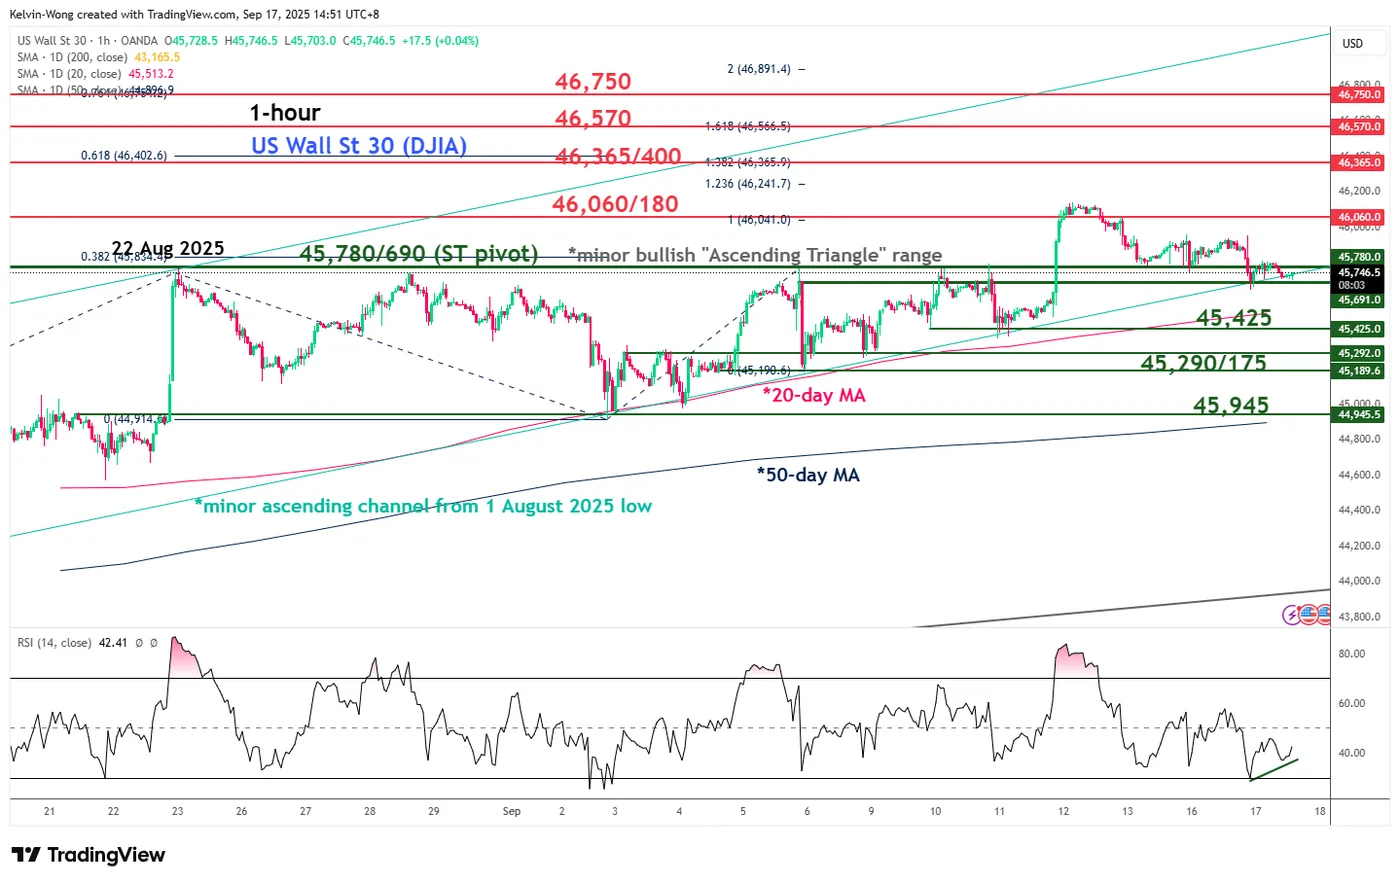
Fig. 3: US Wall Street 30 CFD minor trend as of 17 Sep 2025 (Source: TradingView)
Preferred trend bias (1-3 days)
The minor corrective pull-back from last Friday, 12 September 2025, may have reached its terminal point for a potential bullish reversal.
Maintain a bullish bias on the US Wall Street 30 CFD Index with 45,780/45,690 as key short-term pivotal support. A clearance above 46,180 adds impetus to the start of another bullish impulsive up move sequence for the next intermediate resistances to come in at 46,365/46,400 and 46,570 (Fibonacci extension) (see Fig. 3).
Key elements
- The recent pull-back of the US Wall Street 30 CFD Index has started to stall at the lower boundary of the minor ascending channel in place since the 1 August 2025 low.
- The 45,780/45,690 key short-term pivotal support also coincides with the pull-back for the former minor “Ascending Triangle” range resistance.
- The hourly RSI momentum indicator has staged a rebound after it reached its oversold zone on Tuesday, 16 September 2025, which suggests that the recent bearish momentum has eased.
Alternative trend bias (1 to 3 days)
A break below the 45,690 key short-term support invalidates the bullish reversal scenario on the US Wall Street CFD Index.
A further extension of the minor corrective decline may materialise to expose the next intermediate supports at 45,425 and 45,290/45,175.
GBP/JPY Daily Outlook
Daily Pivots: (S1) 199.52; (P) 200.13; (R1) 200.46; More...
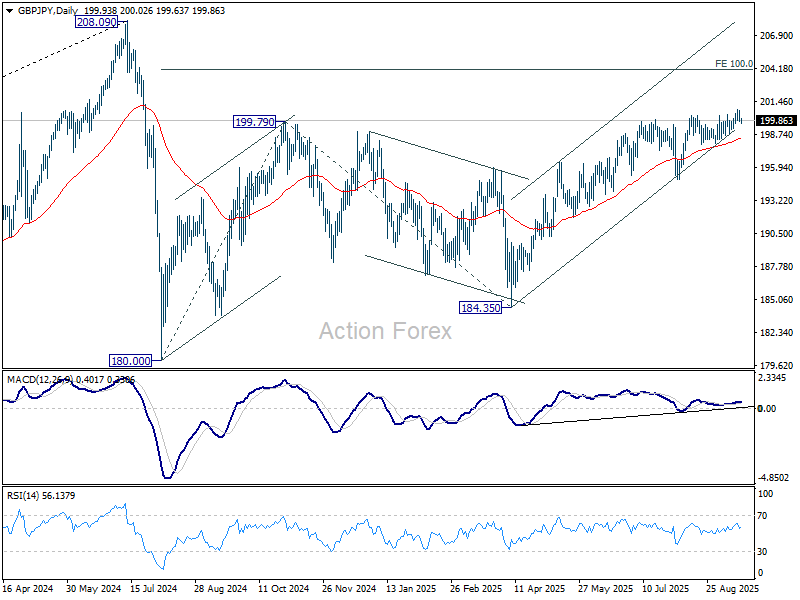
Intraday bias in GBP/JPY is turned neutral with current retreat, and some consolidations would be seen below 200.72. Further rise would be expected as long as 197.93 support holds. Firm break of 200.32 will target 100% projection of 180.00 to 199.79 from 184.35 at 204.14. However, considering bearish divergence condition in both D and 4H MACD, firm break of 197.93 will indicate bearish reversal and bring deeper fall back to 195.01 support first.
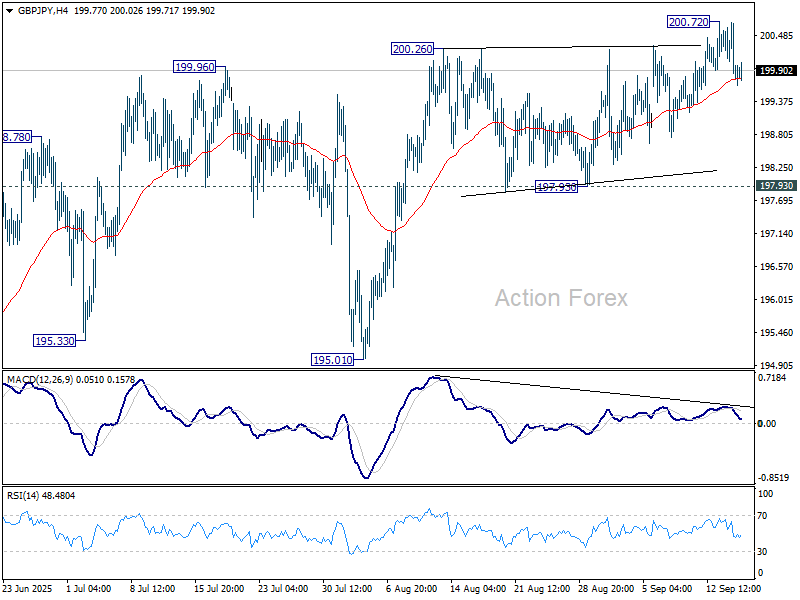
In the bigger picture, price actions from 208.09 (2024 high) are seen as a correction to rally from 123.94 (2020 low). The pattern might still extend with another falling leg. But in that case, strong support should be seen from 38.2% retracement of 123.94 to 208.09 at 175.94 to contain downside. Meanwhile, decisive break of 208.09 will confirm long term up trend resumption.
EUR/JPY Daily Outlook
Daily Pivots: (S1) 173.25; (P) 173.55; (R1) 174.07; More...
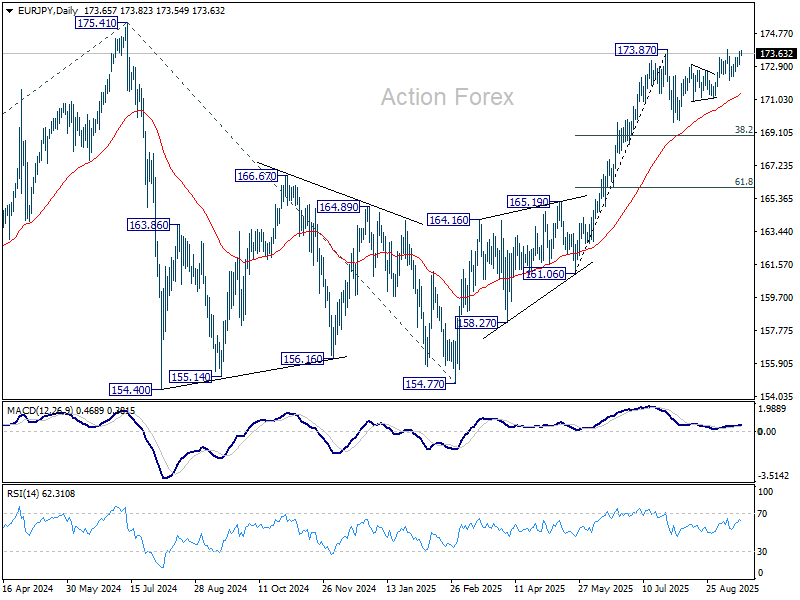
EUR/JPY is staying in range below 173.88 and intraday bias stays neutral. On the upside, decisive break of 173.87/8 will resume the rally from 154.77 to retest 175.41 high. However, break of 172.11 will extend the corrective pattern from 173.87 with another fall. Bias will be back to the downside for 171.09 support first.
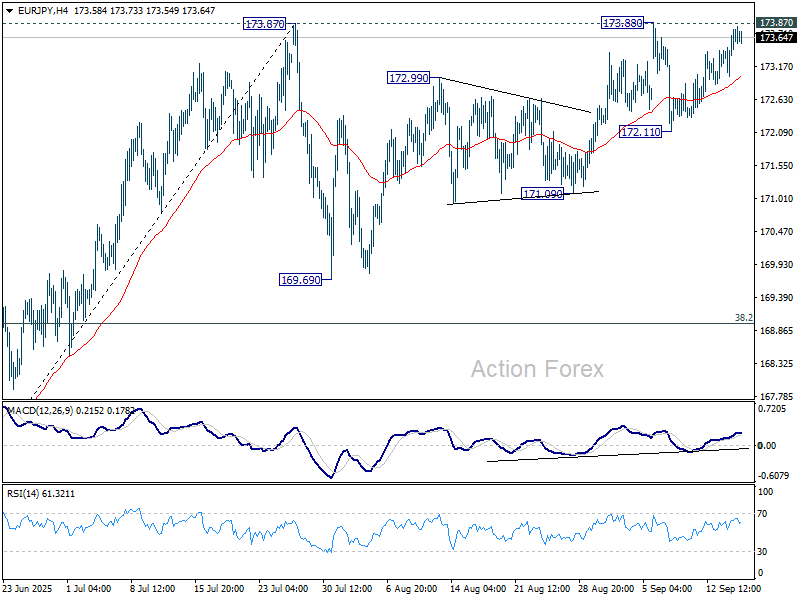
In the bigger picture, current rally from 154.77 is still tentatively seen as resuming the larger up trend. Firm break of 175.41 (2024 high) will confirm and target 61.8% projection of 124.37 to 175.41 from 154.77 at 186.31. However, sustained break of 38.2% retracement of 161.06 to 173.87 at 168.97 will delay this bullish case, and probably extend the correction from 175.41 with another fall.
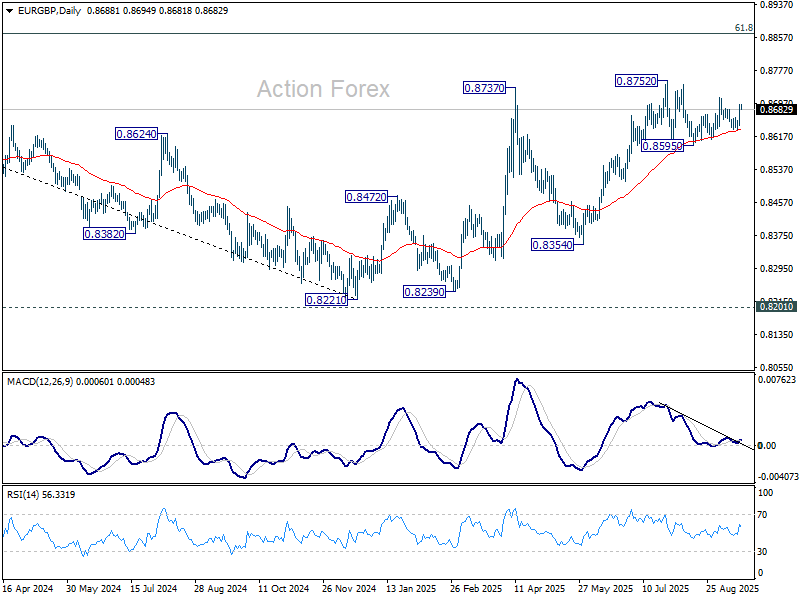
EUR/GBP Daily Outlook
Daily Pivots: (S1) 0.8662; (P) 0.8680; (R1) 0.8715; More...
EUR/GBP's break of 0.8683 resistance suggests that pullback from 0.8711 has completed at 0.8631. Rise from 0.8595 is resuming. Intraday bias is back on the upside for 0.8711 first. Break there will target a retest on 0.8752 high. For now, further rise is expected as long as 0.8631 support holds, in case of retreat.
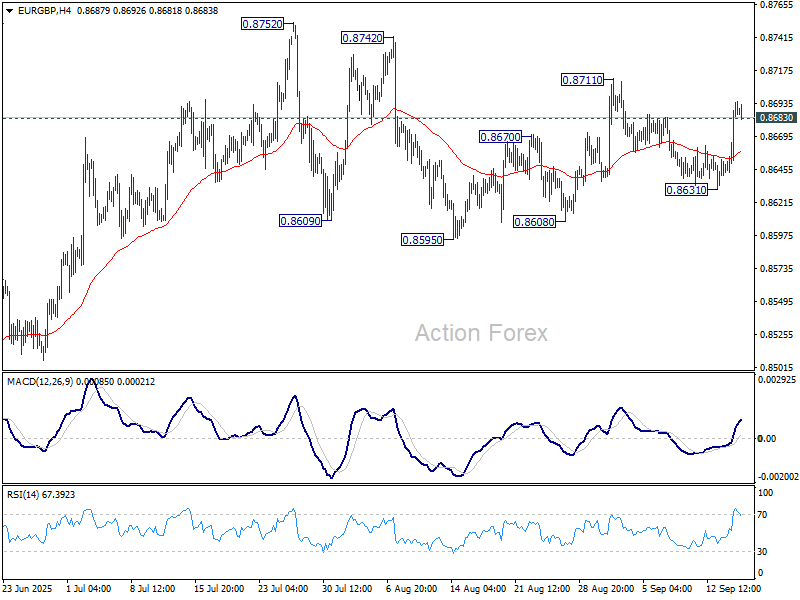
In the bigger picture, the structure from 0.8221 medium term bottom are not impulsive enough to suggest that it's reversing the down trend from 0.9267 (2022 high). But even if it's a correction, further rise could still be seen to 61.8% retracement of 0.9267 to 0.8221 at 0.8867. Nevertheless, sustained trading below 55 W EMA (now at 0.8518) will argue that the pattern has completed and bring retest of 0.8221 low.
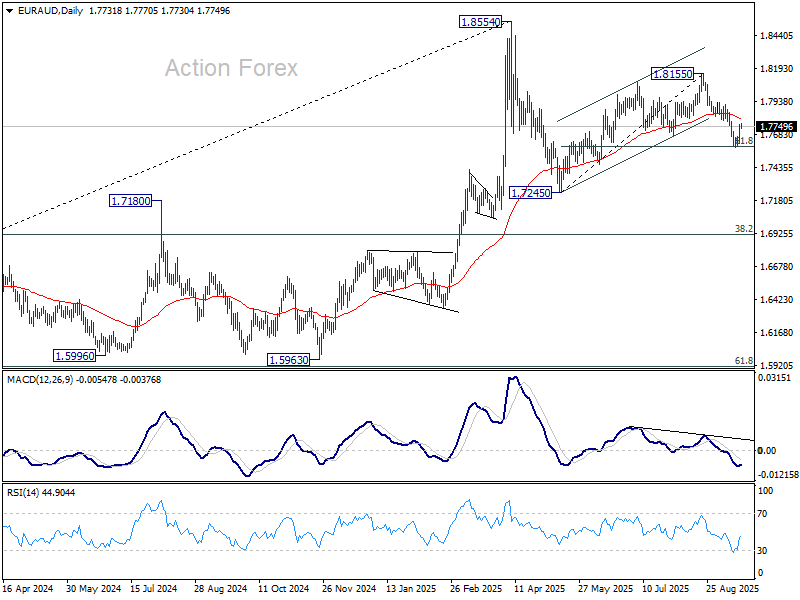
EUR/AUD Daily Outlook
Daily Pivots: (S1) 1.7660; (P) 1.7714; (R1) 1.7803; More...
Intraday bias in EUR/AUD stays neutral for the moment, and more consolidations could be seen above 1.7588. Further decline is expected as long as 55 D EMA (now at 1.7808) holds. Corrective pattern from 1.8554 is in the third leg. Sustained trading below 61.8% retracement of 1.7245 to 1.8155 at 1.7593 will target 1.7245 support and possibly below. However, decisive break of the 55 D EMA will dampen this view, and bring stronger rally back to 1.8155 resistance instead.
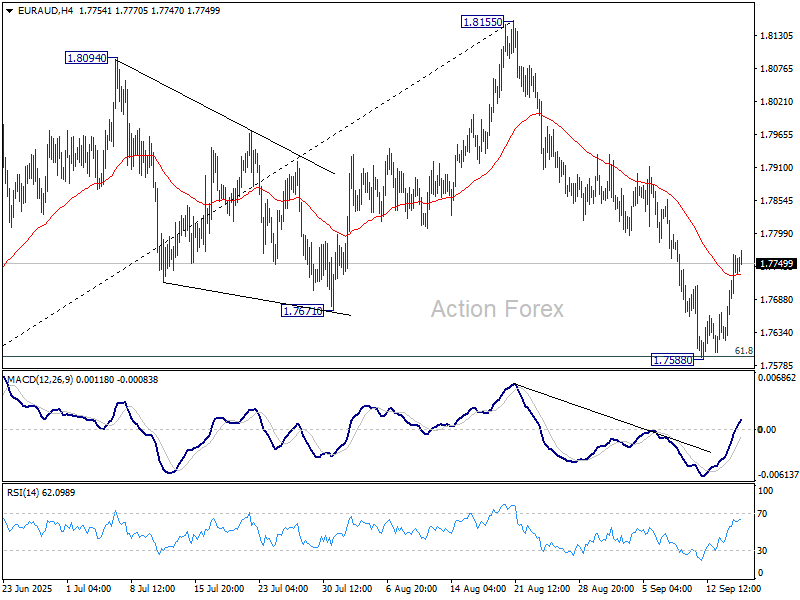
In the bigger picture, price actions from 1.8554 medium term top are seen as a corrective pattern. Deeper fall could be seen as the pattern extends, but downside should be contained by 38.2% retracement of 1.4281 (2022 low) to 1.8554 at 1.6922 to bring rebound. Uptrend from 1.4281 is expected to resume at a later stage.
EUR/CHF Daily Outlook
Daily Pivots: (S1) 0.9317; (P) 0.9334; (R1) 0.9344; More...
Intraday bias in EUR/CHF remains neutral as range trading continues above 0.9313. Further decline is expected with 0.9394 resistance intact. On the downside, break of 0.9313 will resume the fall from 0.9452 to retest 0.9218 low. On the upside, break of 0.9394 will bring stronger rally towards 0.9452 resistance instead.
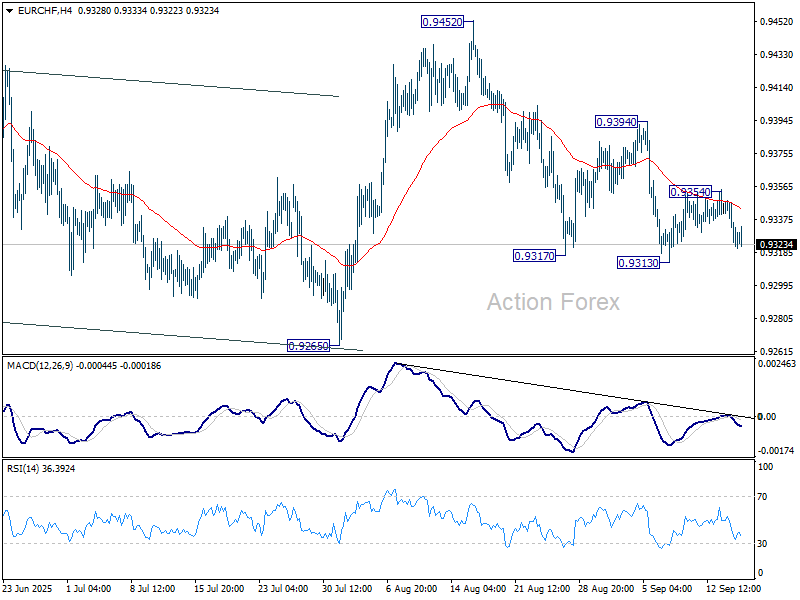
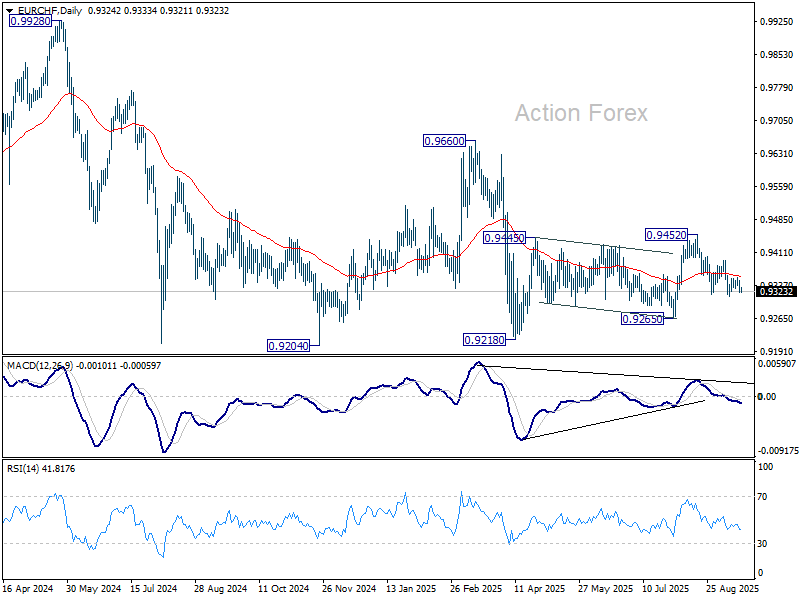
In the bigger picture, the down trend from 0.9204 (2018 high) might still be in progress considering that EUR/CHF is staying well inside the long term falling channel. However, with bullish convergence condition in W MACD, downside potential should be limited in case of another fall. Instead, firm break of 0.9660 resistance will be an important sign of medium term bullish trend reversal.
The Most Uncertain, Strangest and Politically-Influenced FOMC Meeting in Years
Markets
It’s showtime. A weak July payrolls report and Fed Chair Powell’s speech in Jackson Hole set the stage for a re-start of the Fed’s normalization cycle tonight. Powell acknowledged that risks around the Fed’s dual mandate were shifting from upward inflation risks to downward employment risks. The US labour market is some kind of optical illusion where a marked slowdown in both the supply and demand of workers keep the unemployment rate in balance. This curious equilibrium could be easily distorted if employers switch from labour hoarding to implementing job cuts. Weakness in labour demand also limits the likelihood of a virtuous price-wage spiral should US tariffs in the end have a more profound effect on prices than what currently showed in the data. Powell’s framing was less dramatic than a year ago when the Fed turned to a jumbo rate cut (50 bps). While a dissenting vote in favour of such action is possible and even likely (Waller, Miran?), the US central bank is expected to stick with a regular 25 bps rate cut to 4%-4.25%. The bigger question is whether Powell and/or the updated quarterly Summary of Economic Projections signal the start of cutting cycle (2 more 25 bps rate cuts this year). Back in June, the median estimate suggested two rate cuts during 2025. Recent comments point to quite some diverging views among FOMC members. Powell will have to walk a tight rope to keep market expectations in check. Median estimates for 2026 and 2027 will probably be closer to a neutral 3% than in June (3.5%-3.75 & 3.25%-3.5%) but the difference in opinion will be large. It’s back to navigating the stars under cloudy skies. The most uncertain, strangest and politically-influenced FOMC meeting in years makes it hard to offer guidance for the market reaction. We have the impression that US markets are willing to pick up any dovish signals tonight, adding or accelerating 2026 rate cut bets. If the tone of Powell’s presser is in line with his Jackson Hole speech, they’ll see it as an all clear. The US 2-yr and 10-yr yield (real rate suffering) are at risk of losing technical/psychologic support at respectively 3.5% and 4%. The dollar was already in dire straits earlier this week with EUR/USD yesterday closing above the 1.1829 YtD top. First 1.20+ levels since June 2021 could be in the making. Our medium-term target still stands at 1.2349 (2021 top). The trade-weighted dollar yesterday closed just above the YtD bottom (96.63 vs 96.38).
UK August inflation numbers printed in line with consensus this morning. Headline CPI accelerated to 0.3% M/M to remain steady (and sticky) at 3.8% Y/Y. Core CPI and services CPI printed at 3.6% Y/Y (from 3.8% Y/Y) and 4.7% Y/Y (from 5% Y/Y) respectively. Today’s number won’t alter the picture for the Bank of England which meets tomorrow. GBP trades unchanged after EUR/GBP yesterday followed EUR/USD’s move higher, from 0.8650 to 0.8695.
News & Views
Indonesia’s Economic Minister Hartarto confirmed to Reuters today that the EU and Indonesia have finalized a trade agreement that will be signed on September 23. Yesterday, the Financial Times already reported that the EU trade Commissioner Maros Sefcovic will travel to Indonesia to sign the agreement. The process to reach an agreement was accelerated by US President Trump’s tariff policy that affected both countries. Indonesian officials indicated that the agreement will give Indonesia zero tariffs for 80% of its exports and the removal of non-tariff barriers. At the same time, the EU will get lower tariffs for its industrial and agriculture products to the country. Bilateral trade between the two countries amounted to about $30bn last year.
Both Japanese exports (-0.1% Y/Y) and imports (-5.2% Y/Y) fell in value terms compared with August of last year. For exports it was the fourth consecutive monthly decline. Japan posted a trade deficit of JPY 242.5bn (about $1.7bn). Exports to the US declined by 13.8% compared to the same month last year as trade flows adapted to new trade tariffs imposed by the US. Exports of auto’s declined by -28.4%. The trade surplus between Japan and the US dropped to JPY 324bn, a decline of about 50% compared to the same month last year and the lowest level in one year and a half. Exports to China dropped by 0.5%. Exports to Europe rose 5.5%.