Sample Category Title
Japan August exports near flat, -13.8% US plunge balanced by other markets
Japan’s trade deficit narrowed in August to JPY -242.5B, smaller than expectations for JPY -513.6B, as exports outperformed forecasts. Overall exports dipped just 0.1% yoy to JPY 8425B, beating projections for a 1.9% yoy decline. Imports, however, fell -5.2% yoy to JPY 8668B, a steeper drop than the -4.2% yoy contraction expected.
The details highlighted stark divergences. Exports to the U.S. tumbled -13.8% yoy, the sharpest fall since February 2021, led by a -28.3% yoy plunge in autos and a -38.9% yoy drop in chipmaking equipment. By contrast, shipments to Asia rose 1.7% yoy, while exports to Western Europe jumped 7.7% yoy. Exports to mainland China slipped 0.5% yoy, though shipments to Hong Kong surged 14.4% yoy.
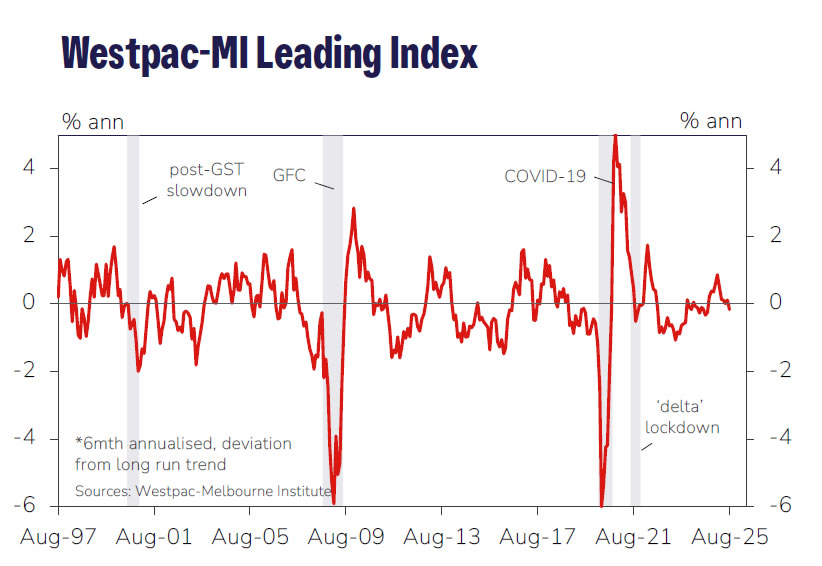
Australia leading index turns below trend, but RBA to wait until November to cut again
Australia’s Westpac Leading Index growth rate slipped into negative territory in August, falling from 0.11% to -0.16%. It marks the first below-trend reading since September 2024 and a sharp moderation from February’s peak of 0.86%.
Westpac noted the weakness is “not overly concerning” but highlights a “clear softening” from earlier in the year, consistent with the economy slowing after a relatively strong June quarter. It expects growth of 1.9% in 2025, better than the 1.3% expansion in 2024 but still below trend, with a return to trend pace only in 2026.
The RBA meets on September 29–30, where policymakers are almost certain to hold the cash rate steady at 3.6%. Westpac argues that incoming data should eventually validate benign inflation and soft demand, paving the way for a 25bp cut in November, followed by two further cuts in 2026. For now, the RBA will proceed cautiously, watching for confirmation of underlying trends before easing again.
Fed (FOMC) Meeting Preview: 25 bps Cut Appears Baked In, Forward Guidance Is Key. Implications for DXY, Dow Jones...
The Federal Reserve's upcoming meeting is a big deal for the US economy and financial markets as a whole.
The latest economic data suggests the Fed should start lowering interest rates. However, the market already expects a rate cut and based on market moves it appears that it has largely been priced in.
Because of this, the Fed's announcement about their future plans will likely be more important than their actual decision at this meeting. That is likely to be what will really stoke volatility barring a surprise decision by the Fed.
Source: CME FedWatch Tool
The Macroeconomic Case for a Rate Cut
The main concern is the weakening job market. While the economy grew by 3.3% in the second quarter, this was mostly due to a big change in trade, which hid the fact that consumer spending was weak. People were spending less because they were worried about tariffs, a cooling job market, and unstable wealth.
This was confirmed by the Federal Reserve's Beige Book, which showed little to no economic activity and declining consumer spending across the country. It also reported that most districts were not hiring and that the job market was slowing. Last Friday's jobs report also showed a small increase in jobs, and unemployment went up. Revisions to job numbers from the past year showed the economy created less than half the jobs that were previously reported.
Even though inflation is still above the target, the risk to the job market now seems more urgent to the Fed. They'll likely start to move toward a less restrictive policy.
Three factors that drove inflation up in 2022—oil prices, housing rents, and wages—are now gone, and are even helping to lower inflation. A cooling economy with rising unemployment will also help bring inflation back down to 2% by the end of 2026.
The Fed will probably lower its forecasts for economic growth and inflation while raising its unemployment projections. We expect the Fed to cut interest rates by 0.25% at their September 17 meeting, with more cuts to follow in October, December, January, and March. It's possible the Fed could start with a larger cut of 0.50%, but a 0.25% cut is more likely because most members are still cautious about the impact of tariffs on inflation.
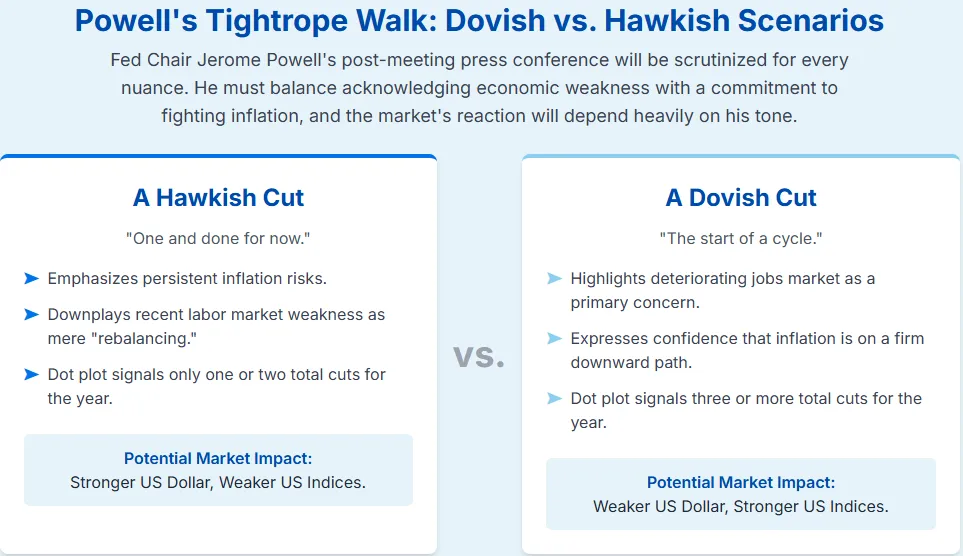
The Fed's Challenge: Reining in Dovish Expectations
The Federal Reserve is in a tough spot. Even with evidence pointing to a need for lower interest rates, the market has already bet on a lot of rapid rate cuts. This creates a significant communication challenge for the Fed. They have to manage market expectations very carefully.
The "Dovish" Surprise
One possibility is that the Fed tries to meet or even beat the market's high expectations. Traders are already anticipating a lot of cuts by the end of 2026. For the Fed's announcement to truly be a positive surprise for the market, they would need to signal an even faster pace of rate cuts than what is already expected. If they simply use their normal cautious language, even when announcing a cut, the market might see it as a disappointment. The real risk here isn't a wrong policy decision, but a gap between what the Fed says and what the market wants to hear.
The "Powell Pushback"
A different view is that Fed Chair Powell will intentionally try to lower market expectations. This perspective suggests that he will push back against the idea of quick rate cuts in October and December. Instead, he would likely emphasize that the Fed will continue to be guided by incoming economic data, keeping their options open.
This cautious approach is about protecting the Fed's credibility. Having been criticized for underestimating inflation in the past, they don't want to cut rates too soon only to have to reverse course if inflation spikes again. By remaining patient and focusing on data, Powell would be protecting the Fed's reputation and ensuring they can react to the economy as it unfolds, rather than being forced into a schedule set by the market
Probable Scenarios and Forward Outlook
Source: Google Gemini
Impact Analysis on US Indices and Broader Markets
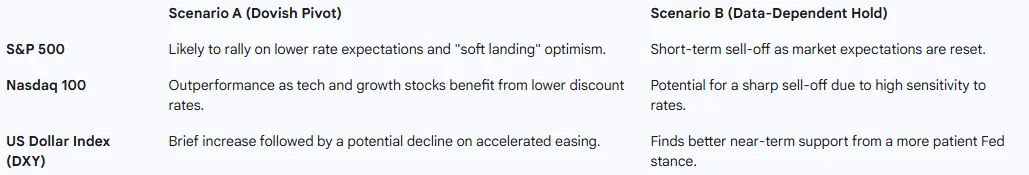
The market's reaction to the FOMC meeting will translate the two primary scenarios into tangible consequences for US indices and other asset classes.
The reaction to a dovish signal would likely be a boon for equities. The S&P 500 would likely rally, driven by the anticipation of lower borrowing costs and a broader "risk-on" sentiment. The Nasdaq 100, composed of technology and growth stocks, would likely outperform due to its higher sensitivity to changes in interest rates.
Conversely, a hawkish signal would be a source of disappointment for "doves," potentially triggering a pullback in US indices as traders unwind their aggressive rate-cut bets. Tech and growth stocks would be particularly vulnerable. The following table summarizes the potential impact on key US indices and the U.S. Dollar Index (DXY) under the two scenarios.
Source: Google Gemini
Since the market is already highly dovish, the disappointment of a cautious Fed is significant. A potential sell-off might be sharp, but it could also be short-lived if the underlying macroeconomic data remains fundamentally sound. A cautious hold today might simply be a delay of an inevitable cut tomorrow. This understanding is critical for long-term investors aiming to distinguish between temporary market volatility and a fundamental shift in economic trajectory.
Tomorrow's meeting promises fireworks regardless of the decision. Volatility will definitely rear its head and the decision could have wider implications for global markets and risk sentiment.
Examining US Bonds and Yield Curve Before FOMC Decision
In case you haven't seen our introduction to bond yields and an explanation on their recent moves, I formally invite you to read it over which may help you to understand some of tomorrow's moves.
Recent movements in Bonds: Why are government bond yields rising so much as of late?
What is the Fed Funds rate and why is the FOMC meeting so big?
Tomorrow, and as-usual for every FOMC meeting, the Federal Reserve will decide whether or not to change its Main policy rate, the Fed Funds, currently locked between 4.25% to 4.50% (Effective Fed Funds is at 4.33%, but that's a technicity).
You will usually see the higher bound of that range represented, which is why you usually hear the "4.50%" rate from US President Trump and media – We will use this rate for the article.
The FOMC is closely watched due to all banks (Central Banks and all others), traders, investors using this rate as the main US Dollar financing rate.
As the Reserve currency, the US Dollar and its supply will have a great influence on global yields, demand and prices.
The current US Treasury Yield Curve
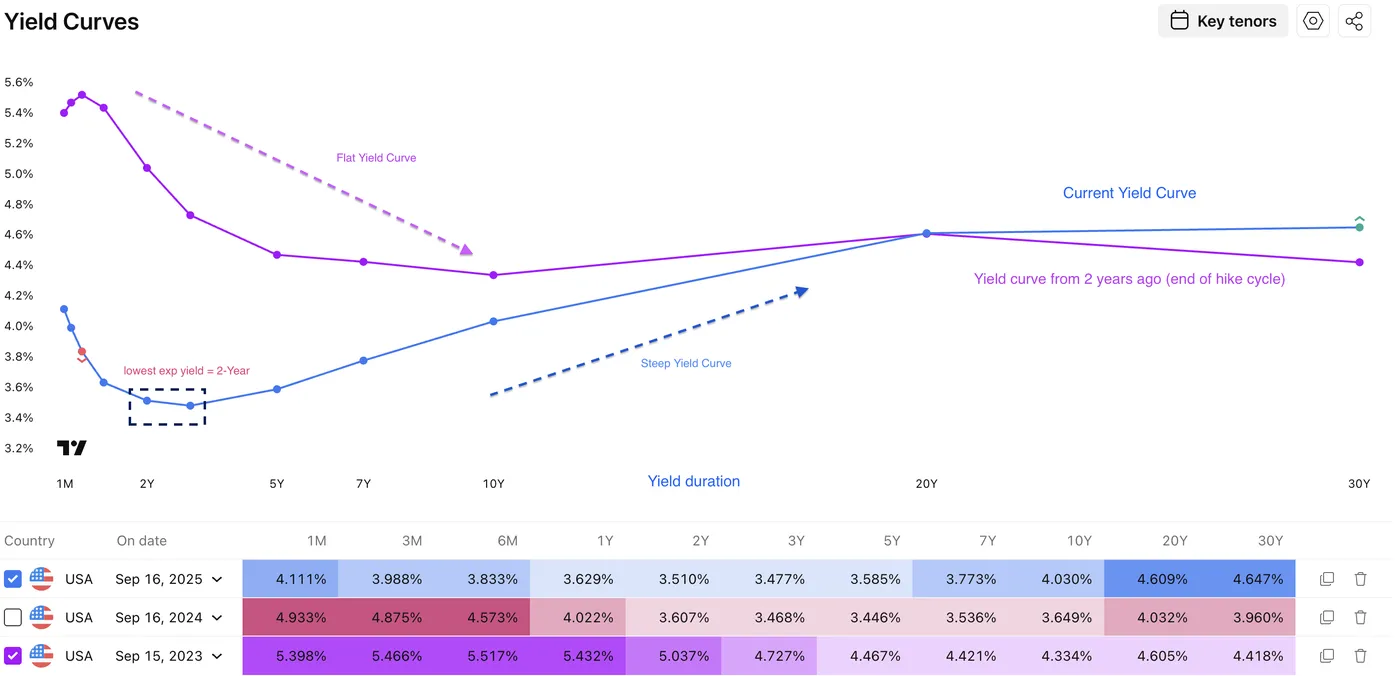
Current vs 2-year ago Yield Curve – Source: TradingView
Small explanation on the yield curve
The current curve (blue) is inverted –compared to a Flattening yield curve in purple– which means that the market expects that the yield on short-term obligations will be lower than on long-term ones.
This is due to lower inflation expectations and a lower time compensation in the short run, compared to higher inflation expectations and higher risk to outstanding debt in the long run.
The 2-Year yield is the closest to expiry and is the best view of where the market expects the Fed Funds rate to be within the next two years.
The same is true for 5-year and longer-term yields, but these also include a time-risk premium (and of course, reflect demand).
This is why, for example, 30-year yields will be tied to longer-run mortgages for consumers, as they tend to reflect longer-term risks for banks to lend.
Also, one of the keys to understanding yields is that the higher the demand (or price), the lower the yield.
Conversely, if fewer people want bonds, they will sell them, causing the yield to go up to attract more demand.
One of the talks and curve pricing since Donald Trump's investiture is how wider deficits steepens the curve even more (pressure for lower short-term rates puts pressure towards higher rates in the long-run).
A jumbo cut tomorrow would hence boost economic activity and markets would hence price higher future inflation.
Current US Yields and change in today's sessions
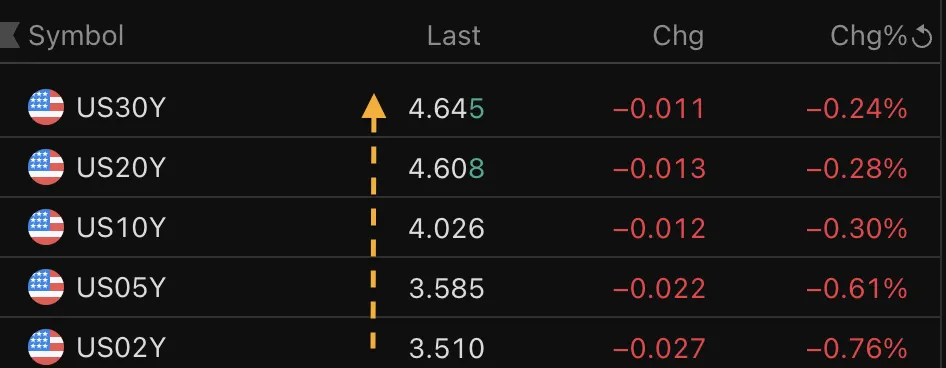
US Yields from the 2Y to 30Y and daily performance – September 16, 2025 – Source: TradingView
As you can see, these yields are showing another form of the blue curve observed just before.
With the current huge selling in the US Dollar, market participants are hedging for an eventual 50 bps which is leading to big steepening in the curve.
When the 2Y Yield decreases more than the 30Y, this is considered Bull steepening: Bond traders bought more the front (short-term bonds) than the back (long-term bonds).
Let's now look at different Bond charts and spot key levels for them.
2 Year US Treasury Bond
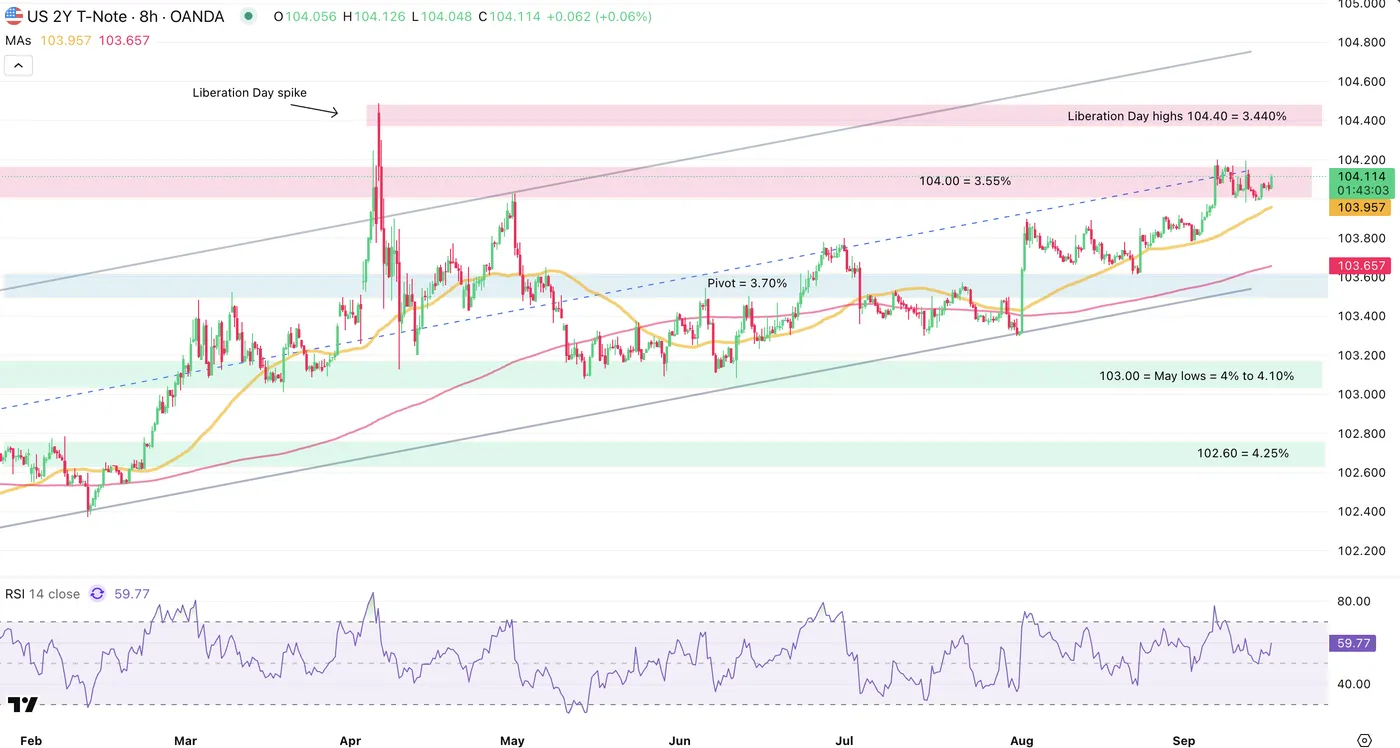
US 2Y Bond, September 16, 2025 – Source: TradingView
10 Year Treasury Bond
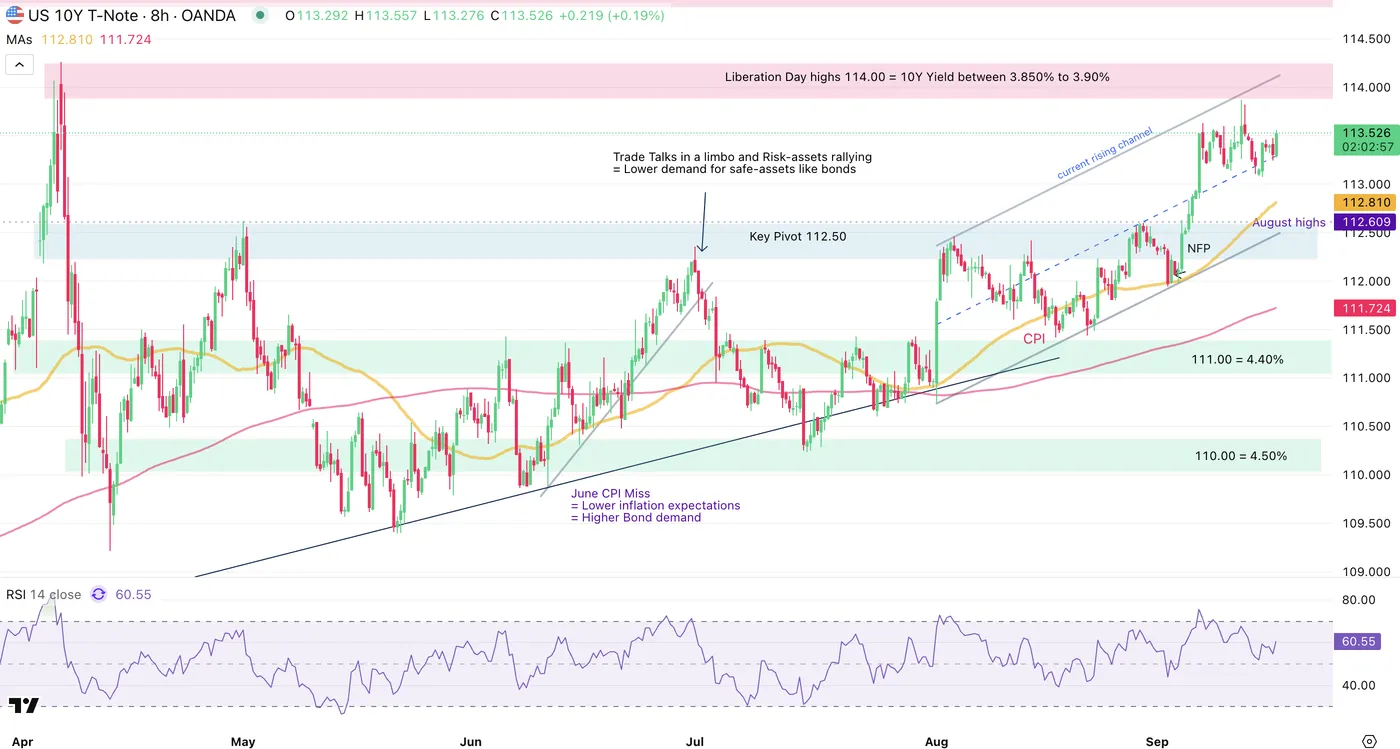
US 10Y Bond, September 16, 2025 – Source: TradingView
This bond is traditionally seen as the benchmark for the safest and most liquid financial product.
Watch a break of the most recent highs (113.86) for further continuation towards the September 2024 highs. You may also check the equivalent Yields on the charts.
Any downside below the Key 112.50 pivot (Yield = 4.25% to 4.30%) should lead to further increase in the yield.
It is extremely difficult to anticipate what will be said in such a key FOMC but all eyes will be on the statement (14:00 ET) and Powell's speech (14:30 ET).
Watch for any clues on potential dovishness from Powell which may add more rates towards the end of 2025 (25 bps for each meeting, 3 meetings left is the current pricing).
Any unexpected hawkishness could have different effects: Either take out rate cuts in 2025 (flattening the curve) or take out 2026 cuts (steepening the curve even more).
Tomorrow will be essential for all assets, currencies and flows for the coming period.
Of course, do not forget the Bank of Canada rate decisions at 9:30 tomorrow morning and the Bank of England rate decision at 7:00 on Thursday 18th.
Safe trades and a successful FOMC session!
FTSE 100 Wave Analysis
FTSE 100: ⬇️ Sell
- FTSE 100 reversed from resistance zone
- Likely to fall to support level 9090.00
FTSE 100 index recently reversed down from the resistance zone between the key resistance level 9330,00 (which stopped the previous wave (3) in the middle of August, as can be seen below) and the upper daily Bollinger Band.
The downward reversal from this resistance zone started the active short-term correction 2.
FTSE 100 index can be expected to fall to the next support level 9090.00, the target for the completion of the wave 2 (low of the previous correction (4)).

EURUSD Wave Analysis
EURUSD: ⬆️ Buy
- EURUSD broke key resistance level 1.1835
- Likely to rise to resistance level 1.2000
EURUSD currency pair recently broke above the key resistance level 1.1835 (which stopped the previous impulse wave (5) at the end of June, as can be seen below).
The breakout of the resistance level 1.1835 was preceded by the breakout of the daily Triangle from July, which accelerated the active impulse wave (3).
Given the clear daily uptrend, EURUSD currency pair can be expected to rise to the next round resistance level 1.2000, target for the completion of the active impulse wave (3).

Gold (XAU/USD) Soars to Breach $3700/oz. FOMC Meeting Next, Will Rally Continue?
Gold prices soar to tap $3700/oz as Fed rate cut bets ramp up. The precious metal continues to benefit from the uncertainty around Fed policy moving forward beyond the September 17 meeting.
The expectations for a rate cut and a dovish Fed moving forward has led to US Dollar weakness and falling US Treasury yields which have aided Gold's rise. The US dollar is getting weaker, with its value falling against other major currencies.
This is because financial markets are now pricing in around 95% probability that the Federal Reserve will cut interest rates by 0.25% and expect a more dovish outlook moving forward.
At the same time, returns on US government bonds are also staying low. This makes assets like gold, which don't pay interest, more attractive to investors because they aren't giving up much in potential earnings by not holding bonds instead
The question for market participants right now is how much further can the gold rally go?
Fed Policy Holds the Key
On Wednesday, the much anticipated Federal Reserve decision will be the main focus for financial markets. It does appear as though a 25bps rate cut has largely been priced in and thus we have seen many analysts talk about the potential of a ‘buy the rumor, sell the fact’ reaction to the rate decision.
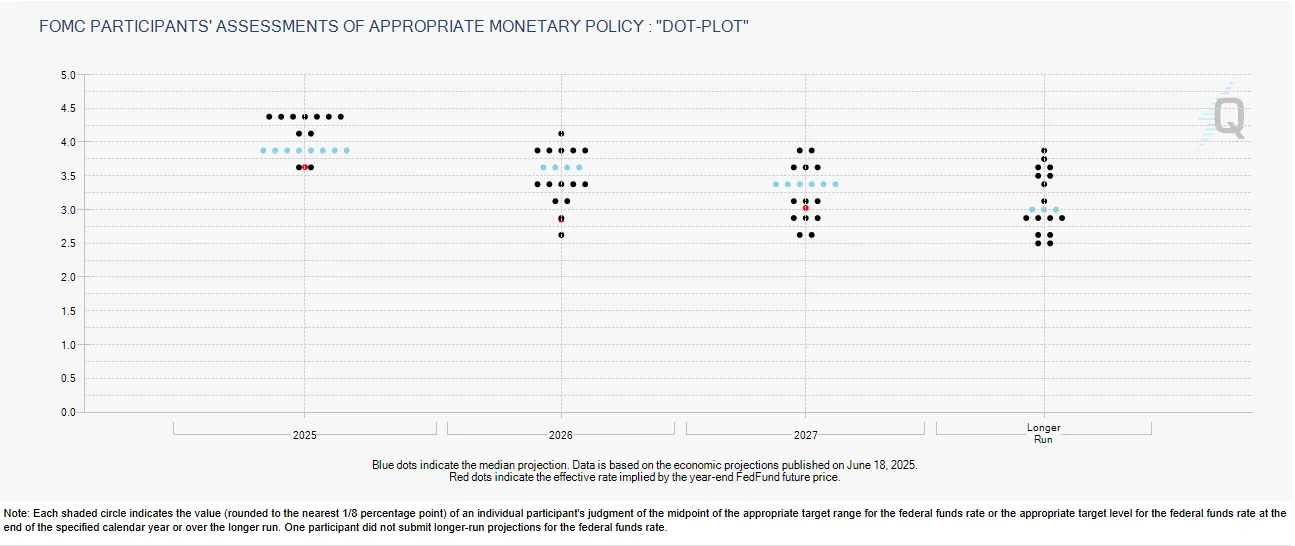
With that in mind, markets may be more focused on the dot plot and how the Fed sees the rate outlook moving forward. The calls by the Trump administration as well as a weakening labor market has seen markets price in more aggressive rate cuts over the next 12 months.
A dovish Fed outlook could fuel the Gold rally and push the precious metal toward the $3800/oz handle. A more hawkish outlook or no changes to the dot plot could see the Gold prices finally drop and pullback toward the $3600/oz handle.
Fed Independence Concerns Linger
The Fed meeting is holding its monetary policy meeting at a difficult time. US President Donald Trump is actively trying to influence their decisions, and there are legal challenges against the Fed's leadership which has led to concerns around Fed independence which is also aiding the Gold rally.
Leading up to the meeting, President Trump has been pressuring Fed Chair Jerome Powell on social media to make a bigger interest rate cut than what is expected. Trump believes that a more significant cut is overdue and would greatly help the housing market.
In a related development, a U.S. appeals court stopped an attempt by President Trump to remove Fed Governor Lisa Cook from her position, ruling that his reasons were not legally sufficient. This means Lisa Cook is expected to participate in Wednesday's important vote.
Additionally, Stephen Miran, a key economic advisor to President Trump, was narrowly confirmed by the Senate to join the Federal Reserve Board. Analysts believe that Miran might push for a larger interest rate cut than what most people expect, which keeps the question about how much political influence might affect the Fed's decisions.
Other Factors Supporting Gold Prices
Gold is receiving an extra boost from heightened global tensions, which are pushing investors toward safe-haven assets.
This increase in geopolitical risk is primarily driven by two major developments: an escalation of the conflict between Israel and Hamas, as Israel launched a significant ground offensive in Gaza City on Tuesday, and an intensification of drone and missile strikes by Ukraine on Russian refineries, which is disrupting Russia's energy infrastructure.
Economic Calendar
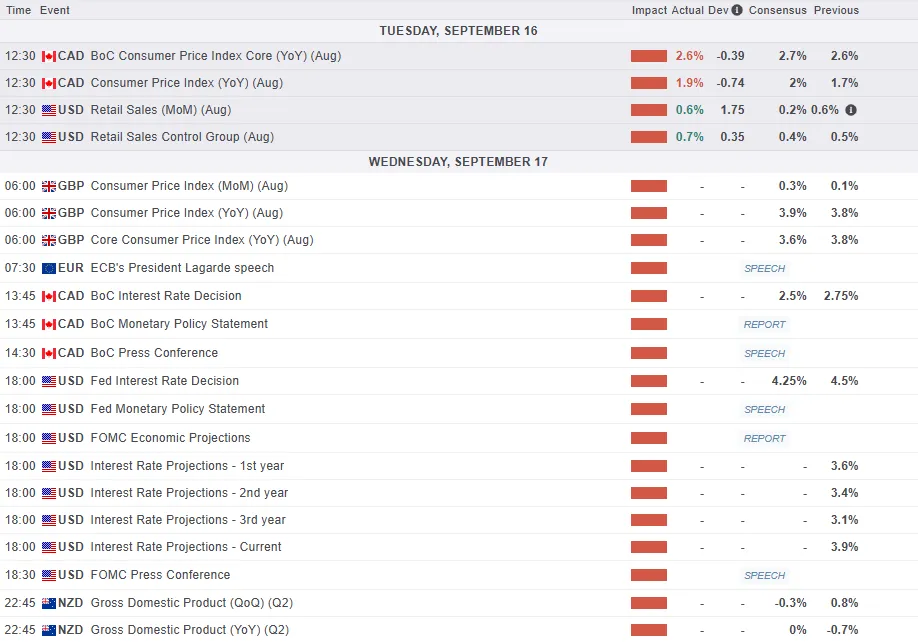
For all market-moving economic releases and events, see the MarketPulse Economic Calendar. (click to enlarge)
Technical Analysis - Gold (XAU/USD)
From a technical standpoint, Gold broke out of the bull flag pattern on a four-hour timeframe before rallying to its potential target around the $3700/oz handle.
We are seeing a pullback since then with the latest four hour candle closing as a hanging man, which hints at further downside.
Given the rally this week, we could see a bit of a pullback as some market participants may look to take profit ahead of the FOMC meeting.
The period-14 RSI is also in overbought territory. A break back below the 70 level on the RSI usually signals a shift in momentum and could lead to a short-term push lower.
However, we have seen similar attempts at a pullback since the backend of last week and each time buyers returned with conviction to print fresh highs.
Thus there is a possibility that this could continue heading into the US Fed rate decision.
Gold (XAU/USD) Four-Hour Chart, September 16, 2025
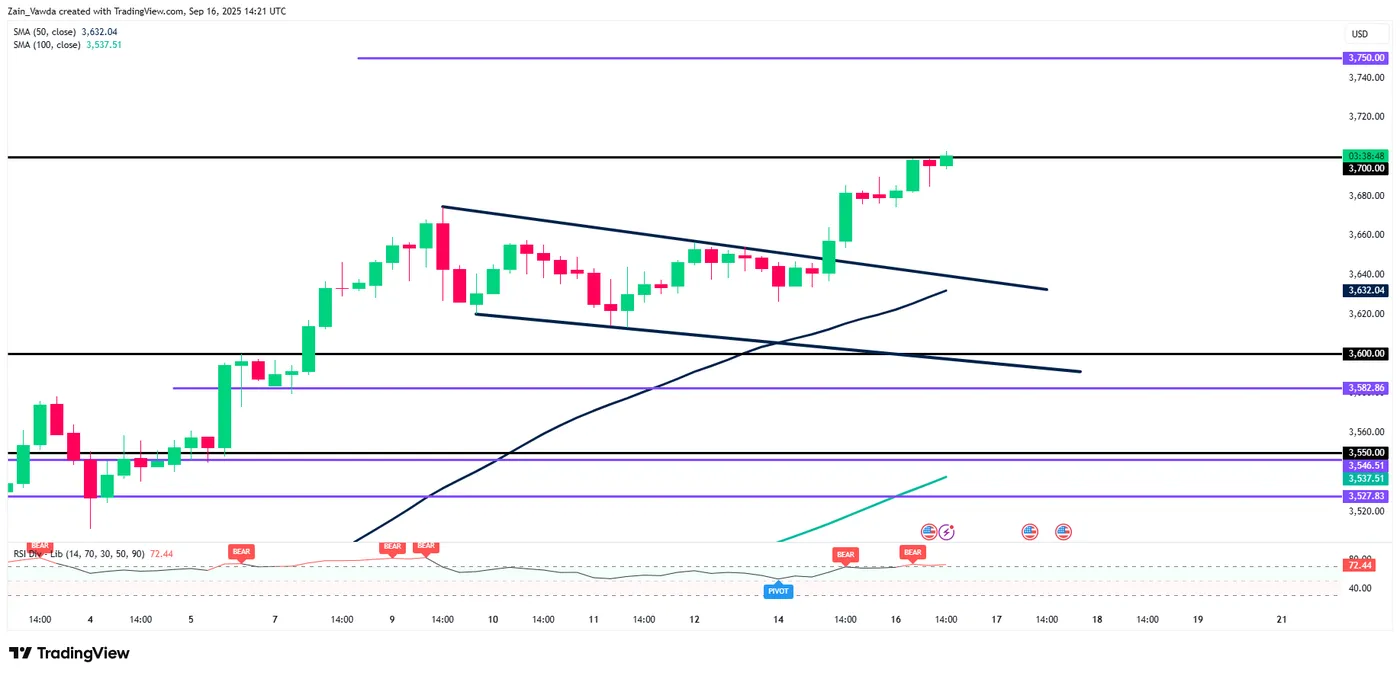
Source: TradingView (click to enlarge)
Swiss Franc Leads Majors as US Session Begins and Reclaims 2025 Crown
European currencies are having a fantastic year, with the CHF, the Euro, and GBP achieving their best performance since the early 2000s.
With US President Trump doing everything he can to devalue the US dollar (tariffs, beefs with other countries, menacing the Fed's Independence, and Jerome Powell), and on the other side of the Atlantic, EU countries allying to boost productivity in the years to come, the conditions for such outperformance are optimal.
Regarding basic economics, one thing to watch for Europe and Switzerland could be a too-strong currency, which would impair exports in an already-cooling economy (and crippled with 39% tariffs with the US).
In fact, Switzerland has been in deflation since May 2025. While its economy continues to grow slowly, such economic activity is not expected to hold up much given the recent SNB dovishness.
In the current state of geopolitics, participants looking for safety have had enough of a yen that loses too much in Carry due to historically low rates and have come back to the Swissie in search of value amid a less-competitive dollar.
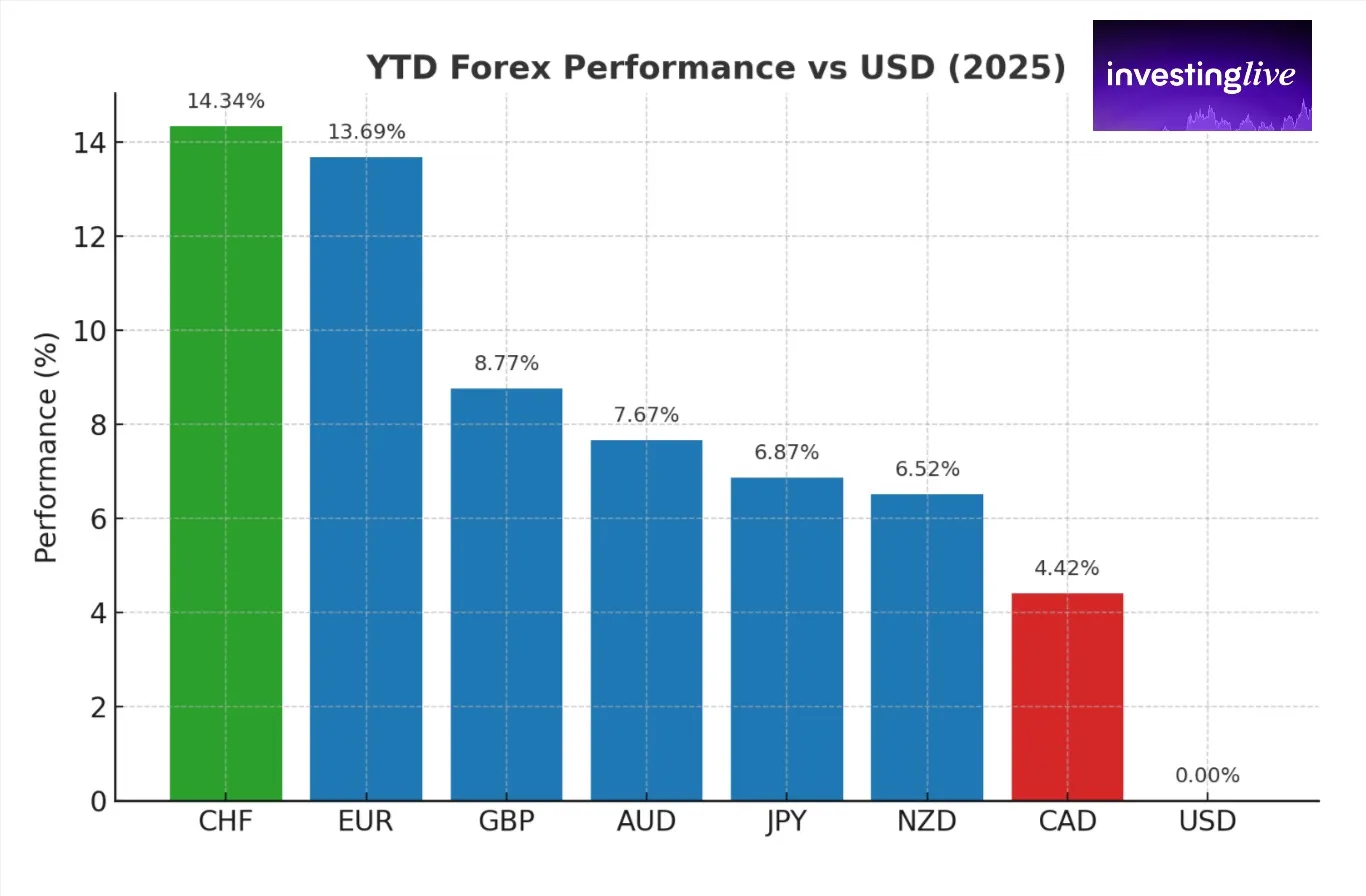
2025 Currency Performance, September 16, 2025 – Source: InvestingLive.com
This nice graph offered by InvestingLive depicts how strong the geographic trends (mentioned through many of our previous pieces) guide Forex performance.
European currencies are leading with the new shift in narrative, followed by APAC (JPY, NZD and AUD) and finally North-American currencies which have struggled quite a lot.
Tomorrow should be interesting as traders really are pre-selling the US Dollar in what seems to be rushed-hedges for a dovish FOMC.
Any hawkishness or even a more neutral than dovish tone, and/or mentioning of tariff uncertainty should lead to consequent mean-reversion for the USD.
More mentions towards labor market weakness and one time tariff price hikes would be confirming the USD down-move.
Up about 0.50% as we speak, let's have a look at USDCHF multi-timeframe charts to gain our edge on potential reversal or continuation levels for the pair.
USDCHF multi-timeframe analysis ahead of the FOMC
USDCHF Daily chart
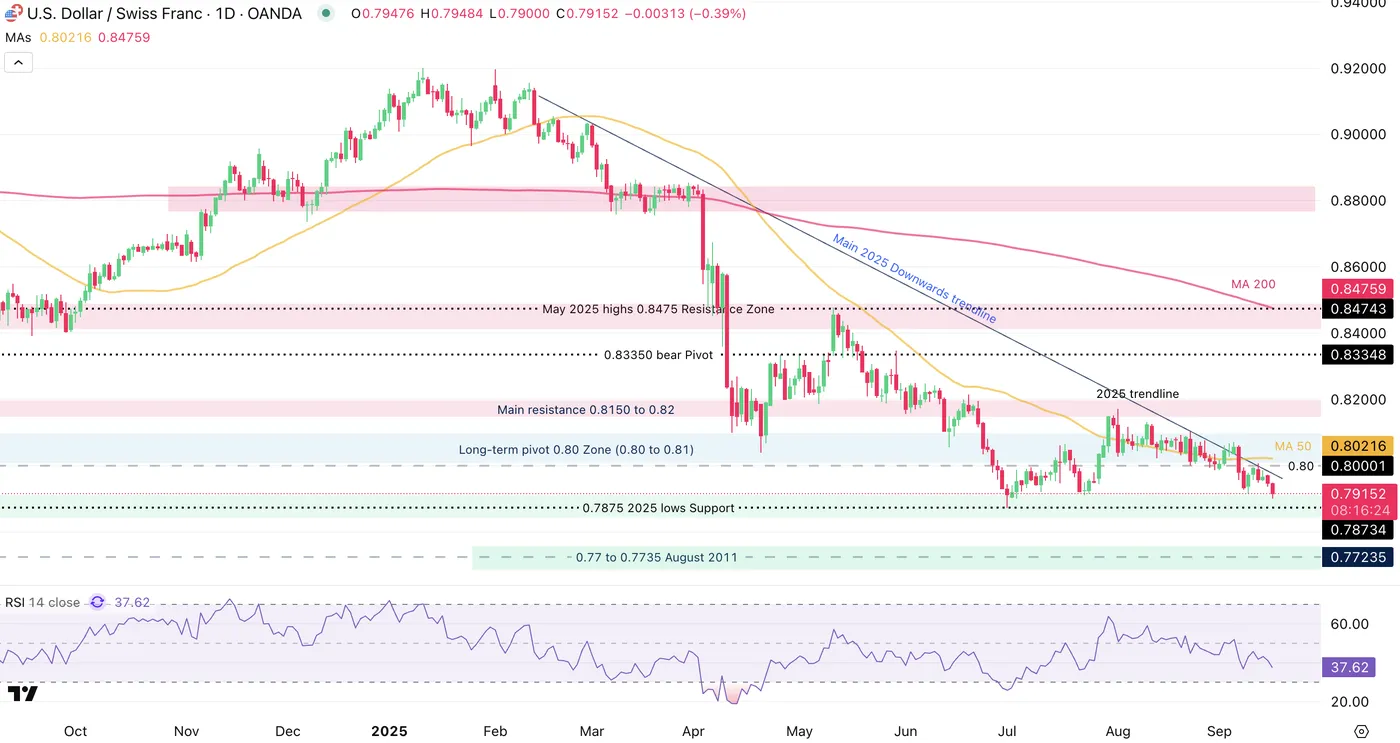
USDCHF Daily Chart, September 16, 2026 – Source: TradingView
Despite a strong rebound in the USD in July followed by a monthly consolidation in August, the selling in CHFUSD has started to accelerate since the September NFP release, breaching 0.80 psychological level.
The first time the level was breached in 2025 was in mid-June, when Powell testified. Early July consequently saw a huge reversal higher in the pair.
The breakdown has happened on a few strong bear bars and bears should soon face the 2025 0.7875 Lows support, with prices entering that region.
Daily RSI still has place for movement and is not showing signs of upward tilt – However, one cannot forget that things may change in a flash in tomorrow's FOMC announcement.
USDCHF 4H Chart
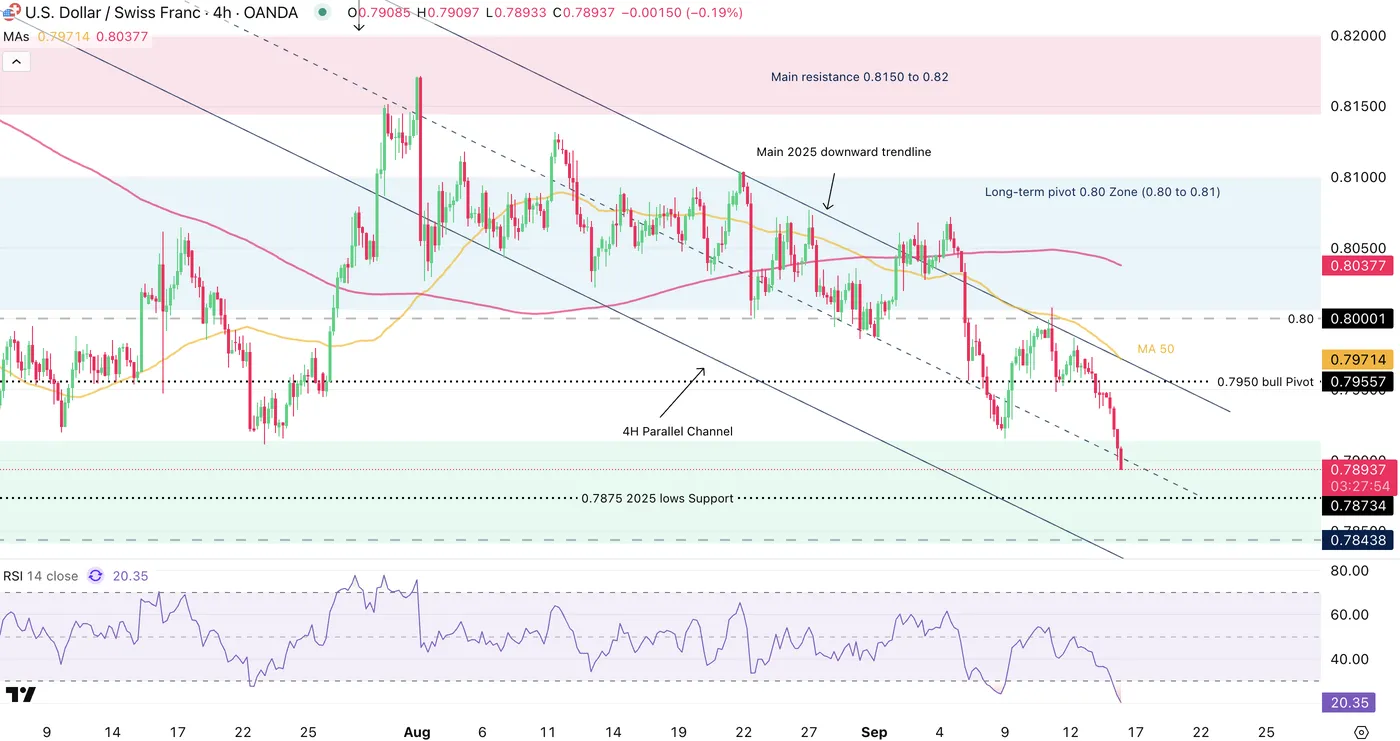
USDCHF 4H Chart, September 16, 2026 – Source: TradingView
The ongoing price action is a solid tight bear channel, with traders rushing to exit and hedge their positions before tomorrow's huge trading Session.
Reactions will be interesting as this morning saw another rejection of the 50-period MA at the conjunction of the 2025 downward trendline, which led a huge descent in prices.
USDCHF is now trading around the middle of a freshly formed channel (with the 2025 downtrend) and with oversold RSI conditions, it will be interesting to spot what traders look to do looking forward.
Trading Levels for USDCHF
Daily Resistance Levels
- 0.7970 MA 50
- 0.80 psychological level
- Long-term pivot 0.80 Zone (0.80 to 0.81)
- Main resistance 0.8150 to 0.82 (last highs 0.8165)
- May 2025 highs 0.8475 Resistance Zone
Daily Support Levels
- 0.7890 current daily lows and counting (and middle of downward channel)
- 0.7840 to 0.7875 2025 lows
- 0.77 to 0.7735 August 2011 lows
USDCHF 1H Chart
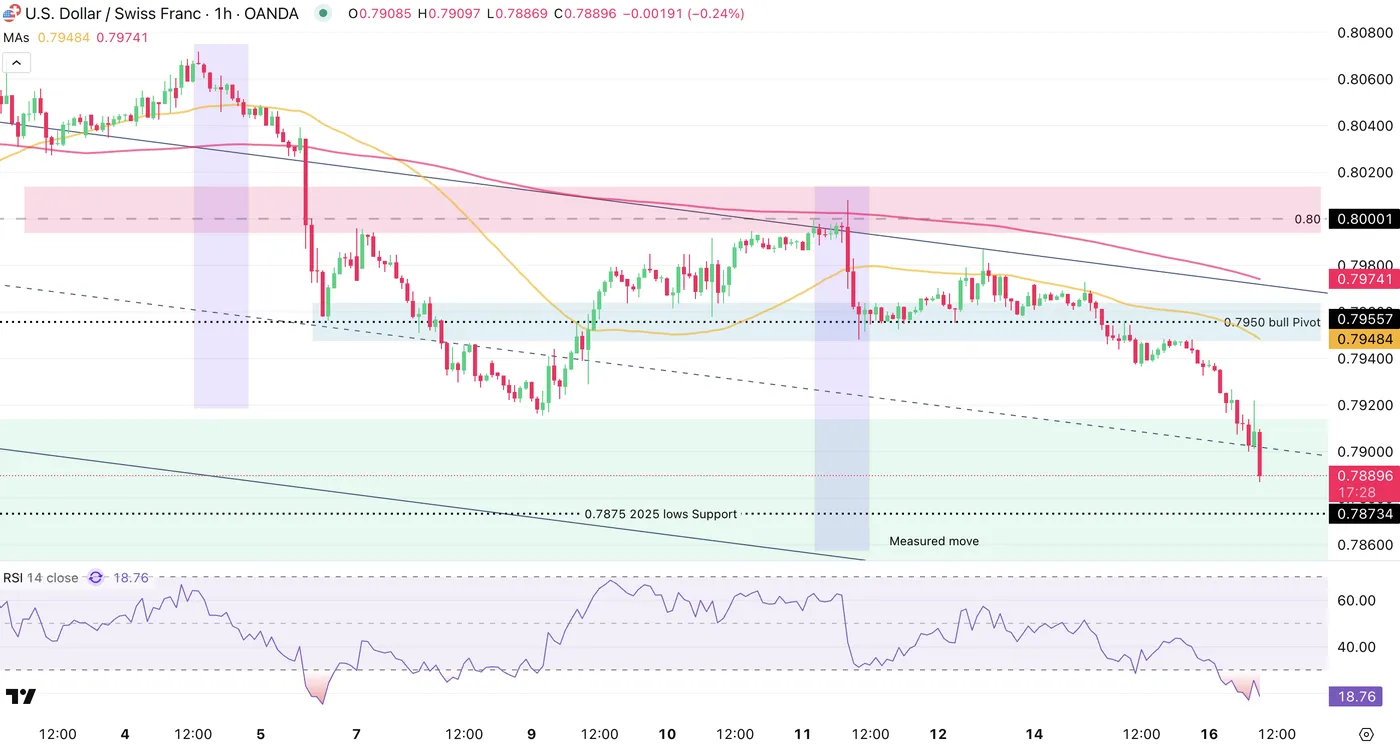
USDCHF 1H Chart, September 16, 2026 – Source: TradingView
A measured move would place the pair to new lows in 2025 as the imminent selling accelerates after the Retail Sales data.
On the other hand, watch for the way oversold levels – The tight bull channel is expected to hold as long as no bull candle closes above the previous one, so sellers are tightly in control for now.
Watch price action in any close above the 0.7950 short-term pivot zone and any potential acceleration above 0.80. If the current trend continues, look at the 2011 support levels.
Safe Trades and successful trading ahead of the FOMC!
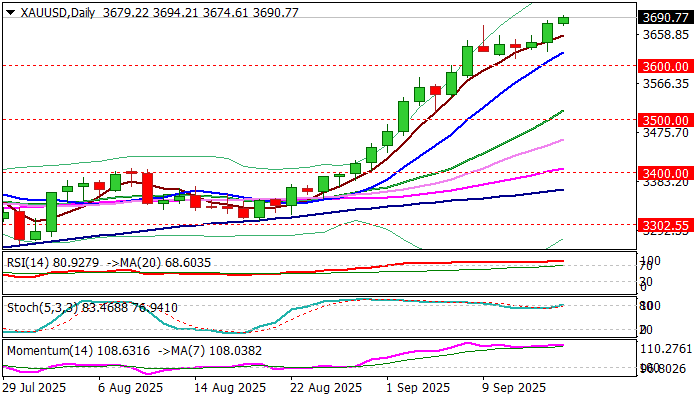
Gold Hits New Record High on Weaker Dollar / Fed Rate Cut Expectation
Gold rose to new record highs in late Monday / early Tuesday trading, as bulls regained traction after a narrow consolidation in past four days.
Fresh weakness of US dollar ahead of Wednesday’s Fed rate decision, in which the central bank is widely expected to cut rate by 25 basis points (there is also a small chance for possible 50 basis points rate cut) provided fresh boost to the yellow metal’s price, in addition to deepening political crisis in the US and some EU countries, as well as signals of worsening geopolitical situation.
With rate cut being almost fully priced in, markets await to hear about Fed’s guidance for the near future, with growing hopes that the central bank will remain in a dovish mode that would provide further support for gold.
Psychological $3700 level is under increased pressure, with break here to expose next target at 3734 (Fibo 138.2% projection).
Bulls so far don’t react on overbought daily studies, but some consolidation / shallow correction should be expected in the near term, if current fundamentals remain unchanged.
Res: 3700; 3734; 3750; 3789
Sup: 3674; 3624; 3600; 3577