
Sample Category Title
US PPI surges 0.9% mom in July, undermining case for aggressive Fed easing
US producer prices surged in July, with final demand PPI jumping 0.9% mom, far exceeding expectations of a 0.2% rise and marking the sharpest monthly gain since mid-2022.
The increase was broad-based, with over three-quarters driven by final demand services, which climbed 1.1% mom, while goods prices rose 0.7% mom. The core measure excluding food, energy, and trade services climbed 0.6% mom, the largest increase since March 2022.
On an annual basis, headline PPI accelerated from 2.4% to 3.3% yoy, well above the 2.5% yoy forecast and the highest since February. PPI excluding food, energy, and trade services rose to 2.8% yoy.
The data may temper market enthusiasm for an aggressive September Fed rate cut, despite political pressure and calls from Treasury Secretary Bessent for a 50 bps move.

GBP/JPY Rally Falters Near 200.00
- GBP/JPY stalls weekly rally near 200 level on Bessent’s BoJ criticism.
- Long-term range intact; more sellers waiting below 20-day SMA.
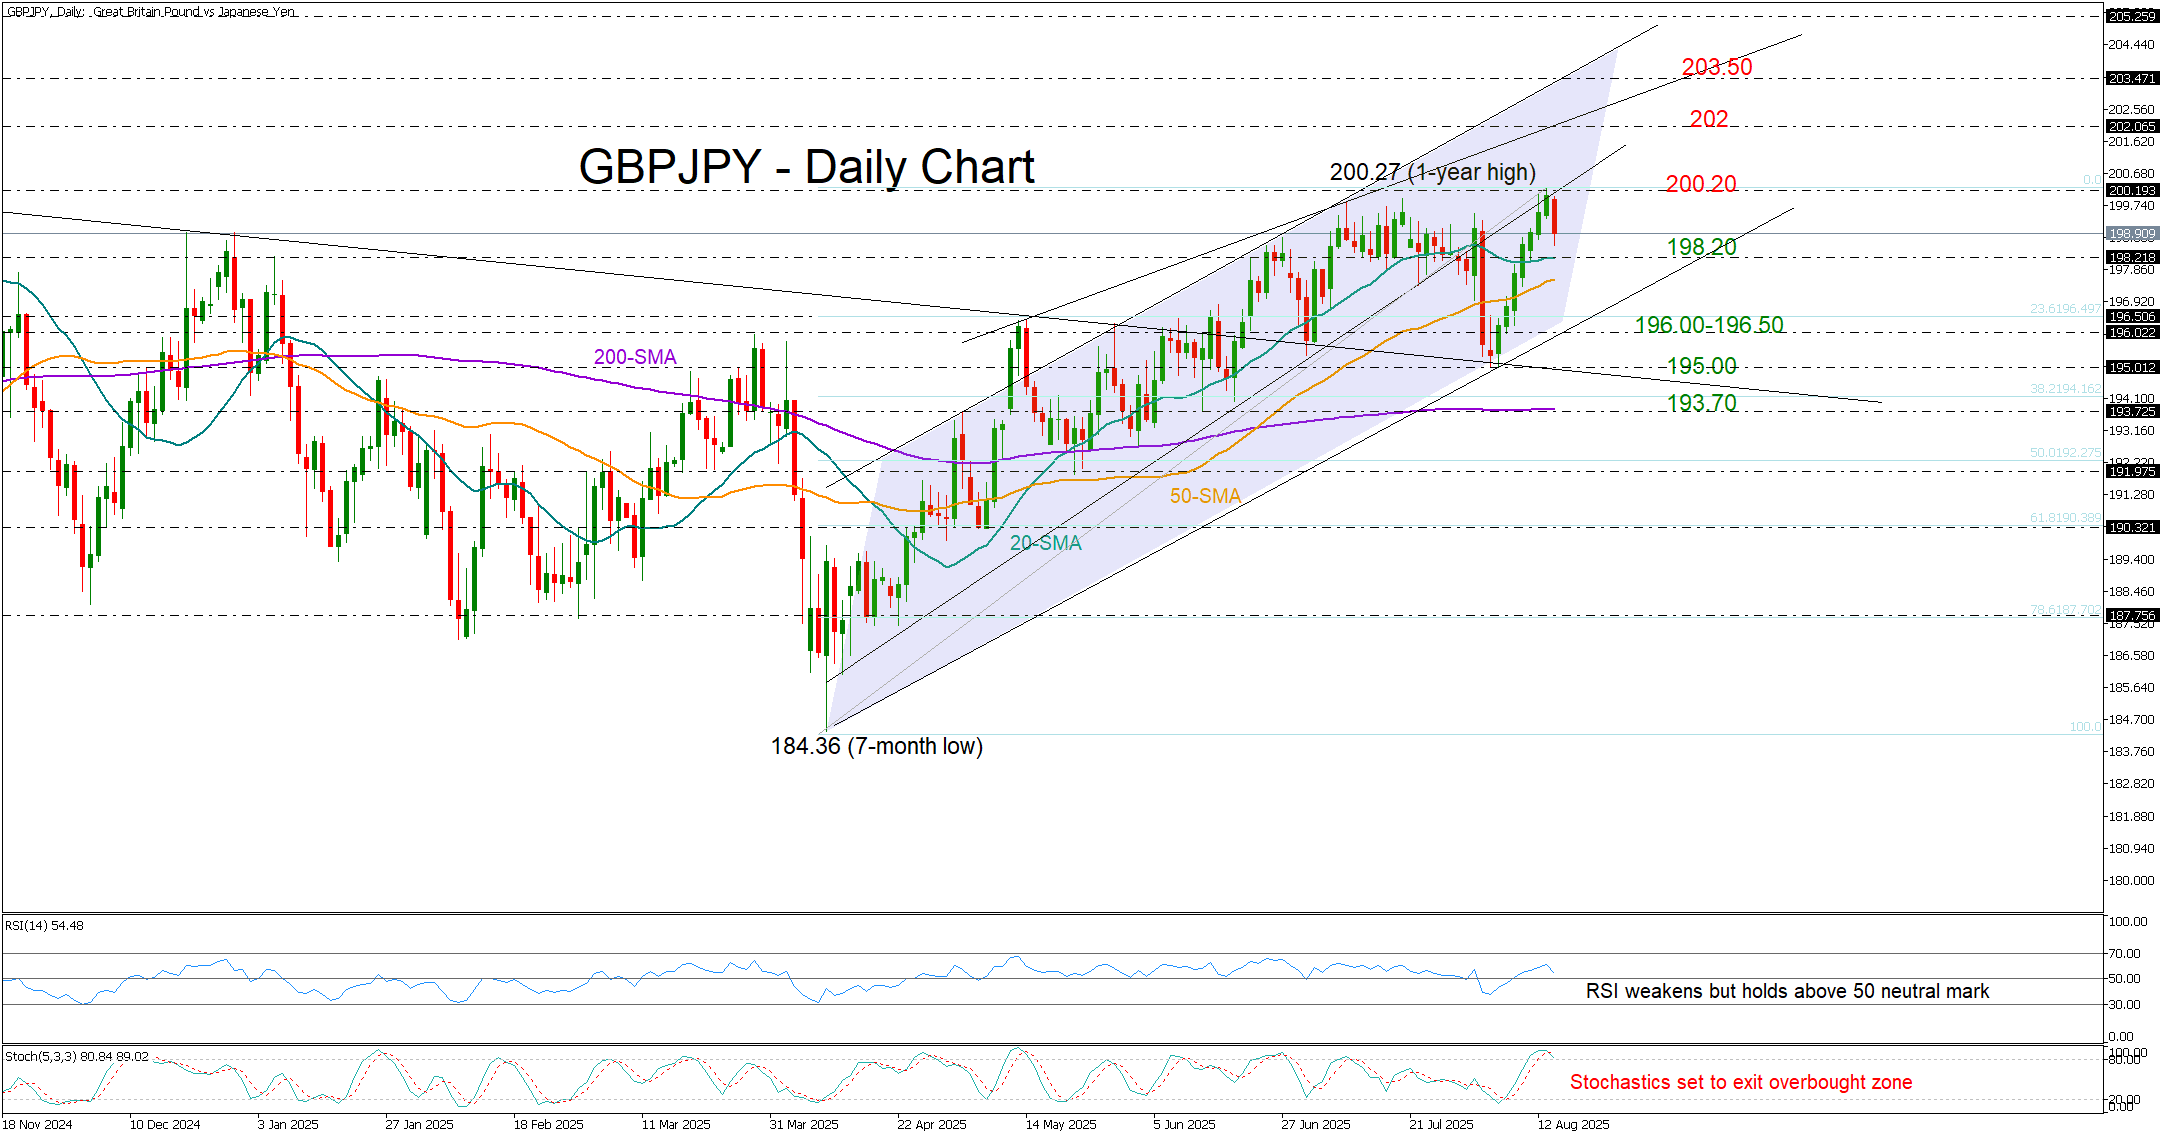
GBP/JPY turned red after seven consecutive green days as the yen recouped some ground following comments from the US Treasury Secretary Steve Bessent, who criticized the Bank of Japan’s stance on inflation, calling for higher interest rates. A historic make-or-break meeting between the US and Russian leaders on Friday may have shifted some funds towards the safe-haven yen too.
Technically, the pullback emerged near the 200 psychological level and the top of a long-term range in place since October 2024, which also capped gains in July. This raises the risk of a retracement in the coming sessions, particularly as the stochastic oscillator is turning lower.
However, the RSI remains comfortably above its 50 neutral level, suggesting that the bears may not gain full control unless the 20-day simple moving average (SMA) at 198.20 breaks. A drop below that point could stretch towards the tentative support trendline seen at 196.00-196.50. Additional weakness from there could re-test August’s low near 195.00, before signaling a potential bearish trend reversal and bringing the 200-day SMA at 193.70 into view.
If buyers regain momentum and push the price back above the one-year high of 200.27, the next resistance could appear around 202, followed by the 203.50 barrier.
In summary, GBP/JPY could enter a corrective phase after a weekly rally to a fresh one-year high. The next bearish leg may unfold if the price falls below the 20-day SMA at 198.20.
Trump’s Pressure Mounts. Fed Cornered. Will Dollar Weaken Further?
- US CPI for July in line with expectations – headline +0.2% m/m, core +0.3% m/m; annual rates at 2.7% and 3.1% respectively.
- Wall Street rallies, dollar softens – major indices post solid gains, US Treasury yields fall; markets almost fully price a 25bp Fed cut in September.
- No signs of tariff-driven inflation – businesses still absorbing higher costs in margins, with demand constraints limiting price hikes.
- Trump steps up pressure on the Fed – calls for swift rate cuts, threatens to sue Powell; growing number of FOMC members favour a more dovish stance.
- EUR/USD uptrend intact – next target at 1.18, with a break above opening the way towards 1.20–1.23.
Market reaction to inflation data – Wall Street rallies, dollar softens
July’s US inflation data came in line with expectations for headline CPI and slightly higher on the core measure, but markets interpreted the release as supportive of a more accommodative Federal Reserve. On 12 August, Wall Street indices closed the session with notable gains, reflecting increased investor optimism over the economic outlook and interest rate prospects. The US dollar weakened against major currencies, while US Treasury yields declined. Fed Funds Futures almost fully priced in a 25bp rate cut in September, with markets also increasing bets on further easing before year-end.
The Fed’s dual mandate is shifting further towards prioritising maximum employment, a stance echoed by a growing number of Federal Open Market Committee (FOMC) members. The upcoming Jackson Hole symposium, due at the end of next week, will offer Chair Jerome Powell an opportunity to adjust the policy narrative. Historically, the Central Bankers’ Symposium in the Rocky Mountains has often marked turning points in US monetary policy.
Slower consumer price growth
In July 2025, headline CPI rose by 0.2% m/m compared with 0.3% in June, while the annual rate held steady at 2.7%, in line with forecasts. Core inflation edged up to 0.3% m/m and 3.1% y/y from 0.2% and 2.9% respectively, modestly exceeding expectations on the yearly reading.
Price breakdown – energy falls, food flat
Energy prices fell by 1.1% m/m, while food prices were unchanged. In core goods (excluding vehicles), price growth slowed to +0.2% m/m from +0.55% in June. Increases were seen in furniture (+0.9%), used cars (+0.5%), sporting goods (+0.4%) and clothing (+0.1%). Household appliance prices unexpectedly declined by 0.9%.
Seasonal gains in services
Airfares rose by 4% m/m, while medical services costs increased by 0.7%, largely due to dental services. Shelter costs rose only modestly, by 0.2%.
No tariff-driven inflation pressure
The absence of signs of rising inflationary pressure following President Trump’s tariff measures suggests that businesses are absorbing higher costs in their margins rather than passing them on to consumers. This is supported by the latest NFIB survey, which showed the share of small firms planning price hikes in the next three months falling to 28% from 32%, pointing to demand-side constraints.
Inflation and Fed policy outlook
Analysts see little risk of inflation breaching 4% y/y this autumn, with growing odds of a decline below 2% by the end of 2026. The data reinforce expectations for a 25bp Fed rate cut in September, followed by another in December. Fed Funds Futures are currently pricing in 26bp of easing at the 17 September FOMC meeting and a total of 63bp by year-end.
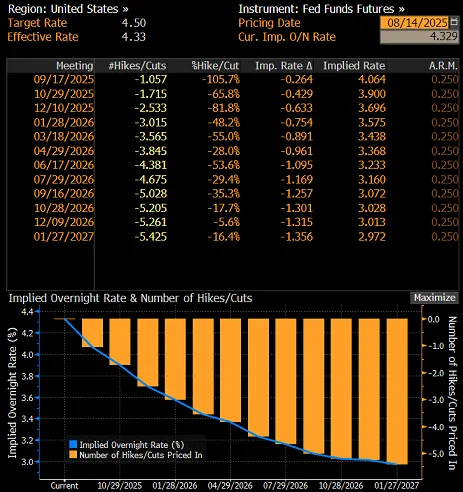
Market pricing of the US interest rate path based on Fed Funds Futures, source: Bloomberg
Trump steps up pressure on Powell
President Donald Trump has intensified his calls for swift rate cuts, even suggesting he might sue Fed Chair Jerome Powell, accusing him of incompetence in overseeing building renovations at the central bank.
FOMC members’ comments
Thomas Barkin noted that the balance of risks for the labour market and inflation remains unclear, and that the Fed is well positioned to respond appropriately. Stephen Miran, a new Board Governor appointed by Trump, stated that there is no evidence of tariff-driven inflation, adding that rent increases are partly linked to illegal immigration. Jeff Schmid argued that while growth remains solid, inflation is still too high, warranting a moderately restrictive stance. He added, however, that he would be prepared to change his view should demand weaken materially.
What next for the dollar?
In the week ending 5 August, net short USD positions fell sharply by $4.3bn – the fourth consecutive weekly reduction. The net short now stands at $7bn, down from a local peak of $18.6bn in early July.
It is worth noting that these figures are lagging indicators and do not yet reflect the most recent moves in FX markets. The unwinding of short positions was visible in EUR/USD’s July pullback, although the latest disappointing non-farm payrolls data reignited selling pressure on the dollar. The uptrend in the pair remains technically intact, and August’s inflation figures have only strengthened the likelihood of further gains. The next upside target for EUR/USD is 1.18, with a break above this level opening the way towards 1.20–1.23.
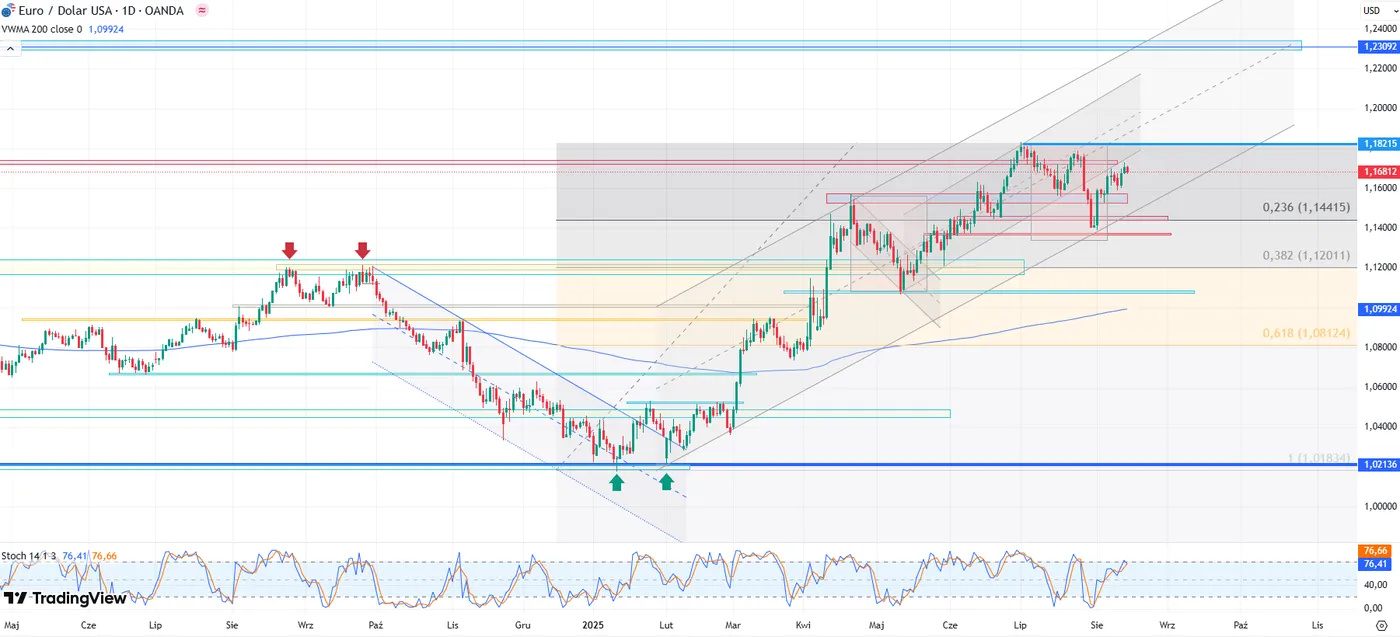
Chart of the main currency pair EUR/USD, daily data, source: TradingView
USD/JPY Technical: Further Potential Drop Towards Ascending Range Support
The emergence of the Japanese yen’s strength has materialized as expected that saw the USD/JPY recording a week-to-date drop of -0.9% at this time of writing and breaking below the first support of 146.60 highlighted in our previous report (printed an intraday low of 146.21 on Thursday, 14 August).
Dovish Fed Funds rate futures pricing triggered by US Treasury Secretary‘s jawboning
The recent bout of Japanese yen strength has been yesterday’s jawboning by a key US White House official, the US Treasury Secretary Bessent, during a prime-time television interview, urging the US Federal Reserve to be more dovish, and suggested cutting interest rates by 150 basis points (bps) or more, starting with a 50 bps in the upcoming September FOMC meeting.
Based on the latest data from the CME FedWatch tool, the Fed Funds futures market has now started to price in a possibility of a 52% chance for a third Fed rate cut of 25 bps to occur on the last FOMC meeting of 2025 on 12 December to bring the Fed funds rate lower to 3.75%-3.5%, up from an earlier expectation of 2 rate cuts before Bessent’s media interview.
Let’s decipher the latest technical developments in the USD/JPY and update its short-term directional bias (1 to 3 days) from a technical analysis perspective.
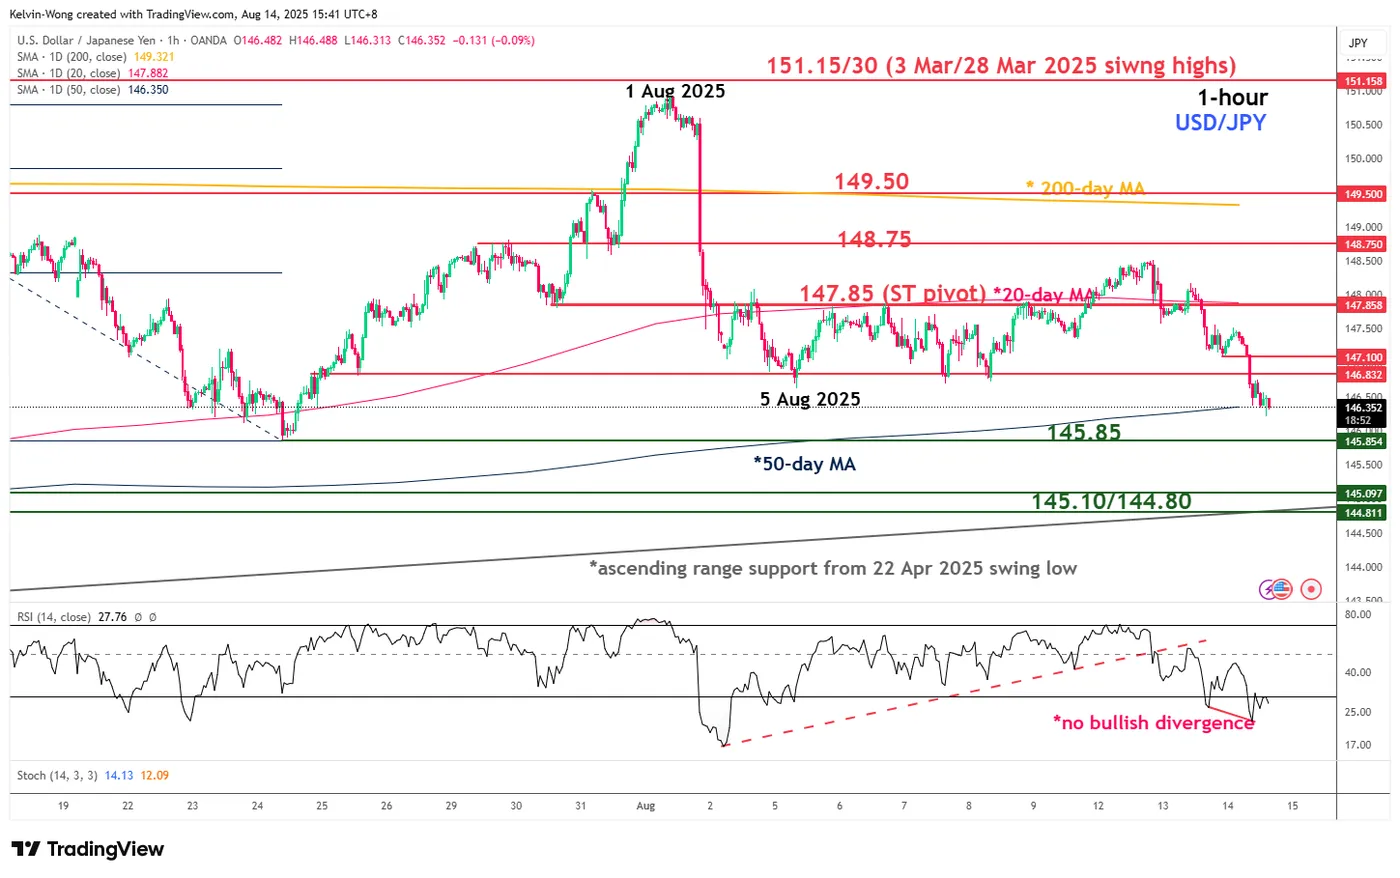
Fig. 1: USD/JPY minor trend as of 14 Aug 2025 (Source: TradingView)
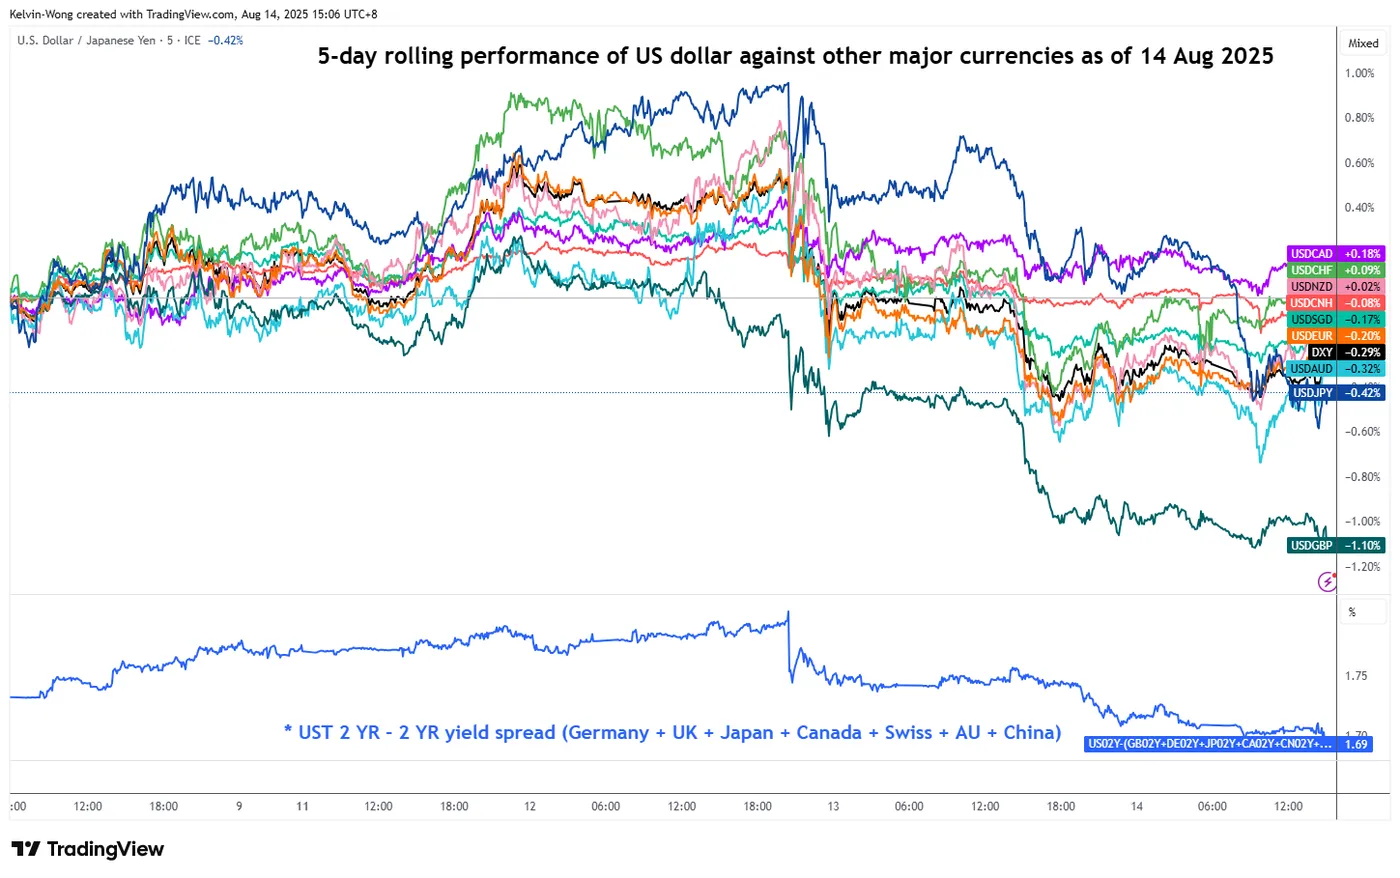
Fig. 2: 5-day rolling performances of the US dollar against major currencies as of 14 Aug 2025 (Source: TradingView)
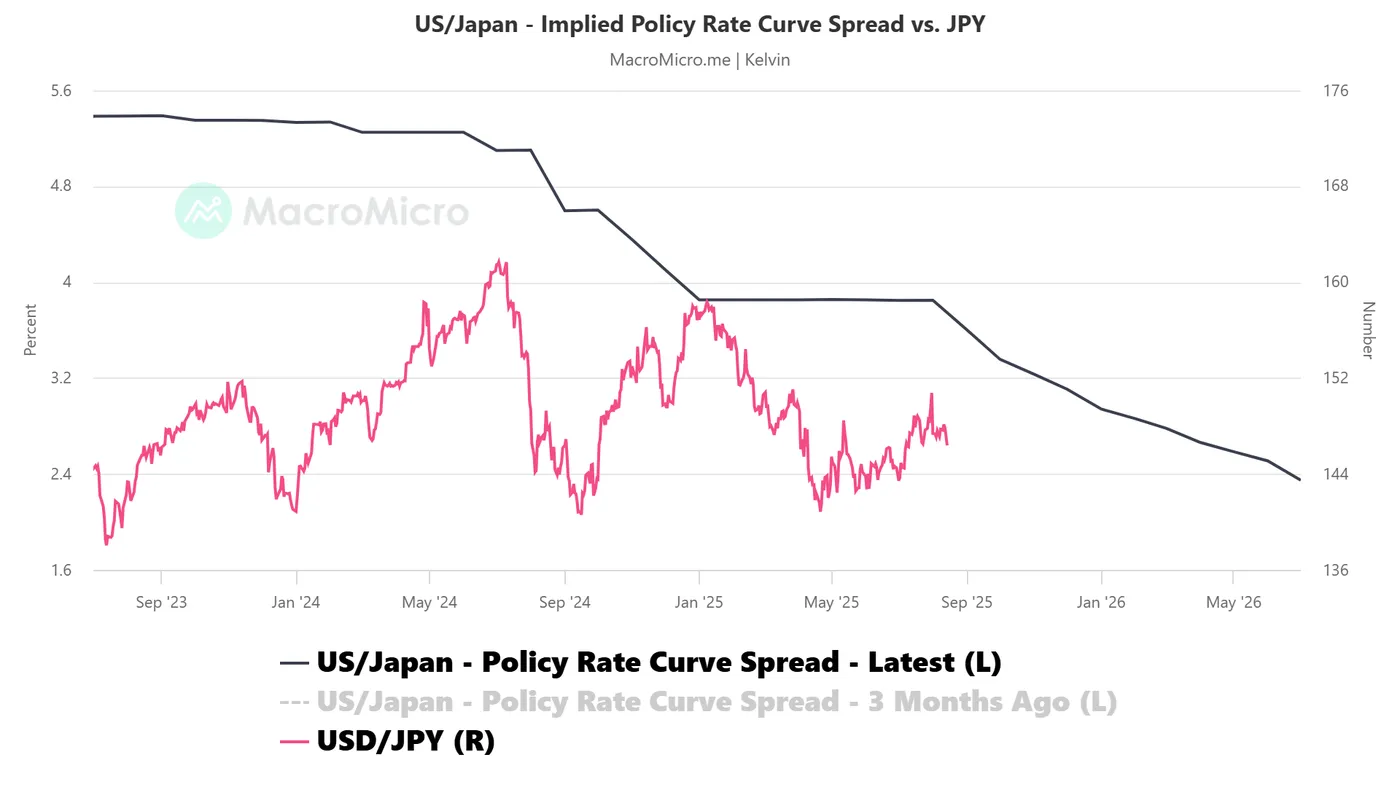
Fig. 3: US/Japan implied short-term interest rate curve with USD/JPY as of 13 Aug 2025 (Source: MacroMicro)
Preferred trend bias (1-3 days)
Maintain bearish bias in any bounces for the USD/JPY with key short-term pivotal resistance at 147.85 (also the 20-day moving average), with next supports coming in at 145.85 and 145.10/144.80 (also the key medium-term ascending range support in place since 22 April 2025 low) (see Fig. 1).
Key elements
- The hourly RSI momentum indicator of the USD/JPY has dipped into the oversold region (below the 30 level) but has not flashed any bullish divergence condition. These observations suggest a potential imminent minor bounce on the USD/JPY rather than a steeper mean reversion rebound.
- In the past four weeks, the Japanese yen has lagged other major currencies in terms of relative performance against the greenback. Based on the five-day rolling performance as of Thursday, 14 August, the US dollar is now performing the second-worst against the Japanese yen; the USD/JPY has recorded a loss of -0.4%, below the US Dollar Index (-0.1%) (see Fig. 2).
- The monthly implied short-term interest rate spread (via short-term interest rate futures) between the US and Japan has continued to narrow in the next three months from 3.85% in August to 3.60% in September to 3.36% in October, and to 3.23% in November. This narrowing of the US/Japan implied short-term interest rate spread is likely to put downside pressure on the USD/JPY (see Fig. 3).
Alternative trend bias (1 to 3 days)
A clearance above 147.85 invalidates the bearish scenario and sees a squeeze up towards the upper limit of the medium-term ascending range configuration for the next intermediate resistances to come in at 148.75 and 149.50 (also the key 200-day moving average).
Bitcoin Hit New Highs But Then Dropped Back Down
Market Overview
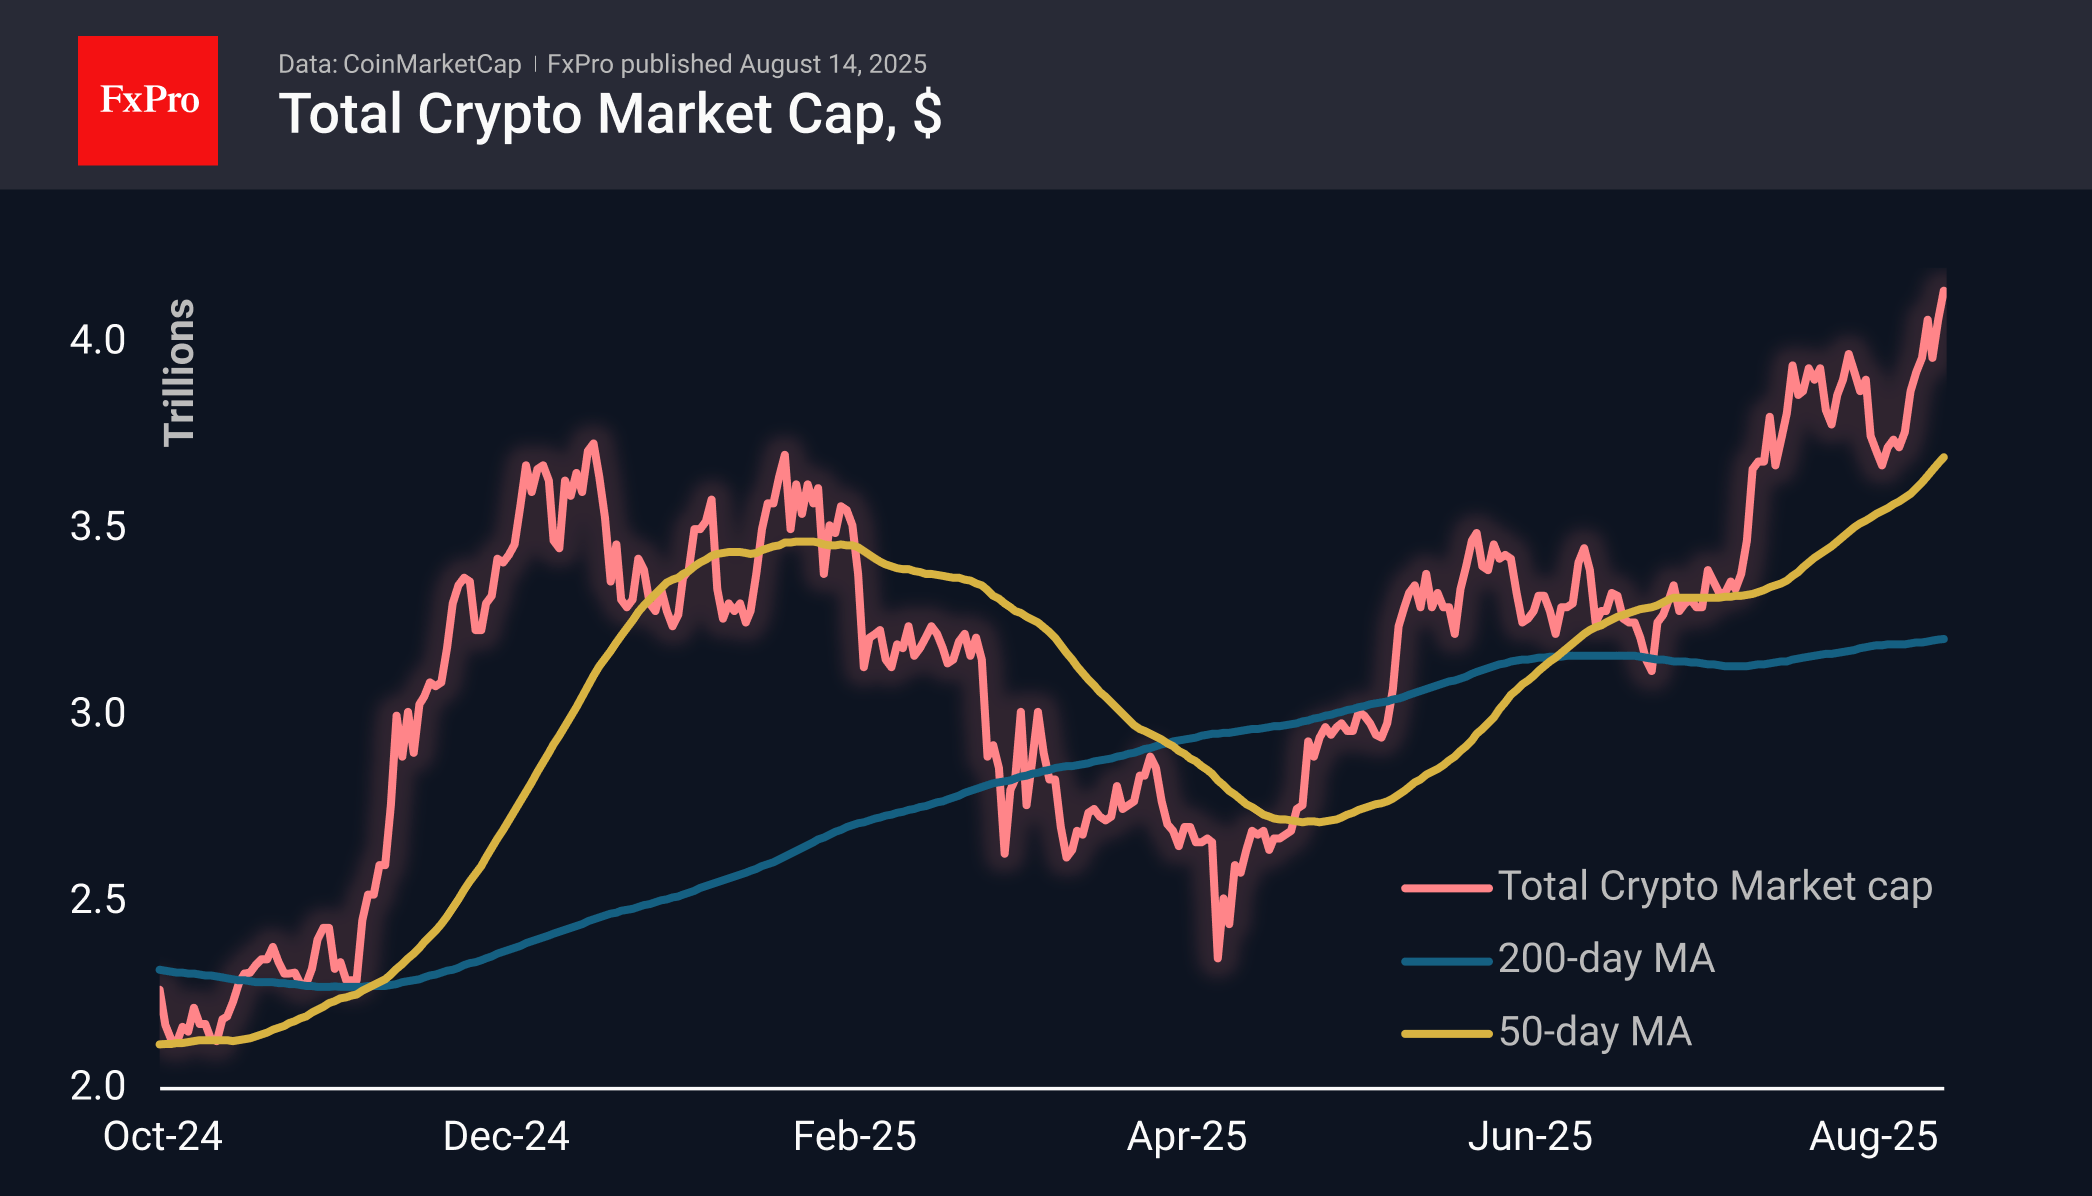
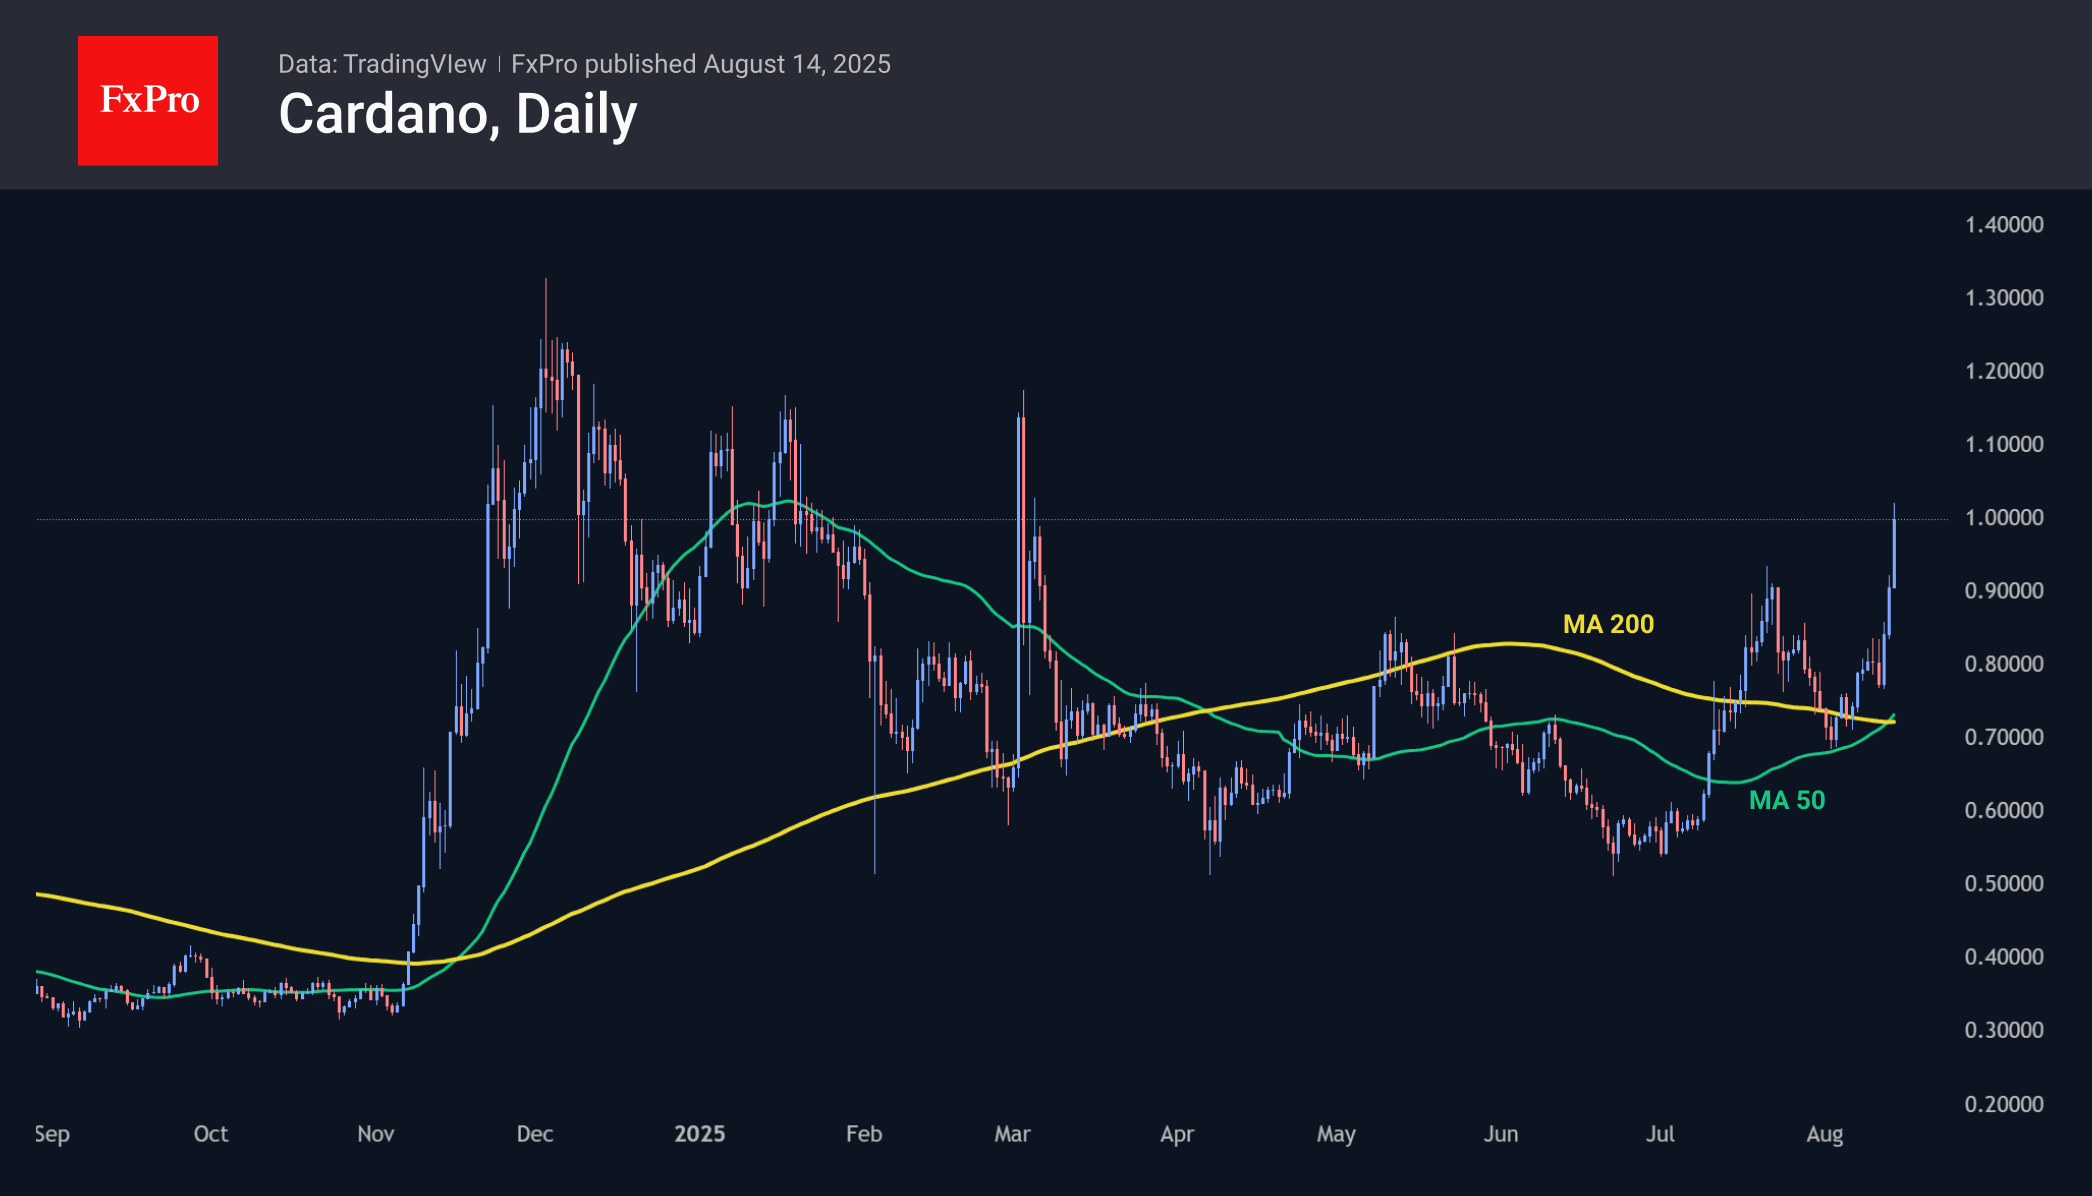
The crypto market cap rose to $4.20 trillion on Thursday morning before dropping back down somewhat to $4.14 trillion. But even with the correction, the daily gain is close to 2%, led by Bitcoin’s slide to a new peak of $124.5K. Among the major coins, Cardano (+18%), Near Protocol (+6.2%) and Trump (+5.9%) were the leaders.
The sentiment index rose to 75, ready to move into the extreme greed zone. It was previously held at this level throughout the second half of July, but the entire crypto market was in a range at that time.
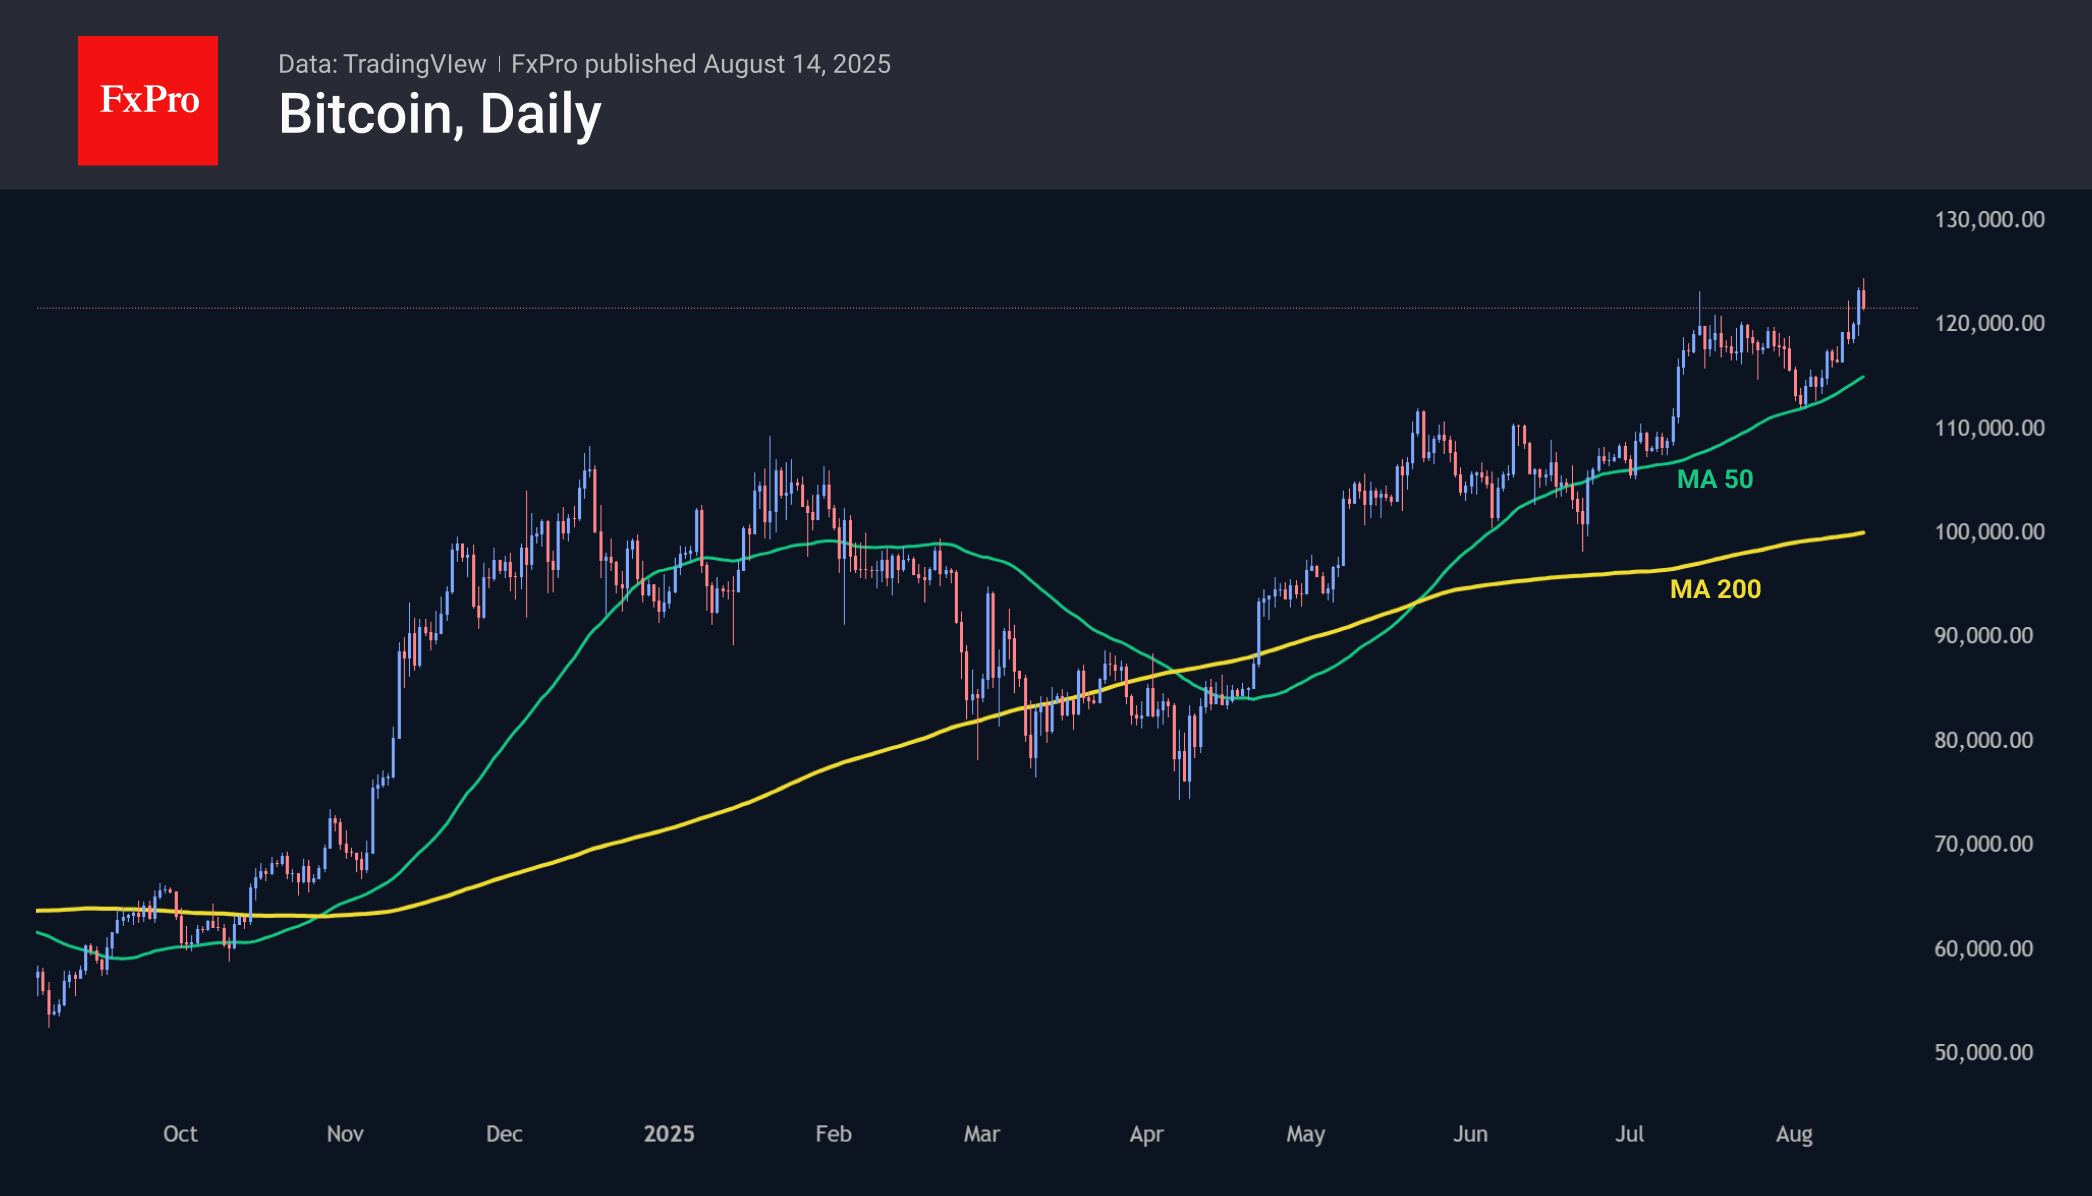
Bitcoin gained steadily throughout Wednesday, gliding to a new all-time high of $124.5k in thin early trading in Asia on Thursday, but falling back below $122K at the time of writing. Buyers intensified their push on the back of positive sentiment in global markets, where many key indices were updating their all-time highs.
Among the top altcoins, Cardano stood out over the past day. Its price exceeded $1, last seen in early March, and its growth today is about 15%, almost doubling the price from its lows in early July. The bullish breakout is supported by the formation of a ‘Golden Cross’, when the 50-day moving average tops the 200-day MA. Such technical signals work very well on relatively small financial instruments. The potential target for the bulls now looks like the $1.15 area — the resistance area for this year.
News Background
CryptoQuant notes a surge in network activity — the daily transaction volume on the Ethereum network reached a record high of nearly 1.875 million.
On Wednesday, Ethereum exceeded $4,700 for the first time since November 2021 and is aiming for historic highs above $4,800. Polymarket users estimate the probability of the altcoin reaching $5,000 by the end of August to be 71%.
Standard Chartered has raised its forecasts for Ethereum. By the end of the year, ETH could rise to $7,500 and reach $25,000 by 2028. Since June, corporate treasuries and ETFs have accumulated 3.8% of Ethereum’s market supply. Another important event for ETH was the signing of the US GENIUS Act in July, establishing federal rules for stablecoins.
Solana exceeded $200 for the first time since 23 July, despite potential profit-taking by major players. The Hong Kong crypto exchange OSL HK launched Solana trading for retail investors. At the same time, public companies continue to accumulate SOL. For example, DeFi Development Corp. (DDC) reported owning 1.3 million SOL worth about $250 million.
Australian Dollar Retreats from August Highs
This week, forex traders’ attention is firmly on the AUD/USD market following key news releases from Australia:
→ Tuesday: Interest rate decision. According to ForexFactory, analysts’ forecasts were confirmed as the Reserve Bank of Australia (RBA) cut the cash rate from 3.85% to 3.60%.
→ Today: Labour market statistics revealed that the unemployment rate fell from 4.3% to 4.2%.
This dynamic fundamental backdrop has driven a rich technical setup on the AUD/USD chart, where bearish sentiment currently prevails.
Technical Analysis of the AUD/USD Chart
Since last month, AUD/USD price movements have been forming a descending channel (highlighted in red), and this week’s reversal from the August high reinforces its relevance.
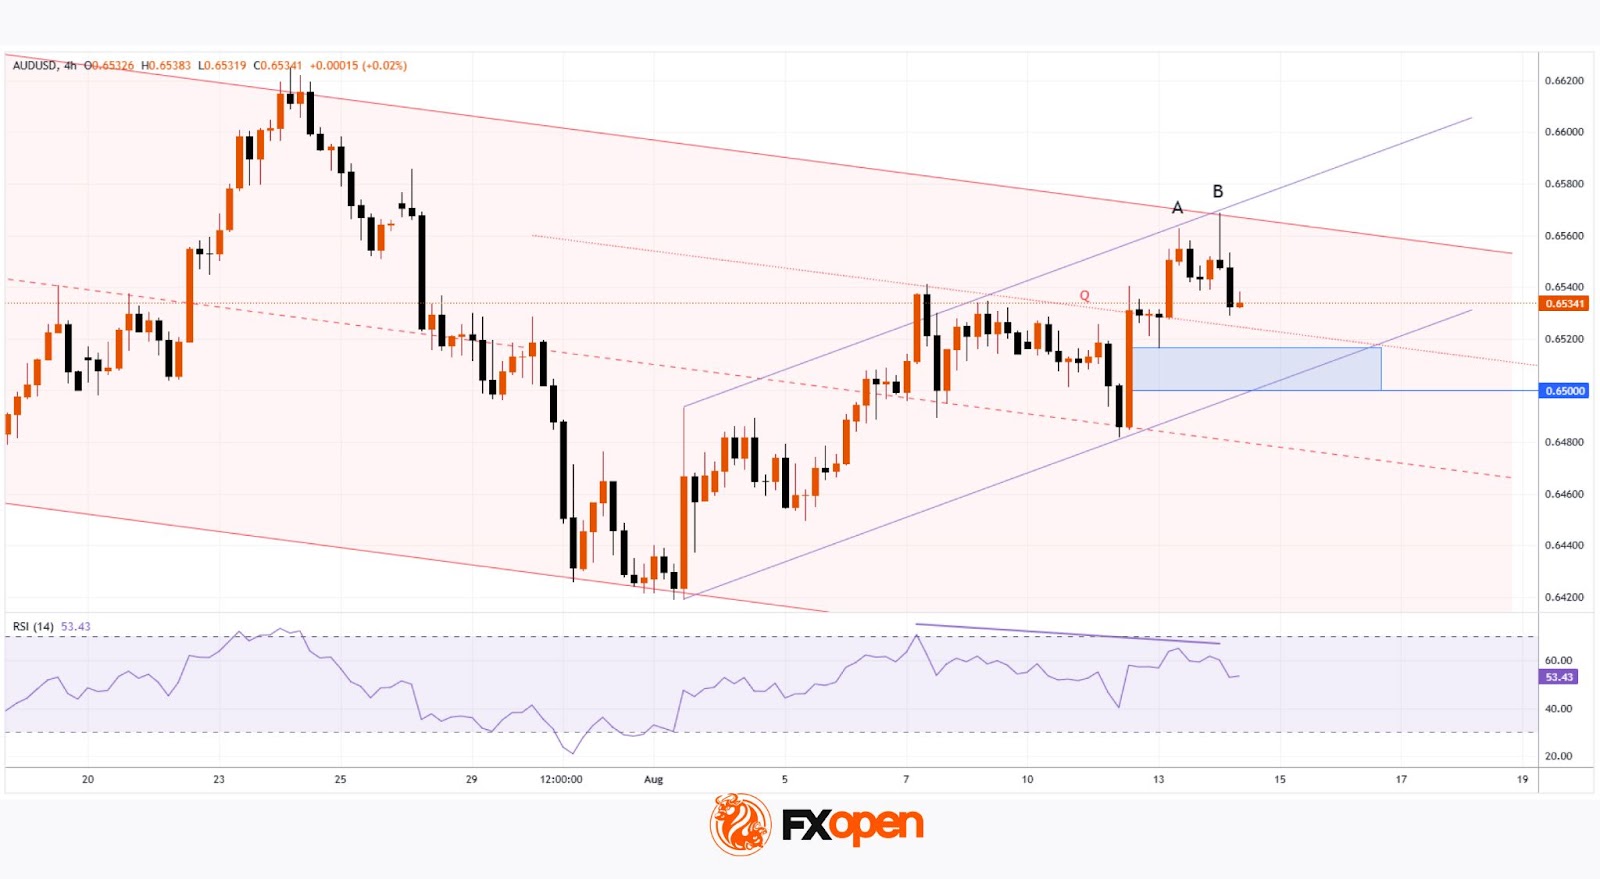
Key factors emphasising the market’s bearish bias include:
→ Double top pattern formed by recent highs A and B. Notably, the long upper wicks of the candlesticks reflect increasing selling pressure.
→ The August upward move, marked by purple trendlines, may represent a corrective bear flag within the dominant downtrend.
→ Bearish RSI divergence – present not only between highs A and B, but also relative to the 7 July peak.
Potential Support Levels:
→ Lower purple trendline;
→ Line Q, which divides the upper half of the channel into two quarters;
→ The 0.65 psychological level – previously defended strongly by bulls, as evidenced by the wide bullish candle on 12 August, when price surged easily (a sign of buying imbalance).
These supports collectively form a key demand zone (shaded in purple). Bears will need significant momentum to break through this area and extend the prevailing downtrend in AUD/USD through August 2025.
Trade over 50 forex markets 24 hours a day with FXOpen. Take advantage of low commissions, deep liquidity, and spreads from 0.0 pips. Open your FXOpen account now or learn more about trading forex with FXOpen.
This article represents the opinion of the Companies operating under the FXOpen brand only. It is not to be construed as an offer, solicitation, or recommendation with respect to products and services provided by the Companies operating under the FXOpen brand, nor is it to be considered financial advice.
Fed’s Daly: No case for 50bps urgent cut, dismisses ‘catch-up’ argument
San Francisco Fed President Mary Daly pushed back against the idea of a 50bps rate cut at the September FOMC meeting, a move strongly advocated earlier this week by Treasury Secretary Scott Bessent. In a Wall Street Journal interview, Daly said such a large cut would send an “urgency signal” that doesn’t match her view of the economy’s strength.
“I’m worried it would send an urgency signal that I don’t feel about the strength of the labor market,” she noted.
Daly stressed there’s no need to “catch up,” pointing to a still-solid job market. That's in contrast to Bessent's view that if the Fed had seen recent job market data sooner, it could have cut in June and July and now “needs to catch up.”
Eurozone industrial production falls -1.3% mom in June, broad weakness across sectors
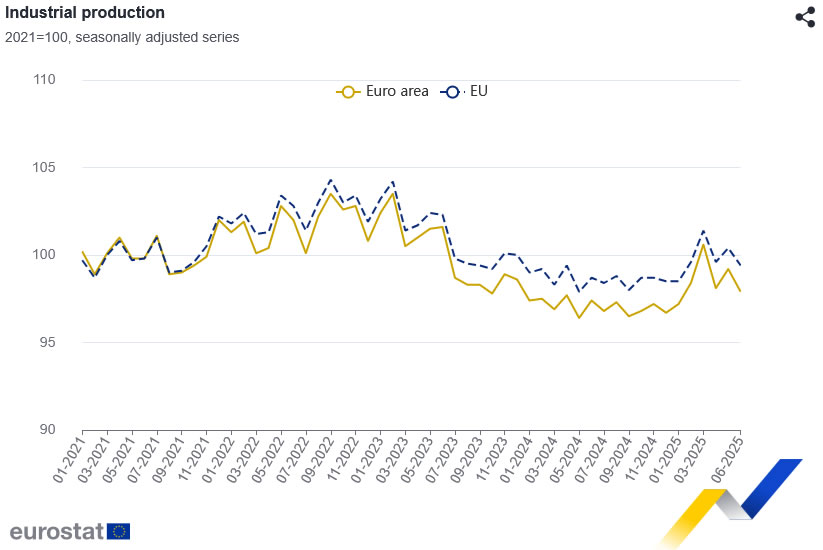
Eurozone industrial production fell sharply by -1.3% mom in June, missing expectations of a -0.8% mom drop. The breakdown showed a mixed picture, with energy output up 2.9% mom, but declines in other categories: intermediate goods -0.2% mom, capital goods -2.2% mom, durable consumer goods -0.6% mom, and a steep -4.7% mom fall in non-durable consumer goods.
Across the EU, output slipped -1.0% mom. The largest monthly declines came from Ireland (-11.3%), Portugal (-3.6%), and Lithuania (-2.8%). On the upside, Belgium (+5.1%), France (+3.8%), Sweden (+3.8%), and Greece (+3.3%) posted notable gains.
Technicals turn bullish on GBP/AUD after UK GDP
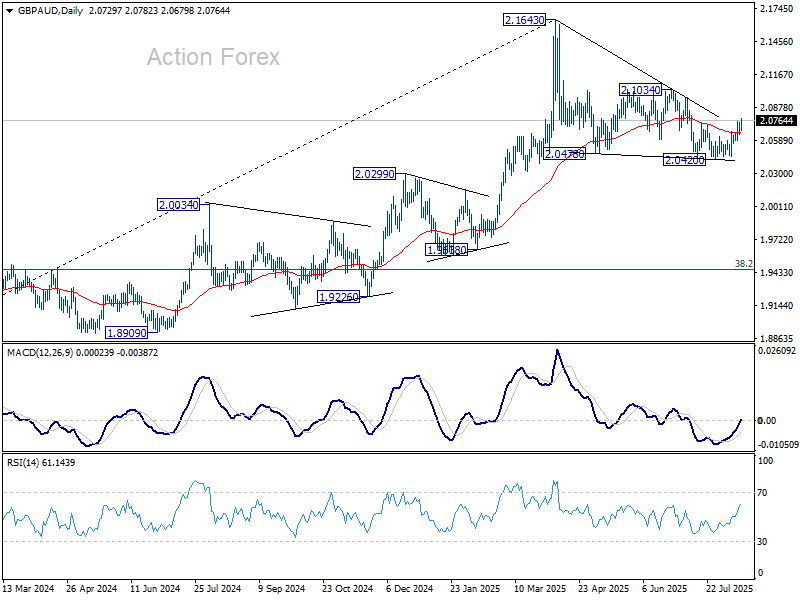
Sterling’s broad-based rally resumed today following stronger-than-expected Q2 GDP data, with gains seen across most counterparts except Yen. While the upbeat figures support the currency in the near term, some economists remain skeptical about the durability of the momentum. Part of June’s strong rebound is viewed as a catch-up in activity after the UK and US reached a trade deal limiting tariffs to just 10%.
Still, with this week’s labor market data showing wage growth remaining elevated despite some slowing, there is little urgency for the BoE to accelerate beyond its current pace of one cut per quarter. The combination of solid data and a measured policy approach continues to provide Sterling with a favorable backdrop.
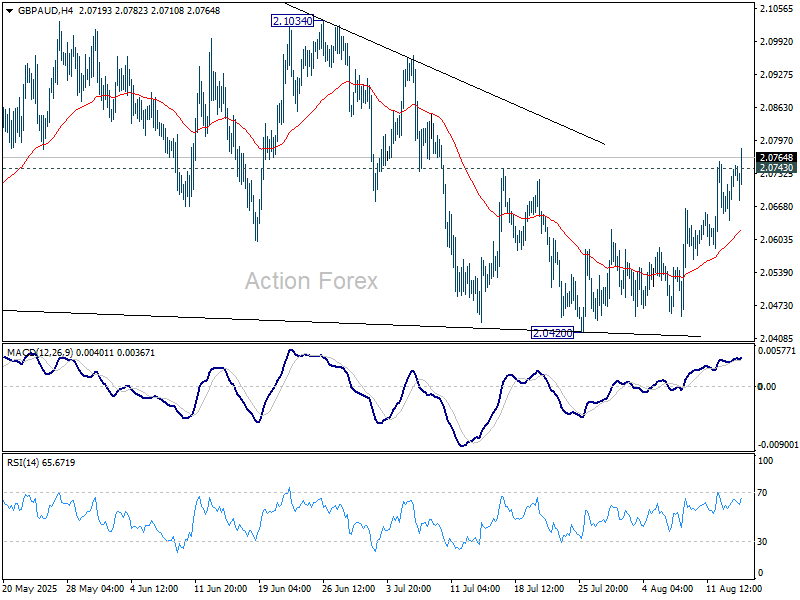
Technically, GBP/AUD is extending its rebound from 2.0420, with today’s break above 2.0743 confirming short-term bottoming. This also suggests the correction from 2.1643 high has completed after three waves down. Further gains are now in view towards 2.1034 resistance. Firm break there will likely pave the way for a retest and possible break of 2.1643 to resume the larger up trend.
Dollar Moderately Declines Amid Expectations of a Fed Rate Cut
The major dollar pairs, particularly USD/JPY and USD/CAD, remain under moderate pressure as market participants react to a softer US inflation backdrop and heightened expectations of a Federal Reserve rate cut at the upcoming meeting. Additional downward pressure on the greenback stems from US Treasury Secretary Scott Bessent’s remarks, in which he allowed for a 50 bps reduction as the opening move in a monetary easing cycle. Against this backdrop, the US currency is giving up part of its recent gains; however, its further trajectory will depend on incoming data.
Today’s focus is on US releases that could trigger heightened volatility and potentially lead to a breakout of key ranges: initial jobless claims and a batch of data on the headline and core Producer Price Index (PPI). Market reaction to these indicators could prove pivotal: signs of cooling price pressures and a weakening labour market may reinforce expectations for a deeper rate-cut trajectory, whereas strong readings could restore some support for the dollar.
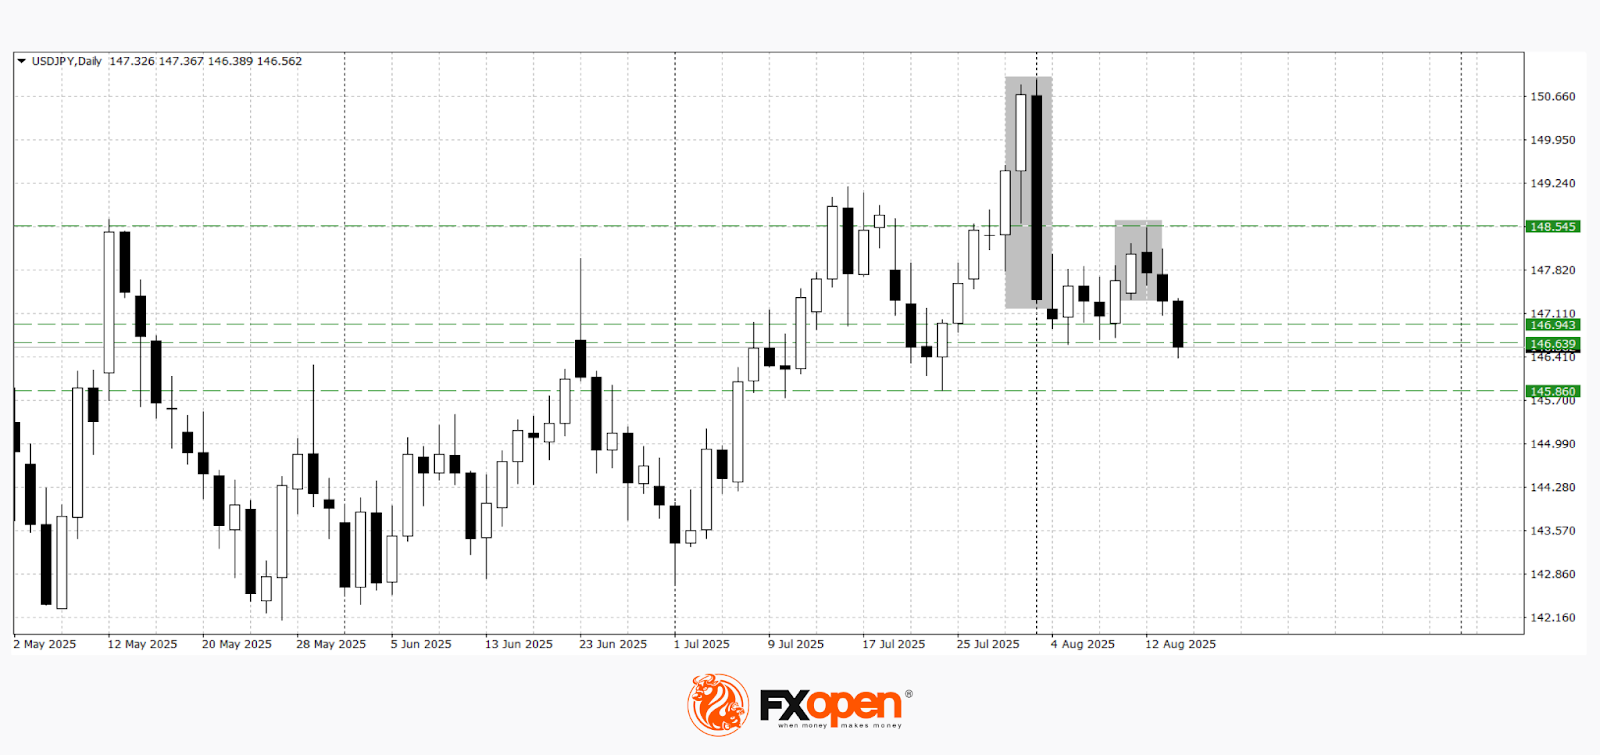
USD/JPY
Following a sharp rebound from 150.90 and the formation of a bearish engulfing reversal pattern, USD/JPY has been consolidating for the second consecutive week within the 146.60–148.60 range. Early this week, buyers attempted to break through resistance at the upper boundary of this range. Technical analysis suggests a possible test of 145.80–146.00, as the failed breakout attempt resulted in the formation of a dark cloud cover pattern. A sustained move above 147.00 could pave the way for a return to the upper boundary of the range.
Key events that may influence USD/JPY’s direction:
- Today, 15:30 (GMT+3): US Initial Jobless Claims
- Today, 15:30 (GMT+3): US Producer Price Index (PPI)
- Tomorrow, 02:50 (GMT+3): Japan GDP
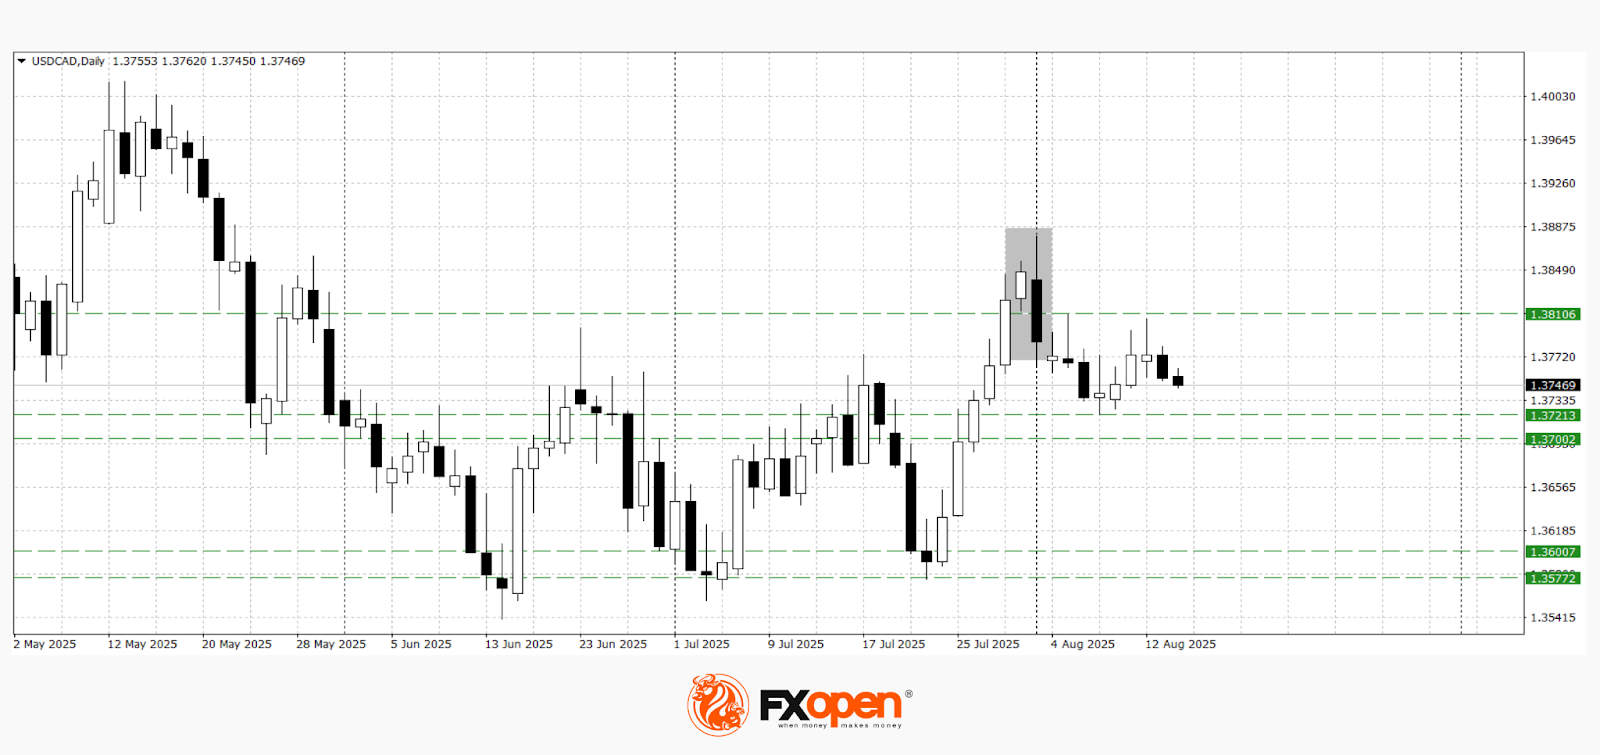
USD/CAD
After a two-week bullish run that stalled at 1.3880, USD/CAD is trading in a narrow 1.3720–1.3800 range. A break below the lower boundary could open the way for a test of the key 1.3700 support level. Conversely, a decisive close above 1.3800 could lead to a retest of the August high.
Key events that may influence USD/CAD’s direction:
- Today, 21:00 (GMT+3): Speech by FOMC member Thomas Barkin
- Tomorrow, 15:30 (GMT+3): US Core Retail Sales
- Tomorrow, 15:30 (GMT+3): Canada Wholesale Sales
Trade over 50 forex markets 24 hours a day with FXOpen. Take advantage of low commissions, deep liquidity, and spreads from 0.0 pips. Open your FXOpen account now or learn more about trading forex with FXOpen.
This article represents the opinion of the Companies operating under the FXOpen brand only. It is not to be construed as an offer, solicitation, or recommendation with respect to products and services provided by the Companies operating under the FXOpen brand, nor is it to be considered financial advice.