Sample Category Title
Dollar Index (DXY) at Risk of Freefall. Key Confluence Level In Play
The dollar dropped for the second day in a row on Wednesday. This came after U.S. inflation data raised hopes for a Federal Reserve rate cut next month, and President Donald Trump's push for lower rates added more pressure on the dollar.
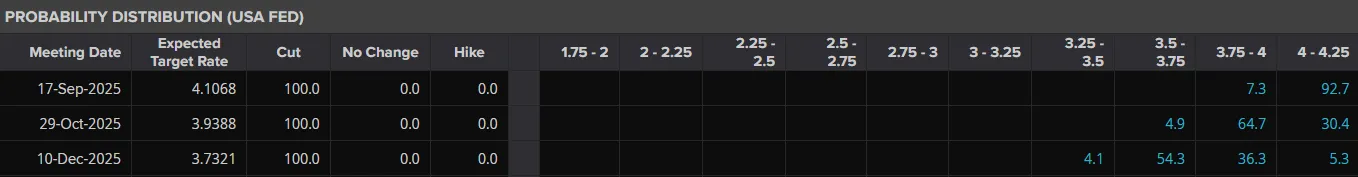
As a result the DXY is now trading at its lowest level since July 28, extending losses of 0.5% recorded after the US CPI report. At some point today markets had pricing at around 100% for a 25 bps rate cut at the September meeting, at the time of writing this is hovering around the 9-% mark.
Source: LSEG
Companies Bearing Costs of Tariffs…For Now
Following the inflation report yesterday, one thing has become clear. Sectors most affected by tariffs didn’t show major issues. Core goods, excluding autos, increased by 0.2% in July after a bigger 0.55% rise in June. This suggests that, for now, companies are mostly handling the extra tariff costs.
This was confirmed by US Treasury Secretary Scott Bessent today. In Bessent 's own words ‘Chinese exporters are likely to accept lower prices as US importers negotiate over who pays the tariffs. I also think that there are probably a lot of corporate margins that got very fat during Covid, and now we're seeing a return to a normal pre-Covid margin.’
The ISM price data shows there could still be some inflation risk from tariffs. However, yesterday's NFIB survey reveals that small businesses are finding it hard to pass these costs to customers, with fewer firms planning to raise prices in the next three months (down from 32% to 28%). While tariffs may eventually cause prices to rise, at this stage it does not appear like it will lead to long-term inflation pressures.
The concerns around tariffs were largely keeping rate cut expectations in check. Now we are seeing aggressive changes with rate cuts being priced in by market participants which is supporting a weaker US Dollar.
US PPI Data to Further Cement Rate Cut Expectations?
On Thursday, US core PPI inflation is expected to return to 3%, while core CPI inflation was confirmed at 3.1% earlier this week. These inflation rates are likely to increase in the coming months and could easily reach 4%.
Despite the outlook for CORE PPI data, this is unlikely to lead to significant changes on the rate cut expectations front. Markets appear to be more concerned with the state of the US jobs market than inflation at this stage. That is not to say that inflation is not a concern, but as mentioned above any uptick in inflation may likely prove short-lived.
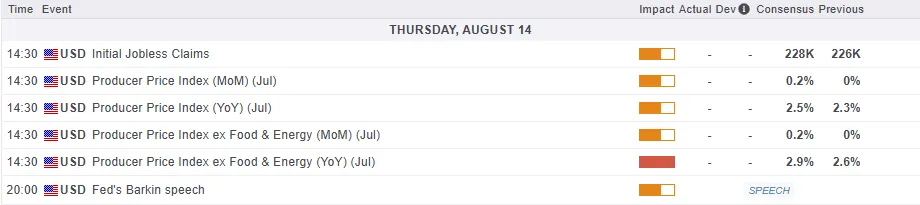
For all market-moving economic releases and events, see the MarketPulse Economic Calendar. (click to enlarge)
For now though, with rate cuts being touted by the Trump administration and the political narrative for such a move growing, the US Dollar outlook does not look positive. Markets are already concerned about the Fed independence, coupled with the significant job data downgrades, integrity of the data moving forward will also play a role.
Technical Analysis - US Dollar Index (DXY)
The US Dollar index however, is showing some mixed signals of late despite growing signs that fundamental factors are likely to remain bearish moving forward.
As things stand, the bullish move which began from July 1 low at 96.37 remains intact.
The DXY is currently testing a trendline which began from the July 1 low lows, with a higher low printed on July 24 now holding the key.
I have drawn in an ascending trendline which is currently being tested with a break below this and a daily candle close below the higher low at 97.10 likely leading to further declines for the DXY.
If the trendline holds then the longer term descending trendline may come back into play before the previous swing high at 100.25 comes back into focus.
Either way, this current test of the trendline and the higher low from July 24 could be a make or break moment for the US Dollar in the short to medium-term.
US Dollar Index (DXY) Daily Chart, August 13, 2025
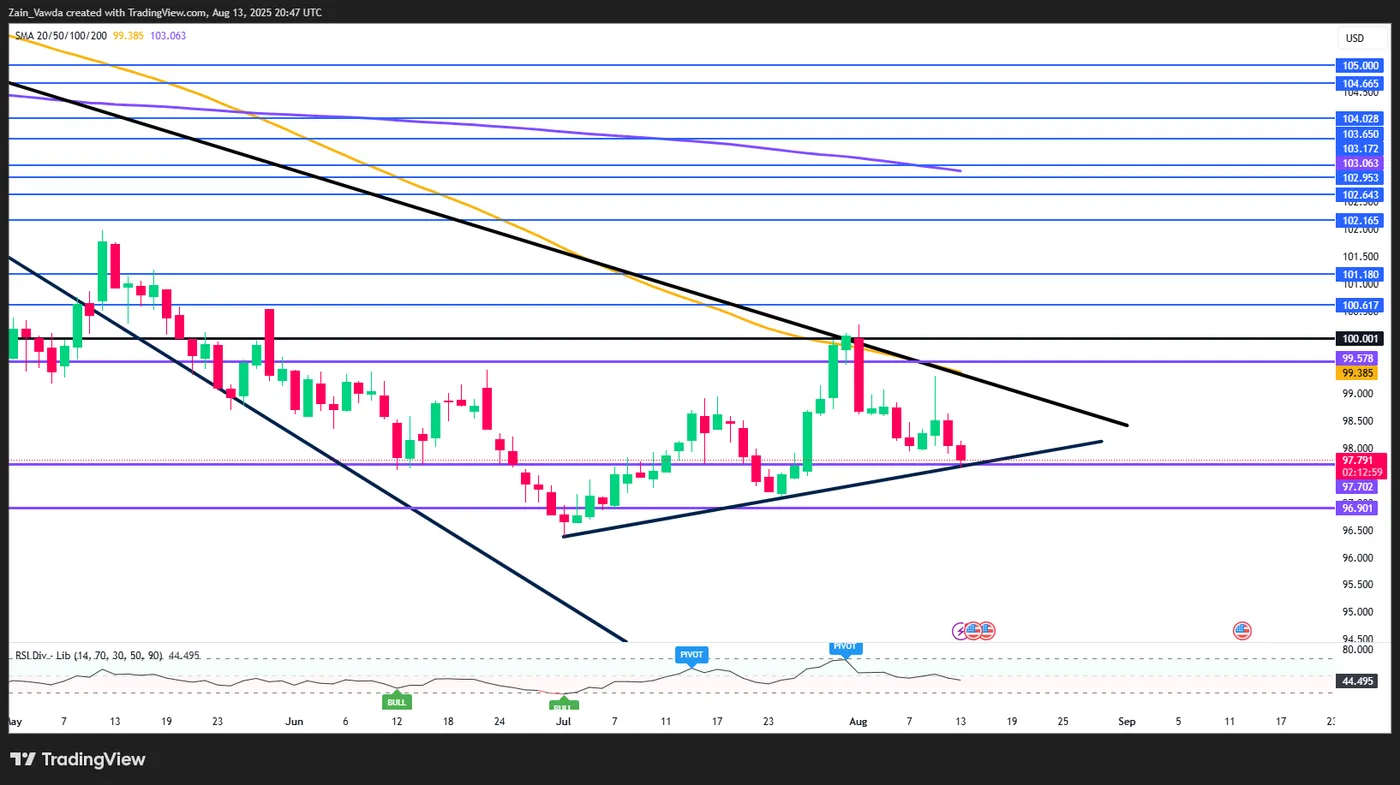
Source:TradingView.com
S&P 500 Wave Analysis
S&P 500: ⬆️ Buy
- S&P 500 broke key resistance level 6435.00
- Likely to rise to resistance level 6600.00
S&P 500 index recently broke above the key resistance level 6435.00, which stopped the previous intermediate impulse wave (3) in July.
The breakout of the resistance level 6435.00 continues the active intermediate impulse wave (5) from the start of August.
Given the overriding daily uptrend, S&P 500 index can be expected to rise to the next resistance level 6600.00, coinciding with the daily up channel from May.
Ethereum About $200 from All-Time Highs
Ethereum had been the missing piece in this all-around digital assets rally – The first run to $100,000 for Bitcoin had isolated the largest crypto at top, leaving Crypto aficionados on the waiting lines.
On the other hand, when Ethereum shines, the whole altcoin Market follows: with Ethereum just crossing above $4,700 (!!!), Solana is back to $200, BNB is now worth more than Nike and XRP is also just $0.40. from its ATH.
Simple reminder that ETH was trading between $1,300 to $1,800 for a two-week period after Liberation Day (in April 2025) – While the US Indices like the Nasdaq are up 46% (still impressive to say the least), Ethereum is currently up 234% since its lows.
One of the lessons of the story is to not forget the top assets of any asset class when Markets get scared – This is where the best bargains are made.
On the other hand, it may also happen that as an investor, you catch a falling knife that never recovers – But luckily for Ethereum, that is far from the case.
Crypto traders had seen Solana outperform due to its cheaper and efficient blockchain throughout the end of 2024, but since, Ethereum still shined from its nº2 status particularly as its ETFs started to be launched.
Let's take a look at Ether's technical analysis, starting from higher timeframes to spot where we are.
Ethereum Weekly Chart
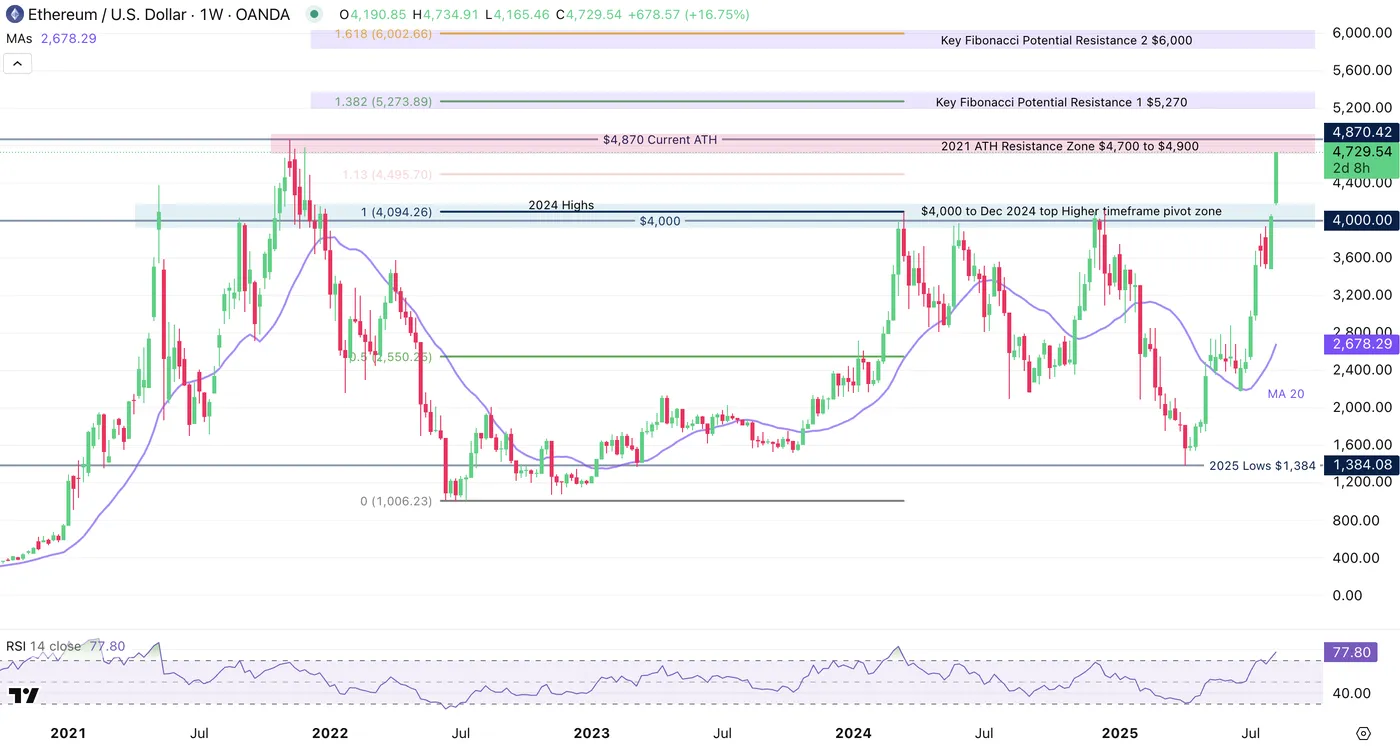
ETH Weekly chart, August 13, 2025 – Source: TradingView
On this chart spanning all the way to the 2021 Bull Cycle, we see how close current trading is from the ETH all-time highs.
Momentum is ridiculously strong, with prices on their way to overbought on the Weekly timeframe – Overbought doesn't mean top by the way – if you look at Equity markets for example: Markets can keep rallying for a while before they see a correction.
The current weekly candle is blasting through the $4,000 level, leaving the previous all-time high resistance zone acting as lone hurdle to new highs.
Some profit-taking may happen around previous ATHs, nevertheless, except for anything major happening, it is rare to see such price action top in an instant.
Looking at a Fibonacci extension of the 2024 move higher, we look at $5,200 and $6,000 being some potential key levels of interest in the event of new highs.
ETH Daily Chart
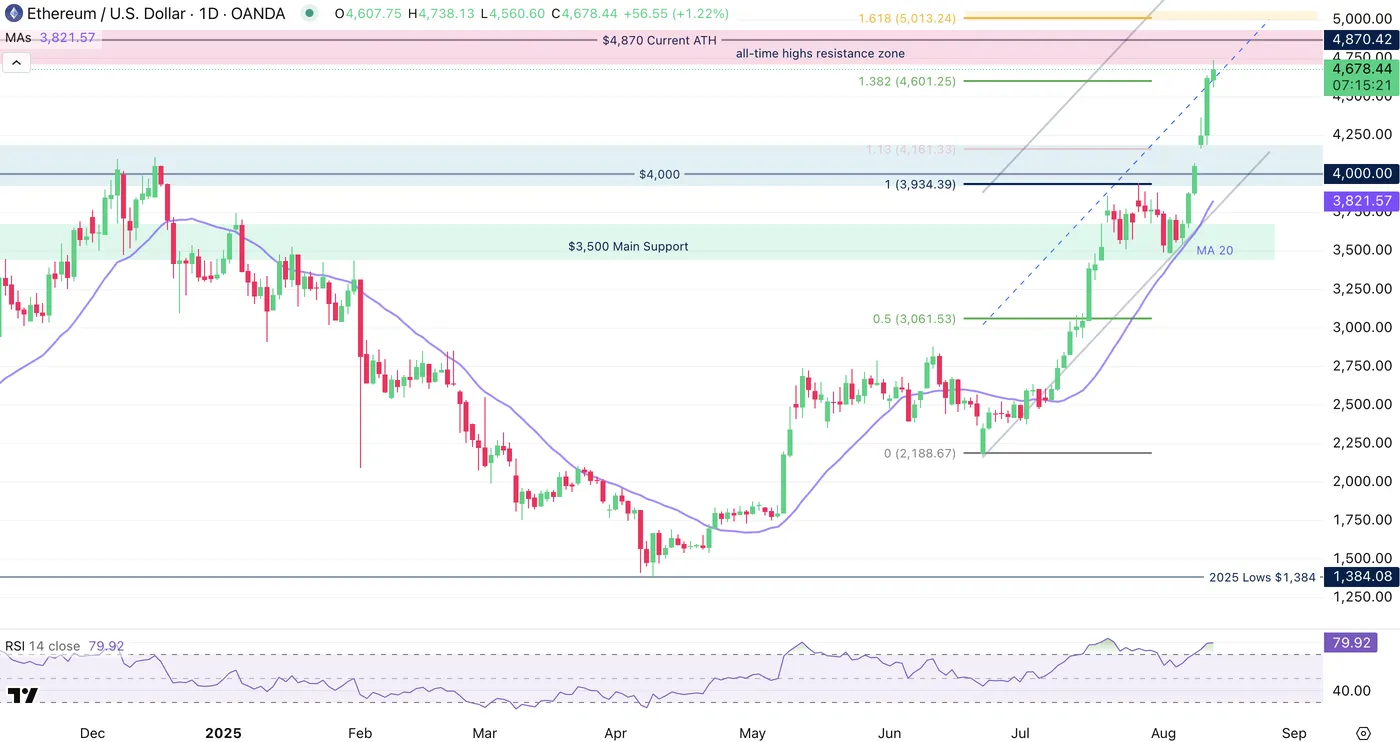
ETH Daily chart, August 13, 2025 – Source: TradingView
Looking closer doesn't help much to see many hurdles to the ongoing squeeze in Ethereum.
It seems that players really had left ETH on the sidelines too much and are now rushing to get their piece.
Explosive moves can see explosive tops, but except for a divergence potentially forming, sellers are for now nonexistent.
It will be essential to track the trading towards the 2021 All-time highs to see how markets react, time will tell when we get there.
ETH 4H Chart
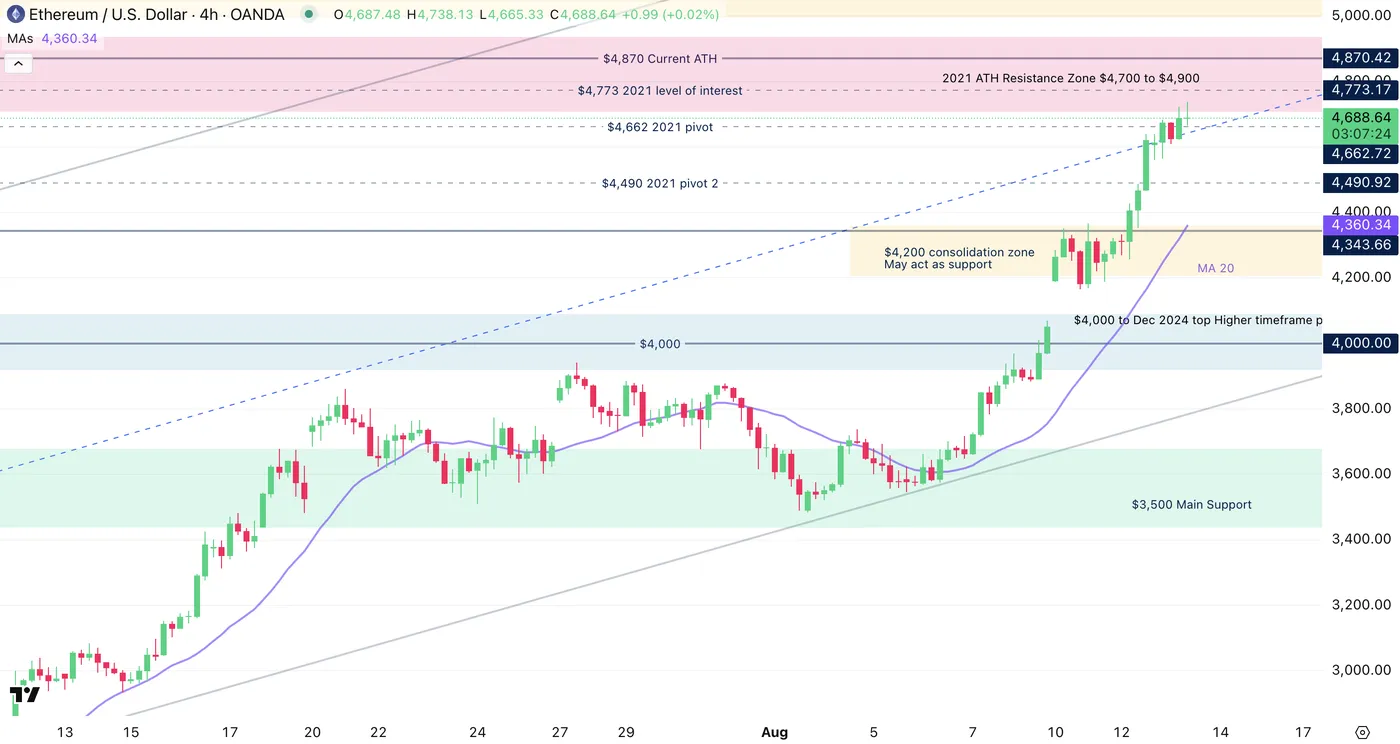
ETH 4H Chart, August 13, 2025 – Source: TradingView
Looking even closer, we spot a few levels of interest where markets could see some reaction.
there is some small ongoing selling at 2021 levels of interest (look at the dotted lines on the chart) but for now it is nothing major.
Sentiment is more than euphoric, but this may keep on going for a while before it cools down.
Levels of interest for ETH trading:
Support Levels:
- $3,500 Support Zone
- $4,000 Main Pivot
- $4,200 consolidation Zone
Resistance Levels:
- $4,772 2021 intermediate top
- $4,700 to $4,900 All-time high resistance zone
- $4,870 2021 record.
Safe Trades!
Sunset Market Commentary
Markets
Today’s empty eco calendar set the stage for media to contemplate on yesterday’s themes. The moderate July inflation report, without clear signs of tariff-related price pressure, Trump’s latest rant against Fed Chair Powell and the crazy idea to replace monthly US payrolls reports with a quarterly report until the figures all more moderate all passed the stage. Luckily, there was an interview with US Treasury Secretary Bessent on Bloomberg to break the summer lull. Bessent reiterated yesterday’s call that the Fed should deliver a 50 bps rate cut when it meets next in September. First because there’s no evidence of significant inflation coming from the protectionist hawkish US trade policy. Second because Bessent believes that the Fed would have already acted in June and/or July if the (payrolls) data were accurate at the time. Recall that the May and June numbers faced a combined downward revision of 258k at the July payrolls release. Bessent believes that the Fed should enter a series of rate cuts which brings the Fed rate 150-175 bps below current levels. While we don’t side with the total magnitude of policy easing, we do side with the argument that once the Fed engages in additional rate cuts, they should/could opt for a bigger start. The Powell Fed has a history of waiting until they are absolutely convinced about something and then opting to move quickly. They did so during the tightening cycle, battling inflation, and they did so a year ago when there were signs of a sudden cooling of the US labour market and economy. In this respect, it’s telling that US money markets in the wake of the Bessent interview for the first time discounted (marginally) more than a 25 bps rate cut in September. We’d err on the side of this positioning the be extended if tomorrow’s (producer price inflation, weekly jobless claims) or Friday’s (retail sales, empire manufacturing survey, University of Michigan consumer confidence) shows signs of weakness. An outperformance at the front end of the US Treasury curve can in such scenario push EUR/USD for a test of the YTD top at 1.1829. Looking forward to next week, Fed Chair Powell addresses the annual Kansas City Fed symposium in Jackson Hole, a venue which in the past served as platform for Fed leaders to prepare for important near term policy terms.
News & Views
The International Energy Agency (IEA) in its monthly Oil Market Report projects global oil demand to increase by 680 kb/d this year and by 700 kb/d in 2026 to reach 104.4 mb/d. Global oil demand growth for 2025 has been repeatedly downgraded since the start of the year, by a combined 350 kb/d. Consumption in emerging and developing economies has been weaker than expected. Aviation has been an exception, with robust summer travel propelling jet fuel demand to all-time highs in both the US and Europe. The demand forecast compare with yesterday bullish OPEC outlook of 1.3 mb/day oil demand growth this year and 1.4 mb/day next year. Global oil supply growth has been revised up by 370 kb/d to 2.5 mb/d this year and by 620 kb/d to 1.9 mb/d in 2026, after the eight OPEC+ members subject to voluntary output reductions agreed to raise production by another 547 kb/d in September, fully unwinding the 2.2 mb/d cuts agreed to in November 2023 since April. While oil market balances look ever more bloated as forecast supply far eclipses demand towards year-end and in 2026, additional sanctions on Russia and Iran may curb supplies from the world’s third and fifth largest producers.
Preliminary data showed Polish GDP growing by 0.8% Q/Q in the second quarter, to be 3.4% higher on an annual basis. Details will be published on September 1st. The Polish government expect 2025 GDP growth to be 3.4%. Polish markets didn’t react with EUR/PLN locked in a tight 4.25-4.30 range since mid-April. The Polish economy outperforms local peers like Czech Republic or Hungary who reported figures earlier. The Czech economy grew by 0.2% Q/Q and 2.4% Y/Y with Hungarian GDP numbers coming in at 0.4% Q/Q and 0.1% Y/Y.
WTI Oil Triangle Break Leaves Oil Vulnerable to Selloff, Trump-Putin Meeting Ahead
Oil prices continued to edge lower this morning following a triangle breakout which could lead to a potential $12 move to the downside.
IEA Oil Market Report - August 2025
The International Energy Agency (IEA) announced on Wednesday that it expects oil supply to grow more this year but has reduced its forecast for demand because of weak fuel usage in major economies.
This comes a day after OPEC + released their monthly report yesterday. The OPEC + report saw the group raise its global oil demand forecast in a move that contradicts the IEA forecast today. Thesis is not a surprise as we have seen this diverging outlooks between the two organizations over the last few years.
The International Energy Agency (IEA) has updated its oil market forecasts with several key highlights. Global oil supply is now expected to increase by 2.5 million barrels per day (bpd) in 2025, higher than the previous forecast of a 2.1 million bpd rise, following the latest production hike by OPEC+. In August, global crude oil refining is projected to reach nearly a record high of 85.6 million bpd.
However, the IEA has slightly lowered its demand growth forecasts. The average oil demand growth for 2026 has been revised down to 700,000 bpd from the earlier estimate of 720,000 bpd. Similarly, the 2025 oil demand growth forecast has been trimmed to 680,000 bpd, compared to the previous projection of 700,000 bpd.
Trump-Putin Meeting to Serve as a Catalyst?
The White House said Tuesday that Friday’s Alaska meeting between US President Donald Trump and Russian President Vladimir Putin is meant to be a "listening session" for the president, lowering hopes for a quick Russia-Ukraine ceasefire agreement.
Market participants are already eyeing positive developments from the meeting but either way the meeting could be a catalyst for Oil prices.
Key challenges remain before the talks. Trump has suggested that both sides may need to give up land to end the three-and-a-half-year conflict. A resolution could ease some of the sanction concerns affecting the market. Meanwhile, oil prices have fallen, even though US inflation data yesterday strengthened expectations that the Federal Reserve will cut interest rates in September.
Looking Ahead
Oil prices are edging lower ahead of the Trump-Putin meeting which could dominate Oil price moves the rest of this week.
Risk-On sentiment has returned and yet Oil prices continue to struggle. Later in the day we will get another look at inventories data after API numbers were released yesterday.
![]()
For all market-moving economic releases and events, see the MarketPulse Economic Calendar. (click to enlarge)
Technical Analysis - WTI
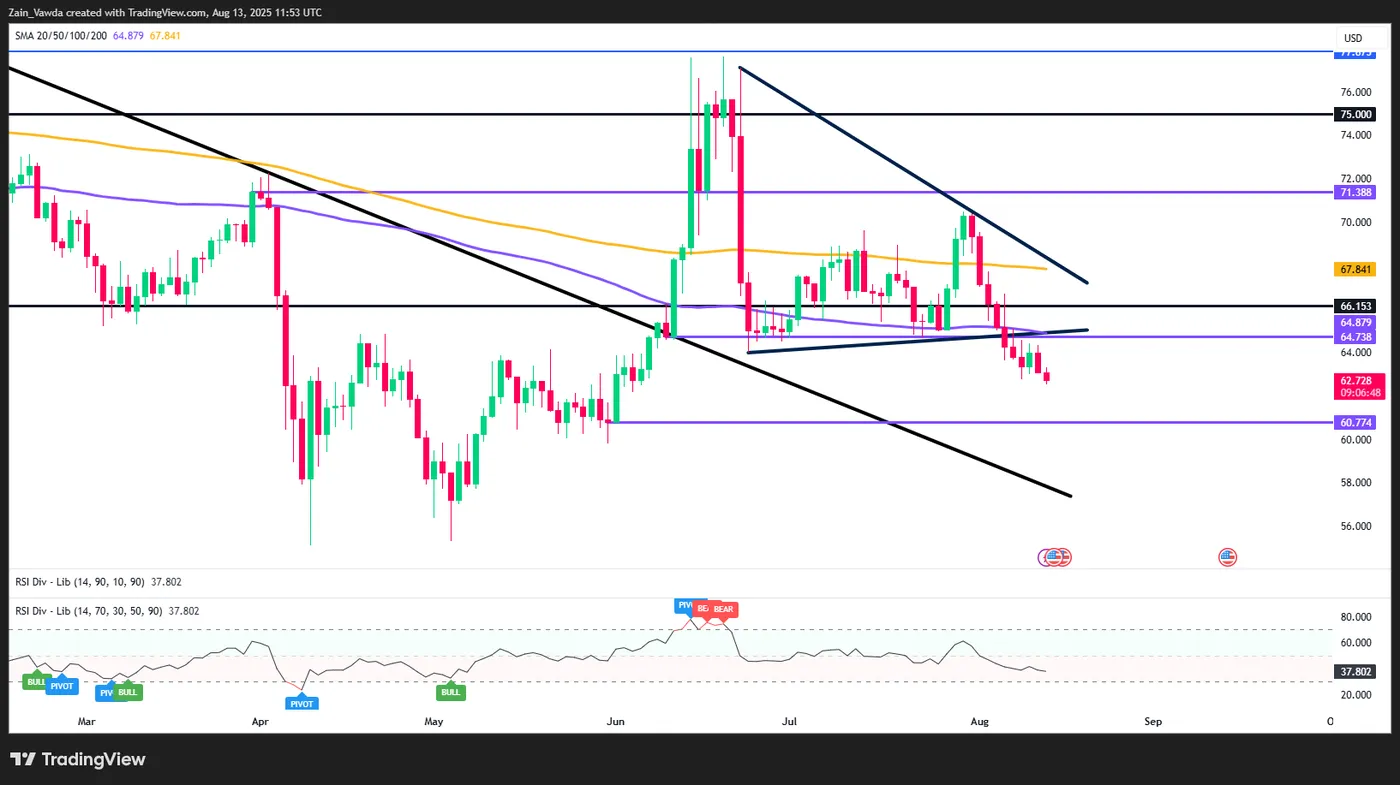
From a technical analysis standpoint, Oil has broken below the triangle pattern and the 200-day MA resting around the 64.73 handle.
The breakout could lead to a long term drop toward the $52 a barrel mark based on the technical setup in play.
The RSI period-14 has yet to enter oversold territory, which hints that further downside could materialize in the days ahead.
Immediate support rests at 60.77 before the psychological 60.00 handle comes into focus.
Looking at the upside, resistance rests at 64.00 before the confluence level around the 64.73 handle comes into focus. Acceptance above this level, a move beyond the 65.00 handle could come into play.
WTI Oil Daily Chart, August 13, 2025
Source: TradingView (click to enlarge)
EUR/USD Mid-Day Outlook
Daily Pivots: (S1) 1.1578; (P) 1.1628; (R1) 1.1665; More...
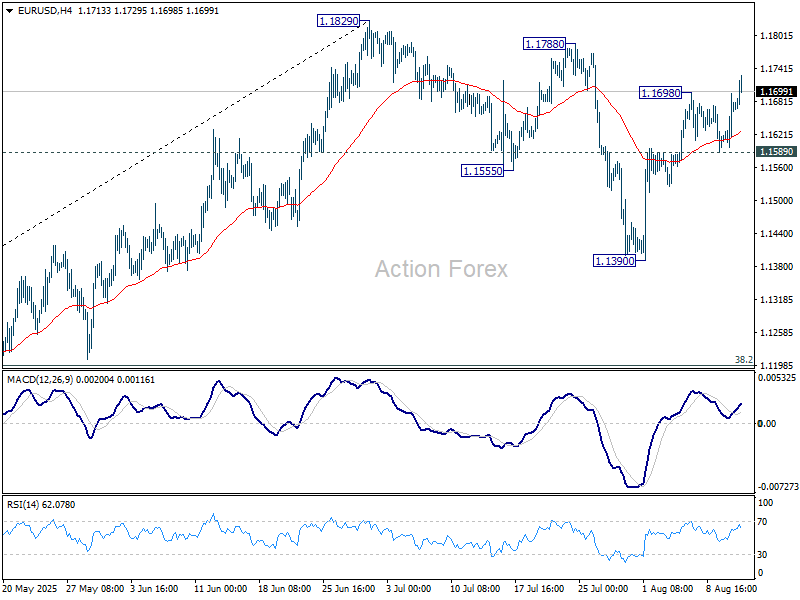
EUR/USD's rally from 1.1390 resumed by breaking through 1.1698 temporary top. Intraday bias is back on the upside for retesting 11829 high. Firm break there will resume larger up trend to 1.1916 projection level. On the downside, however, break of 1.1589 support will delay the bullish case and extend the corrective pattern from 1.1.829 with another falling leg.
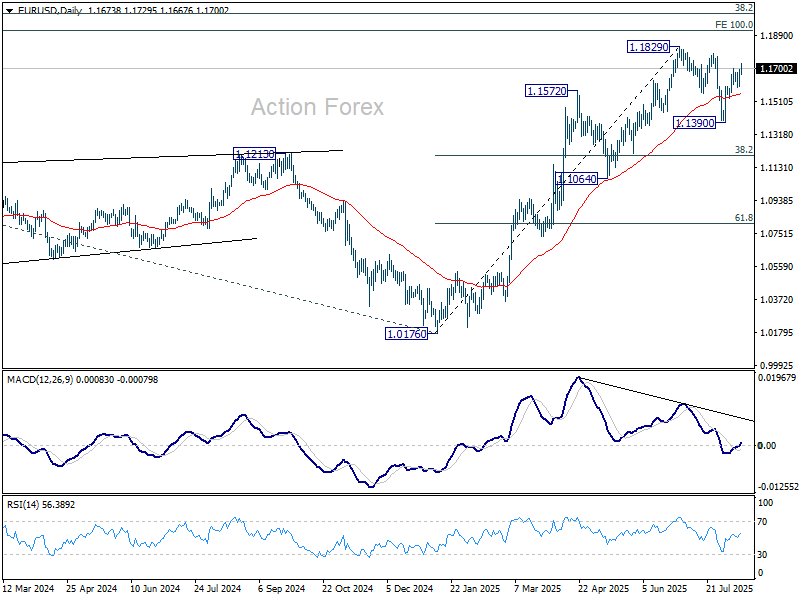
In the bigger picture, rise from 0.9534 long term bottom could be correcting the multi-decade downtrend or the start of a long term up trend. In either case, further rise should be seen to 100% projection of 0.9534 to 1.1274 from 1.0176 at 1.1916. This will remain the favored case as long as 1.1604 support holds.
USD/CHF Mid-Day Outlook
Daily Pivots: (S1) 0.8042; (P) 0.8085; (R1) 0.8107; More….
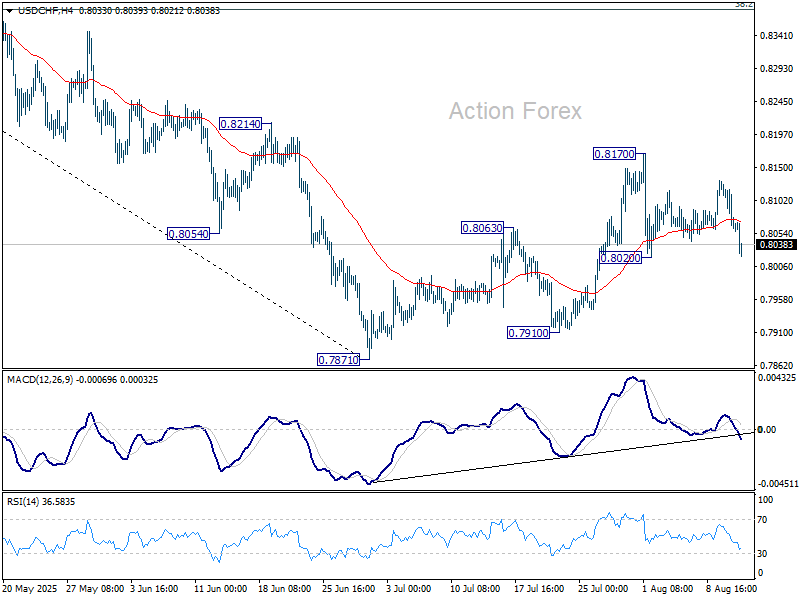
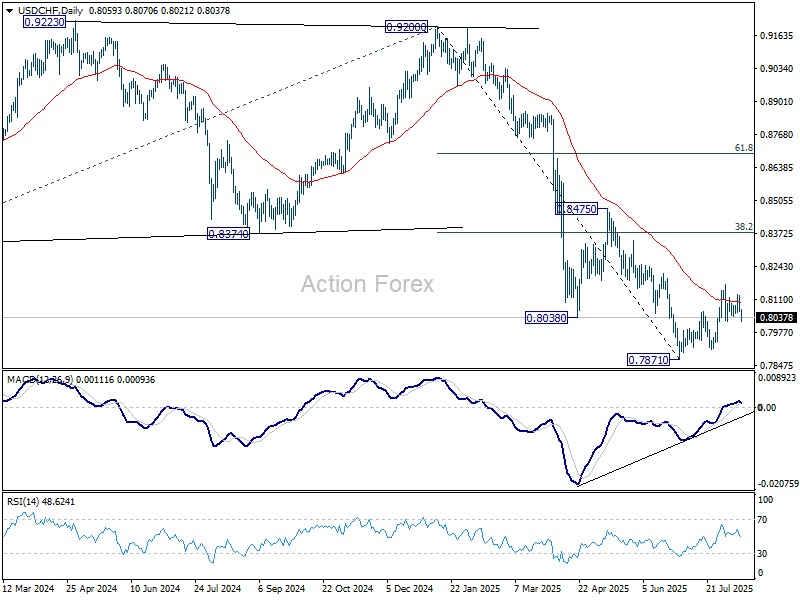
USD/CHF dips notably today but stays in range of 0.8020/8170 and intraday bias remains neutral. On the downside, break of 0.8020 will revive that case that the corrective pattern from 0.7871 has completed, and target a retest on 0.7871 low. On the upside, firm break of 0.8710 will resume the corrective from 0.7871. Intraday bias will be back on the upside for 38.2% retracement of 0.9200 to 0.7871 at 0.8379.
In the bigger picture, long term down trend from 1.0342 (2017 high) is still in progress. Next target is 100% projection of 1.0146 (2022 high) to 0.8332 from 0.9200 at 0.7382. In any case, outlook will stay bearish as long as 0.8475 resistance holds.
USD/JPY Mid-Day Outlook
Daily Pivots: (S1) 147.45; (P) 147.98; (R1) 148.39; More...
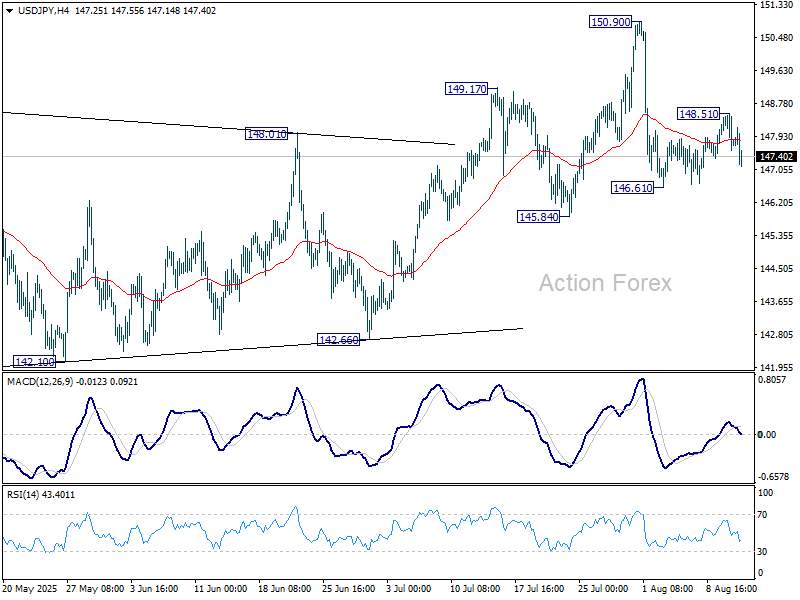
USD/JPY dips notably today but stays in range of 146.61/148.51 and intraday bias stays neutral. On the downside, below 146.61 will resume the fall from 150.90. Further break of 145.84 support will suggests that whole rebound from 139.87 has completed at 150.90, and turn outlook bearish. On the upside, though, above 148.51 will target a retest on 150.90 instead.
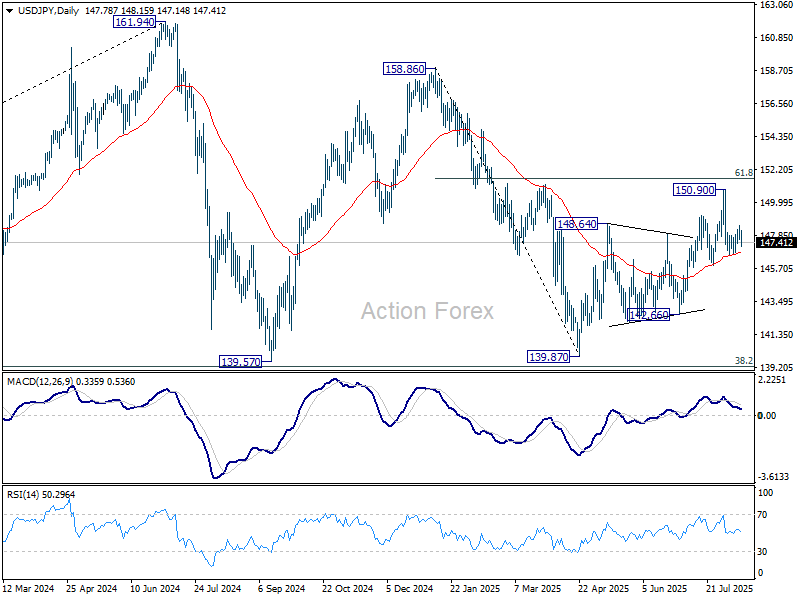
In the bigger picture, price actions from 161.94 (2024 high) are seen as a corrective pattern to rise from 102.58 (2021 low). Decisive break of 61.8% retracement of 158.86 to 139.87 at 151.22 will argue that it has already completed with three waves at 139.87. Larger up trend might then be ready to resume through 161.94 high. In case the corrective pattern extends with another fall, strong support is expected from 38.2% retracement of 102.58 to 161.94 at 139.26 to bring rebound.
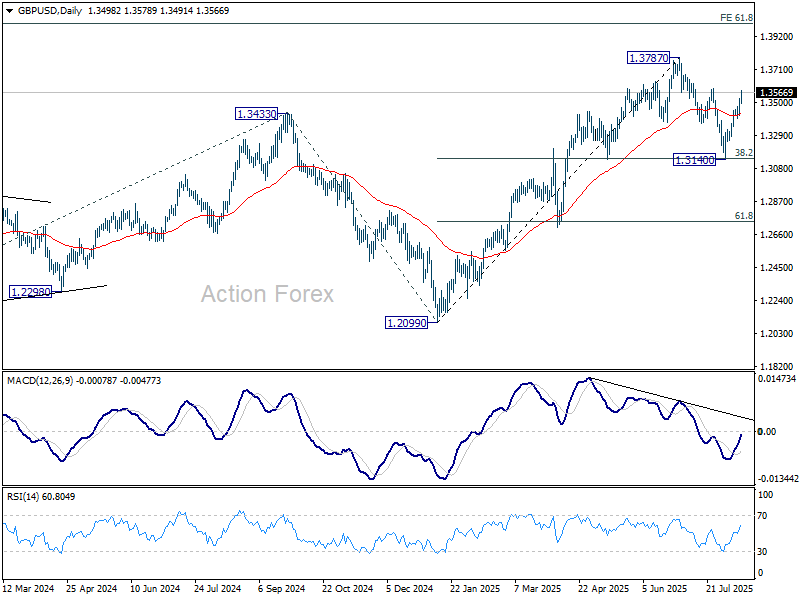
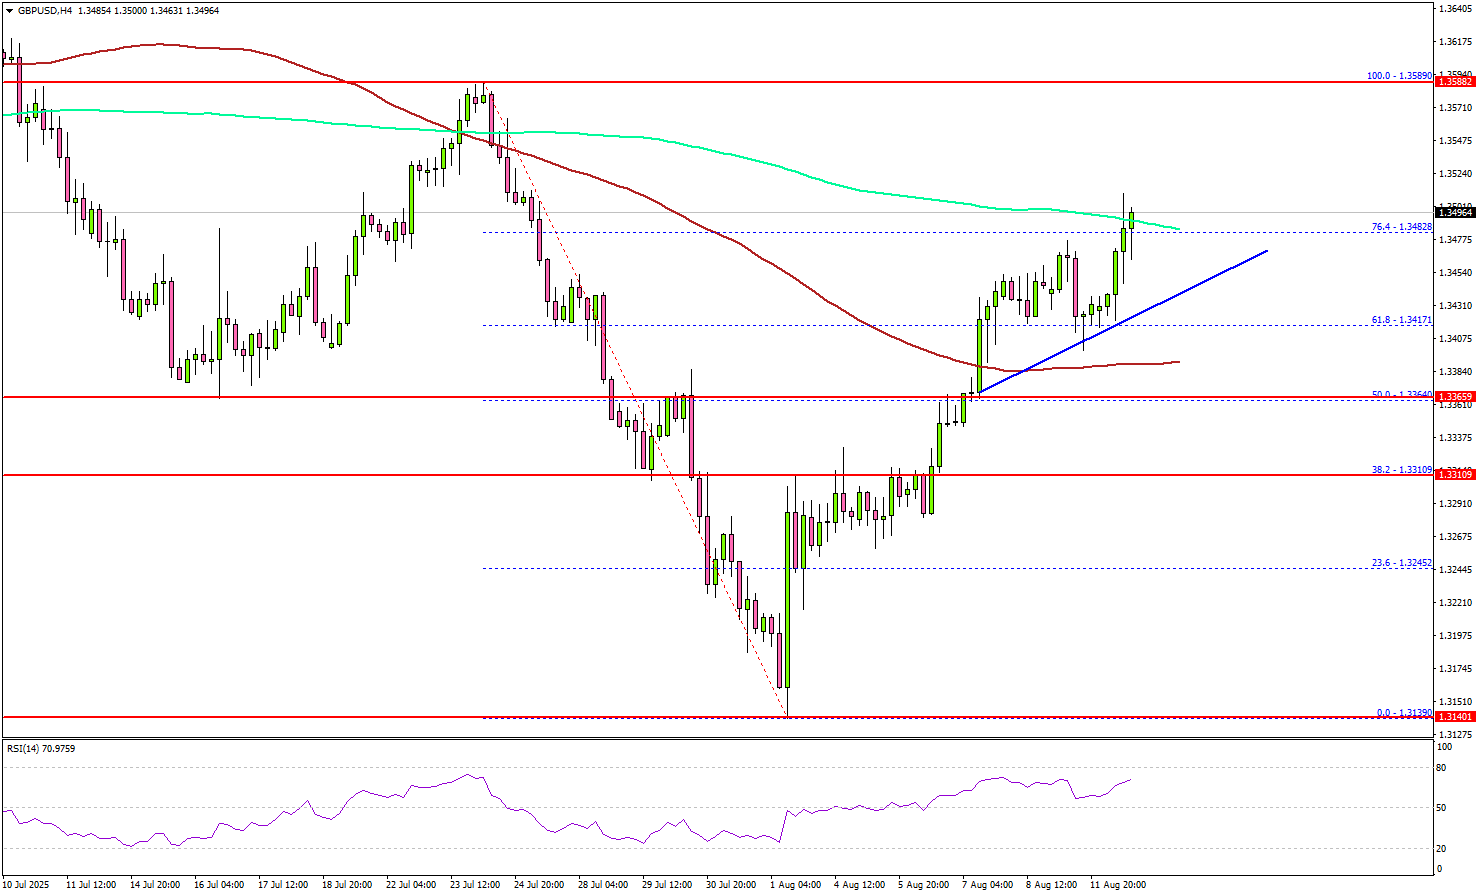
GBP/USD Mid-Day Outlook
Daily Pivots: (S1) 1.3438; (P) 1.3481; (R1) 1.3543; More...
GBP/USD's rally from 1.3140 re-accelerates higher today and intraday bias stays on the upside. Correction from 1.3787 should have completed with three waves down to 1.3140. Firm break of 1.3587 will bring retest of 1.3787 high. On the downside, below 1.3476 minor support will turn intraday bias neutral and bring consolidations first, before staging another rally.
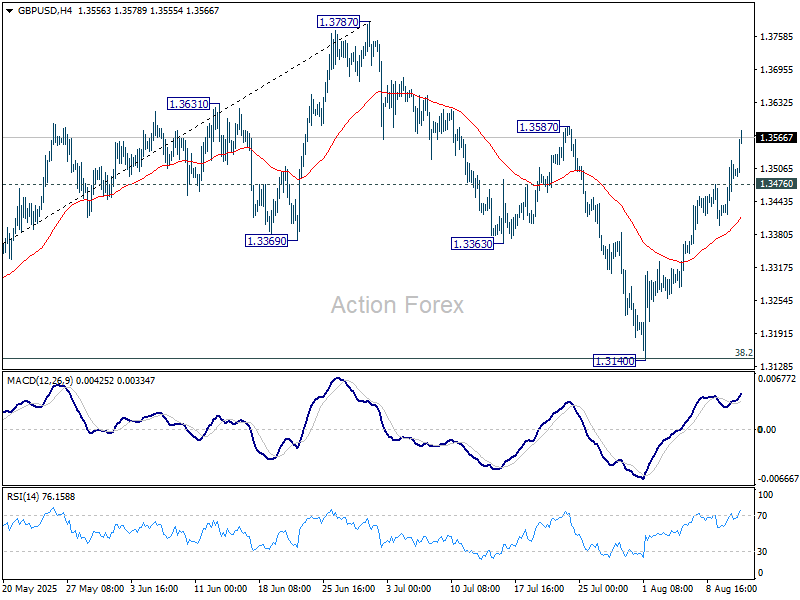
In the bigger picture, up trend from 1.3051 (2022 low) is in progress. Next medium term target is 61.8% projection of 1.0351 to 1.3433 from 1.2099 at 1.4004. Outlook will now stay bullish as long as 55 W EMA (now at 1.3068) holds, even in case of deep pullback.